arvo 2 annual meeting abstracts 338 functional imaging ... 338 functional imaging.pdfpathogenesis...
TRANSCRIPT

ARVO 2017 Annual Meeting Abstracts
These abstracts are licensed under a Creative Commons Attribution-NonCommercial-No Derivatives 4.0 International License. Go to http://iovs.arvojournals.org/ to access the versions of record.
338 Functional imagingTuesday, May 09, 2017 11:00 AM–12:45 PMExhibit/Poster Hall Poster SessionProgram #/Board # Range: 3098–3108/B0001–B0011Organizing Section: Multidisciplinary Ophthalmic Imaging Group
Program Number: 3098 Poster Board Number: B0001Presentation Time: 11:00 AM–12:45 PMFunctional ultrasound imaging maps the visual system in rodents with high spatial and temporal precisionsKévin BLAIZE1, Marc Gesnik2, Thomas Deffieux2, Jean-Luc Gennisson2, Jose A. Sahel1, mathias fink2, Mickaël Tanter2, Serge A. Picaud1. 1Institut de la vision, PARIS, France; 2Biomédical, Institut Langevin, PARIS, France.Purpose: The development of new innovative therapies implies to monitor activity in the whole visual brain system with high spatial and temporal resolutions. To increase the resolution obtained with fMRI, we investigated if the new functional imaging technique based on ultrasounds (US) can accurately map activity in the Visual Cortex (VC), Superior Colliculus (SC) and Lateral Geniculate Nucleus (LGN) in Long-Evans rats. As in fMRI, ultrasound imaging is based on Cerebral Blood Volume (CBV), a functional indicator correlated with the neuronal activity thanks to the neurovascular coupling.Methods: Long Evans rats aged from 7 to 9 weeks were anesthetized to generate a craniotomy. Animals were then placed in front of a screen to deliver visual stimuli while the ultrasound probe was approached 500μm above the brain. An echographic gel is inserted between the probe and the brain to ensure proper transmission of ultrasounds. Our visual stimulations consist in 5 repetitions of 30s stimulations followed by 30s of darkness. Different parameters were assessed such as flickering frequency, stimulus contrast. 3D maps of the visual brain system were reconstructed by shifting the US probe position (pitch of 500μm) and repeating the acquisition.Results: The cerebral blood volume increased in a correlated fashion with the visual stimulation reaching up to 47% increase in SC (SEM: 1.8%), 46% in LGN (SEM: 1.6%) and 18% in VC (SEM: 2.4%) with correlation coefficients r=0.7 in SC, LGN and r=0.6 in VC. These values are obtained with our optimal visual stimulation parameters: 100%contrast and a 3Hz flickering frequency. Using these parameters, we were able to reconstruct the 3D map of the whole brain visual system with a high temporal resolution (sampling frequency=1Hz), and spatial resolution (100μmX100μmX400μm). Finally, we were also able to generate a retinotopic map of the different structures.Conclusions: We demonstrated the value of ultrasound imaging to investigate the rodent visual system, even in deep structures like LGN and SC. Spatial and temporal resolutions are high enough to discriminate and accurately monitor these structures - and substructures - involved in the brain visual information processing according to the parameters of the visual stimulation.Commercial Relationships: Kévin BLAIZE, None; Marc Gesnik, None; Thomas Deffieux, None; Jean-Luc Gennisson, None; Jose A. Sahel, None; mathias fink, None; Mickaël Tanter, None; Serge A. Picaud, NoneSupport: ERC Synergy grants
Program Number: 3099 Poster Board Number: B0002Presentation Time: 11:00 AM–12:45 PMDiffusion fMRI of mouse optic nerve with antidromic electrical stimulationTsen-Hsuan Lin1, William M. Spees1, 2, Michael Wallendorf3, Yen-Yu I. Shih4, Anne Cross5, 2, Sheng-Kwei Song1, 2. 1Raiology, Washington University School of Medicine, St. Louis, MO; 2The Hope Center for Neurological Disorders, Washington University School of Medicine, ST. Louis, MO; 3Biostatistics, Washington University School of Medicine, ST. Louis, MO; 4Neurology, The University of North Carolina in Chapel Hill, Chapel Hill, NC; 5Neurology, Washington University School of Medicine, ST. Louis, MO.Purpose: Previously, we successfully reported diffusion fMRI (dfMRI) to assess axonal activation (decreased ADC⊥, apparent diffusion coefficient perpendicular to axon tracts) with visual stimulation in healthy and experimental autoimmune encephalomyelitis mouse optic nerves (ON). In this study, we antidromically stimulated ON using tungsten microelectrodes implanted at LGN during dfMRI. This technique allows direct interrogation of ON function without confounding factors from the retina.Methods: A 35- or 50-μm diameter tungsten electrode was implanted at right LGN of C57BL/6 mice (n=15) stimulated with biphasic square-waves of 5 or 10 Hz, 10Vp-p, 50- and 100-ms pulse width. MRI scans of ON were performed on a 4.7-T small-animal MR scanner using a multiple-echo spin-echo imaging sequence with: TR=1.5 s, TE=34.4 ms, inter-echo delay=18.2 ms, in-plane resolution=78 × 78 μm2, and slice thickness=1.3 mm. A pair of diffusion-weighted image (DWI), perpendicular to ON, was acquired with b-value=0.1 and 1.4 ms/μm2, δ=5 ms, and Δ=18 ms. Acquisition time was 12.8 minute for each pair of DWI.Results: Electrical stimulation of right LGN lead to left ON ADC⊥ decrease without affecting the right ON. We observed a 15% and 19% of ADC⊥ decrease with 10Hz stimulation using 35- and 50-μm diameter tungsten wires, respectively. A 19% and 24% ADC⊥ decrease was seen with 10 and 5 Hz stimulation using 50-μm electrode.Conclusions: DfMRI with electrical stimulation in mouse ON bypassing the retina input provides a direct measure to assess axonal function.
Figure 1 Tungsten electrode was implanted at right LGN (red arrows). Left ON ADC┴ decreased during electrical stimulation.
ARVO 2017 Annual Meeting Abstracts
These abstracts are licensed under a Creative Commons Attribution-NonCommercial-No Derivatives 4.0 International License. Go to http://iovs.arvojournals.org/ to access the versions of record.
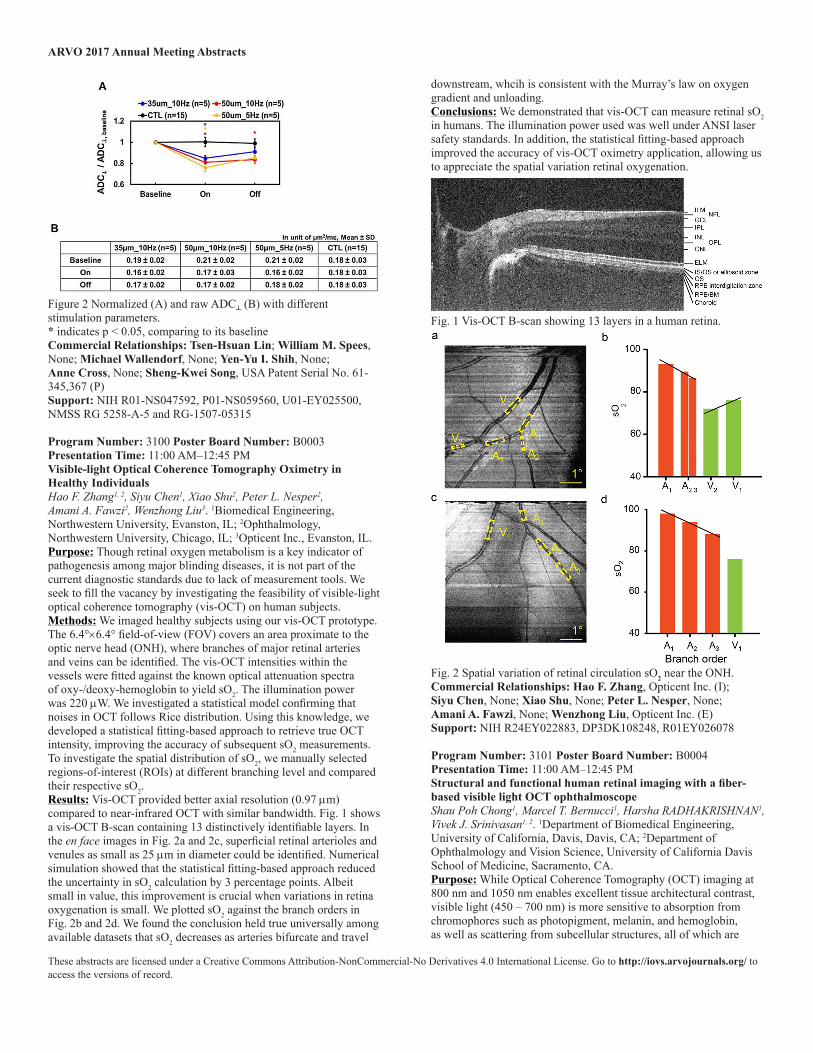
Figure 2 Normalized (A) and raw ADC┴ (B) with different stimulation parameters.* indicates p < 0.05, comparing to its baselineCommercial Relationships: Tsen-Hsuan Lin; William M. Spees, None; Michael Wallendorf, None; Yen-Yu I. Shih, None; Anne Cross, None; Sheng-Kwei Song, USA Patent Serial No. 61-345,367 (P)Support: NIH R01-NS047592, P01-NS059560, U01-EY025500, NMSS RG 5258-A-5 and RG-1507-05315
Program Number: 3100 Poster Board Number: B0003Presentation Time: 11:00 AM–12:45 PMVisible-light Optical Coherence Tomography Oximetry in Healthy IndividualsHao F. Zhang1, 2, Siyu Chen1, Xiao Shu2, Peter L. Nesper2, Amani A. Fawzi2, Wenzhong Liu3. 1Biomedical Engineering, Northwestern University, Evanston, IL; 2Ophthalmology, Northwestern University, Chicago, IL; 3Opticent Inc., Evanston, IL.Purpose: Though retinal oxygen metabolism is a key indicator of pathogenesis among major blinding diseases, it is not part of the current diagnostic standards due to lack of measurement tools. We seek to fill the vacancy by investigating the feasibility of visible-light optical coherence tomography (vis-OCT) on human subjects.Methods: We imaged healthy subjects using our vis-OCT prototype. The 6.4°×6.4° field-of-view (FOV) covers an area proximate to the optic nerve head (ONH), where branches of major retinal arteries and veins can be identified. The vis-OCT intensities within the vessels were fitted against the known optical attenuation spectra of oxy-/deoxy-hemoglobin to yield sO2. The illumination power was 220 μW. We investigated a statistical model confirming that noises in OCT follows Rice distribution. Using this knowledge, we developed a statistical fitting-based approach to retrieve true OCT intensity, improving the accuracy of subsequent sO2 measurements. To investigate the spatial distribution of sO2, we manually selected regions-of-interest (ROIs) at different branching level and compared their respective sO2.Results: Vis-OCT provided better axial resolution (0.97 μm) compared to near-infrared OCT with similar bandwidth. Fig. 1 shows a vis-OCT B-scan containing 13 distinctively identifiable layers. In the en face images in Fig. 2a and 2c, superficial retinal arterioles and venules as small as 25 μm in diameter could be identified. Numerical simulation showed that the statistical fitting-based approach reduced the uncertainty in sO2 calculation by 3 percentage points. Albeit small in value, this improvement is crucial when variations in retina oxygenation is small. We plotted sO2 against the branch orders in Fig. 2b and 2d. We found the conclusion held true universally among available datasets that sO2 decreases as arteries bifurcate and travel
downstream, whcih is consistent with the Murray’s law on oxygen gradient and unloading.Conclusions: We demonstrated that vis-OCT can measure retinal sO2 in humans. The illumination power used was well under ANSI laser safety standards. In addition, the statistical fitting-based approach improved the accuracy of vis-OCT oximetry application, allowing us to appreciate the spatial variation retinal oxygenation.
Fig. 1 Vis-OCT B-scan showing 13 layers in a human retina.
Fig. 2 Spatial variation of retinal circulation sO2 near the ONH.Commercial Relationships: Hao F. Zhang, Opticent Inc. (I); Siyu Chen, None; Xiao Shu, None; Peter L. Nesper, None; Amani A. Fawzi, None; Wenzhong Liu, Opticent Inc. (E)Support: NIH R24EY022883, DP3DK108248, R01EY026078
Program Number: 3101 Poster Board Number: B0004Presentation Time: 11:00 AM–12:45 PMStructural and functional human retinal imaging with a fiber-based visible light OCT ophthalmoscopeShau Poh Chong1, Marcel T. Bernucci1, Harsha RADHAKRISHNAN1, Vivek J. Srinivasan1, 2. 1Department of Biomedical Engineering, University of California, Davis, Davis, CA; 2Department of Ophthalmology and Vision Science, University of California Davis School of Medicine, Sacramento, CA.Purpose: While Optical Coherence Tomography (OCT) imaging at 800 nm and 1050 nm enables excellent tissue architectural contrast, visible light (450 – 700 nm) is more sensitive to absorption from chromophores such as photopigment, melanin, and hemoglobin, as well as scattering from subcellular structures, all of which are

ARVO 2017 Annual Meeting Abstracts
These abstracts are licensed under a Creative Commons Attribution-NonCommercial-No Derivatives 4.0 International License. Go to http://iovs.arvojournals.org/ to access the versions of record.
potential retinal disease biomarkers. The purpose of this study is to test the hypothesis that by 1) changing the wavelength range of OCT to the visible and 2) developing and validating spectroscopic and Doppler algorithms, reliable and consistent estimates of blood oxygenation, total hemoglobin concentration, and total blood flow in the human retina can be achieved.Methods: A fiber-based visible-light spectral/Fourier domain OCT system was constructed for in vivo imaging of human retina. A higher repetition rate, lower noise, supercontinuum light source was found to enable a sensitivity of 96 dB with 0.15 mW light power at the cornea and a 98 microsecond exposure time. Using a broadband (560 ± 50 nm), 90/10, fused single-mode fiber coupler designed for visible wavelengths, the sample arm was integrated into an ophthalmoscope platform, similar to current clinical OCT systems.Results: High-resolution in vivo structural retinal imaging at < 2 micron axial resolution and with angular field-of-view of up to 40° was demonstrated at 0.15 mW exposure with 10,000 and 70,000 axial scans per second (the latter comparable to commercial OCT systems), and at 0.03 mW exposure and 10,000 axial scans per second (below maximum permissible continuous exposure levels). Lastly, in vivo spectroscopic imaging of anatomy, saturation, and hemoglobin content in the human retina are shown in the Figure.Conclusions: Here we introduce, validate, and demonstrate methods for quantifying blood flow, oxygenation, and hemoglobin content in the inner retinal vessels with fiber-based visible light spectroscopic OCT. Applying Fick’s principle, these methods will enable oxygen metabolic imaging of the inner retina.
(A) Image of Doppler velocities overlaid on structural OCT image. (B) Cumulative hemoglobin concentration in retinal vessels exhibits a characteristic downward “crescent” shape, due to a larger cumulative path length at the distal end of the vessel. (C) Oxygen saturation mapping in retinal vessels is shown, with a spectroscopic fit for the distal portion of a vein (D).Commercial Relationships: Shau Poh Chong; Marcel T. Bernucci, None; Harsha RADHAKRISHNAN, None; Vivek J. Srinivasan, Optovue, Inc. (P)Support: Glaucoma Research Foundation Catalyst for a Cure
Program Number: 3102 Poster Board Number: B0005Presentation Time: 11:00 AM–12:45 PMAlterations in Retinal Oxygen Delivery and Metabolism due to Experimental Retinal IschemiaMichael R. Tan, Anthony Felder, Norman P. Blair, Mahnaz Shahidi. Ophthalmology and Visual Sciences, University of Illinois at Chicago, Chicago, IL.Purpose: Previous studies have shown long-term retinal morphological changes in experimental models of ischemia/reperfusion injury. The purpose of this study is to investigate short-term alterations in inner retinal oxygen delivery (DO2) and metabolism (MO2) in a rat model of retinal ischemia by ophthalmic vessel occlusion.Methods: In Long Evans rats (N = 9), the ophthalmic vessels of the study eyes were ligated for two hours. Optical section phosphorescence lifetime and blood flow imaging were performed in both eyes within 20 minutes of ligature release. Retinal arterial and venous oxygen tension (PO2A and PO2V), diameter (DA, DV), and venous blood velocity (V) were measured. Total retinal blood flow (F) was calculated from DV and V measurements. DO2 and MO2 were calculated from measurements of F, PO2A and PO2V. Retinal oxygen extraction fraction (OEF) was calculated as MO2 / DO2. Paired t-tests were used to compare measurements between study and fellow eyes.Results: PO2A and PO2V in study eyes did not recover to values observed in fellow eyes (P ≤ 0.03). In study eyes, DA was lower (P < 0.001), whereas DV was not significantly different than fellow eyes (P = 0.14). Both V and F were lower in study eyes compared to fellow eyes (P ≤ 0.005). DO2 was lower in study eyes (445 ± 282 nL O2/min) compared to fellow eyes (936 ± 298 nL O2/min) (P = 0.004), and MO2 also was lower in study eyes (229 ± 140 nL O2/min) compared to fellow eyes (399 ± 87 nL O2/min) (P = 0.004). OEF in the study eyes (0.61 ± 0.21) was higher compared to fellow eyes (0.44 ± 0.08) (P = 0.05).Conclusions: Reductions in both DO2 and MO2, coupled with an increase in OEF following a retinal ischemic insult suggest that oxygen delivery recovered more slowly than oxygen metabolism. These findings may have implications in the understanding of retinal ischemia.Commercial Relationships: Michael R. Tan, None; Anthony Felder, None; Norman P. Blair, None; Mahnaz Shahidi, NoneSupport: NIH Grants EY017918 and EY001792, and Research to Prevent Blindness
Program Number: 3103 Poster Board Number: B0006Presentation Time: 11:00 AM–12:45 PMRetinal oximetry as a biomarker for Alzheimer’s diseaseValgerdur Dora D. Traustadottir1, Olof B. Olafsdottir1, 2, Hrafnhildur Sif Saevarsdottir2, Sveinn H. Hardarson2, Jon Snaedal2, Einar Stefansson1, 2. 1Ophthalmology, Landspitali University Hospital, Reykjavik, Iceland; 2University of Iceland, Reykjavik, Iceland.Purpose: It has been reported that oxygen saturation in retinal arterioles and venules is higher in patients with Alzheimer’s disease compared to healthy individuals. Mild Cognitive Impairment (MCI) is often the first stage of Alzheimer’s disease. The main purpose was to establish a novel biomarker for Alzheimer’s disease useful in its earliest stages. In this study, retinal vessel oxygen saturation of patients diagnosed with MCI was compared to oxygen saturation in healthy controls.Methods: Retinal vessel oxygen saturation measurement was performed in 42 patients diagnosed with MCI and 42 healthy controls with a noninvasive retinal oximetry imaging using the Oxymap T1

ARVO 2017 Annual Meeting Abstracts
These abstracts are licensed under a Creative Commons Attribution-NonCommercial-No Derivatives 4.0 International License. Go to http://iovs.arvojournals.org/ to access the versions of record.
oximeter (Oxymap ehf, Reykjavik, Iceland). The two groups were age and gender matched.Results: Oxygen saturation in retinal arterioles and venules was higher in patients with cognitive impairment in the stage of MCI compared to healthy controls. In arterioles it was 93.1 ± 3.7% vs. 91.1 ± 3.4% (mean±SD p=0.003) and in venules; 59.6 ± 6.1% vs. 54.9 ± 6.4% (p=0.001). The arteriovenous difference in oxygen saturation was lower in patients with MCI compared to healthy controls, 33.5 ± 4.4% vs 36.2 ± 5.2%, p=0.02.Conclusions: Einarsdottir et al (2016) reported statistically significant higher retinal arteriolar and venular oxygen saturation in Alzheimer’s patients compared with healthy controls. This study confirms and adds to these findings. It indicates that oxygen uptake is decreased in the retina of patients with MCI compared to healthy controls. Retinal physiology may provide an objective biomarker to help with diagnosis of Alzheimer’s disease at an earlier stage than possible before.Commercial Relationships: Valgerdur Dora D. Traustadottir, None; Olof B. Olafsdottir, None; Hrafnhildur Sif Saevarsdottir, None; Sveinn H. Hardarson, Oxymap ehf (P), Oxymap ehf (C), Oxymap ehf (I); Jon Snaedal, None; Einar Stefansson, Oxymap ehf (P), Oxymap ehf (S), Oxymap ehf (I)
Program Number: 3104 Poster Board Number: B0007Presentation Time: 11:00 AM–12:45 PMRetinal oximetry in multiple sclerosisOlof B. Olafsdottir1, 2, Anna B. Einarsdottir3, 4, Sveinn H. Hardarson1, Einar Stefansson1, 2. 1Ophthalmology, University of Iceland, Reykjavik, Iceland; 2Ophthalmology, Landspitali University Hospital, Reykjavik, Iceland; 3Neurology, Odense University Hospital, Odense, Denmark; 4Neurology, Landspitali University Hospital, Reykjavik, Iceland.Purpose: Optic neuritis is a common presentation of multiple sclerosis (MS). A slow and progressive loss of retinal ganglion cells also happens in eyes that have not had optic neuritis. The purpose of the study was to measure retinal oxygen metabolism in patients with MS.Methods: Retinal oximetry was performed with a non-invasive spectrophotometric oximeter, Oxymap T1 (Oxymap ehf). Sixteen eyes from eight MS patients with history of optic neuritis in one or both eyes were measured and compared to 20 healthy individuals.Results: Venular oxygen saturation was increased in MS patients compared to healthy individuals (70.7±3.4% vs. 66.2±4.7; p=0.021, mean±SD). The arteriovenous difference was also lower in MS patients compared to healthy (26.6±3.6% vs. 30.5±4.8%; p=0.049). There was no difference measured in arterioles when patients with MS (97.3±1.7%) and healthy individuals (96.7±2.8%) were compared.Conclusions: Increased venular oxygen saturation and lower arteriovenous difference in MS indicate decreased oxygen uptake. This may be due to less oxygen demand following atrophy.
Retinal arteriolar (red) and venular (blue) oxygen saturation in patients with MS and healthy individuals. The venular saturation was increased in MS compared to healthy (p=0.021).Commercial Relationships: Olof B. Olafsdottir, None; Anna B. Einarsdottir, None; Sveinn H. Hardarson, Oxymap ehf. (P), Oxymap ehf. (C), Oxymap ehf. (I); Einar Stefansson, Oxymap ehf. (S), Oxymap ehf. (P), Oxymap ehf. (I)Support: Rannis - The Icelandic Centre for Research PostDoc Grant 152539-052
Program Number: 3105 Poster Board Number: B0008Presentation Time: 11:00 AM–12:45 PMRepeatability and reproducibility of retinal hemodynamic parameters by using Doppler OCTShenghai Huang, Meixiao Shen, Dexi Zhu, Ce Shi, Fan Lu. School of Ophthalmology and Optometry, Wenzhou Medical University, Wenzhou, China.Purpose: To evaluate the repeatability and reproducibility of angle-independent hemodynamic parameters in young health subjects by using Doppler optical coherence tomography (OCT).Methods: A custom built spectral domain OCT was used to image retinal vessels in optic disc area. The phase resolved Doppler OCT was developed to obtain the pulsatility of retinal vessels. Two angle-independent, pulsatility index (PI) and resistance index (RI), were defined based pulsatility of vessels. 7 left eyes of 7 healthy subjects were included. The raster scan was first performed to obtain the morphology of retinal vessels. Then repeated scan at the superior and inferior of the optic disc was performed to get the Doppler images. Three repeated measurements was performed. The first two measurements were collected by examiner 1 for repeatability study and the last measurement was collected by examiner 2 for reproducibility study. The intraclass correlation coefficient (ICC), coefficients of repeatability and reproducibility (COR) and Bland-Altman plot were analyzed to evaluate the reliability.Results: A total of 28 vessels from 7 left eyes were collected at optic disc area for Doppler imaging. The value of PI was 1.34±0.22. The p-values of T-test for the intra-observer repeatability and inter-observer reproducibility were 0.570 and 0.968. The CORs were 13.97% and13.18%. In Bland-Altman plot, most of the values were in 95% confidence interval. ICCs were 0.922[0.840, 0.963] and 0.923[0.840, 0.963]. The value of RI was 0.89±0.08. The p-values of T-test for the intra-observer repeatability and inter-observer reproducibility were 0.491 and 0.939. The CORs were 5.44% and 4.91%. In Bland-Altman plot, most of the values were in 95% confidence interval. ICCs were 0.905[0.807, 0.955] and 0.912[0.818, 0.958].Conclusions: The angle-independent hemodynamic parameters of retinal vessels from Doppler OCT system have good repeatability and reproducibility. This method has potential for earlier diagnosis and precise monitoring in retinal vascular diseases.

ARVO 2017 Annual Meeting Abstracts
These abstracts are licensed under a Creative Commons Attribution-NonCommercial-No Derivatives 4.0 International License. Go to http://iovs.arvojournals.org/ to access the versions of record.
Fig 1. Measurement of reitnal blood flow. (a) En face view of optic disc area based on raster scan. (b) and (c) Four major arteries were obtaned based on repeated scan.
Fig2. Bland-Altman plots of hemodynamic parameters of inter-observer measurements and intra-observer measurement.Commercial Relationships: Shenghai Huang, None; Meixiao Shen, None; Dexi Zhu, None; Ce Shi, None; Fan Lu, NoneSupport: National Nature Science Foundation of China 81400441; National Nature Science of Zhejiang Province LY14H180007 and LQ17H180004
Program Number: 3106 Poster Board Number: B0009Presentation Time: 11:00 AM–12:45 PMThe effect of different adaptation conditions on the dynamic vessel analysisSascha Klee, Dietmar Link. Institute of Biomedical Engineering and Informatics, Technische Universität Ilmenau, Ilmenau, Germany.Purpose: Retinal arterioles and venules dilate when stimulated with flickering light. This phenomenon is described as functional hyperemia. Flicker light stimulation is an established noninvasive means of assessing the endothelial function and the retinal autoregulation by continuous measurement of vessel diameters. Investigation of the flicker-induced retinal vasodilation, known as dynamic vessel analysis (DVA), is often conducted under reduced ambient lighting conditions but the influence of various adaptation levels is still unclear. This work aims to clarify whether light or dark adaptation affects the DVA.Methods: We studied 15 volunteers (8m, 7f, 24.7±2.4 years, one eye) using the Retinal Vessel Analyzer (Imedos Systems UG). Exclusion criteria were VA<0.5, astigmatism >2.0D, myopia <-5.0D, hyperopia >5 D and systemic diseases. We investigated four primary vessel segments (superior as well as inferior temporal artery (STa/ITa) and
vein (STv/ITv)) located in a range from 0.5–2 disc diameters from the optic disc. For each volunteer DVA was performed three times in random order. DVA after light adaptation (129cd/m2) and after dark adaptation (0.02cd/m2) were performed according to the standard protocol timing (350s total time, 3 flicker cycles; Garhofer et al. 2010). Both the vaso-dilatation values and baseline diameters were analyzed. The effect on regulatory vessel diameter changes during the transition between dark and light adaptation was examined measuring only baseline diameters. For statistical analysis t-test and Wilcoxon test for paired samples were used.Results: Vaso-dilatation values and baseline diameters between light and dark adaptation showed no significant differences (STa: p=0.099/0.977, ITa: p=0.670/0.999, STv: p=0.156/0.820, ITv: p=0.065/0.955). The obtained baseline values during the transitional measure showed increased diameters after dark adaptation (STa: +7%, ITa: +6%, STv: +5%, ITv: +8% = group-means, referred to the baseline values under light adaption) which returned slowly (tau=100 s) to the baseline values under light adaption.Conclusions: The presented work revealed, that adaptation conditions have no effect on DVA following the standard timing. This means, in clinical practice DVA results would not be influenced by different ambient light conditions. However, dark adaptation leads to increased vessel diameters. The large time constant should be considered using short time DVA protocols.Commercial Relationships: Sascha Klee, None; Dietmar Link, NoneSupport: AIF KF2250122CS4
Program Number: 3107 Poster Board Number: B0010Presentation Time: 11:00 AM–12:45 PMAssessing live visualization of stimuli on the retina during visual function testingAllen W. Ingling1, Matthew S. Muller1, Jeffrey L. Clendenon1, Robert N. Gilbert2, Shirin E. Hassan2, Elli J. Kollbaum2, Bryan P. Haggerty2, Ann E. Elsner2, 1. 1Aeon Imaging, Bloomington, IN; 2School of Optometry, Indiana University, Bloomington, IN.Purpose: Live retinal imaging aids assessment of visual function. A lower cost device can show retinal location of visual stimuli during micro-perimetry, scotoma mapping, or fixation stability tasks.Methods: To demonstrate the potential range of visibility of stimuli on the fundus, 11 subjects 45.6 + yr were tested without mydriasis with a broad range of age and fundus pigmentation: 2 African/African American, and 9 Caucasians or bi-racial. We used a digital light ophthalmoscope (DLO) to illuminate 26 deg of retina at < 24 microwatts. The red LED raster of a DLP (Lightcrafter 4500, TI) was presented in sequential stripe pattern at 15 or 20 Hz. A CMOS camera with a rolling shutter synched to the illumination stripes improved contrast by reading only when specific lines were illuminated. Black stimuli drawn on the retina by the DLP were viewed live by the subject. The operator viewed the retina to position and observe the subject’s fixation, using also a second live image that showed the position of a graphics overlay of the stimulus on the retina. The size of the fixation pattern and the selection of task and visual stimuli were under computer control. Image alignment after the completion of a trial corrected stimulus location, similar to previous microperimetry techniques.Results: Over a wide range of fundus pigmentation, major retinal landmarks were visible in all subjects. Larger black on red stimuli, e.g. Goldman III targets, were readily visible in live images, but not when the black stimulus overlaid a dark fundus feature. Decreased visibility was due to contrast, not numbers of pixels (1662). For a pale to medium fundus over a bright feature, the Michelson contrast = .12 Stimulus location was determined from image alignment, since

ARVO 2017 Annual Meeting Abstracts
These abstracts are licensed under a Creative Commons Attribution-NonCommercial-No Derivatives 4.0 International License. Go to http://iovs.arvojournals.org/ to access the versions of record.
the software kept track of the stimulus position. Variation in retinal location is available, e.g. for 3 sequential images captured during a 200 ms target presentation.Conclusions: Visual function testing with visualization of the stimulus position with respect to the fundus is readily performed over a wide range of fundus pigmentations. Behavior calibration of each stimulus is unnecessary as long as there is at least one image with sufficient visibility of the fixation target or other landmark to use to re-align the images. This allows for investigation of strategies to use scanning to enhance visibility of targets for patients with low vision.Commercial Relationships: Allen W. Ingling, Aeon Imaging, LLC (E); Matthew S. Muller, Aeon Imaging, LLC (E), Aeon Imaging, LLC (P), Aeon Imaging, LLC (I); Jeffrey L. Clendenon, Aeon Imaging, LLC (E); Robert N. Gilbert, None; Shirin E. Hassan, None; Elli J. Kollbaum, None; Bryan P. Haggerty, None; Ann E. Elsner, Aeon Imaging, LLC (P), Aeon Imaging, LLC (I)Support: NIH Grant EY018772
Program Number: 3108 Poster Board Number: B0011Presentation Time: 11:00 AM–12:45 PMRetinotopic Imaging of Retinal and Cortical Structure and Function: A New Paradigm for Assessing the Visual Connectome in Health and DiseaseJeiran Choupan1, Vivek Patel1, Chris Purington1, Noelle R. Stiles1, Nihong Chen1, Jessica I. Morgan2, Andrew S. Bock2, Kimberly K. Gokoffski1, Junyan Wang1, Meng Law1, Amir H. Kashani1, Geoffrey K K. Aguirre2, James D. Weiland1, Yonggang Shi1, Bosco S. Tjan1. 1University of Southern California, LOS ANGELES, CA; 2University of Pennsylvania, Philadelphia, PA.Purpose: Vision loss can lead to structural and functional changes in the brain. Such changes can impose preconditions on the outcomes of sight-restoration treatments. Characterizing the fine-scale relationships between retinal pathology and neuroimaging data enables a detailed analysis of the interplay between vision loss, brain plasticity and vision restoration. Presenting brain imaging in a format familiar to ophthalmologists will help generate novel insights.Methods: There is a one-to-one and topology-preserving mapping between points in the brain and points on the retina in each of the brain regions that are part of the central visual pathway. This retinotopic organization allows brain measurements to be displayed in the same coordinates as a fundus image. Retinotopic coordinates for cortical areas V1-V3 were determined by fitting a deformable template [1] to digital reconstruction of a patient’s cortex derived from T1w MRI data. The template-derived retinotopic coordinates in V1 were extended to the optic radiation, reconstructed from diffusion MRI data [2].Results: We present two patients with unilateral hemifield loss, one due to a recent onset of Non-Arteritic Ischemic Optic Neuropathy (NAION) (1 month prior to imaging) and another due to maculopathy caused by trauma (9 yr prior). Subjects underwent multimodal retinal and brain imaging. Functional assessments with microperimetry and fMRI (on-off full-field flashing light) were obtained. fMRI data were displayed in fundus coordinates. There was a striking qualitative correspondence between regions of fMRI signal modulation, retinal pathology and microperimetric field size. The spatial extent of attenuated V1 response often extended beyond the visible extent of the structural retinal lesion. The patient with a longer history of visual field loss showed a robust suppressive response in the V1 lesion projection zone. Cortical thickness in V1 did not reliably correlate with visual-field loss.Conclusions: Projecting brain-imaging data to the coordinates of a fundus image enables direct comparisons between retinal structure and function and their impact on the central visual pathways.
This novel visualization of brain imaging data is intuitive to ophthalmologists, leading to insights that are otherwise not readily available.1. Benson NC, et al, PLoS Comput. Biol. 20142. Kammen A, et al, NeuroImage 2016In honor and memory of Bosco S. Tjan, without whom this work would not have been possible
Commercial Relationships: Jeiran Choupan, None; Vivek Patel, None; Chris Purington, None; Noelle R. Stiles, None; Nihong Chen, None; Jessica I. Morgan, None; Andrew S. Bock, None; Kimberly K. Gokoffski, None; Junyan Wang, None; Meng Law, None; Amir H. Kashani, Carl Zeiss Meditec (F), Carl Zeiss Meditec (R), Carl Zeiss Meditec (C); Geoffrey K K. Aguirre, None; James D. Weiland, None; Yonggang Shi, None; Bosco S. Tjan, NoneSupport: NIH 5U01EY025864-02, Research to Prevent Blindness