artificial neural network based curve prediction documentation
TRANSCRIPT

8/8/2019 Artificial Neural Network Based Curve Prediction Documentation
http://slidepdf.com/reader/full/artificial-neural-network-based-curve-prediction-documentation 1/13
Artificial Neural Network basedCurve Prediction
LECTURE COURSE: AUSGEWÄHLTE OPTIMIERUNGSVERFAHREN FÜ R INGENIEURE
SUPERVISOR: PRO F . CHRISTIAN H AFNER
STUDENTS: ANTHONY HSIAO, MICHAEL BOESCH
AbstractWe use artificial neural networks to perform curve prediction. For that, we have
created a class of neural networks (feed forward multilayer perceptron networks
with backpropagation) that have a topology which is determined by their genetic
makeup. Using a simple evolutionary strategy on their genes, we optimise the
networks’ topologies to solve the problems at hand. Using this approach, we could
generate networks that are able to predict simple functions such as sin(x) or linear
combinations thereof, with moderate computational overhead. However, it was not
possible to generate networks that predict more complex functions such as sinc(x)
or the NASDAQ composite index satisfactorily, within the allowed sizes for the
networks. In general though, it appears to be a useful approach to generate neural
networks using this form of evolutionary strategy as it substitutes for experience in
neural network design.
IntroductionCurve prediction is one of the most popular applications for artificial neural
networks. However, the success of using a neural network to solve a certain
problem is inherently linked to the designer’s ability to apply an appropriate
network to the task. Even relatively simple artificial neural networks such as the
multi-layer-perceptron or variants thereof have several degrees of freedom, e.g. the
number of neurons, the number of hidden layers, the type of transfer functions
employed, which the network is very sensitive to. For most tasks there is no
methodology for designing a neural network which guarantees success. Instead, we
try to evolve a neural network topology that is suitable for any curve prediction
task.
Aim• To develop an evolvable artificial neural network representation
• To optimise such a neural network to solve a number of curve prediction

8/8/2019 Artificial Neural Network Based Curve Prediction Documentation
http://slidepdf.com/reader/full/artificial-neural-network-based-curve-prediction-documentation 2/13
• To evaluate the ability of an evolutionary approach to evolve suitable neural
networks for a given task
Neural Networks
In order to perform the prediction tasks described above, we use multi layerperceptron networks and a simple backpropagation learning rule. Then, we use an
evolutionary strategy to change the following parameters of the network:
• Number of hidden layers
• Number of neurons in each layer
• Transfer function employed by the neurons in each layer (neurons in the
same layer will employ the same transfer function)
In order to do this, we define a genetic code for the class of neural networks
comprising an N digit binary bit string. In order to limit the optimisation search
space, we arbitrarily limit the number of hidden layers to
The number of neurons per layer is limited to
The allowed transfer functions are linear, linear with bounds and hyperbolic
tangens, as shown below:
Thus, the number of neurons for each hidden layer can be represented by a four bit
number, and the transfer function for the neurons in each layer by a two bit
number, totalling a required six bits per layer. As there are up to 10 hidden layers,
the total bitstring will be 60 bits long, and is represented as follows:
Bit 0 Bit 59Layer0
Layer1
Layer2
Layer3
Layer4
Layer5
Layer6
Layer7
Layer8
Layer9
Layer 4, Layer 4, Layer 4, Layer 4, Layer 4, Layer 4,

8/8/2019 Artificial Neural Network Based Curve Prediction Documentation
http://slidepdf.com/reader/full/artificial-neural-network-based-curve-prediction-documentation 3/13
Neuron bit 3 Neuron bit 2 Neuron bit 1 Neuron bit 0 Transfer bit1
Transfer bit0
Each layer can have up to 15 neurons, as given by the binary number [Neuron bit 3:
Neuron bit 0]. If the bit string encodes zero neurons for that layer, it is interpreted
as being non-existent. Also, as the bit string can encode for four transfer functions
in each layer, as given by the binary number [Transfer bit 1: Transfer bit 0], but only
three are employed, a bias is given towards the linear y = x transfer function, to be
encoded in two of the possible four states. Thus, by changing the genes of a
network, it will have a different topology, some more others less suitable for the
tasks at hand.
OptimisationIn order to find an optimal network topology for the given tasks, we use an
evolutionary strategy to evolve the genetic makeup of the network, which couldalso be regarded as a genetic algorithm without cross breeding.
The Evolutionary Strategy The algorithm employed works as follows:
1. Produce a first generation of population size seven of random bit strings
2. Generate randomly initialised networks from the population of bit strings
3. Train the networks on a training set using backpropagation
4. Run the networks on the test data
5. A fitness function evaluates the fitness of each network, and the fittest
network is kept for the next iteration, while the other ones are discarded.
6. The fittest network is cloned six times to refill the generation, and each of
these clones is mutated randomly by inverting one of the 60 bits at random.
7. The process repeats at 3. until a maximum number of iterations has been
performed, or a marginal or no improvement in the fitness can be achieved
over several iterations
A table that contains all the bitstrings that have already been evaluated is kept so
as to avoid computing the same network topology multiple times.
Here, we evaluate the fitness of the networks in two ways, depending on the task at
hand.
• For short term prediction, a part of the test signal series is used as input to
the network, and the first value the network predicts is compared with the

8/8/2019 Artificial Neural Network Based Curve Prediction Documentation
http://slidepdf.com/reader/full/artificial-neural-network-based-curve-prediction-documentation 4/13
actual value of the series at that point. The cumulative error is found by
summing the absolute difference between the predicted value and the actual
value for all shifted versions of the actual signal as input to the network. The
fitness of the network is the reciprocal of the cumulative error. This method
evaulates the network’s ability to make short term predictions for a given
pattern and number of inputs. (see below)
Actual signal
1.
1 . . . . . . . N
Neural network with inputs and outputi n p u t s o
2.
1 . . . . . . . N
i n p u t s o
3.
1 . . . . . . . N
i n p u t s O
Figure 1: Short term prediction method
• For long term prediction, a part of the signal is used as input to the
network, and the first predicted value is fed back and used as the next input
to the network, and this is repeated for a given number of points that are to
be predicted. Then, the fitness is the reciprocal of the cumulative absolute
difference between the actual signal and the recurrently predicted signal.
This method evaluates the network’s ability to make long term predictions
(forecasts) for a given starting pattern and number of points to predict. (see
below)
Actual signal
1.
1 . . . . . . . N
Neural network with inputs and outputi n p u t s o
2.
1 . . . . . . . N
i n p u t s o

8/8/2019 Artificial Neural Network Based Curve Prediction Documentation
http://slidepdf.com/reader/full/artificial-neural-network-based-curve-prediction-documentation 5/13
3.
1 . . . . . . . N
i n p u t s O
Figure 2: Long term prediction method
In both cases, there is a minimum error (and thus maximum fitness) that each
network must have, in order to avoid division by zero errors and infinite fitness.
Furthermore, smaller networks, i.e. networks with fewer hidden layers are preferred
over larger ones, as are networks with a small number of neurons.
The Search Space The size of the search space can be calculated as follows:
In fact, the search space is slightly smaller than this, because some of the
topologies where one or more layers have zero neurons are equivalent. Still, it can
be appreciated, that the search space is large enough to justify this optimisation
approach.
Evaluation and DiscussionWe developed a software application with Java © that implements this evolvable
artificial neural network representation, and which allows our evolutionary strategyto evolve the network topology of the networks. To evaluate our approach, we
adopted the following testing strategy.
Testing Strategy There are two tasks, short- and long term (function) prediction that our neural
networks will have to perform. Here, we shall qualitatively assess the ability of the
evolved networks to perform each task, using the following representative test
signals:
• Sinusoidal function: An arbitrary sinusoidal function such as Sin(x) with a
given amplitude, frequency and phase. This is probably the simplest test
signal for the networks and the tasks can be expected to be managed
successfully by the networks.
• A-Periodic function: An aperiodic function sinc(x) = sin(x)/x. This is a
challenging function to predict, as it is not periodic, and not monotonous. It

8/8/2019 Artificial Neural Network Based Curve Prediction Documentation
http://slidepdf.com/reader/full/artificial-neural-network-based-curve-prediction-documentation 6/13
would come as a positive surprise if the evolved networks would manage the
task successfully.
• Noisy a-periodic or pseudo-random function: An excerpt of the NASDAQ
composite index’ historical weekly values shall be used as an interesting and
challenging test signal. The ability of the networks to predict this stockmarket index would be highly surprising and unexpected.
Apart from running both tasks on the four different functions, the following
questions shall be addressed:
• Do we always arrive at the same network for the same problem? In
order to answer this question, several trials of the same test shall be run. If
the same network topologies are arrived at most of the time, it implies that
the evolutionary strategy converges to a local or global optimum, which is
desirable.
• How fit are the networks? As mentioned above, there exists a maximum
fitness that a network may achieve. How fit, relative to the maximum
achievable fitness, are the evolved networks?
Tabular Summary The section below describes important aspects of the individual tests in detail. In
addition, the table below summarises the results.
Criteria – 5inputs
Sin(x) Sinc(x) NASDAQ
Short termprediction
Long termprediction
Samenetworks
Fitness 17% 15% 2%%-Error 36% 86% 48%Convergence
Table 1: Summary of the tests for 5 inputs
Criteria –
10 inputs
Sin(x) Sinc(x) NASDAQ
Short termprediction
Long termprediction
Samenetworks
Fitness 95% 15% 2%

8/8/2019 Artificial Neural Network Based Curve Prediction Documentation
http://slidepdf.com/reader/full/artificial-neural-network-based-curve-prediction-documentation 7/13
%-Error 0% 113% 44%Convergence Table 2: Summary of the tests for 10 inputs
Criteria –20 inputs
Sin(x) Sinc(x) NASDAQ
Short termprediction
Long termprediction
Samenetworks
Fitness 99% 15% 3%%-Error 0% 95% 27%Convergence Table 3: Summary of the tests for 20 inputs
Test Details
Sinusoidal
The neural networks evolved are able to predict the sinusoidal signals with
acceptable accuracy, provided they receive enough inputs. Figure 3 below
illustrates the evolution process over several trials. Each point on the graph
represents an improved network topology over the previous one.
Figure 3: Fitness evolution for different trials for Sin(x) - Clear fitness improvement
As with the fitness evolution, the error performance of the evolved networks
improves. Figure 4 below illustrates how the %-error in the long term prediction
decreases in general with each generation.

8/8/2019 Artificial Neural Network Based Curve Prediction Documentation
http://slidepdf.com/reader/full/artificial-neural-network-based-curve-prediction-documentation 8/13
Figure 4: Error evolution for different trials for Sin(X) - Clear performance improvement
Comparing the size of the network (number of neurons inside hidden layers) to the
network’s performance, it appears, that there exists a certain range of ‘right’ sizes
that the network should have, which allows it to achieve high fitness. Another way
of looking at this is that the network should have a certain minimum complexity (in
terms of numbers of neurons) which is adequate to solve the task at hand. Below
that critical size, it is unlikely, that a network can achieve a high fitness.
Figure 5: Size does matter – a network needs a certain minimum size or complexity toachieve high fitness
8/8/2019 Artificial Neural Network Based Curve Prediction Documentation
http://slidepdf.com/reader/full/artificial-neural-network-based-curve-prediction-documentation 9/13
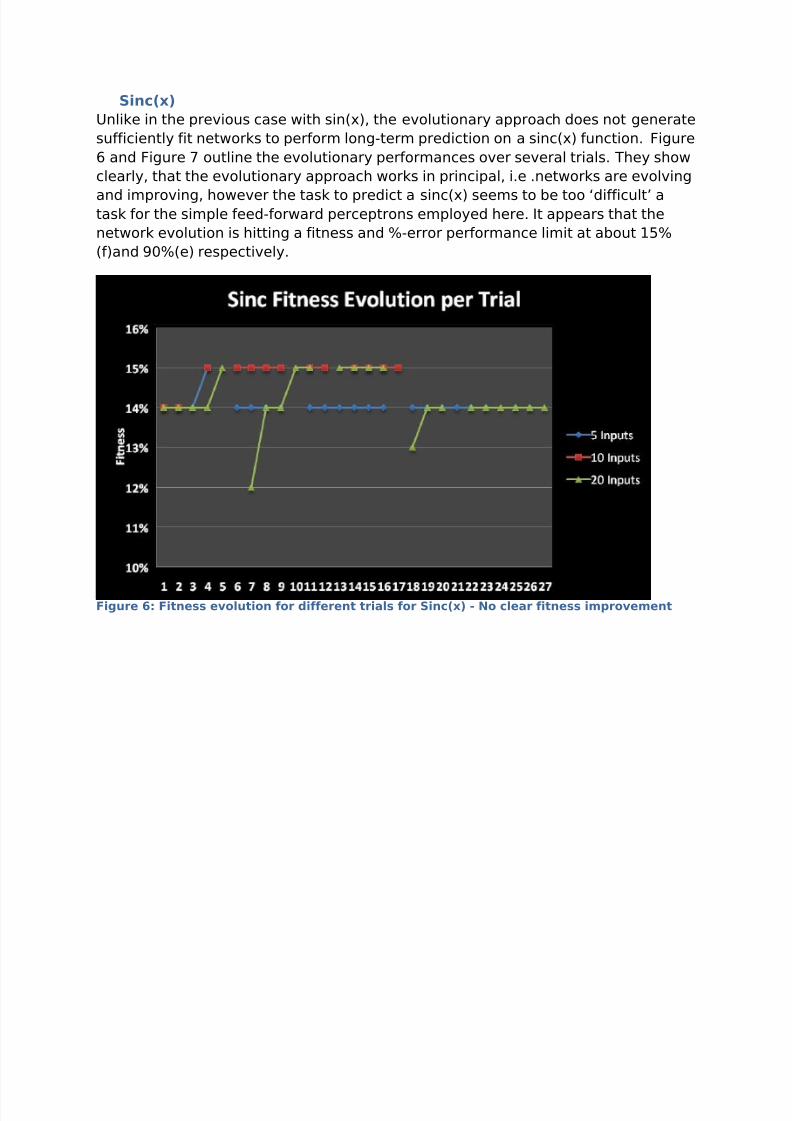
Sinc(x)
Unlike in the previous case with sin(x), the evolutionary approach does not generate
sufficiently fit networks to perform long-term prediction on a sinc(x) function. Figure
6 and Figure 7 outline the evolutionary performances over several trials. They show
clearly, that the evolutionary approach works in principal, i.e .networks are evolving
and improving, however the task to predict a sinc(x) seems to be too ‘difficult’ atask for the simple feed-forward perceptrons employed here. It appears that the
network evolution is hitting a fitness and %-error performance limit at about 15%
(f)and 90%(e) respectively.
Figure 6: Fitness evolution for different trials for Sinc(x) - No clear fitness improvement

8/8/2019 Artificial Neural Network Based Curve Prediction Documentation
http://slidepdf.com/reader/full/artificial-neural-network-based-curve-prediction-documentation 10/13
Figure 7: Error evolution for different trials for Sinc(x) – The error decreases, but is stillunacceptably high
NASDAQ
Attempting to perform long/term prediction on the NASDAQ is ambitious. Here, the
evolutionary approach again works somewhat, as it is able to generate networks
with improving performance over several generations, however the network model
or complexity is again not able to cope with the challenge posed by the NASDAQ.
Figure 8 and Figure 9 summarize the network evolution over several trials.

8/8/2019 Artificial Neural Network Based Curve Prediction Documentation
http://slidepdf.com/reader/full/artificial-neural-network-based-curve-prediction-documentation 11/13
Figure 8: Fitness evolution for different trials for the NASDAQ - Too difficult for thenetworks

8/8/2019 Artificial Neural Network Based Curve Prediction Documentation
http://slidepdf.com/reader/full/artificial-neural-network-based-curve-prediction-documentation 12/13
Figure 9: Error evolution for different trials for the NASDAQ - Error performance improves,but it is still too high
General Comments
• The networks’ performances are closely tied to some randomness in
the initialisation and the success of the training. The training method
employed, backpropagation, however is not guaranteed to achieve a
satisfactory level of training, and does not necessarily find the globally
optimal solution parameters for the network. To overcome this, we repeated
the training sequence of the networks several times to increase the likelihood
of obtaining a ‘’well trained’ network. This however increased the
computational load manifold, to an impractical degree, and is therefore not
an adequate remedy to decouple the success of the evolutionary approach
from its sensitivity on randomness and initial conditions.
Conclusion• To develop an evolvable artificial neural network representation
•
To optimise such a neural network to solve a number of curve prediction
• To evaluate the ability of an evolutionary approach to evolve suitable neural
networks for a given task
The performance of an artificial neural network for a given problem is inherently
tied to the topology of the network, and it might prove difficult to produce

8/8/2019 Artificial Neural Network Based Curve Prediction Documentation
http://slidepdf.com/reader/full/artificial-neural-network-based-curve-prediction-documentation 13/13
satisfactory results. Thus, we have set out to create a neural network design
framework that replaces the designer’s experience with an evolutionary strategy.
We have developed a bit string representation that corresponds to the genetic
makeup of a multi-layer perceptron network, allowing an optimisation of the
following network parameters: number of hidden layers, number of neurons in thehidden layers and the transfer function employed by the neurons in each layer.
Using a simple evolutionary strategy, we tried to optimise the network topology for
the tasks at hand by optimising a generation of networks’ genetic makeup. In
principal, this approach has proven valid, and we have demonstrated an evolution
of networks to predict a sinus function. For more complex function such as the
sinc(x) function or the NASADQ, the evolutionary approach worked, although it was
limited by the network model’s inherent ability to predict complex patterns.
We are optimistic about the approach to evolve neural network topologies for given
tasks, and there are several aspects that could be improved or further investigated.
In particular, we suggest the following:
• Within our simulations, we had to limit the search space by limiting the
allowed size of the networks and their transfer functions. A more extensive
investigation into the evolutionary approach could include other non-linear
transfer functions, larger networks as well as more interconnected or feed-
back networks.
• A major limiting computational factor was the learning rule employed
(backpropagation). It would be worthwhile to consider other learning rules.
• In our approach, we ‘allow’ evolution to uniformly develop networks of all size
and shapes. It might be a more fruitful approach to instead constrain the
evolution to ‘organic growth’, i.e. to start with a small network and growing
them by evolution.
• We have used our evolutionary strategy on function prediction only. It would
be worthwhile to apply this method to other common aNN tasks, such as
image recognition.