arizona department of corrections l3 . r=796 t= 330 . browning l5 . cook l3 . r=768 t= 120 . r=796...
TRANSCRIPT

Appropriation HearingsFebruary 2012
ARIZONA DEPARTMENT OFCORRECTIONS
Charles L. RyanDirector
FY 2013

ARIZONA DEPARTMENT OF CORRECTIONSFY 2013
APPROPRIATION HEARINGSFebruary 2012
1 Facilities by Security Level/Mission
2 Institutional Capactiy & Committed Population, December 2011
3 Bed Definitions
4 Inmate Classification
a. Minimum Custody
b. Medium Custody
c. Close Custody
d. Maximum Custody
5 Aerials of select Arizona State Prison Complexes (ASPC)
a. ASPC-Lewis
b. ASPC-Eyman
6 Aerials of select Units
a. Morey Unit
b. Special Management Unit I (SMU1)
7 Security Post Unit Staffing Example
8 Population & Assault-Fight Comparison chart
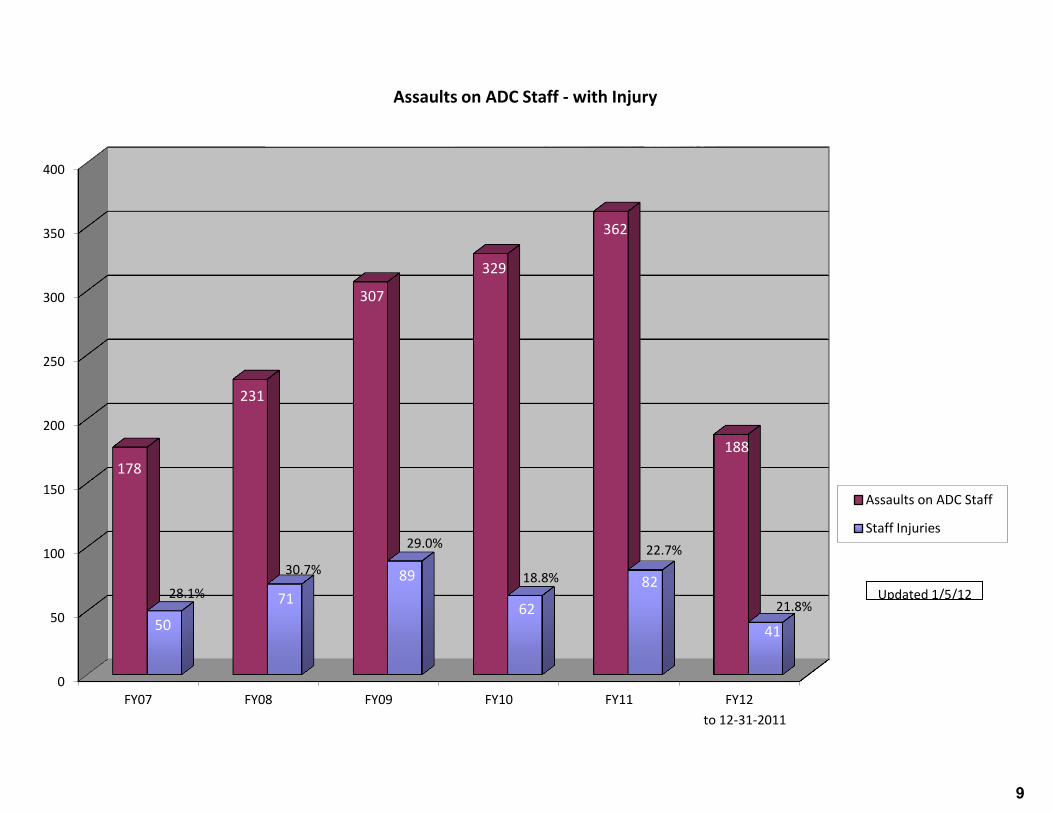
9 Assaults on ADC Staff - with Injury chart

1

ADC INSTITUTIONAL CAPACITY & COMMITTED POPULATION
for the MONTH ENDING DECEMBER 31, 2011
Rated Beds + Operating Capacity Total Special Inmate Inmate Total
Temporary Beds = MAX Beds CLOSE Beds MED Beds MIN Beds Operating Use Population Population Inside
Operating Capacity Rated Temp. Rated Temp. Rated Temp. Rated Temp. Capacity Beds Beds in Operating in Special Inmate
(R+T=OC) (A) (B) (C) (D) (E) (F) (G) (H) (A-H) Beds Beds Population
Arizona State Prison
Douglas 0 0 0 0 803 124 1,252 380 2,559 89 2,306 41 2,347
Eyman 1,712 312 400 0 1,992 795 0 0 5,211 184 4,822 141 4,963
Florence 1,074 0 0 0 1,144 547 1,426 248 4,439 122 4,352 90 4,442
Lewis 48 0 1,956 0 1,600 478 1,000 152 5,234 275 4,877 176 5,053
Perryville (Female) 228 72 298 0 960 0 2,716 0 4,274 58 3,359 14 3,373
Phoenix* 247 137 125 0 150 0 30 25 714 9 526 7 533
Safford 0 0 0 0 250 60 1,203 385 1,898 55 1,621 23 1,644
Tucson* 36 0 1,073 30 1,886 515 1,754 0 5,294 291 4,891 231 5,122
Winslow 0 0 400 0 400 0 826 216 1,842 51 1,535 32 1,567
Yuma 0 0 800 0 2,050 0 1,500 80 4,430 175 3,958 140 4,098
Total Rated Beds 3,345 5,052 11,235 11,707 31,339
Total Temporary Beds 521 30 2,519 1,486 4,556
ASPC Total 35,895 1,309 32,247 895 33,142
Contracted In-State Private Prisons
Central AZ Correc.
Facility (GEO)0 0 0 0 1,000 280 0 0 1,280 40 1,258 20 1,278
Florence-West (GEO) 0 0 0 0 0 0 600 150 750 25 713 8 721
Phoenix-West (GEO) 0 0 0 0 0 0 400 100 500 20 485 7 492
Kingman (MTC) 0 0 0 0 1,400 108 2,000 0 3,508 153 3,334 147 3,481
Marana (MTC) 0 0 0 0 0 0 500 0 500 10 463 0 463
Total Rated Beds 0 0 2,400 3,500 5,900
Total Temporary Beds 0 0 388 250 638
In-State Private Total 6,538 248 6,253 182 6,435
ALL TOTAL 3,345 521 5,052 30 13,635 2,907 15,207 1,736 42,433 1,557 38,500 1,077 39,577
Out to Court/Out to Medical 372
TOTAL PRISON INMATE POPULATION 39,949
COMMUNITY SUPERVISION OFFENDERS 5,911
ADC TOTAL 45,860
*ASPC-Phoenix has 20 Rated Female Beds/2 Female Special Use Beds; ASPC-Tucson/SACRC has 144 Rated Female Beds/2 Special Use Female Beds
2

Bed Definitions
• Rated Beds (R): Rated beds are by physical design or as defined by law or court order, or as determined in relation to staffing level, food service, water and sewage capabilities, a permanent part of a unit.
• Temporary Beds (T): Temporary beds are added to a unit in addition to permanent beds assigned to that unit such as tents, or beds in day rooms. Temporary beds are not part of the physical design of a unit and can result in overcrowding, impact staff and inmate safety and create a strain the physical plant such as water and sewage capabilities.
• Operating Capacity (R+T=OC): Operating capacity is the sum of rated beds and temporary beds only.
February 7, 2012
As of
12/31/11 Rated (R) Temporary (T)
Operating
Capacity
(R+T=OC)
State 31,339 4,556 35,895
Private 5,900 638 6,538
Total 37,239 5,194 42,433
• Special Use Beds (SU): Special use beds are used for maximum behavior control, mental health observation or medical inpatient care, disciplinary isolation, and investigative detention. Special use beds are not included as part of the operating capacity.
3

• Minimum Custody – Low risk inmates; permitted to work outside the secured perimeter of a facility; may participate in community work crews and do not require controlled movement within the facility where they are housed.
– About 73% have been sentenced to non-violent crimes. A majority of the minimum custody inmates are sentenced to Class 4, 5 & 6 felonies including Drug Offenses, DUI, Forgery, Theft, and Burglary.
– Average length of sentence is 4.4 years.
– 0.6% have security threat group affiliations.
– History of institutional violence: 18 violent disciplines per every 100 inmates.
Minimum Custody
4a.

• Medium Custody – Inmates representing a moderate risk to public and staff. May not work outside the secured perimeter of a facility unless under armed supervision and require limited controlled movement within the facility where they are housed.
– About 67% have been sentenced to violent crimes including Assaults, Sex Offenses, Robbery, and Weapons.
– About 33% have been sentenced for Drug Offenses, DUI, Forgery, Theft, and Burglary.
– Average length of sentence is 10.2 years.
– 6.6% have security threat group affiliations.
– History of institutional violence: 71 violent disciplines per every 100 inmates.
Medium Custody
4b.

• Close Custody - Inmates representing a high risk to public and staff; double-bunked; and require controlled movement within the facility:
– About 70% have been sentenced to violent crimes including Assaults, Robbery, Kidnapping, Murder, and Weapons.
– About 30% have been sentenced for Drug Offenses, Theft, and Burglary.
– Average length of sentence is 10.7 years.
– 25.8% have security threat group affiliations.
– History of institutional violence: 2 violent disciplines per inmate.
Close Custody
4c.

• Maximum Custody - Inmates representing the highest risk to public
and staff; majority are housed in single cells; escorted in restraints
when not in a cell.
– About 77% have been sentenced for violent crimes including
Assaults, Robbery, Kidnapping, Murder and Weapons.
– About 23% consist of: Drug Offenses, Theft, and Burglary.
– Average length of sentence is 13.0 years.
– 36.3% have security threat group affiliations.
– History of institutional violence: 3.5 violent disciplines per inmate.
Maximum Custody
4d.

Bachman L2
R=600 T=152 Rast L4/L5
R=404 T=0
ASPC-LEWIS
Total Capacity 5,234 on December 9, 2011
(Rated = 4,604 Temporary = 630)
Barchey L3
R=800 T=178
Stiner L3
R=800 T=300 Morey L4
R=800 T=0
Buckley L4
R=800 T=0
Complex Admin
Fleet
Sunrise/Eagle Point L2
R=400 T=0
5a.

ASPC-EYMAN
Total Capacity 5,211 on December 9, 2011
(Rated = 4,104 Temporary = 1,107)
SMU I L5
R=864 T=192
Rynning L4/L5
R=880 T= 0
Meadows L3
R=796 T= 330
Browning L5
R=768 T= 120 Cook L3
R=796 T= 465
Fleet
Complex
Admin
5b.

ASPC-LEWIS – MOREY UNIT (L4)
Total Capacity 800 on December 9, 2011
(Rated = 200 per Housing Unit)
housing
unit #2
housing
unit #1
housing
unit #3
housing
unit #4
kitchen/
dining
sally-port
ACI /
Vocational
detention
administration
medical for
prison complex
6a.

ASPC-EYMAN – SMU I (L5)
Total Capacity 1,056 on December 9, 2011
(Rated = 864 Temporary = 192)
kitchen
medical
administration
intake
sally-port
education
6b.

X X
X X
All Security Staff Posts
Funded & Filled
at 100%
Security Staff Reduced
by 565 FTE
Security Staff Less than
100% Funded & Filled
193 Security Staff FTE
Restored
Security Staff 100%
Funded and Filled
ADC Security Post Unit Staffing Example
“X” means post is filled 24 hours/7 days a week
“16” means post is filled 16 hours/7 days a week
X
X
X X
X X
16
16
FY 2005
COII FTE: 6,244
ADC Pop: 27,913
FY 2006
COII FTE: 5,679
ADC Pop: 28,379
FY 2013
COII FTE: 6,402
ADC Pop: 33,675
FY 2012
COII FTE: 6,209
ADC Pop: 33,881
Note: ADC Population is the inmate average daily population (ADP) for state run facilities only (does not include ADP for ADC inmates housed in
private prisons) 5-1 [rev. 011212]
7

8
0
50
100
150
200
250
300
350
400
FY07 FY08 FY09 FY10 FY11 FY12
178
231
307
329
362
188
50
71
89
62
82
41
Assaults on ADC Staff - with Injury
Assaults on ADC Staff
Staff Injuries
Updated 1/5/12 28.1%
29.0% 22.7%
18.8% 30.7%
21.8%
to 12-31-2011
9