arenosa creek surface water quality monitoring report
TRANSCRIPT

Arenosa Creek Surface Water Quality Monitoring Report
Brian Jonescu, Lucas Gregory Allen Berthold and Kevin Wagner
Texas Water Resources Institute
Texas Water Resources Institute TR-482October 2015

Page | 1
Arenosa Creek Surface Water Quality Monitoring Report
Segment: 2453C
Funded by: Texas Commission on Environmental Quality
Federal Grant # I9-8665307 State USAS Grant # 998817
Authored and Prepared by: Brian Jonescu, Lucas Gregory, Allen Berthold, Kevin Wagner
Texas A&M AgriLife Research – Texas Water Resources Institute
October 2, 2015
Texas Water Resources Institute Technical Report 482

Page | 2
Table of Contents List of Figures ...................................................................................................................... 3
List of Tables ....................................................................................................................... 4
List of Abbreviations ........................................................................................................... 5
Introduction ........................................................................................................................ 6
Monitoring Approach .......................................................................................................... 7
Texas Surface Water Quality Standards for Arenosa Creek ............................................... 8
Monitoring Findings ........................................................................................................... 9
Instantaneous Stream Flow.......................................................................................... 9
Water Quality Findings ................................................................................................... 11
Dissolved Oxygen (DO) .............................................................................................. 12
pH… ............................................................................................................................ 14
Specific Conductance .................................................................................................. 16
Turbidity ..................................................................................................................... 18
E. coli .......................................................................................................................... 20
Load Duration Curve Analysis ................................................................................... 23
Conclusions ....................................................................................................................... 25
References ......................................................................................................................... 27
Appendix A: Water Quality Data ...................................................................................... 28

Page | 3
List of Figures Figure 1. Sampling location and Station ID Number for the Arenosa Creek
watershed………………………………………………………………………………………… 8
Figure 2. Arenosa Creek streamflow distribution……………………………………………… 11
Figure 3. Arenosa Creek DO distribution…………………………………………………………. 13
Figure 4. Streamflow vs DO concentrations of Arenosa Creek..………………………….. 14
Figure 5. pH distribution for Arenosa Creek …………………………………………………. 15
Figure 6. Streamflow vs. pH of Arenosa Creek…………………………………………………. 16
Figure 7. Specific Conductance distribution of Arenosa Creek…………………………… 17
Figure 8. Streamflow vs. Specific Conductance of Arenosa Creek………………………. 18
Figure 9. Turbidity distribution of Arenosa Creek……….……………………………………. 19
Figure 10. Streamflow vs. Turbidity of Arenosa Creek……………………………………….. 20
Figure 11. Arenosa Creek E. coli distribution with the TCEQ primary contact recreation standard (126 cfu/100mL)……………………………………………….. 21
Figure 12. E. coli distribution comparison of TWRI and GBRA monitoring of Arenosa Creek……………………………………………………………………………………………… 22
Figure 13. Streamflow vs. E. coli concentrations of Arenosa Creek………………………. 23
Figure 14. Load Duration Curve for Arenosa Creek at County Road 103………………. 25
Page | 4
List of Tables Table 1. Sampling Site information and monitoring type………………………………….. 7 Table 2. Criteria for bacterial levels for different water body uses………………………. 9 Table 3. Measured stream flow at monitoring station over the one year study, mean, median, minimum and maximum…………………………………………… 10 Table 4. Summary statistics for water quality parameters over the one year study 12 Table 5. Needed bacterial loading reductions for different flow conditions in Arenosa Creek………………………………………………………………………………… 25 Appendix A. Water Quality Data…………………………………………………………………………. 28

Page | 5
List of Abbreviations AU Assessment Unit CFS Cubic Feet per Second CFU Colony Forming Unit DO Dissolved Oxygen EPA Environmental Protection Agency FDC Flow Duration Curve GBRA Guadalupe-Blanco River Authority LDC Load Duration Curve mg/L Milligram per liter mL Milliliter MPN Most Probable Number NTU Nephelometric Turbidity Units QAPP Quality Assurance Project Plan RUAA Recreational Use Attainability Analysis TCEQ Texas Commission on Environmental Quality TMDL Total Maximum Daily Load TSWQS Texas Surface Water Quality Standards TWRI Texas Water Resources Institute

Page | 6
Introduction The Arenosa Creek watershed is located within the larger Matagorda Bay watershed. Arenosa Creek is approximately 32.7 miles in length, and the 160.92 square mile watershed drains Calhoun, DeWitt, Jackson, Lavaca, and Victoria counties. Arenosa Creek originates at J2 Ranch Road, north of Victoria, and flows in a southeasterly direction until the confluence with Garcitas Creek. Within the watershed, pasture and cropland dominate the land use.
Arenosa Creek at County Road 103.
The Texas Commission on Environmental Quality (TCEQ) has assigned Arenosa Creek one Assessment Unit (AU), 2453C_01, in order to help assess the water quality of the creek. Prior to the start of this study, the Guadalupe-Blanco River Authority (GBRA) monitored the creek from 2001 until 2003. This monitoring informed TCEQ that Arenosa Creek did not meet the standards for Primary Contact Recreation for bacteria (126 colony forming units (CFU)/100 mL of E. coli). This impairment caused Arenosa Creek to be first listed on the TCEQ 2010 303(d) list for impaired water bodies. This project was initiated to provide updated water quality data for Arenosa Creek in order to determine the persistence of the bacterial impairment of the watershed, while also informing decision makers on potential remedial actions. Indicator bacteria, such as E. coli, are indigenous to the intestinal tracts and therefore feces of birds and warm-blooded animals. They are not normally harmful to human health, but can indicate the presence of pathogens that can cause disease. Typical sources of these bacteria in watersheds include birds and mammals (humans, livestock, wildlife, etc.) that are either directly deposited into a water body or enter diffusely through surface runoff.

Page | 7
This study was designed to understand overall trends in bacterial levels, along with determining if levels observed exceed the applied water quality standard. After completion of monitoring, data will be used by decision makers to help formulate management measures in order to address the water quality impairment.
Monitoring Approach Monthly grab samples were collected from a previously existing water quality monitoring station located on Arenosa Creek from September 2014 to August 2015. The site (Station 13295) is located 4.9 kilometers north of the City of Inez on County Road 103 (Figure 1; Table 1). Sampling dates were predetermined based on personnel availability and were not scheduled to either target or avoid specific flow conditions.
Table 1. Sampling site information and monitoring type.
TCEQ Station # Sample Type
Sampling Site Name
GPS Coordinates Latitude Longitude
13295 Routine Arenosa Creek @ County Road 103 28.94861 -96.803612
When the amount of water at the site was sufficient for flow measurements to be taken, a SonTek FlowTracker was used to measure the flow. On occasions where flow exceeded the capacity of the FlowTracker (≥2.5 ft deep), a SonTek RiverSurveyor M9 was used. Dissolved oxygen, pH, specific conductance, and water temperature were measured using a YSI EXO1 multiprobe. Turbidity was also measured using a Hach 2100Q Field Turbidity Meter. Observations about the water body were made in the field, including days since last precipitation event, flow severity, present weather, water surface conditions, primary contact recreation observations, and other observations related to the conditions of the stream and stream banks. Water samples were collected in a pre-labeled sampling container and transported to B-Environmental in Victoria, TX on ice in accordance with the project QAPP. Samples delivered were analyzed for E. coli using the IDEXX Colilert-18 method (TCEQ Parameter Code 31699).

Page | 8
Figure 1. Sampling location and Station ID Number for the Arenosa Creek watershed.
Texas Surface Water Quality Standards for Arenosa Creek Unless otherwise designated in the Texas Surface Water Quality Standards (TSWQS), all freshwater bodies in the state are protected for primary contact recreation. Primary contact recreation can be defined as activities that are presumed to have a significant risk of water ingestion such as wading by children, swimming, and tubing among others. As a result, a geometric mean of 126 cfu/100 mL must be maintained (TAC 2013, TCEQ 2010); otherwise, there is considered to be an elevated risk of contracting a gastrointestinal illness derived from the ingestion of pathogenic organisms associated with fecal material during contact recreation. If primary contact recreation does not occur in a given waterbody due to its physical attributes, inaccessibility or other factors, then other recreational uses (Table 2) can be designated through a special study known as a recreational use attainability analysis (RUAA). To evaluate a waterbody’s compliance with the designated water quality standard, a minimum of 20 samples must be collected within a 7-year period. Once 20 samples have been collected, the geometric mean of all samples collected within the most recent 7-year time frame must remain at or below the geometric mean to meet state standards. Samples collected during extreme hydrologic conditions (i.e. very high-flows and flooding) are not considered in water body assessments.

Page | 9
Similar to recreational use, all water bodies in the state have a designated Aquatic Life Use. Aquatic Life Use is the ability of a water body to support a healthy aquatic ecosystem and is measured through evaluation of dissolved oxygen (DO) criteria, toxic substances in water or sediment, and indices for habitat, benthic macroinvertebrate and fish community (TAC 2013). Within Arenosa Creek, DO measurements must have an average greater than 5.00 mg/L and must not be less than 3.00 mg/L (TCEQ 2012). Other basic water quality criteria that are used to support General Use designations in Arenosa Creek, including temperature, pH and specific conductance, were also recorded. No assessment of these parameters has been conducted on Arenosa Creek in recent years (TCEQ 2012).
Table 2. Criteria for bacterial levels for different water body uses.
Use Primary Contact
Recreation
Secondary Contact
Recreation I
Secondary Contact
Recreation II
Noncontact Recreation
Numeric Criteria
(geometric mean,
cfu/100mL)
126 630 1,030 2,060
Monitoring Findings
Instantaneous Stream Flow An instantaneous stream flow measurement was taken during routine monthly sampling at Arenosa Creek in order to determine the volume of stream flow at the time the sample was taken. This information is critical in understanding bacterial loading in the creek. Flow was taken whenever a sample was taken, unless unsafe conditions existed or when water was pooled and no flow was recorded (Table 3, Figure 2).

Page | 10
Arenosa Creek during the March monitoring event.
Flow ranged from 0 to 647.4 cubic feet per second (cfs) during the sampling period. The highest flow was recorded in March as a result of 4.17 inches of rain falling across the watershed during the 7 days prior to the sampling event. During January, no flow measurements were taken due to unsafe conditions. However, this flow was estimated using the Velocity-Area method. The stream was assumed to be an ellipsoid shape, with an area calculated using the equation-
𝐴𝐴𝐴𝐴 = 𝐷𝐴𝐷𝐷ℎ ∗12𝑆𝐷𝐴𝐴𝐴𝑆 𝑊𝑊𝑊𝐷ℎ ∗ 𝜋
Depth was found to be 4.8 feet and stream width was approximately 31.5 feet, with an area of 237.5 ft2. Discharge was calculated by multiplying the area of the stream channel by the speed of the channel estimated in the field. The speed of the channel was estimated to be 1.5 ft/sec. This event flow was then calculated as 356.26 cfs.
Table 3. Measured stream flow at monitoring station over the one year study, mean, median, minimum and maximum flow rate (cfs).*
Name Site # Flow Rate (cfs)
Mean Median Minimum Maximum
Arenosa Creek @ CR103 13295 85.12 0.639 0.0 647.4
*This includes the estimated 356.26 cfs flow for the January monitoring event. Analysis for the rest of this document will include this estimated flow value.

Page | 11
Figure 2. Arenosa Creek streamflow distribution.
Water Quality Findings Water quality in Arenosa Creek was monitored from September 2014 through August 2015. Data collected was submitted to TCEQ for inclusion in their statewide water quality database and use in future water body assessments. Graphical representations of the water quality of Arenosa Creek can be seen below in Figures 3 through 13. A summary of the major findings can be found in Table 4. Statistical analysis for these sections used a Linear Regression Analysis to calculate correlation and a Wilcoxon/Kruskal-Wallis Sum-Rank Test to determine if data collected by GBRA differed from the data collected by TWRI.

Page | 12
Table 4. Summary statistics for water quality parameters over the one year study.
Parameter Code Mean Median Minimum Maximum E. coli* 31699 364 306 47 2420 Water
Temperature 00010 20.30 23.1 8.55 27.9
Dissolved Oxygen** 00300 6.5 5.4 2.6 12.0
pH 00400 7.0 7.2 5.9 7.9
Specific Conductance 00094 444 386 55 977
Turbidity** 82078 44.9 31.6 5.5 158 *used the geomean rather than the mean **Only 11 dissolved oxygen, pH, specific conductance and turbidity measurements taken
Dissolved Oxygen (DO) The average DO recording was 6.5 mg/L with a maximum value of 12.0 mg/L and a minimum recording of 2.6 mg/L (Figure 3). The minimum value fell below the TCEQ minimum value standard. This reading occurred during a monitoring trip with no flow. There were no statistically significant correlations between streamflow and DO readings (r= 0.56; p=0.07), or E. coli concentrations (r=0.52; p=0.10). No DO reading was taken during the December 17, 2014 monitoring trip due to incorrect calibration of the YSI EXO1 multiprobe. When compared to DO data collected by the GBRA (values in parenthesis), the mean (6.94 mg/L), median (7.12 mg/L) and maximum (13.48 mg/L) values were all lower for the present study. The minimum value collected by GBRA of 1.03 mg/L was lower than the minimum value collected by TWRI. Despite these differences, DO data collected by TWRI were not significantly different than data collected by the GBRA (p= 0.40).

Page | 13
Figure 3. Arenosa Creek DO distribution.
0
2
4
6
8
10
12
14
Diss
olve
d O
xyge
n (m
g/L)
Arenosa Creek at CR103
Dissolved Oxygen (mg/L) Dissolved Oxygen Standard Dissolved Oxygen Minimum
Page | 14
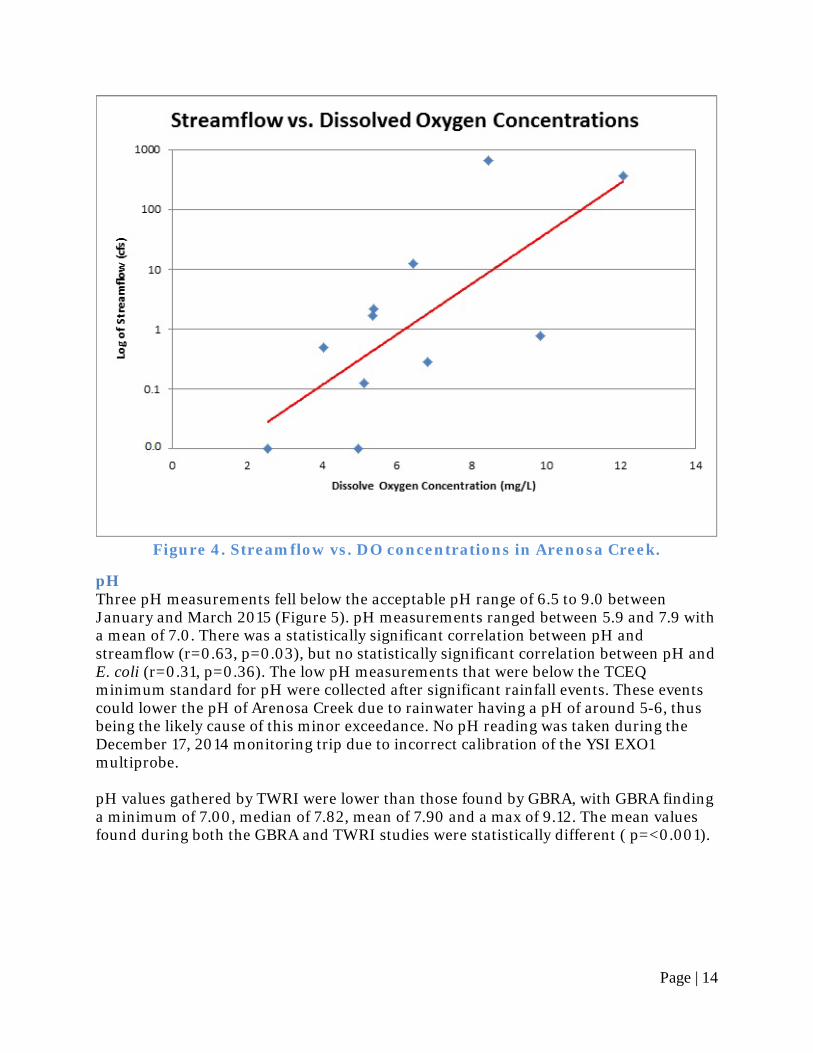
Figure 4. Streamflow vs. DO concentrations in Arenosa Creek.
pH Three pH measurements fell below the acceptable pH range of 6.5 to 9.0 between January and March 2015 (Figure 5). pH measurements ranged between 5.9 and 7.9 with a mean of 7.0. There was a statistically significant correlation between pH and streamflow (r=0.63, p=0.03), but no statistically significant correlation between pH and E. coli (r=0.31, p=0.36). The low pH measurements that were below the TCEQ minimum standard for pH were collected after significant rainfall events. These events could lower the pH of Arenosa Creek due to rainwater having a pH of around 5-6, thus being the likely cause of this minor exceedance. No pH reading was taken during the December 17, 2014 monitoring trip due to incorrect calibration of the YSI EXO1 multiprobe. pH values gathered by TWRI were lower than those found by GBRA, with GBRA finding a minimum of 7.00, median of 7.82, mean of 7.90 and a max of 9.12. The mean values found during both the GBRA and TWRI studies were statistically different ( p=<0.001).

Page | 15
Figure 5. pH distribution for Arenosa Creek.
0
3
6
9
12
pH
Arenosa Creek at CR103
pH pH acceptable range

Page | 16
Figure 6. Streamflow vs pH of Arenosa Creek.
Specific Conductance Specific conductance ranged from 55 μs/L to 977 μs/L, with an average of 444 μs/L (Figure 7). Unlike many of the previous water quality parameters, there was a significant correlation between specific conductance and streamflow (r= -0.65; p=0.03). However, the correlation between E. coli and specific conductance was not statistically significant (r= -0.32; p=0.33). No specific conductance reading was taken during the December 17, 2014 monitoring trip due to incorrect calibration of the YSI EXO1 multiprobe. Values collected previously by the GBRA had lower minimum (39 μs/L), median (369.5 μs/L) and mean (427.66 μs/L) specific conductance values than this study; however, data collected by TWRI were not significantly different than the data collected by GBRA (p=0.87).

Page | 17
Figure 7. Specific Conductance distribution of Arenosa Creek.
0
200
400
600
800
1000
Spec
ific
Cond
ucta
nce
(μs/
cm)
Arenosa Creek at CR103

Page | 18
Figure 8. Streamflow vs Specific Conductance in Arenosa Creek.
Turbidity Turbidity in Arenosa Creek averaged 45 NTU, with a range between 5 NTU and 158 NTU (Figure 9). Turbidity had the strongest correlation of all parameters with E. coli (r=0.83; p=0.03). Streamflow was also correlated with turbidity (r= 0.65, p=0.001). Turbidity values collected by GBRA showed minimum (2.8 NTU), median (20 NTU), mean (25 NTU) and maximum (98 NTU) values that were lower than values collected during this study. However, the mean of the data collected by TWRI was not significantly different than data collected by GBRA (p=0.19). No turbidity was taken on September 23rd due to not having the turbidity meter.

Page | 19
Figure 9. Turbidity distribution of Arenosa Creek.
0
30
60
90
120
150
180
Turb
idity
(NTU
s)
Arenosa Creek at CR103
Turbidity (NTUs)

Page | 20
Figure 10. Streamflow vs Turbidity in Arenosa Creek.
E. coli The geomean for E. coli of 364 cfu/100 mL continued to exceed the state water quality standard established by TCEQ to protect primary contact recreation (126 cfu/100mL); however, it was well within the secondary contact recreation standards (Figure 11). There was a strong correlation observed between E. coli concentrations and streamflow, with an r value of 0.72 (Figure 13). This correlation was statistically significant with a p-value of 0.007. However, it should be noted that the inclusion of the three high flow events and their corresponding E. coli values creates the significance of the observed correlation, with a weak correlation when these values are removed (r=0.22). Minimum, median, and geomean E. coli concentrations found during this study were higher than values found during the GBRA study (Figure 12). However the means of both studies were not significantly different (p= 0.32). While it appears that the spread of the GBRA study is greater than this study, half of the E. coli samples were analyzed using the MTEC method which does not have maximum values. Several important observations were noted by field staff during monthly monitoring trips that may explain several of the high E. coli concentrations. Field staff found several animal carcasses dumped in the creek or on the side of the bank on November 17th, May 13th and August 6th. In addition to the observation of fish carcasses being in the creek on

Page | 21
November 17th, a loose cow was seen near the creek with evidence that it had wandered within the creek. Elevated E. coli concentrations were observed on these dates potentially indicating that illegal dumping was impacting water quality at the site.
Figure 11. Arenosa Creek E. coli distribution with the TCEQ primary contact recreation standard (126 cfu/100mL).
0
500
1000
1500
2000
2500
3000
E. c
oli (
cfu)
Arenosa Creek at CR103
E. coli (cfu/100 mL) Primary Contact Recreation Standard (126 cfu/100mL)

Page | 22
Figure 12. E. coli distribution comparison of TWRI and GBRA monitoring of Arenosa Creek.
1
10
100
1000
10000
TWRI (2014-2015) GBRA (2000-2003)
E. c
oli c
once
ntra
tion,
CFU
/100
mL)
Monitoring Events
Arenosa Creek E. coli Distribution
TCEQ Primary Contact Recreation Standard (126 CFU/100mL) Geomean

Page | 23
Figure 13. Streamflow vs. E. coli concentrations of Arenosa Creek.
Load Duration Curve Analysis A Load Duration Curve Analysis (LDC) was performed for bacterial loading to Arenosa Creek (Figure 14). LDCs utilize paired streamflow and pollutant data (i.e. streamflow data and E. coli data that were collected on the same date). LDCs are simple analytical tools approved by the EPA for estimating pollutant loading reductions needed to achieve water quality standards (Babbar-Sebens and Karthikeyan 2009; Morrison and Bonta 2008). LDCs are constructed by first developing a flow duration curve (FDC). FDCs use each measured stream flow value and compare it to other measurements to determine the percentage of time this specific flow value is met or exceeded within the evaluated time period. The stream flow data are sorted from largest flow value to smallest and plotted versus percent of days that a specific flow level is expected to occur. Flow categories are developed to allocate data and commonly include high flows, moist conditions, mid-range flows, dry conditions, and low flows. For Arenosa Creek, these categorical breaks were adjusted to better fit the natural breaks observed in the recorded flow values. Only four flow categories were used including High Flows (≥200 cfs), Moist Conditions (10 – 200 cfs), Mid-Range (0.1 – 10 cfs) and Dry Conditions (≤0.1 cfs).

Page | 24
The FDC is then multiplied by the water quality standard and the appropriate unit conversion to establish the Total Maximum Daily Load (TMDL) line or the maximum allowable pollutant load. The monitored loading is approximated by plotting paired pollutant concentration (E. coli) data with recorded stream flow levels. Once plotted, the majority of E. coli data should be below the TMDL line, which indicates that the water body supports the applicable water quality standard. As seen in Figure 14, the majority of E. coli loading does not fall below this TMDL line. After the completion of the LDC, the general type of pollution responsible for the impairment can be identified. If exceedances are to the left side of the graph and in the high flow or moist condition categories, then nonpoint source pollution or sediment re-suspension driven by rain events are the primary cause of pollutant loading. Alternatively, exceedances in the dry condition and low flow categories implicate point source pollution, direct deposition, or streambed disturbance as the primary problems. LDCs do not enable specific sources of pollution to be identified nor do they allow the timing of the pollution event to be determined. Pollutant load reductions can also be ascertained from the LDC analysis by calculating the average difference between the TMDL line and a regression line through the E. coli values for each flow condition category. Data collected by the GBRA and TWRI were used in this LDC analysis. There were sufficient paired data points (44 paired streamflow and E. coli concentrations) to create a LDC that provided evidence of nonpoint sources of E. coli loading within Arenosa Creek. Reductions in E. coli loads are needed under high flows, moist conditions and mid-range flows to meet the primary contact recreation standard (Table 5). In several instances, E. coli samples were collected when the stream only maintained pools of water that were not flowing. These data are not reflected in the LDC as no E. coli load exists if flow is not present. This LDC assessment suggests that that non-point sources and resuspension of E. coli in stream bed sediment are the main drivers of the bacterial impairment in Arenosa Creek.

Page | 25
Figure 14. Load Duration Curve for Arenosa Creek at County Road 103
Table 5. Needed bacterial loading reductions for different flow conditions in Arenosa Creek.
Flow Condition % Exceedance
Needed % Reduction
Daily Loading (cfu/day)
Annual Loading (cfu/year)
High Flow 0-10% 93.06 2.96E+13 1.05E+16 Moist Conditions 10-25% 83.28 5.24E+11 1.87E+14 Mid-Range 25-60% 40.35 1.90E+09 6.75E+11 Dry Conditions 60-82% NA 2.62E+08 9.32E+10 No Flow 82-100% NA NA NA
Conclusions The goal of this monitoring was to validate and assess the E. coli impairment in Arenosa Creek. After the collection of one year of data, the data indicates that Arenosa Creek continues to have levels of bacteria that do not meet state standards to protect primary contact recreation. The geometric mean exceeds the currently applied primary contact recreation standard of 126 cfu set by TCEQ. The highest E. coli concentrations were observed during high flow events or when animal carcasses were observed in the water. Dumping of animal carcasses was observed on three occasions (i.e. 25% of the sampling
1000000
10000000
100000000
1E+09
1E+10
1E+11
1E+12
1E+13
1E+14
1E+15
(0) 10 20 30 40 50 60 70 80 90 100
E. co
li Lo
ad (c
fu/d
ay)
Percent of Days Load Exceeded
LDC for Station 13295 on Segment 2453C TMDLLoadEstHigh FlowsMoist ConditionsMid-RangeDry Conditions
≥200 cfs
10 - 200 cfs
0.1 - 10 cfs ≤0.1 cfs
No flow. Creek either pooled or dry.

Page | 26
events) and each time carcasses were observed in or near the water, E. coli concentrations were found to exceed water quality standards.
No primary contact recreation or evidence of it was observed at the monitoring site throughout the monitoring period. Water quality standards for recreation are currently being evaluated to determine if primary contact recreation is appropriate for Arenosa Creek. Should the state determine that a water quality standard other than primary contact recreation is appropriate, then that recommendation will have to be reviewed and approved by the U.S. Environmental Protection Agency before it would take effect. If enacted, newly applied standards could result in Arenosa Creek being removed from the Texas Integrated Report as an impaired water body as early as 2016.

Page | 27
References Babbar-Sebens, M. and R. Karthikeyan, 2009. Consideration of sample size for estimating contaminant load reductions using load duration curves. Journal of Hydrology 372:118-123.
Borel, K., & Karthikeyan, R. 2013. Support for the Aransas River and Mission River Watersheds Bacteria Assessment Using the Spatially Explicit Load Enrichment Calculation Tool. Texas A&M University, Biological and Agricultural Engineering.
Morrison, M.A., and J.V. Bonta. 2008. Development of Duration-Curve Based Methods for Quantifying Variability and Change in Watershed Hydrology and Water Quality. U.S. EPA Office of Research and Development, National Risk Management Research Laboratory, Cincinnati, OH, EPA/600/R-08/065, May 2008.
TAC §307. 2013. Texas Administrative Code: Chapter 307 – Texas Surface Water Quality Standards. Available online, accessed October 14, 2013 at: http://texreg.sos.state.tx.us/public/readtac$ext.viewtac
TCEQ. 2004. Atlas of Texas Surface Waters. GI-316. Austin: Texas Commission on Environmental Quality. Also available online at: http://tceq.texas.gov/publications/gi/gi-316
TCEQ. 2010. 2010 Guidance for Assessing and Reporting Surface Water Quality in Texas. Available online, accessed June 14, 2013 at: http://tceq.texas.gov/assets/public/compliance/monops/water/10twqi/2010_ guidance.pdf.
TCEQ. 2012. 2012 Texas Integrated Report for Clean Water Act Sections 305(b) and 303(d). Available online, accessed May 19, 2013 at: http://tceq.texas.gov/waterquality/assessment/waterquality/assessment/12twqi/twqi12

Page | 28
Appendix A: Water Quality Data
Date
Water Temper-
ature (°C)
Instant. Stream
Flow (cfs)
Specific Conductance (micro S/cm)
Dissolved Oxygen (mg/L)
pH (Standa
rd Units)
E. coli (MPN/ 100mL
)
Turbidity (FTU)
Days Since Last
Precipitation Event
Number of People
Observed Engaging in
Contact Recreation
Evidence of Primary Contact
Recreation?
Comments
9/23/2014 25.3 0.125 977.3 5.12 7.86 816 n/a 3 0 No Turbidity measurement not taken
due to not having a turbidity meter
10/21/2014 21.37 0 380.5 4.97 6.93 73 32.8 9 0 No No Flow
11/17/2014 9.4 0.781 711.5 9.85 6.8 225 5.45 4 0 No
Loose cow near stream; evidence of cow in stream; 3-4 dead fish in
stream; deer and racoon tracks near creek
12/17/2014 15.203 0 775.3 n/a 6.95 47 10.8 26 0 No
No Flow; DO measurement not included due to improper calibration
of equipment 1/12/2015 8.55 355 85.1 12.06 5.88 2419.6 158 1 0 No Flow estimated
2/11/2015 16.96 0.289 401.7 6.83 6.47 222 31.6 8 0 No
3/11/2015 14.57 647.4 54.9 8.44 6.39 2419 81.1 2 0 No Flood conditions
4/8/2015 23.1 2.182 315.8 5.39 7.2 91 46.3 3 0 No
5/13/2015 23.37 12.289 589 6.43 7.61 2419.5 82.5 0 0 No Dead fish carcasses along bank
6/10/2015 25.809 1.666 318.4 5.36 7.29 387 27.5 11 0 No
7/16/2015 27 0.497 386.3 4.04 7.26 107.6 11.2 15 0 No
8/6/2015 27.9 0 661.6 2.55 7.3 727 6.67 7 0 No No Flow; 2 dead fish located in
stream banks