are remittances good or bad: migrant’s remittances, real ... ur rehman... · are remittances good...
TRANSCRIPT

i
Are remittances good or bad: migrant’s remittances, real exchange
rate and financial sector development
By
Shams Ur Rehman
(MMS143069)
MASTER OF SCIENCE IN MANAGEMENT SCIENCES
(Finance)
DEPARTMENT OF MANAGEMENT & SOCIAL SCIENCES
CAPITAL UNIVERSITY OF SCIENCE & TECHNOLOGY
ISLAMABAD
JUNE, 2017

ii
Are remittances good or bad: migrant’s remittances, real exchange
rate and financial sector development
By
Shams Ur Rehman
(MMS143069)
A research thesis submitted to the Department of Management & Social
Sciences, Capital University of Science & Technology, Islamabad
In partial fulfillment of the requirements for the degree of
MASTER OF SCIENCE IN MANAGEMENT SCIENCES
(Finance)
DEPARTMENT OF MANAGEMENT & SOCIAL SCIENCES
CAPITAL UNIVERSITY OF SCIENCE & TECHNOLOGY, ISLAMABAD

iii
JUNE 2017
CERTIFICATE OF APPROVAL
Are remittances good or bad: migrant‘s remittances, real exchange rate and
financial sector development
By
Shams Ur Rehman : Reg # (MMS143069)
THESIS EXAMINING COMMITTEE
S No Examiner Name Internal / External Organization
(a) Dr. Hasan Muhammad Mohsin External PIDE, Islamabad
(b) Dr. Abdu l Jaleel Internal CUST, Islamabad
(c) Dr. Junaid Ahmed Supervisor CUST, Islamabad
________________________________
Dr. Junaid Ahmed Thesis Supervisor
June, 2017
___________________________ ___________________________
Dr. Sajid Bashir Dr. Arshad Hassan
HOD Management Social Sciences Dean Faculty of Management Sciences
Dated: June, 2017 Dated: June, 2017
CAPITAL UNIVERSITY OF SCIENCE & TECHNOLOGY
ISLAMABAD

iv
Certificate
This is to certify that Mr. Shams Ur Rehman, having Registration number MMS143069 has
incorporated all observation, suggestions and comments made by the external evaluators as well
as the internal examiners and thesis supervisor. The title of his Thesis is ―Are remittances good
or bad: migrant‘s remittances, real exchange rate and financial sector development‖.
Forwarded for necessary action
Dr. Junaid Ahmed
(Thesis Supervisor)

v
Copyright © 2017 by Shams Ur Rehman
All rights reserved. No part of the material protected by this copyright notice may be reproduced
or utilized in any form or by any means, electronic or mechanical, including photocopy,
recording or by any information storage and retrieval system without the permission from the
author.

vi
Dedication
This thesis is dedicated to my great father, beloved mother, my elder brother, teachers
and all those friends who have supported me since the beginning of this thesis. I thank my father
and brothers for the interest they showed in my studies and the motivation they gave me during
those trying times when I had doubts about my abilities.

vii
Acknowledgement
All praises to Almighty Allah, The most Gracious, Compassionate and Ever Merciful, Who
endowed me with the potential to complete this research.
I would like to express some word to gratitude to people who contributed in some ways to its
achievement.
First and foremost, I want to express my deepest gratitude to my supervisor Dr. Junaid Ahmed for
having given me the opportunity to work on this exciting research topic. I am also very grateful to
him for the time he spent listening, reading and commenting my works, and also for his many
constructive criticisms that enriched me. Thanks for all my teachers as well as all faculty members.
Also, I would like also to thanks to all my friends for their advices during MS studies at Capital
University and Technology, Islamabad.
Last but not least, thanks to my family for their endless love, social and financial support and
encouragement throughout my studies.
Shams Ur Rehman

viii
Table of Contents
CHAPTER 01 ………………………………………… ………………………….. 1
INTRODUCTION ………………………………….……………………………..… 1
1.1 Background of the study ………………………………….… …………..1
1.2 Migrant outflows to the developing world...………………………..……4
1.3 Objective of the study..……………………………………………..…….7
1.4 Research Questions ……………………………………………..………..8
1.5 Testing hypothesis …………………………………….....…….……..... .8
CHAPTER 02 ………………………………………………………………….…. .9
LITRERATURE REVIEW ………………………………………………..…….… .9
2.1 Remittances and real effective exchange rate……………...………...……9
2.2 Remittances and financial development……..………………………...…. 14
2.3 Remittances, real effective exchange rate and financial development….…22
CHAPTER 03 ………………………………………………………………..….........24
METHODOLOGY………………………………………………..…... ……………….24
3.1 Data and Sample selection ….…………………..……………..……………24
3.2 Empirical Strategy ……..……………..………..…..…..….………………. 26
3.3 Model Specification …….……………..…………………….…...…………27
CHAPTER 04 ……………………………………………………………….……… 29
RESULT AND DISCUSSION………………………………..………………...………29
4.1 Descriptive Statistics …………………….……………………..….……… 29
4.2 Correlation Matrix …………………..……………..…………..………….. 31
4.3 Empirical Findings…..……………..…………….…................................... 32
CHAPTER 05 ……………………………………………………….……….……… 44
CONCLUSION ………………………………………………………………………….44
REFRENCES ………………………………………………………..…………………. 46
APPENDIX A…………………………………………………………………………… 57
APPENDIX B…………………………………………………………………................ 58

ix
APPENDIX C…………………………………………………………………………… 59
APPENDIX D…………………………………………………………………………… 60

x
Tables of figures
S. No Name Page
Figure 1.1 Top ten remittance recipients developing
countries (USD billion, 2016e)
5
Figure 1.2 Top 10 remittances recipient‘s developing
countries in 2015 (% of GDP)
6
Figure 1.3 Financial flows to developing countries 7

xi
List of Tables
S. No Name Page
Table 3.1 Description of the variables 25
Table 4.1 Descriptive Statistics 29
Table 4.2 Correlation Matrix 32
Table 4.3 Remittances (% of GDP) and the real effective
exchange rate
34
Table 4.4 Remittances, Banking sector development and
Real effective exchange rate
38
Table 4.5 Remittances (% of GDP), market capitalization
(% of GDP) and real effective exchange rate
40
Table 4.4 Remittance (% of GDP), financial development
and real effective exchange rate
42

xii
Abstract
This study examines the impact of migrant remittances on real exchange rate through the role of
financial development. For this purpose, the study used panel data analysis of 37 remittances
dependent countries for the time period of 2000 to 2015. The study employed both static and
dynamic model. For static model, fixed effect model has been referred based on Hausman test.
However, to tackle the endogenity issue, the study further used Difference (GMM) and System
Generalized Method of Moment (GMM). Firstly, the study reveals the positive relationship
between real effective exchange rate and remittances. This means that the foreign exchange in
term of remittances increase the value of recipient currency which referred as Dutch Disease
effect. This Dutch Disease effect would worsen the recipient‘s country trade competiveness in
the global market. However, the effect would be attenuated in the recipient‘s countries with
deeper and more sophisticated financial market.
Keywords: Migrant remittances, real exchange rate, financial development

1
CHAPTER 1
INTRODUCTION
1.1 Background of the study
The labors exporting developing countries receive benefit from migration in the form of
remittances. Remittances represent the amount of income earned by emigrants from abroad, and
sent back to their home countries. Over the last decade the remittance flows has increased by
more than tenfold sent to developing countries. The migrant remittances are vital source of
foreign exchange for many labor exporting economies. Remittances are transferred through
various channels such as official bank channels, Money Transfer Operators MTO‘s (Western
Unior, MoneyGram etc.). However, the significant portion of remittances are unrecorded that
transfer via informal Hawala and Hundi channel. Due to the informal channels of transfer, the
actual size of remittances is difficult to measure. If migrants remittances sent through unofficial
channels are included, the remittances would be 50 percent more in amount (World Bank 2010.
Therefore, the limitation of the study in using the portions of remittance flows that is reported in
the official statistics. In 2015, recorded remittances reached to USD 440 billion to developing
countries, showing an increase of 0.9 percent over the preceding year (The World Bank 2015).
Similarly, officially flows of remittances recorded USD 406 billion in 2012, USD 351 billion in
2011, and USD 325 billion in 2010 accordingly (World bank, 2013). The significant increases in
remittances may be blessing for many developing countries in easing the credit constraints, and
overall improving the welfare of the recipients. Ratha, (2005); (Mughal and Makhlouf 2011)
suggested that flow of these remittances compared to the flow of other resources have proved
remarkably resilient. Therefore, we intend that a remittance depends on high developed financial

2
sector economies, because such economies can effectively channel the flow of remittances for
more productive activities. We thus anticipate that real exchange rate appreciation due to capital
inflows. Similarly, Orozco (2003) and Ratha (2007) suggested that during recessive stages in the
economic cycle, the remittances are considered as an important source of finance because
migrants sent more money back to their home countries from abroad to support their families.
From a development country perspective remittances are measured as an important source of
finance because it is used directly for household‘s consumption. World Bank, (2006) suggested
that remittances may therefore contribute to the stability and smooth consumption of receiving
economies. De et al., (2015) suggested that in the development economic perspective remittances
may generates several important contributions such as enhanced financial sector development
and tend to reduce poverty, improved access to education and health services, in addition
numerous multiplier effects by higher household expenditures. Rapoport and Docquier, (2006)
suggested that due to the expected benefits in the flow of remittances, it is also assumed that
remittances may discourage labor supply and induce conspicuous consumption. Also, the
financial flows appreciate the domestic currency, thus have minimal impact on country
development.
Lartey and Acosta (2008 and 2007) and Montiel (2006) suggested that the significant
inflows of remittances has also destabilizing outcome, in term of appreciation in real exchange
rate where (the significance share spent on nontrade-able goods and services), which depreciates
the export competitiveness of the recipient country and the phenomena so called Dutch Disease.
The capital flows appreciation discourages investment that can further destabilize
macroeconomic environment of the recipient‘s economies (Cordons, 1994). An exchange rate
appreciation with significant influx will not only affects the exports competitiveness but will

3
increase the gap in lead to current account deficits (Combes & Ebeke, 2011). Moreover, Barajas
et al., (2009) suggested that remittance also decreases the labor supply due to the increase in the
wealth of recipients household.
In a nutshell, the inflow of large amount of remittances have negative effect on the labor
exporting economies, thus the economic development of the countries are reducing due to the real
exchange rate appreciation in thereby depreciation of exports competitiveness. Different studies
have taken attention into the Dutch disease phenomena of labor sending developing countries, by
using different applied techniques, such as panel and time series data models. However, still the
issue is debatable empirically as still no consensus exist that remittances always affect positively
the real exchange rate. We can provide numerous studies from the empirical literature. If the
remittances increase by 1 percent in result the real exchange rate appreciate by about 22% for
Latin American and Caribbean regions (Amuedo-Dorantes & Pozo 2004). In another study,
Lopez-Cordova and Olmedo, (2005) suggested that a 1 percent increase as a percentage of GDP in
the inflow of remittance would decrease exports approximately between 0.2 percent and 0.4
percent. Moreover, Bourdet and Falck (2006) found for Cape Verde that remittances have
negative effect on external competitiveness.
On the other hand, World Bank, (2006) and Rajan and Subramanian (2005) suggested that
the increase in the flow of remittances have no affecting on export competitiveness. The
appreciation in real exchange rate creates negative effect on the flow of remittances, where the
significant amount spent on non-tradable good and services. The real exchange rate would
attenuate or disappear, in the event that such funds were channeled through investments. We
assume for our study that such decline in the recipient country depends on the level of financial
sector development (Acosta, et al., 2009a). In another study, (Mundaca 2009) explained that the

4
effect of migrant remittances on growth can also depends on the level of financial sector
development. Different studies such as Levine and Zervos (1998); Otker-Robe et al, (2007); King
and Levine, (1993) and Levine et al., (2000) explained that the rate of investments are generally
high in countries with high-developed financial sector. Therefore, we intend that a remittance
depends on high developed financial sector economies, because such economies can effectively
channel the flow of remittances for more productive activities. We thus anticipate that real
exchange rate appreciation due to capital inflows such as remittances would be weaker in
countries with deep and active financial sectors. In this study using more updated time period and
the sample of developing countries with at least 4 percent of remittances relative to GDP. The
figure is based on the median statistics. With the recent data and different sample we intend to
extends the earlier studies Christian, S. (2011) real exchange appreciation via capital inflows
(focused on FDI) and Acosta,et al., (2009b) on remittances flows.
1.2 Migrant remittances to the developing world
The movement of people across Worldwide has major economic, demographic and
cultural effects for both destination and origin countries. The United Nations (2015) analyzed
that the size of migrants from abroad, reached to 244 million in 2015, which is 175 million in
2000 and 154 million in 1990. This flow has been increased by 41 percent in the last 15 years
from 2000 to 2015. In term of population, the accounts of migrant across worldwide stock for a
relatively small share of total population, comprising around 2.9 % in 1990 to 3.3 % in 2015 of
the world‘s population.
Among the recipients, the top ten countries in 2016 India on the top of receiving about
65.5 billion USD following China receives about 65.2 billion USD of foreign remittances. At the
same time (in 2016) the collectively account of these two countries for approximately to one-

5
third amount of total remittances sent to emerging countries. Philippines is on the third place
receive about 29 billion USD followed by Mexico with 28 billion USD , Pakistan 20.3 billion
USD, Nigeria with 20 billion USD , Egypt with 18 billion USD , Bangladesh with 15 billion
USD, Vietnam with $13 billion, and finally Indonesia received 10 billion (World Bank, 2016).
Figure 1.1 Top ten remittance recipients developing countries.
Source: World Bank, 2016
In particular, as compared to high developing countries, remittances are considered as a
key source of financial development for smaller countries.
In Figure 1.2 top recipients in 2015 relative to the GDP were Nepal (32 percent), Liberia
(31 percent), Tajikistan (29 percent ), Kyrgyz Republic (26 percent), Haiti ( 25 percent), Moldova
( 23 percent), Gambi, The (22 percent), Samoa and Comoros (both 20 percent) and Honduras
65.5 65.2
29.1 28.1
20.3 20.0 18.4 14.9 13.4
9.8
USD billion, 2016e

6
received 18 percent of remittances relative to economic size (The World Bank 2016). Comparing
remittances with other financial flows, its account the second largest source of foreign exchange
earnings for emerging after (FDI), and surpass (ODA). Moreover, the flows of these remittances
compared to the other flow of resources have shown remarkably resilient. For instance, during the
global financial crises in 2009 remittances were dropped by 4.5 percent but rebounded in 2010. On
the other hand, FDI declined by 32.8 percent in 2009 from 2008. Similarly, the recorded flow of
FDI to emerging countries are estimated to have reached to 560 billion in 2015, decreased from
671.79 billion in the preceding year, the flow of official development assistance (ODA) reached to
135 in 2014 (Figure 1.3 ).
Figure 1.2: Top 10 remittances recipient‘s developing countries in 2015 (percent of GD
Source: World Bank, 2016
32.2 31.2 28.8
25.7 24.7 23.4 22.4
20.3 19.9 18.2
Nepal Liberia Tajikistan KyrgyzRep.
Haiti Moldova Gambia,The
Samoa Comoros Honduras
% of GDP, 2015

7
Figure 1.3. Financial flows to developing countries
Source World Bank 2016
1.3 Objective of the Study
To examine the relationship between remittances and real effective exchange rate.
Furthermore, to examine how financial sector development plays its role in weakening
the effect of real effective exchange rate in remittances dependent economies.
The implications of these findings are to know whether remittances appreciate the local currency
that further destabilize this affect would be reduced with a deep financial sector development other
than large and active stock market. Therefore, we intend to show whether remittances can more
effectively channel by well-developed financial sectors into investment opportunities.

8
1.4 Research Questions
1-Analyze whether the real effective exchange rate appreciates from the flow of
remittances?
2-Analyze whether appreciation in real effective exchange rate can be prevented with high
developed financial sector, as availability of financial services helps remittances to channel in a
productive use?
1.5 Testing Hypothesis
H0 = the flow of remittances are not related to real effective exchange rate depreciation.
HA = the flow of remittances are related to real effective exchange rate appreciation.
H0 = the real effective exchange appreciation are not related with financial sector
development
HA= the real effective exchange rate appreciation can attenuates with the availability of
developed financial sector.

9
CHAPTER 2
LITRATURE REVIEW
2.1 Remittances and real effective exchange rate
The existing literature relates remittances and real effective exchange rates in using both
time series and panel data. The roles of remittances for the receiving countries are considered to
be an important subject of empirical research, in order to formulate the appropriate policies to
channel these resources into productive investment.
The Salter (1959), Swan (1960), Corden (1960) and Dornbusch (1974) model used as
theoretical support to empirically test the impacts of the flows of external capital (i.e
remittances) on exchange rate for the sample of remittances dependent economies. This model
reveals that how external capital flows would appreciate the real effective exchange rate in
increasing the wise in economic growth. The study also shows that worker‘s remittances through
financial development increases economic growth and also found that in the appearance of
financial liberalization and trade openness the worker remittances plays a greater role in
international level is constant, the income increase following the capital flows result an increase
in spending, that further put pressure on the domestic demand in the economy. This process
would be named as a spending effect (Caves et al., 1982). The increase in the value of non-
tradable goods relative to tradable goods cause real exchange rate to appreciation. Similarly,
inputs such as labor and capital probably switch into domestic non-traded goods productions that
come across the rise in domestic demand. The resource movement effect generates from the rise
of non-traded sector.
10
Arize, et al., (2000) examined the relationship ship between real exchange rate volatility
and trade, in particular on the flow of exports. The study used quarterly data over the period
1973-1 to 1996-4 of 13 less developed countries. The study employed Johansen‘s multivariate
method for empirical analysis. The study exhibits that there is negative relationship between
remittances and real exchange rate volatility in both short run and long run time period.
Lucas and Stark (1985) argued remittances involves the formal mutually agreement
between family and the migrant. The latter send the money to his family in cash for basic needs
as well as for several different special motives. The migrant needs to ensure that his assets at
home are appropriately oversight, and his wants to enhance his family relationship so as to be
capable to return home self -respect. This study shows a positive relationship between recipient
income and remittances.
Kandil and Mirzaie (2003) examined that the effect of exchange rate fluctuations that
decomposed into trend and cyclical components. The demand sides of unanticipated exchange
rate fluctuation were primarily determined by exports, imports and local currency demand.
However, on the supply sides, the cost related to the imported intermediate goods. The study
shows that unanticipated exchange rates were more significant having manifold impacts on
growth and inflation.
Amuedo-Dorantes and Pozo (2004) studied the effect of migrants‘ remittances on the real
exchange rate for 13 Caribbean and Latin American countries. The study used panel data for the
analysis. The study reveals that remittances influx to these countries result a significant percent
increase in the real exchange rate. Moreover, the study shows that exchange rate appreciation due

11
to remittances, also cause loss in international competitiveness in the remittance receiving
countries.
Bussolo et al., (2007) examined remittances and real exchange rate for selected Latin
American economies based on highest remittances relative to output. . The study concludes with
empirical results that remittances significantly cause real exchange rate appreciation.
Muktarbek (2012) finds that remittances inflow can have an effect on domestic economy,
particularly in real exchange rate. Similarly, increase in remittances flow cause appreciation in
real exchange rate. These effects in general put upward pressure on the real effective exchange
rate, as receiving enormous financial flows originated from natural resource booms, remittances
or foreign aid. Lartey, Mandelman, and Acosta (2008) studied the effect of remittances on real
exchange rate regimes, and the Dutch Diseases effect. The study used panel data of 109
developing countries over the period 1990 to 2003. They empirical analyzed GDP per capita,
trade openness and GDP growth rate in using the Generalized Method of Moments (GMM). The
study shows trade openness is statistically insignificant. However, increased in remittances
would increase spending in developing economies that in results cause increase in non –tradable
goods, which further intensify the real exchange rate appreciation. The rise in the price of non-
tradable goods would results in resource shifts and thus decreases productivity in the
manufacturing (tradable) sector.
Bach and Solomon (2008) studied labor migration at a global level by using panel data
from 1990 to 2006. The study examined that whether remittances transfer responds to exchange
rate uncertainty, political risk and other macroeconomic determinants. They argue that
remittances and exchange rate have negative relationship. For instance, an increase in exchange
12
rate uncertainty. Likewise, political risk is negative with remittances flows, but statistically
insignificant. Finally, they suggest that favorable economic condition and sound political
environment are important factors to attract considerable share of the financial flows.
Acosta, et al., (2009a) suggested that the increase in remittances results to
macroeconomic volatility in the context of has on Salvadorian economy. They observed that rise
in remittances shows that rise in household income and as a result the non-tradable products also
rise. The study finds the usual exchange rate appreciation is established.
Acosta et al., (2009) also studied on the remittances and real exchange rate and suggested
that remittances lead to rise in real exchange rate. The study finds that the countries with more
advanced financial market are enhanced to improve the macroeconomic to test of increase of the
local currency as maintaining a competitive position. The study also assumes by using the same
data that if decrease in the currency occur, the amount by which currency decreases depends on
the capability of domestic economy to channel remittances in the direction of investment.
Rehman et al., (2010) examined foreign exchange and real exchange rate equilibrium in
the Pakistani context. The monthly data was collected for analysis from the periods 1993 (M7) to
2009 (M3). The study finds that real exchange rate would be appreciated substantially in case of
both migrant remittances and foreign direct investment (FDI).
Barrett, K. (2014) suggested that remittances and real exchange rate have negative effect
on the labor exporting economies, thus the economic development of the countries are reducing
due to the real exchange rate appreciation in thereby depreciation of exports competitiveness.
Different studies have taken attention into the Dutch disease phenomena of labor sending
developing countries, by using different applied techniques, such as panel and time series data

13
models. However, still the issue is debatable empirically as still no consensus exist that
remittances always affect positively the real exchange rate. We can provide numerous studies
from the empirical literature. If the remittances increase by 1 percent in result the real exchange
rate. The study suggests that the government spending, capital inflows and terms of trade in the
long term appreciate the real exchange rate. Nevertheless, insignificant relationships have been
found between remittances and real exchange rate in the short horizon.
Tuuli, M. (2015) observed for Ghana economy on the impact of remittances and real
exchange rate. The study used time series error correction model approach. The study found
appreciation of the real exchange rate due to remittances flow in both the long run and in the
short run.
Hyder and Mahboob (2006) investigated in case of Pakistan, on exchange rate
misalignment and equilibrium real effective exchange rate (EREER). They employed annual data
from the periods FY1978 to FY2005 by using Engle Granger co-integration technique. The study
shows that equilibrium real effective exchange rate (EREER) is determined by trade openness,
terms of trade, relative productivity differential, net capital inflows, workers‘ remittances, and
government consumption. Trade openness shows that the increase in capital inflows and
government consumption results in the depreciation of real effective exchange rate (REER), while
increase in improvement in terms of trade, migrants‘ remittances, and total factor productivity
relative to trading partner results in the appreciation of real effective exchange rate (REER). A 1
percent increase in migrants‘ remittances with respect to GDP is associated with 0.16 percent
appreciation in REER. A 1 percent increase in net capital inflows with respect to GDP is
associated with 0.02 percent depreciation in REER.

14
Hassan and Holmes (2013) studied on the long run relationship between remittances and
real exchange rate, through panel data selection for less-developed countries. The study is
collected through sample data and finds that remittances have significant effect on real exchange
rate appreciation for high- remittance recipient‘s countries.
Roy, R., and Dixon, R. (2016) studied the Dutch disease and remittances flows in the
South Asia context. They find that remittances have significant effect on real exchange rate. The
study finds that in less developed countries the growth can be enhances through financial
development thus remittances improving the financial resources.
Prakash, K. A., and Mala, A. (2016) study the Fiji economy in examines the impact of
remittances on real exchange rate. They found no impact of real exchange rate appreciation in
the long run. The study argued that significant flows of remittances channeled to productive
investment to increase domestic capacity which exerts no pressure on the domestic exchange rate
to appreciate. However, they argued that in the short run it appreciates due to increase in
remittances.

15
2.2 Remittances and financial development
The present works is on the rapport between remittances and financial sector
development. There are several studies that established the ability of financial intermediaries. In
general, Banerjee and Newmann, (1993), and Greenwood and Jovanovic (1990) studies focused
on credit to household and private firms through financial intermediaries from banks and
nonbank or access to loans. Generally, financial markets and growth has robust relationship and
received attention in the empirical literature. Schumpeter (1911) examined that financial sectors,
promotes economic growth and technological innovation by reallocating resources to
entrepreneurs. Levine and Zervos (1998) analysed that different services are provided by banks
and stock markets, although both stock market liquidity and banking development positively
predict productivity improvements, growth and financial accumulation. Beck et al., (2000)
empirically explained that financial development and growth have positive relationship and these
relationship works through total factor productivity. Wurgler (2000) suggested that investment
does not directly increased by financial development, but the economic growth would be
increases if the existing investment is better. The deep financial market is not the only way to
increase economic growth but high developed stock markets are also important factors for
economic growth (Beck & Levine 2004) and (Rousseau and Wachtel 2000). Demirguc-kunt et
al., (2011) illustrate that both stock market development and bank are associated independently
with growth. Billmeier and Massa (2007) suggested that stock market development is also a
measure of financial sector, which further associated with output growth. To measure the
financial sector development in the used both banking and financial sectors variables.

16
Mundaca (2009) analyzed growth and remittances nexus for Latin America and Caribbean
regions. They used panel data techniques over the period 1970 to 2003. The study established that
the growth effect of remittances will be strong in those countries with robust financial sector.
Ruiz-Arranz, M., and Giuliano, P. (2005) analyzed the empirical relationship of
remittances, financial development and economic growth for selected emerging economies. . The
study employed the data from 1975 to 2002.To control the endogeneity issue, they used System
GMM. The study finds that in less developed countries the growth can be enhances through
financial development Furthermore, the results also suggests that remittances improving the
allocation of financial resources, facilitate in easing credit constraints for the poor, substituting the
lack of financial development, and thus accelerating economic growth.
There are different studies on remittance which shows in different aspects these are like
impact of remittances on growth, education & health, income inequality. (Ratha 2013a) observed
that remittance enhancing the growth rate in the developing countries like Pakistan. The study
shows that remittance creates potential advantages related to the international migration for poor
people of the recipients in the developing countries like Pakistan.
Frank et al., (2009) studied on the links between remittances and insurance health care in
the America and find that either remittances received by the house hold were spending by health
care or not. The people living in the household that received remittances and they spend the
money on healthcare were more likely to be insured and in these case the remittances plays
significant difference effect between the receiving remittances and the non- receiving
remittances. While on the other hand the people living in the house hold and received
remittances but they did not spend the receiving money on health care were more likely to be

17
uninsured and in these case there were no significant difference effect between the receiving
remittances and the non-receiving remittances.
Ratha (2013b) studied on the impact of remittances on economic growth in the Africa
development context by using unbalanced panel data techniques from the period 1980 to 2004
for 37 African countries and found that in the less developed financial system the remittances
increases the growth rate by providing another source of finance investment. This study shows
that remittances have positive effect on economic growth rate and exactly important influence on
economic growth rate and the current level of gross domestic product (GDP) as financing of
human and physical capital. On the other hand Chami et al., (2003) studied 113 countries
concluded thirty year period and find that remittances and economic growth have negative
relationship, while IMF (2005) found no relationship between remittances and economic growth.
Similarly, Chami et al., (2003) also observed that remittances have a negative effect on economic
growth.
Giuliano and Ruiz-arranz (2006) suggested the links between economic growth and
remittances that how financial development influences the size of the economies. The study
covered 100 developing countries data and found that remittance rise growth in economy with
deep financially developed. It also suggests that remittances promote financial system where
there is no need of credit to the population. The study also analyzed the repeated properties of
remittance shows that they are mainly profit driven and usually procyclical.
Aggarwal et al., (2006) studied, economic growth and remittances that they have positive
and significant effect in the long run on the income growth while in the short run ODA has cause
positive with respect to income growth, remittances and financial development have negative

18
effect on the income level in the short run. This study observed that a remittance to financial
development gives the vast information of that remittances reducing poverty and enhancing
growth rate in economy. This study also observed that impact of remittances to the private sector
on bank deposit and on bank credit. In this study they show that a remittance plays a significant
role on bank deposit and credit to GDP. The study gives highly supported idea that remittances
promote financial development in developing countries.
Shahbaz (2007) studied on the relationship between remittances and financial development
by using time series data from the period 1971 to 2001 and finds the long run relationship by
employing Johansen co-integration technique and autoregressive distributed lag (ARDL)
approach. The result suggests that financial development can be promotes from remittances.
Furthermore, the study also suggests gross national product (GNP) per capita and increase in
exports promote the performance of financial sector development while increases in inflation
cushion the effects.
Service, E. (2014) analyzed the impact of remittances on financial development substitute
in economic growth by using panel data model of 66 developing countries for the period 1970 to
2005. They study found that financial development determines the effectiveness of national
banking system and displayed that the impact of remittances on economic growth is negative in
countries where bank efficiency is low and high in countries where bank efficiency is high.
Aggarwal et al., (2011) studied on the relationship between worker remittances and
financial sector development by share of deposit and credit to GDP, by using panel data of 109
developing countries data from the period 1975 to 2007. The study uses the fixed effect and
generalized method of moment (GMM) estimation in order to examine the relationship between

19
remittances and financial development. The study found that the impact of remittances on
financial development plays an important role in the economy because it enhances the growth rate
effects of financial development. The study also finds that there is a positive and significant
relationship between worker remittances and financial development in the receiver developing
countries after controlling opposite connection and dimension error effect.
Chowdhury, M. B. (2011) analyzed on the relationship between worker remittances and
financial development for Bangladesh. The study used a time series data over the period 1971 to
2008. The study found that the impact of worker‘s remittances on financial development plays an
important role in the economy and it is the 2nd
largest source of foreign exchange earnings.
Furthermore, the study reveals direct and significant relationship between remittances and
financial development.
Own and Me (2011) examined the interplay between remittances and financial
development. The data are collected in this study from Pakistani by using time series data from
the period 1980 to 2010, including Auto Regressive Distribution Lagged (ARDL), Ordinary
Least Square regression model and Error Correction Model approach to analyze the role of trade
openness and foreign aid in raising financial development to analyze the linkage between trade
openness and foreign aid in promoting financial development and also the linkage among
financial development and worker remittances. The study shows that there is no relationship in
the long run among worker remittances and financial development while in the short run there is
a significant and positive relationship among worker remittances and financial development. The
study also examined the ODA, trade openness and remittances that they have positive and
significant effect in the long run on the income growth while in the short run ODA has cause

20
positive with respect to income growth effect but trade openness, remittances and financial
development have negative effect on the income level in the short run.
Oke, et al., (2011) studied the impact of workers‘ remittances on financial development
in Nigeria from 1977 to 2009 by using ordinary least square estimation (OLS) and generalized
method of moment (GMM) estimation techniques and used two indicators to measure the
financial development. One is the ratio of money supply to GDP and the other is ratio of private
credit to GDP. The study found that remittances and financial development having positive and
significant effect on financial development in Nigeria with the exclusion of the ratio of private
credit to GDP. Remittances used for consumption purpose in the economy rather than production
function in the economy. It increases the liquidity as compared to loanable fund.
Fayissa and Nsiah (2012) studied the financial development and remittances with control
variable of exchange rate, size of migrant stock in both Africa and American regions. The study
uses panel data from 1985 to 2007 period including of 44 countries in which 25 countries were
from Africa and 19 countries from America. They find that financial development, exchange rate
and size of migrant stock have positive effect on remittances in both regions.
Cooray, A. (2012) studied the migrant remittances and financial development. The study
posits that remittances cause to increase in both size and efficiency of the financial sector
development.
Akkoyunlu, Ş. (2012) studied the direct relationship between remittances and financial by
taking evidence from turkey. The study is discovered by using time series data to find the
relationship between remittances and financial development. The study is conducted in the small

21
level as well as in high level. At the end of the study observed that there is no association
between financial development and remittances.
Brown et al., (2013) studied on the impact of remittances and financial development in
the micro as well as macro level by using panel data. In the macro level the data of 138 countries
used over the period 1970 to 2005. The study shows a negative relationship between remittances
and financial development in developing countries. In the micro level study the data are taken
between 1990 and 2007 and examine the relationship between remittances and household
financial literacy for two countries, Azerbaijan and Kyrgyzstan. In this level the study shows that
remittances and financial literacy having a negative relationship among remittance- receiving
households.
Sharif et al., (2013) studied that impact of remittances and financial development in the
case of Latin America and Caribbean region by using panel data method through using fixed and
random effect model. In order to investigates this effect the study taken the data from 1991 to
2010 from 29 Latin American and Caribbean region. The study found in research that there is
positive and significant relationship between remittances and financial development.
Kakhkharov, J. (2014) studied on the impact of remittances and financial development in
Central and Eastern Europe by using panel data through taking sample of 27 countries from the
period 1996 to 2003. The study shows that remittances have a significant and positive effect on
financial development and also analyzed that the effect of remittances on financial development
is particularly more in those countries where there are high share of remittances to GDP ratio.
Aziz et al., (2015) studied on the migrant‘s remittances and economic growth rate in the
role of financial development by using unbalanced panel data over the period 1980 to 2010 for

22
72 countries. After including the entire variable the data for 54 to 56 countries are shows valid
while other are invalid in dissimilar empirical mode. The study shows that financial development
make easy the change of worker remittances which may facilitate in productive investment and
there wise increases in economic growth. The study also shows that worker‘s remittances
through financial development increases economic growth and also found that in the appearance
of financial liberalization and trade openness the worker remittances plays a greater role in
economic growth as well as it‘s significantly and positively increases economic growth.
Coulibaly, D. (2015) suggested on the links between remittances and financial
development in the context of Sub-Saharan African by using panel data from the period 1980 to
2010. The study shows that remittances have positive linkage with financial development in 4
countries; these are Sierra Leone, Senegal, Sudan, and Niger. While in Gambia the financial
development have positive linkage on remittances. The study also shows through credit to
measure that only in Sudan remittances have positive and significant linkages with financial
sector development.
Ahmed and Martínez-Zarzoso (2016) studied that remittances and transaction cost using
gravity model approach. The study used bilateral data on remittances of 23 countries flows to
Pakistan. They find that transaction cost is negative associated with remittances, as higher cost
refrains each migrants from sending money back home. Moreover, they established that
remittances are significantly and positively related to financial sector development. Their finding
claims that well developed financial market positively impact remittances in the host and home
countries.

23
2.3 Remittances, real effective exchange rate and financial development
The explanation on the relationship among the migrant remittance inflows, financial
sector development and real exchange rate was explored by Acosta et al., (2009). The study is
collected through using a panel data set for 109 developing countries from the period 1990 to
2003 to transition economies. The study gives evidence real exchange rate might be appreciated
from the migrant‘s remittances. Furthermore, this effect is not stronger with deeper and active
financial market, which seems to remain external competiveness.

24
CHAPTER 3
METHODOLOGY
3.1 Data and Sample selection
This chapter shows the data collection, variables and methodology used to measure the
migrant remittances effect on real exchange rate and thier role of financial development. The study
employs panel data estimation techniques to test the relationship between migrant remittances and
real effective exchange rate with the role of financial development. We take the data of top annual
remittances-receiving countries of atleast 4 percent of remittances relative to GDP over the period
2000 to 2015.
Moreover, to examine the impact of financial sector development on the exchange rate, we
employ the measures—private credit as a share of GDP as proxies for financial development. The
data of remittances, domstic credit of GDP, real effective exchange rate, GDP per capita, trade
openness, general government final consumption as percentage of GDP, GDP growth, gross
capital formation, and market capitalization in percent of GDP proxied for capital market
development. All the data taken from World Development Indicators, World Bank (2016).
However, the term of trade data retrieved from Data Market website and the real and nominal
effective exchange rate data acessed from Brugel database. The detailed definaition of the
variables are presented in Table 3.1.

25
Table. 3.1 Description of the variables
Variable Description Source
Real effective
Exchange rate
REER is the nominal effective exchange rate divided
by a price deflator or index of costs.
World Bank
Migrants remittances A remittance is a transfer of money by a foreign
worker to a family back home.
World Bank
GDP Per Capita GDP per capita is gross domestic product relative to
population. Data are in constant 2010 USD.
World Bank
Trade Openness Trade is the sum of exports and imports of goods and
services measured as a share of GDP.
World Bank
GDP growth Annual percentage growth rate of GDP at market
prices. Aggregates are based on constant 2010, U.S.
dollars.
World Bank
Terms of trade The links between the directory of import prices and
the directory of export prices.
Data Market
General government
final consumption
expenditure
Its comprehensive are depends on constant
consumption 2010 USD. For purchases of goods and
services its shows all current expenditures of the
government such as spending on country wide
defense and security.
World Bank
Gross fixed capital
Formation
It‘s based on constant 2010 USD. It consist of
includes plant, equipment purchases, land
improvement; and machinery; and the construction of
hospitals, offices, private residential dwellings,
railways, roads, and the like, including schools,
industrial and commercial buildings.
World Bank
Domestic credit to
private sector by banks
It‘s provided financial resources to the sector by
other depository corporations, such as through trade
credits, purchases of non-equity securities, loans, and
other accounts receivable, that establish a claim for
repayment.
World Bank

26
Market Capitalization
of listed domestic
Companies relative to
GDP
Market capitalization (also known as market value) is
the share price times the number of shares
outstanding (including their several classes) for listed
companies divided by GDP.
World Bank
3.2 Empirical Strategy
We first applied Pooled OLS as benchmark to estimate the model specifications outlined
earlier. However, pooled OLS regression is used it typically overstates the exactness
improvement which lead to underestimated standard error and t-statistic (Cameron and Trivedi
2009). The pooled OLS, however, is only consistent if there is no correlation between
unobserved fixed effects and explanatory variables (Wooldridge, 2005). To deal with unobserved
heterogeneity, panel data approach is employed. Panel data are the repeated observations of same
cross- sectional time series dataset in which the different entities that is country, firms and
individuals carried out for several times periods.
Panel data may have time effect, individual country effect or both which can be study
through Fixed effect to deal with heterogeneity or random effect model if the country specific
effect is assumed to be random or uncorrelated with the independent variable or predictor in the
model.
Subsequently, we include fixed-(FE) and random-effects (RE) models. Hausman test is
used for finding that whether pooled OLS random effect model or fixed effect model. If null
hypothesis as insignificant relationship between individual effect and other regrossers are not
rejected then random effect model should to be preferred over fixed effect model. On the other
hand, if the results were significant after running Hausman test for random and fixed effect
models then fixed effect model should to be used.

27
In contrary to static model, Fixed and Random effect, dynamic GMM (Generalized
Method of Moments) deals the issue of endogeneity than in the static and OLS models that do
not let the routine of internal instruments. Moreover, the variables used in regression are not
correlated with the error term (including lagged variables) can be possibly used as valid
instruments (Arellano, 2003; Baltagi, 2005). It‘s challenging to find an external instrument to
address with endonegity problem. However, one solution is to used System GMM approach of
Arellano and Bover, (1995) and Blundell and Bond (1998), which uses appropriate lagged levels
and lagged first differences of the regressors as their instruments.
3.3 Model Specification
The benchmark panel regression specification is as follows
(
) ( ) ( ) ( )
(
) (
) ( )
( )
In the second we includes the financial sector development variable interacting with
remittances

28
(
) (
) (
) ( )
( ) ( ) (
)
(
) ( )
( )
Where REER is the real exchange rate index, ,
represents personal remittances
received in percentage of GDP, represents GDP per capita, , represents
financial development (bank credit or deposits as a share of GDP) and market capitalization of
listed domestic companies in a percentage of GDP, shows trade openness,
represents term of trade,
represents general government final consumption expenditure in
percentage of GDP,
represents gross fixed capital formation in percentage of GDP, and
represents GDP growth. is unobserved country-specific effect, ln represents variable in
the logarithmic form.

29
CHAPTER NO.4
RESULTS AND DISCUSSION
This chapter includes descriptive statistics, correlation matrix and finally empirical
analysis.
4.1 Descriptive statistics
Descriptive statistics is used to check the pattern of all dependent and independent
variables. The result of descriptive statistics (includes number of observation, mean, standard
deviation, minimum, and maximum) are shown in Table 4.1.
Table 4.1: Descriptive Statistics
Variables Obs. Mean S.D Min Max
REER 752 103.1874 15.60139 47.6 251.5
Rem/GDP 725 11.81785 9.133609 0.2 61.9
REM 698 2895.508 4318.391 1.2 25531.17
GDPPC 746 2853.564 2305.213 270.3 14243.6
trade openness 726 87.7051 38.2871 24.2 321.6
TOT 608 1.000381 0.1602595 0.447826 2.01538
Govt Spend/GDP 691 14.13401 5.581017 3.5 39.6
GFCF/GDP 680 21.81279 6.803871 4 48.4
GDPG 746 4.103887 3.950883 -30.1 33.7
DCPSB 744 34.48683 21.58436 0.8 114.7
MCLDC (GDP) 234 30.89316 71.65459 0.1 890.8

30
Table 4.1 shows the statistics pattern of dependent variable which is real effective
exchange rate, and independent variable which are personal remittances, remittances to GDP,
financial development, term of trade, GDP per capita, trade openness, trade % of GDP, general
government final consumption expenditure % of GDP, gross fixed capital formation, domestic
credit to GDP, market capitalization of listed domestic companies.‖
In Table 4.1 the average value of real effective exchange rate is 103.1874 shows that the
weighted average of country‘s relative to other major currencies are adjusted for the effects of
inflation, minimum and maximum value are 47.6 and 251.5 respectively, with the standard
deviation of 15.60139. The average value of remittances to GDP is 11.81785, minimum and
maximum values are .2 and 61.9 respectively, with the standard deviation of 9.133609. The
average value of real remittances in USD million is 2895.508, minimum and maximum value is
1.2 and 25531.17 respectively, with the standard deviation of 4318.391. The average value of
GDP per capita constant 2010 is 2853.564, the minimum and maximum value are 270.3 and
14243.6 respectively, with the standard deviation of 2305.213. The average value trade openness
is 87.7051, minimum and maximum values are 24.2 and 321.6 respectively, with the standard
deviation of 38.2871. The average value of terms of trade is 38.2871, minimum and maximum
values are .447826 and 2.01538 respectively, with the standard deviation of .1602595. The
average value of general government final consumption with respect to GDP is 14.13401,
minimum and maximum values are 3.5 and 39.6 respectively, with the standard deviation of 3.5.
The average value of gross fixed capital formation with respect to GDP is 21.81279, minimum
and maximum values are 4 and 48.4 respectively, with the standard deviation of 6.803871. The
average value of GDP growth is 4.103887, minimum and maximum value are -30.1 and 33.7
respectively, with the standard deviation of 3.950883. The average value of domestic credit to

31
private sector by banks is 34.48683, minimum and maximum values are .8 and 114.7
respectively, with the standard deviation of 21.58436. Finally the mean value of market
capitalization of listed domestic companies with respect to GDP is 30.89316, minimum and
maximum are .1 and 890.8 respectively, with the standard deviation of 71.65459.
4.2. Correlation Matrix
To check the collinearity in the explanatory used in the analysis, we conduct the pair wise
correlation of all independent variables. It shows the direction of relationship between two
variables in the form of positive and negative series starting from 1 with highest correlation and
o with lower correlation between independent variables. When the value of correlation is zero
then there will be no correlation between variables similarly when the value of correlation is 1
then there is perfect correlation exists between variables. The problem of colllinearity can reduce
parameter variance estimates under certain conditions (Greene 1990, and Johnston, J., &
DiNardo, J., 1984). The slightly significant correlation between the general government financial
consumption and trade openness exists about 50.4 percent. However, when the values exceeds 70
percent of the correlation, than collinearity problem will be existed among explanatory variables
(Kennedy, 1998).The result in Table 4.2 depict that no multi collinearity problem has been
found among explanatory variable used in the study.

32
Table 4.2 Correlation Matrix
Variables 1 2 3 4 5 6 7 8 9 10
1 1
2 -0.08 1
3 0.17 -0.15 1
4 0.32 -0.36 0.16 1
5 0.13 -0.34 0.039 0.44 1
6 0.19 -0.44 0.34 0.50 0.20 1
7 0.11 -0.41 0.16 0.39 0.31 0.16 1
8 -0.11 0.02 -0.07 -0.04 0.073 -0.22 0.16 1
9 0.03 0.06 0.40 0.42 0.32 0.07 0.28 0.10 1
10 0.004 0.07 0.032 0.114 0.113 0.07 0.032 0.008 0.19 1
Note: 1 shows Remittances (% of GDP), 2 shows real remittances, 3 shows terms of
trade, 4 shows GDP per capita (USD), 5 shows trade openness (GDP), 6 shows General
Government final consumption expenditure (% of GDP), 7 shows Gross fixed capital formation
(% of GDP), 8 shows GDP growth (annual %), 9 shows Domestic credit to private sector by
banks (% of GDP), 10 shows Market capitalization of listed domestic companies (% of GDP).
4.3 Empirical Findings
In the final section, the relationship between remittances and real exchange appreciation
has been examined. The study used a variety of panel regression model, such as static (Fixed and
Random Effect) and dynamic model (Difference GMM and System GMM). This study checks
the effect of different variable on real effective exchange rate using panel data techniques. Panel
data having the two magnitudes of data such as cross sectional data and time series data. The
empirical results presented below.

33
The study estimated real effective exchange rate on remittances/GDP one of our variable
of interest, GDP per capita, trade openness, term of trade, general government final consumption
relative to GDP, gross fixed capital formation relative to GDP and GDP growth.

34
Table.4.3 Baseline Model: Remittances (% of GDP) and the real effective
exchange rate
(1) (2) (3) (4) (5)
VARIABLES Pooled OLS Fixed
Effect
Random Effect Difference
GMM
System GMM
Ln (Rem/GDP) 0.0280 0.0323 0.0171 0.0190*** 0.0119*
(0.0206) (0.0264) (0.0222) (0.00613) (0.00623)
Ln (GDPPC) 0.116*** 0.389*** 0.0550*** 0.188*** 0.0389***
(0.0258) (0.0846) (0.0166) (0.0270) (0.0148)
Ln (trade openness) -0.179*** -0.215*** -0.167*** -0.121*** -0.134***
(0.0641) (0.0603) (0.0534) (0.0164) (0.0162)
Ln (TOT) -0.0658 -0.00172 0.0173 0.0587*** 0.0752***
(0.0469) (0.0592) (0.0466) (0.0189) (0.0191)
Ln (Govt
Spend/GDP)
0.0479
(0.0569)
0.0606
(0.0468)
0.0370
(0.0459)
0.0654***
(0.0169)
0.0472***
(0.0150)
Ln (GFCF/GDP) 0.0869** 0.0795 0.0808** 0.0669*** 0.0749***
(0.0430) (0.0494) (0.0376) (0.0136) (0.0133)
Ln (GDPG) -0.00416* -0.00253 -0.00185 0.00135* 0.00219***
(0.00218) (0.00160) (0.00188) (0.000731) (0.000757)
Observations 561 561 561 554 561
R-squared 0.514
Number of country 37 37 37 37 37
Country FE YES YES YES YES
Year FE YES YES YES YES
Hausman Test Prob>chi2
= 0.0032
Robust standard errors in parentheses
*** p<0.01, ** p<0.05, * p<0.1
GGFC shows general government final consumption, GFCF shows gross fixed capital

35
formation (GDP)
The coefficient in Column 5, Table 4.3 is 0.0119* shows that remittances have positive
relationship with real effective exchange rate and statistically significant at 10 percent level. The
intuition behind the positive and significant result that increased in remittances would increase in
spending in non –tradable goods. This further increases the value of local currency to appreciate,
which is the main indication of cause disease phenomena. The results are in line with the
previous remittances and exchange rate literature((Barajas et al., 2009). However, in contrary
Özcan, B. (2011) using a data of 10 recipient shows that remittances and real exchange rate have
negative and significant on real exchange rate , thereby increasing the trade competiveness.
GDP per capita having a positive and has a highly significant effect on real exchange
rate, thus implying that higher income level tend to appreciate the exchange rate as predicated by
Balssa and Samuelson effect.
The coefficient in Column 5 in Table 4.3 is 0.0389*** shows that GDP per capita is
positive and statistically significant relationship with real effective exchange rate at 1 percent
significance level. (Muktarbek, A. 2012) also found significant relationship between real
effective exchange rate and GDP per capita. However, Louis et al, (2011) suggested that GDP
per capita not always significant although it has the expected signs.
The coefficient in Column 5 in Table 4.3 is -0.134***shows that trade openness are
negative and statistically significant relationship with real exchange rate at 1 percent level. Trade
openness increase in quota and decrease in tariff, decrease the domestic price of tradable goods
and thus results in both substitution and income effect, the depreciation in trade leads to
depreciation in real exchange rate.

36
Calderon, C. a, and Kubota, M. (2009) also found that trade openness have the negative
and significant relationship with real exchange rate. The study further shows that trade openness
helps to attenuate shocks and the ability to smooth shocks to real effective exchange rate is
weaker in countries with greater level of output concentration. It may be due to that trade
openness reduces the difficult chances of declining in the real exchange rate.
Similarly, (Hau 2002) in relating real effective exchange rate and trade openness, finds that it
has negative and statistically significant relationship, that if economic integration across the
spreading of world trade decreases the real exchange rate. Martins (2012) also established that
increase in trade openness cause to decrease in real exchange rate.
The coefficient in Column 5 in Table 4.3 is 0.0752*** shows that term of trade persuades
the real exchange rate appreciation having a statistically significant relationship at one percent
significance level. It can be explained that the positive distress of price of exports comparative
to imports may results in real exchange rate appreciation.
Regarding government consumption and real exchange rate, the study finds positive and
statistically significant effect. It reveals that if government spending increases by 1 percent with
respect to GDP then real effective will also be appreciate about 4.7 percent it means that
government consumption is dominated by non-tradable goods.
The coefficient in Column 5 in Table 4.3 is 0.0749*** shows that real effective exchange
rate and gross fixed capital formation having a positive and statistically significant relationship
with 1 percent significance level.

37
The coefficient in Column 5 in Table 4.3 is 00219*** shows that GDP growth and real
exchange rate have positive and significant relationship with exchange rate with 1 percent.
Finally, the GDP growth have positive and significant sign suggest that more the
economic grows; more the exchange rate would appreciate.
In Table 4.3 the result also shows that R- Squared value is 0.514 which shows that 51.4
percent variations explained by all independent variables used in the model. The Hausman test
suggests using Fixed Effect model rather than using Random Effect as the p-value of Chi-square
is less than 5 percent.

38
Table.4.4 Remittances, Banking sector development and Real effective exchange rate
(1) (2) (3) (4) (5)
VARIABLES Pooled
OLS
Fixed Effect Random
Effect
Differenced
GMM
System
GMM
Ln (Rem/GDP) -0.0518 0.0456 -0.00972 0.0540*** 0.0334***
(0.0500) (0.0401) (0.0438) (0.0103) (0.00968)
Ln (DCPSB*
Rem/GDP)
0.0261**
(0.0115)
-0.00485
(0.0118)
0.00838
(0.0114)
-0.0152***
(0.00342)
-0.0101***
(0.00316)
Ln (GDPPC) 0.0612*** 0.397*** 0.0391** 0.230*** 0.0523***
(0.0210) (0.0900) (0.0170) (0.0281) (0.0153)
Ln (trade openness) -0.173*** -0.208*** -0.155*** -0.0986*** -0.124***
(0.0598) (0.0639) (0.0534) (0.0178) (0.0172)
Ln (TOT) -0.0755* -0.000923 0.00774 0.0538*** 0.0760***
(0.0441) (0.0602) (0.0475) (0.0192) (0.0195)
Ln (Govt
Spend/GDP)
0.0392
(0.0500)
0.0672
(0.0466)
0.0333
(0.0426)
0.0877***
(0.0172)
0.0596***
(0.0152)
Ln (GFCF/GDP) 0.0680 0.0787 0.0705** 0.0720*** 0.0810***
(0.0420) (0.0488) (0.0347) (0.0137) (0.0135)
Ln (GDPG) -0.00309 -0.00233 -0.00131 0.00141* 0.00235***
(0.00214) (0.00157) (0.00185) (0.000752) (0.000784)
Observations 557 557 557 548 557
R-squared 0.512
Number of country 37 37 37 37 37
Country FE YES YES YES YES
Year FE YES YES YES YES
Hausman Test Prob>chi2
=
0.0000
Robust standard errors in parentheses
*** p<0.01, ** p<0.05, * p<0.1

39
Table 4.4 presents the augmented model with bank sector variable interacting with
remittances. In this study we postulate that strong financial sector development can assists to
channel remittances into productive use and thus offsets the real exchange appreciation effects.
We introduce the domestic credit to private sector by banks as proxy for financial
development and interacted with remittances.
The result of System GMM is shown in the Table 4.4 Column 5. All the variables used in
the regression exhibits the expected sign. The interaction term of remittances with financial
development shows that an increase of 1 percentage in the remittances complementing by
financial development originate the real exchange rate depreciation of about 1.0 percent points,
the coefficient is statistically significant at 1 percent significance level. This mean that exchange
rate appreciation due to remittances flows will be attenuated in countries with stronger financial
sector development.

40
Table 4.5 Remittances (% of GDP), market capitalization (% of GDP) and real effective
exchange rate
(1) (2) (3) (4) (5)
VARIABLES Pooled OLS Fixed
Effect
Random Effect Difference
GMM
System
GMM
Ln (Rem/GDP) 0.0308 0.0432* -0.00832 0.0366*** 0.0277***
(0.0284) (0.0230) (0.0319) (0.00663) (0.00780)
Ln(MCLDC
*Rem/GDP)
-0.00702
(0.00534)
-0.0163***
(0.00370)
0.00510
(0.00652)
-0.00522*
(0.00304)
-0.00274
(0.00249)
Ln (GDPPC) 0.369*** 0.513*** 0.00775 0.335*** 0.132***
(0.0733) (0.0838) (0.0242) (0.0434) (0.0323)
Ln (trade openness) -0.233*** -0.153** -0.0398 -0.129*** -0.0902***
(0.0838) (0.0704) (0.0421) (0.0239) (0.0254)
Ln (TOT) 0.0731 0.105* 0.0640 0.0366 0.0211
(0.0558) (0.0545) (0.0786) (0.0303) (0.0324)
Ln (Govt
Spend/GDP)
0.0267
(0.0736)
0.0883*
(0.0510)
-0.0505
(0.0406)
0.0454**
(0.0211)
0.0144
(0.0231)
Ln (GFCF/GDP) 0.138** 0.0867*** 0.0201 0.0536** 0.0229
(0.0625) (0.0280) (0.0421) (0.0223) (0.0229)
Ln (GDPG) -0.00638*** -0.00427* -0.00279 -0.000242 0.00262**
(0.00186) (0.00232) (0.00260) (0.000995) (0.00114)
Observations 198 198 198 181 198
R-squared 0.832
Number of country 37 37 37 37 37
Country FE YES YES YES YES
Year FE YES YES YES YES
Hausman Test Prob>chi2 =
0.0000
Robust standard errors in parentheses
*** p<0.01, ** p<0.05, * p<0.1

41
Table 4.5 reports the results of regressing the real exchange rate on inflows of
remittances keeping into account the role of capital market variable interacting with remittances.
In this study, we postulate that strong capital market development can assists to channel
remittances into productive use and thus offsets the real exchange appreciation effects.
We introduce the market capitalization with respect to GDP as proxy for capital sector
development and interacted with remittances. In the following, we provide significance evidence
for our argument. We find that remittances significantly depreciate the real exchange rate when
an interaction term of remittances and market capitalization allowed for.
The result of Difference GMM is shown in the Table 4.5 Column 4. The interaction term
of remittances with capital market development shows that an increase of 1 percentage in the
remittances complementing by capital market improvement originate the real exchange rate
depreciation of about 0.5 percent points, the coefficient is statistically significant at 10 percent
significance level. This mean that exchange rate appreciation due to remittances flows will be
attenuated in countries with stronger financial sector development. However, the system GMM
results exhibits negative relationship, but statistically trivial.
Furthermore, all the variable remittances as well as other control variable are statistically
significant except government expenditure, government fixed capital formation and GDP
growth.
42
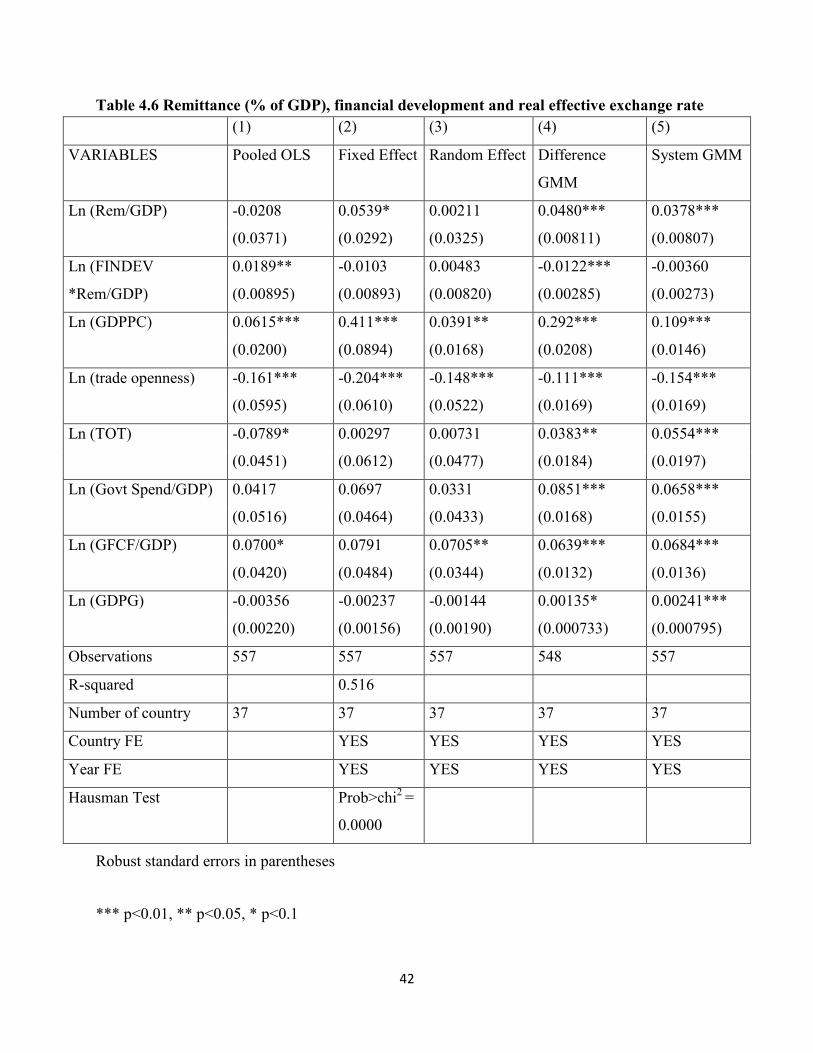
Table 4.6 Remittance (% of GDP), financial development and real effective exchange rate
(1) (2) (3) (4) (5)
VARIABLES Pooled OLS Fixed Effect Random Effect Difference
GMM
System GMM
Ln (Rem/GDP) -0.0208 0.0539* 0.00211 0.0480*** 0.0378***
(0.0371) (0.0292) (0.0325) (0.00811) (0.00807)
Ln (FINDEV
*Rem/GDP)
0.0189**
(0.00895)
-0.0103
(0.00893)
0.00483
(0.00820)
-0.0122***
(0.00285)
-0.00360
(0.00273)
Ln (GDPPC) 0.0615*** 0.411*** 0.0391** 0.292*** 0.109***
(0.0200) (0.0894) (0.0168) (0.0208) (0.0146)
Ln (trade openness) -0.161*** -0.204*** -0.148*** -0.111*** -0.154***
(0.0595) (0.0610) (0.0522) (0.0169) (0.0169)
Ln (TOT) -0.0789* 0.00297 0.00731 0.0383** 0.0554***
(0.0451) (0.0612) (0.0477) (0.0184) (0.0197)
Ln (Govt Spend/GDP) 0.0417 0.0697 0.0331 0.0851*** 0.0658***
(0.0516) (0.0464) (0.0433) (0.0168) (0.0155)
Ln (GFCF/GDP) 0.0700* 0.0791 0.0705** 0.0639*** 0.0684***
(0.0420) (0.0484) (0.0344) (0.0132) (0.0136)
Ln (GDPG) -0.00356 -0.00237 -0.00144 0.00135* 0.00241***
(0.00220) (0.00156) (0.00190) (0.000733) (0.000795)
Observations 557 557 557 548 557
R-squared 0.516
Number of country 37 37 37 37 37
Country FE YES YES YES YES
Year FE YES YES YES YES
Hausman Test Prob>chi2
=
0.0000
Robust standard errors in parentheses
*** p<0.01, ** p<0.05, * p<0.1

43
Next in Table 4. 6, we combined both capital and banking sector proxy to measure the
country overall financial development. The difference GMM result shows significant negative
relationship of remittances and real exchange rate in allowing the importance of both capital and
banking sector development. The result suggests that if the interaction term remittances with
financial development changes by 1 percent point, the real exchange rate depreciate by 1.2
percent. The results corroborates the finding of Acosta et al., (2009), shows that financial
development can attenuate real exchange rate appreciation that is generating with increase in
remittances flows.

44
CHAPTER 05
CONCLUSION
Remittances flows are increasingly becoming an important source of international finance
for several developing countries in comparing with other financial flows such as Foreign Direct
Investment (FDI), and Official Development Assistance (ODA). This study examined the impact
of migrant remittances on real effective exchange rate through the role of financial development.
The study used panel data analysis of 37 remittances dependent countries for the time period of
2000 to 2015. For this purpose, we used both static and dynamic data technique and a panel of 37
top recipients‘ countries for the sample period 2000 to 2015. For static model, fixed effect model
has been preferred based on Hausman test. However, to tackle the endogenity issue, the study
further used Difference and System Generalized Method of Moment (GMM). Finally, the study
interprets our result based on System GMM.
To investigate the relationship between remittances and real effective exchange rate, we
also used other control variable that is, GDP per capita, general government consumption
expenditure relative to GDP, gross fixed capital formation relative to GDP, GDP growth, term of
trade, and trade openness.
The name of the countries are given below
Namely, Albania, Armenia, Bangladesh, Bosnia and Herzegovina, Comoros, Dominican
Republic, Egypt Arab Rep., El Salvador, Fiji, Gambia the, Georgia, Guatemala, Guyana, Haiti,
Honduras, Jamaica, Kyrgyz Republic, Latvia, Lebanon, Lesotho, Liberia, Moldova, Morocco,
Nepal, Nicaragua, Nigeria, Philippines, Samoa, Senegal, Serbia, Sri Lanka, Tajikistan, Togo,
Tonga, Vietnam, Yemen Rep., and Jordan.

45
Furthermore, the study uses interaction term of remittances with financial sector
development to see its combined effects on real effective exchange rate appreciation.
Firstly, the study reveals the positive relationship between real effective exchange rate
and remittances means the increase in the value of recipient currency which referred as Dutch
Disease effect. This Dutch Disease effect would worsen the recipient‘s country trade
competiveness in the global market. However, we argue that the increase in magnitude of real
effective exchange rate appreciation depends on how well financial development the recipient
economy has to channel the financial flows into productive investment. Its means the effect
would be attenuated in the recipient‘s countries with deeper and more sophisticated financial and
capital market.
The current study has been carried out in finding of impact of migrant remittances on real
effective exchange rate in contingent to the role of financial development. The study suggest that
the real effective exchange rate appreciate would be weaker in the country with improved
financial sector. The findings are not only statistically important but have also economic
importance. Therefore, the main implication of this finding that the deeper capital and financial
markets can mitigates the appreciation risk associated with the significant flows of remittances
for top remittances recipient countries. This would protect the recipient economy from the loss of
international competitiveness.

xlvi
REFERENCES
Acosta, P. A., Baerg, N. R., & Mandelman, F. S. (2009). Financial development,
remittances, and real exchange rate appreciation. Economic Review-Federal Reserve Bank of
Atlanta, 94(1), I.
Acosta, P. A., Lartey, E. K. K., & Mandelman, F. S. (2009a). Remittances and the Dutch
disease. Journal of International Economics, 79(1), 102–116.
Acosta, P., Fajnzylber, P., & Lopez, J. H. H. (2007). The Impact of Remittances on Poverty
and Human Capital: Evidence from Latin American Household Surveys. World Bank Policy
Research Working Paper, 4247, 1–36. https://doi.org/10.1016/j.worlddev.2007.02.016
Acosta, Pablo A., Emmanuel K. K. Lartey, and Federico Mandelman, (2007)
―Remittances, Exchange Rate Regimes, and the Dutch Disease: A Panel Data Analysis,‖ Federal
Reserve Bank of Atlanta Working Paper No. 2008–12 (Atlanta: Federal Reserve Bank).
Aggarwal, R., Demirg????-Kunt, A., & Per??a, M. S. M. (2011). Do remittances promote
financial development? Journal of Development Economics, 96(2), 255–264.
https://doi.org/10.1016/j.jdeveco.2010.10.005
Ahmed, J., & Martínez-Zarzoso, I. (2016). Do transfer costs matter for foreign remittances?
A gravity model approach. Economics, 10(March), 1–37. https://doi.org/10.5018/economics-
ejournal.ja.2016-4
Akkoyunlu, Ş. (2012). Remittances and Financial Development : Is there a Direct Link ?
Evidence from Turkish Data August 2012, (August).
Amuedo-Dorantes, C., & Pozo, S. (2004). Workers‘ Remittances and the Real Exchange
Rate: A Paradox of Gifts. World Development, 32(8), 1407–1417.

xlvii
https://doi.org/10.1016/j.worlddev.2004.02.004
Arellano, M. (2003). Panel data econometrics. Oxford University Press.
Arellano, M., & Bover, O. (1995). Another look at the instrumental variable estimation of
error-components models. Journal of econometrics, 68(1), 29-51.
Arize, A. C., Osang, T., & Slottje, D. J. (2000). Exchange-Rate Volatility and Foreign
Trade: Evidence from Thirteen LDC‘s. Journal of Business & Economic Statistics, 18(1), 10–17.
https://doi.org/10.2307/1392132
Aziz, M. N., Sen, S., Sun, P., & Wu, L. (2015). Mp r a. Munich Personal RePEc Archive,
(66992). Retrieved from https://mpra.ub.uni-muenchen.de/66992/
Bach, J., & Solomon, M. S. (2008). Labors of Globalization: Emergent State Responses.
New Global Studies, 2(2). https://doi.org/10.2202/1940-0004.1025
Baltagi, B. H., Bratberg, E., & Holmås, T. H. (2005). A panel data study of physicians'
labor supply: the case of Norway. Health Economics, 14(10), 1035-1045.
Banerjee, A. V., & Newman, A. F. (1993). Occupational choice and the process of
development. Journal of political economy, 101(2), 274-298.
Barajas, A., Chami, R., Fullenkamp, C., Gapen, M., & Montiel, P. J. (2009). Do workers'
remittances promote economic growth?
Barrett, K. (2014). The effect of remittances on the real exchange rate: The case of
Jamaica. Caribbean Centre for Money and Finance.
Beck, T., Demirgüç-Kunt, A., & Levine, R. (2000). A new database on the structure and
development of the financial sector. The World Bank Economic Review, 14(3), 597-605.
Beck, T., & Levine, R. (2004). Stock markets, banks, and growth: Panel evidence. Journal
of Banking & Finance, 28(3), 423-442.

xlviii
Billmeier, A., & Massa, I. (2007). What Drives Stock Market Development in the Middle
East and Central Asia - Institutions, Remittances, or Natural Resources?, 1–21.
Blundell, R., & Bond, S. (1998). Initial conditions and moment restrictions in dynamic
panel data models. Journal of econometrics, 87(1), 115-143.
Bourdet, Y., & Falck, H. (2006). Emigrants‘ remittances and Dutch Disease in Cape Verde.
International Economic Journal, 20(3), 267–284. https://doi.org/10.1080/10168730600879323
Brown, R. P. C., Carmignani, F., & Fayad, G. (2013). Migrants‘ remittances and financial
development: Macro- and micro-level evidence of a perverse relationship. World Economy,
36(5), 636–660. https://doi.org/10.1111/twec.12016
Bussolo, M., Molina, L., & Lopez, H. (2007). Remittances And The Real Exchange Rate,
4213, 1–33. https://doi.org/10.1596/1813-9450-4213.
Calderon, C. a, & Kubota, M. (2009). Does Higher Openness Cause More Real Exchange
Rate Volatility? SSRN eLibrary, (April). https://doi.org/10.1596/1813-9450-4896
Cameron, A. C., & Trivedi, P. K. (2009). Microeconometrics using stata (Vol. 5). College
Station, TX: Stata press.
Caves, D,; Christensen, L. & Diewer, E. (1982). The Economic Journal,. The Economic
Journal, 92(342), 73–86.
Chami, R., Fullenkamp, C., & Jahjah, S. (2003). Are immigrant remittances flows a source
of capital for development, 52(1), 55–81. https://doi.org/10.2139/ssrn.463002
Chowdhury, M. B. (2011). Remittances flow and financial development in Bangladesh.
Economic Modelling, 28(6), 2600–2608. https://doi.org/10.1016/j.econmod.2011.07.013
Combes, J. L., & Ebeke, C. (2011). Remittances and household consumption instability in
developing countries. World Development, 39(7), 1076-1089.

xlix
Corbo, V., & Fischer, S. (1995). Structural adjustment, stabilization and policy reform:
domestic and international finance. Handbook of development economics, 3, 2845-2924.
Corden, W. M., 1960, "The Geometric Representation of Policies to Attain Internal and
External Balance,‖ Review of Economic Studies, Vol. 18(1), pp. 1-22.
Cooray, A. (2012). Migrant remittances, Financial sector development and the Governmnet
ownership of banks Arusha Cooray*, 22, 1–27.
Coulibaly, D. (2015). Remittances and financial development in Sub-Saharan African
countries: A system approach. Economic Modelling, 45, 249–258.
https://doi.org/10.1016/j.econmod.2014.12.005
Demirguc-kunt, A., Feyen, E., & Levine, R. (2011). Optimal Financial Structures and
Development : The evolving importance of banks and markets, (April).
Dornbusch, R., 1974, "Tariffs and Nontraded Goods," Journal of International Economics,
Vol. 4(2), May, pp. 177-85.
Fayissa, B., & Nsiah, C. (2012). Financial Development and Remittances in Africa and the
Americas : A Panel Unit-Root Tests and Panel Cointegration Analysis, (March), 1–22.
Foster, A. D. (2000). No Title, (July).
Frank, R., Palma-Coca, O., Rauda-Esquivel, J., Olaiz-Fernández, G., Díaz-Olavarrieta, C.,
& Acevedo-García, D. (2009). The relationship between remittances and health care provision in
Mexico. American Journal of Public Health, 99(7), 1227–1231.

l
https://doi.org/10.2105/AJPH.2008.144980
Greene, W. H. (1990). A gamma-distributed stochastic frontier model. Journal of
econometrics, 46(1-2), 141-163.
Hafeez-ur-Rehman, Jaffri, A. A., & Ahmed, I. (2010). Impact of Foreign Direct Investment
(FDI) Inflows on Equilibrium Real Exchange Rate of Pakistan. South Asian Studies (1026-
678X), 25(1), 125–141.
Hassan, G. M., & Holmes, M. J. (2013). Remittances and the real effective exchange
rate. Applied Economics, 45(35), 4959-4970.
Hau, H. (2002). Real Exchange Rate Volatility and Economic Openness: Theory and
Evidence. Journal of Money, Credit and Banking, 34(3), 611–630.
https://doi.org/10.2307/3270734
Hyder, Z., & Mahboob, A. (2006). Equilibrium Real Effective Exchange Rate and
Exchange Rate Misalignment in Pakistan. SBP-Research Bulletin, 2(1).
Johnston, J., & DiNardo, J. (1984). Econometric methods (Vol. 972). New York: McGraw-
Hill.
Kakhkharov, J. (2014). The impact of remittances on financial development : The case of
transition economies of Central & Eastern Europe and former Soviet Union.

li
Kandil, M., & Mirzaie, I. A. (2003). The Effects of Exchange Rate Fluactuations on Output
and Prices: Evidence from Developing Countries. International Monetary Fund, 38(2), 32.
King, R. G., & Levine, R. (1993). Financial intermediation and economic
development. Capital markets and financial intermediation, 156-189.
Lartey, E. K. K., Mandelman, F. S., & Acosta, P. A. (2008). Remittances, exchange rate
regimes, and the Dutch disease: a panel data analysis. Federal Reserve Bank of Atlanta Working
Paper, 12, 12. Retrieved from
http://199.169.243.129/news/CONFEREN/08remittances/lartey.pdf
Levine, R., and S. Zervos. (1998). ―Stock Markets, Banks, and Economic Growth.‖ The
American Economic Review 88:537–58.
Levine, R., N. Loayza, and T. Beck. (2000). ―Financial Intermediation and Growth: Causality
and Causes.‖ Journal of Monetary Economics 46(1):31–77.
Lopez Cordova, E. R. N. E. S. T. O., & Olmedo, A. L. E. X. A. N. D. R. A. (2005). Migrant
Remittances, the Transfer Problem and Export Competitiveness. mimeo, IADB.
Lucas, R. E. B., & Stark, O. (1985). Motivations to Remit: Evidence from Botswana.
Journal of Political Economy, 93(5), 901–918. https://doi.org/10.1086/261341.
Mughal, M. Y., & Makhlouf, F. (2011). Volatility of remittances to Pakistan: What do the

lii
data tell? Economics Bulletin, 31(1), 605–612.
Muktarbek, A. (2012). Remittances and Real Exchange Rate in CIS Countries, (June).
Mundaca, B. G. (2009). Remittances, financial market development, and economic growth:
the case of Latin America and the Caribbean. Review of Development Economics, 13(2), 288-
303... https://doi.org/10.1111/j.1467-9361.2008.00487.x
Narayan, P. K., Narayan, S., & Mishra, S. (2011). Do Remittances Induce Inflation? Fresh
Evidence from Developing Countries. Southern Economic Journal, 77(4), 914–933.
https://doi.org/10.4284/0038-4038-77.4.914
Nations, U. (2015). Transforming our world: The 2030 agenda for sustainable
development. New York: United Nations, Department of Economic and Social Affairs.
Oke, B. O., Uadiale, O. M., & Okpala, O. P. (2011). Impact of Workers‘ Remittances on
Financial Development in Nigeria. International Business Research, 4(4), 1890–1910.
https://doi.org/10.5539/ibr.v4n4p218
Orozco, M. (2003, June). Remittances, the rural sector, and policy options in Latin America.
In United States Agency for International Development-World Council of Credit Unions
conference, ―Paving the Way Forward for Rural Finance: An International Conference on Best
Practices‖, Washington, DC (pp. 2-4).
Osigwe, A. C., & Obi, K. O. (2016). Modelling the impacts of remittances on real exchange

liii
rate of Nigeria's Naira. African Journal of Economic and Sustainable Development, 5(1), 1-11.
Otker-Robe, I., Polanski, Z., Topf, B., & Vávra, D. (2007). Coping with capital inflows:
experiences of selected European countries.
Own, S. Y., & Me, N. (2011). Do Remittances , Exports and Financial Development Matter
for Economic Growth ? A Case Study of Pakistan using Bounds Approach, 11(January), 18–26.
Prakash, K. A., & Mala, A. (2016). Is the Dutch disease effect valid in relation to
remittances and the real exchange rate in Fiji?. Journal of the Asia Pacific Economy, 21(4), 571-
577.
Rajan, R. G., & Subramanian, A. (2005). What Undermines Aid‘s Impact on Growth?
NBER Working Papers, (11657). https://doi.org/10.1016/j.jdeveco.2009.12.004
Ratha, D. (2007). The relationship between international migration, trade, and
development: some paradoxes and findings. Leveraging remittances for development.
Ratha, D. (2005). Workers‘ remittances: an important and stable source of external
development finance. Remittances: development impact and future prospects, 19-51.
Ratha, D. (2013a). The Impact of Remittances on Economic Growth and Poverty
Reduction. Migration Policy Institute, (September), 14.
https://doi.org/10.1177/056943451005500210

liv
Ratha, D. (2013b). The Impact of Remittances on Economic Growth and Poverty
Reduction.
Rapoport, H., & Docquier, F. (2006). The economics of migrants' remittances. Handbook of
the economics of giving, altruism and reciprocity, 2, 1135-1198.
Rousseau, P. L., & Wachtel, P. (2000). Equity markets and growth: Cross-country evidence
on timing and outcomes, 1980–1995. Journal of Banking & Finance, 24(March), 1933–1957.
https://doi.org/10.1016/S0378-4266(99)00123-5
Roy, R., & Dixon, R. (2016). Workers‘ remittances and the Dutch disease in South Asian
countries. Applied Economics Letters, 23(6), 407-410.
Ruiz-Arranz, M., & Giuliano, P. (2005). Remittances, financial development, and
growth (No. 5-234). International Monetary Fund.
Salter, W.E, 1959, "Internal and External Balance: The Role of Price and Expenditure
Effects," Economic Record 35, Vol. 71, pp. 226–38.
Schumpeter, J. A. (1911). 1934. The theory of economic development.
Service, E. (2014). S Ubstitutes or C Omplements ? C Onsumer P Reference for L Ocal and
O Rganic F Ood, 97(4), 1044–1071. https://doi.org/10.1093/ajae/aau108
Shahbaz, M. (2007). Remittances and Financial Sector ‘ s Performance : Under Two

lv
Alternative Approaches for Pakistan, 12(12).
Sharif, B., Tufail, S., & Amjad, S. (2013) IMPACT OF REMITTANCES ON FINANCIAL
DEVELOPMENT.
Swan, T. W, 1960, "Economic Control in a Dependent Economy," Economic Record 36,
Vol. 73, pp. 51–66.
Tuuli, M. (2015). The Impact of Remittances on the Real Exchange Rate: Empirical
Evidence from Ghana. Journal of Economic Cooperation & Development, 36(3), 43.
Wooldridge, J. M. (2005). Simple solutions to the initial conditions problem in dynamic,
nonlinear panel data models with unobserved heterogeneity. Journal of applied
econometrics, 20(1), 39-54.
The World Bank. (2016). Remittances and Developments Brief 26. Migration and
Development Brief (Vol. April). https://doi.org/10.1080/17441730.2013.785721
Wurgler, J. (2000). Financial markets and the allocation of capital. Journal of Financial
Economics, 58(1–2), 187–214. https://doi.org/10.1016/S0304-405X(00)00070-2
World Bank (2006). Global Economic Prospects, 2006. Washington DC: World Bank
World Bank. (2006). Global Economic Prospects 2007: Managing the Next Wave of
Globalization. World Bank.

lvi
World Bank, (2010) , ‗Outlook for Remittance Flows 2010-2011‘, Migration and
Development Brief, World Bank, Washington, DC.
The World Bank. (2015). Migration and Development Brief 24. Migration and Remittances
Team, (Ap[ril 13), 11.
WB. (2016). Migration and Remittance: Recent Developments and Outlook, (October
2015). Retrieved from
https://openknowledge.worldbank.org/bitstream/handle/10986/24012/9781464809132.pdf?seque
nce=2&isAllowed=y

lvii
APPENDIXES
Table. A1 Baseline Model: Remittances and the real effective exchange rate
(1) (2) (3) (4) (5)
VARIABLES Pooled OLS Fixed
Effect
Random
Effect
Difference
GMM
System
GMM
REM 0.0303** 0.0487** 0.0181 0.0327*** 0.0412***
(0.0121) (0.0222) (0.0114) (0.00519) (0.00433)
Ln (GDPPC) 0.0935*** 0.355*** 0.0467** 0.245*** 0.0849***
(0.0277) (0.0875) (0.0214) (0.0203) (0.0141)
Ln (trade openness) -0.160** -0.219*** -0.153*** -0.140*** -0.156***
(0.0657) (0.0670) (0.0556) (0.0165) (0.0163)
Ln (TOT) -0.0541 0.000532 0.0165 0.0365** 0.0537***
(0.0465) (0.0622) (0.0459) (0.0179) (0.0189)
Ln (Govt Spend/GDP) 0.0773 0.0651 0.0509 0.0739*** 0.0910***
(0.0548) (0.0506) (0.0465) (0.0163) (0.0152)
Ln (GFCF/GDP) 0.0688 0.0600 0.0729* 0.0475*** 0.0548***
(0.0473) (0.0502) (0.0411) (0.0129) (0.0130)
Ln (GDPG) -0.00428** -0.00253 -0.00201 0.00143** 0.00180**
(0.00215) (0.00162) (0.00185) (0.000706) (0.000758)
Observations 551 551 551 542 551
R-squared 0.527
Number of country 37 37 37 37 37
Country FE YES YES YES YES
Year FE YES YES YES YES
Hausman Test Prob>chi2
= 0.0000

lviii
Table. A2 Remittances, Domestic credit to private sector by banks and real
effective exchange rate
(1) (2) (3) (4) (5)
VARIABLES Pooled OLS Fixed Effect Random
Effect
Difference
GMM
System GMM
REM -0.0259 0.0419 -0.00811 0.0396*** 0.0354***
(0.0254) (0.0273) (0.0224) (0.00632) (0.00611)
Ln DCPSB* REM 0.0126*** 0.00222 0.00603 -0.00274** 0.00170
(0.00457) (0.00423) (0.00419) (0.00139) (0.00124)
Ln (GDPPC) 0.0434* 0.336*** 0.0269 0.262*** 0.0683***
(0.0233) (0.0942) (0.0195) (0.0233) (0.0156)
Ln (trade openness) -0.183*** -0.231*** -0.161*** -0.134*** -0.164***
(0.0597) (0.0680) (0.0547) (0.0197) (0.0188)
Ln (TOT) -0.0899** -0.00516 -0.00718 0.0473*** 0.0695***
(0.0413) (0.0607) (0.0464) (0.0183) (0.0203)
Ln (Govt Spend/GDP) 0.0683 0.0628 0.0482 0.0870*** 0.0916***
(0.0449) (0.0514) (0.0403) (0.0165) (0.0161)
Ln (GFCF/GDP) 0.0561 0.0590 0.0652* 0.0554*** 0.0489***
(0.0427) (0.0495) (0.0383) (0.0130) (0.0139)
Ln (GDPG) -0.00250 -0.00201 -0.00113 0.00166** 0.00204**
(0.00207) (0.00154) (0.00179) (0.000737) (0.000827)
Observations 550 550 550 540 550
R-squared 0.527
Number of country 37 37 37 37 37
Country FE YES YES YES YES
Year FE YES YES YES YES
Hausman Test Prob>chi2 =
0.0000

lix
Table. A3 Remittances (% of GDP), market Capitalization (% of GDP) and real
effective exchange rate
(1) (2) (3) (4) (5)
VARIABLES Pooled OLS Fixed Effect Random
Effect
Difference
GMM
System
GMM
lrem_10 0.0446** 0.0457* -0.00816 0.0391*** 0.0279***
(0.0196) (0.0233) (0.0195) (0.00616) (0.00642)
REM -0.000105 -0.000816 0.00200 0.00108 -0.000617
(0.00249) (0.00217) (0.00206) (0.000886) (0.000785)
Ln(MCAP*REM) 0.284*** 0.425*** -0.0108 0.271*** 0.109***
(0.0659) (0.0979) (0.0195) (0.0427) (0.0279)
Ln (GDPPC) -0.230*** -0.144* -0.0185 -0.138*** -0.0992***
(0.0849) (0.0815) (0.0347) (0.0248) (0.0257)
Ln (trade openness) 0.0585 0.0708 0.0275 0.0244 0.0278
(0.0684) (0.0572) (0.0697) (0.0305) (0.0327)
Ln (TOT) 0.0344 0.0709 -0.0572 0.0510** 0.0378
(0.0806) (0.0679) (0.0494) (0.0212) (0.0245)
Ln (Govt Spend/GDP) 0.128** 0.0785** 0.0129 0.0503** 0.0450**
(0.0609) (0.0305) (0.0396) (0.0218) (0.0226)
Ln (GFCF/GDP) -0.00617*** -0.00296 -0.00229 6.76e-05 0.00231**
(0.00216) (0.00236) (0.00256) (0.000985) (0.00117)
Ln (GDPG) 2.617*** 1.303 5.242*** 0.479 0.453
(0.509) (0.757) (0.269) (0.303) (0.284)
Observations 191 191 191 174 191
R-squared 0.838
Number of country 21 21 21 21 21
Country FE YES YES YES YES
Year FE YES YES YES YES
Hausman Test Prob>chi2 =
0.0000

lx
Table. A4 Remittance (s % of GDP), financial development and real effective
exchange rate
(1) (2) (3) (4) (5)
VARIABLES Pooled OLS Fixed
Effect
Random
Effect
Difference
GMM
System
GMM
REM -0.00174 0.0528** 0.00567 0.0380*** 0.0438***
(0.0190) (0.0230) (0.0164) (0.00566) (0.00549)
Ln (FINDEV*
Rem/GDP)
0.00694**
(0.00331)
-0.00167
(0.00223)
0.00255
(0.00264)
-0.00198**
(0.000947)
-0.000632
(0.000931)
Ln (GDPPC) 0.0534** 0.372*** 0.0315* 0.253*** 0.0774***
(0.0228) (0.0917) (0.0190) (0.0217) (0.0153)
Ln (trade openness) -0.156*** -0.211*** -0.143*** -0.142*** -0.150***
(0.0603) (0.0651) (0.0529) (0.0177) (0.0180)
Ln (TOT) -0.0800* 0.00400 0.00252 0.0461** 0.0767***
(0.0445) (0.0626) (0.0467) (0.0181) (0.0203)
Ln (Govt Spend/GDP) 0.0695 0.0670 0.0472 0.0865*** 0.0905***
(0.0483) (0.0509) (0.0424) (0.0164) (0.0161)
Ln (GFCF/GDP) 0.0616 0.0615 0.0676* 0.0552*** 0.0501***
(0.0445) (0.0496) (0.0391) (0.0130) (0.0140)
Ln (GDPG) -0.00366* -0.00232 -0.00160 0.00182** 0.00186**
(0.00216) (0.00158) (0.00186) (0.000725) (0.000822)
Observations 550 550 550 540 550
R-squared 0.527
Number of country 37 37 37 37 37
Country FE YES YES YES YES
Year FE YES YES YES YES
Hausman Test Prob>chi2
= 0.0055