the remittances landscape in zambia -...
TRANSCRIPT
Presentation to FinMark Trust ForumLusaka, 21 October 2008
The remittances landscape in Zambia
Overview
Context
Zambian remittances landscape
Demand
Supply
Total size?
Regulation
Opportunities and challenges
Discussion
Context
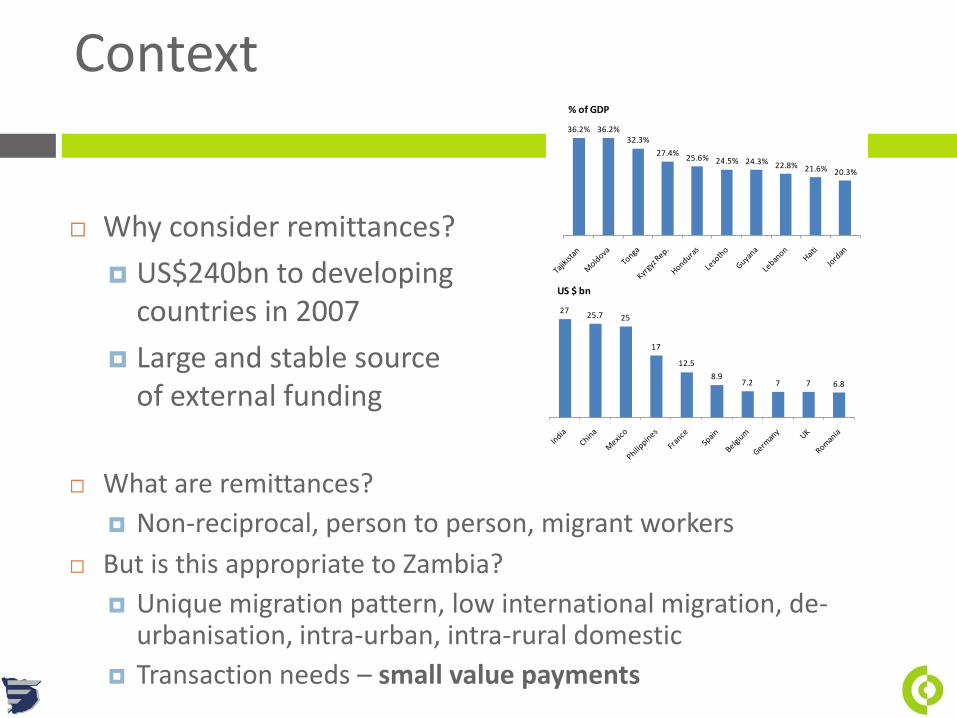
What are remittances?
Non-reciprocal, person to person, migrant workers
But is this appropriate to Zambia?
Unique migration pattern, low international migration, de-urbanisation, intra-urban, intra-rural domestic
Transaction needs – small value payments
Why consider remittances?
US$240bn to developing countries in 2007
Large and stable source of external funding
2725.7 25
17
12.5
8.97.2 7 7 6.8
US $ bn
36.2% 36.2%32.3%
27.4%25.6% 24.5% 24.3% 22.8% 21.6% 20.3%
% of GDP
2725.7 25
17
12.5
8.97.2 7 7 6.8
US $ bn
36.2% 36.2%32.3%
27.4%25.6% 24.5% 24.3% 22.8% 21.6% 20.3%
% of GDP
Overview
Context
Zambian remittances landscape
Demand
Supply
Total size?
Regulation
Opportunities and challenges
Discussion
Zambian remittances landscape: demand-side insights
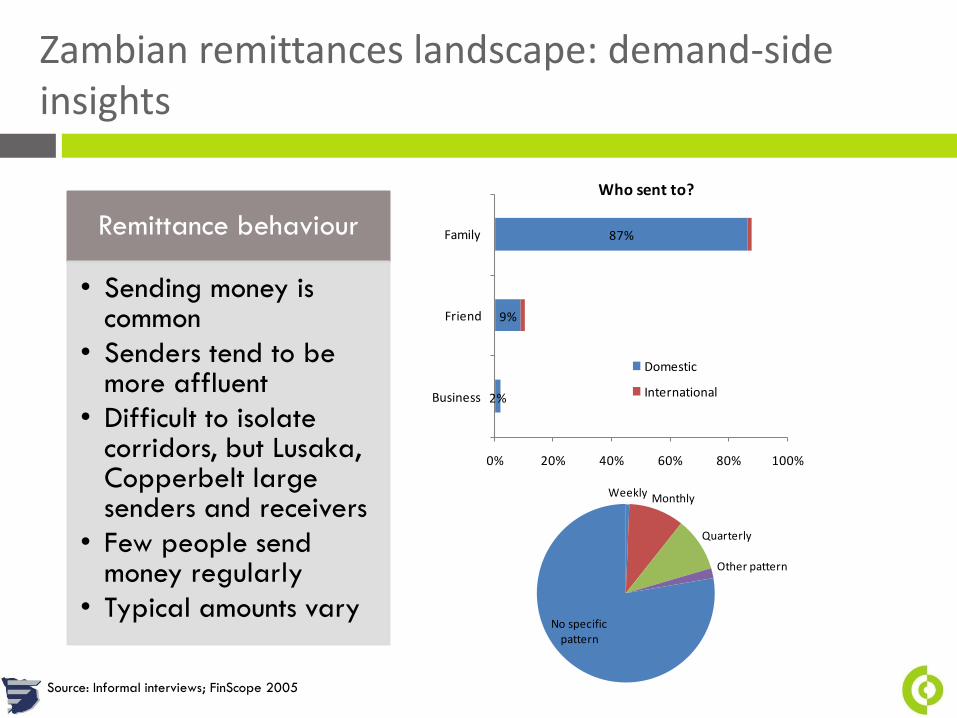
Remittance behaviour
• Sending money is common
• Senders tend to be more affluent
• Difficult to isolate corridors, but Lusaka, Copperbelt large senders and receivers
• Few people send money regularly
• Typical amounts vary
2%
9%
87%
0% 20% 40% 60% 80% 100%
Business
Friend
Family
Who sent to?
Domestic
International
Weekly Monthly
Quarterly
Other pattern
No specific pattern
Frequency sent:
Source: Informal interviews; FinScope 2005
Zambian remittances landscape: demand-side insights
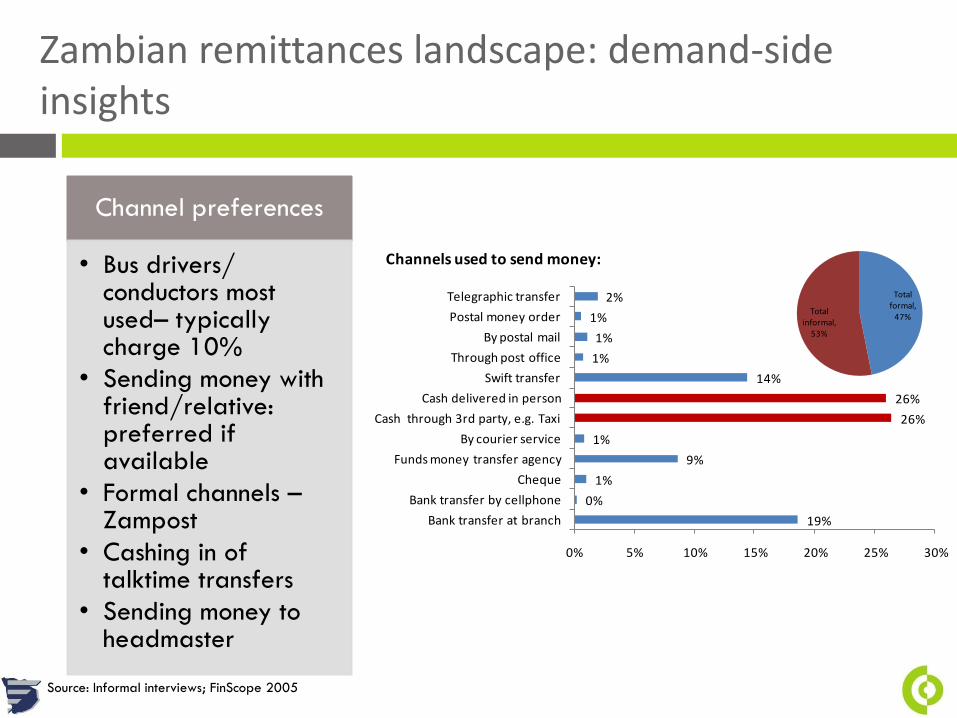
Channel preferences
• Bus drivers/ conductors most used– typically charge 10%
• Sending money with friend/relative: preferred if available
• Formal channels –Zampost
• Cashing in of talktime transfers
• Sending money to headmaster
19%
0%
1%
9%
1%
26%
26%
14%
1%
1%
1%
2%
Bank transfer at branch
Bank transfer by cellphone
Cheque
Funds money transfer agency
By courier service
Cash through 3rd party, e.g. Taxi
Cash delivered in person
Swift transfer
Through post office
By postal mail
Postal money order
Telegraphic transfer
0% 5% 10% 15% 20% 25% 30%
Channels used to send money:
Total formal,
47%Total
informal, 53%
Source: Informal interviews; FinScope 2005
Zambian remittances landscape: demand-side insights
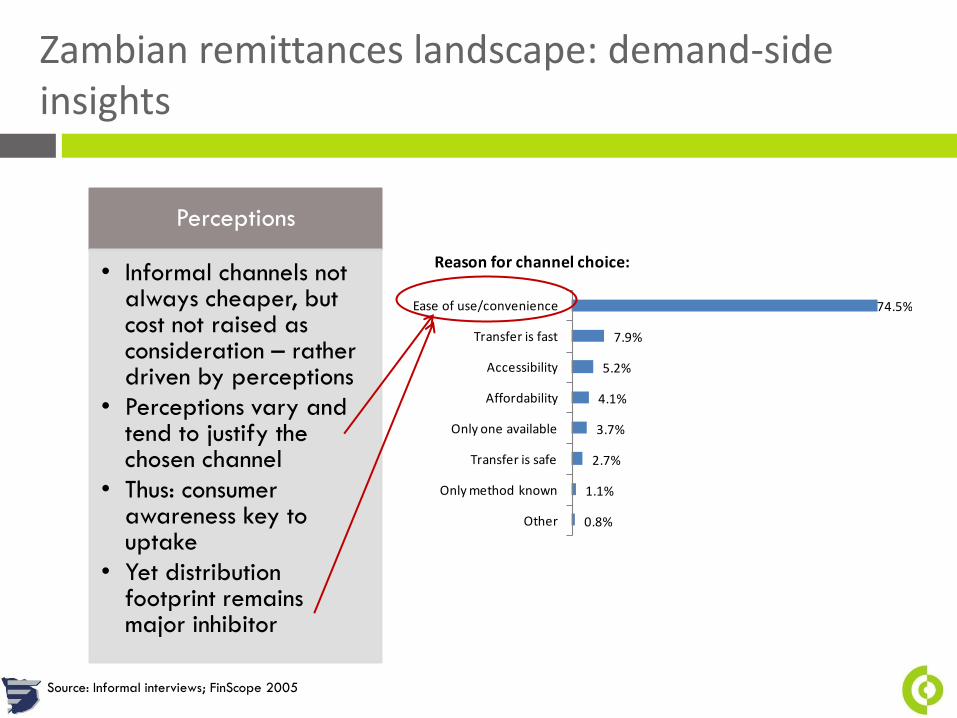
Perceptions
• Informal channels not always cheaper, but cost not raised as consideration – rather driven by perceptions
• Perceptions vary and tend to justify the chosen channel
• Thus: consumer awareness key to uptake
• Yet distribution footprint remains major inhibitor
0.8%
1.1%
2.7%
3.7%
4.1%
5.2%
7.9%
74.5%
Other
Only method known
Transfer is safe
Only one available
Affordability
Accessibility
Transfer is fast
Ease of use/convenience
Reason for channel choice:
Source: Informal interviews; FinScope 2005
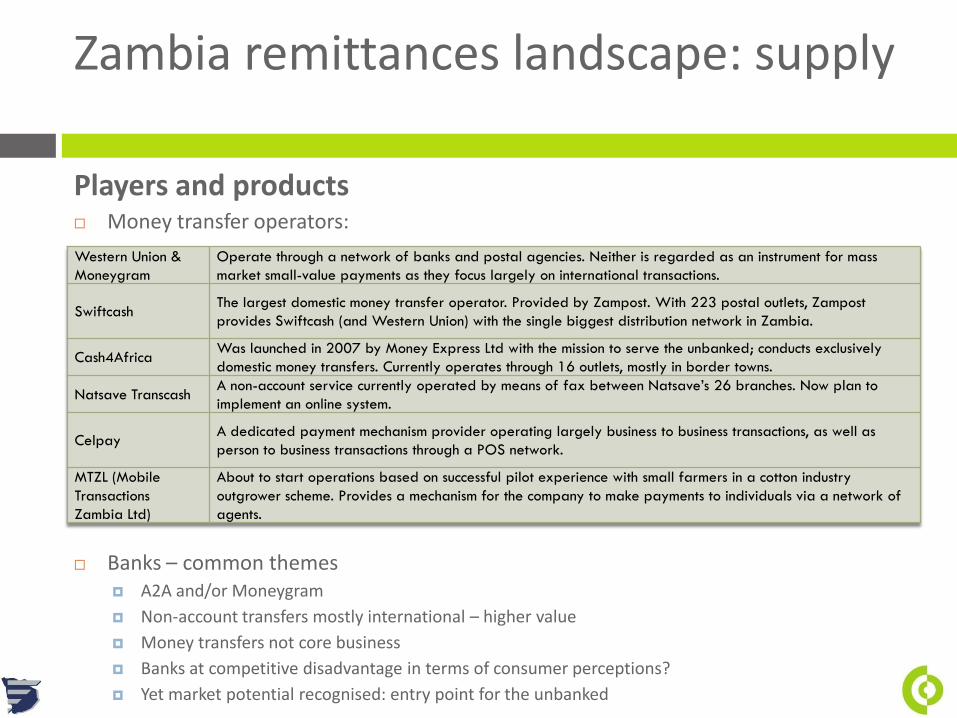
Zambia remittances landscape: supply
Players and products Money transfer operators:
Banks – common themes A2A and/or Moneygram
Non-account transfers mostly international – higher value
Money transfers not core business
Banks at competitive disadvantage in terms of consumer perceptions?
Yet market potential recognised: entry point for the unbanked
Western Union &
Moneygram
Operate through a network of banks and postal agencies. Neither is regarded as an instrument for mass
market small-value payments as they focus largely on international transactions.
SwiftcashThe largest domestic money transfer operator. Provided by Zampost. With 223 postal outlets, Zampost
provides Swiftcash (and Western Union) with the single biggest distribution network in Zambia.
Cash4AfricaWas launched in 2007 by Money Express Ltd with the mission to serve the unbanked; conducts exclusively
domestic money transfers. Currently operates through 16 outlets, mostly in border towns.
Natsave TranscashA non-account service currently operated by means of fax between Natsave’s 26 branches. Now plan to
implement an online system.
CelpayA dedicated payment mechanism provider operating largely business to business transactions, as well as
person to business transactions through a POS network.
MTZL (Mobile
Transactions
Zambia Ltd)
About to start operations based on successful pilot experience with small farmers in a cotton industry
outgrower scheme. Provides a mechanism for the company to make payments to individuals via a network of
agents.
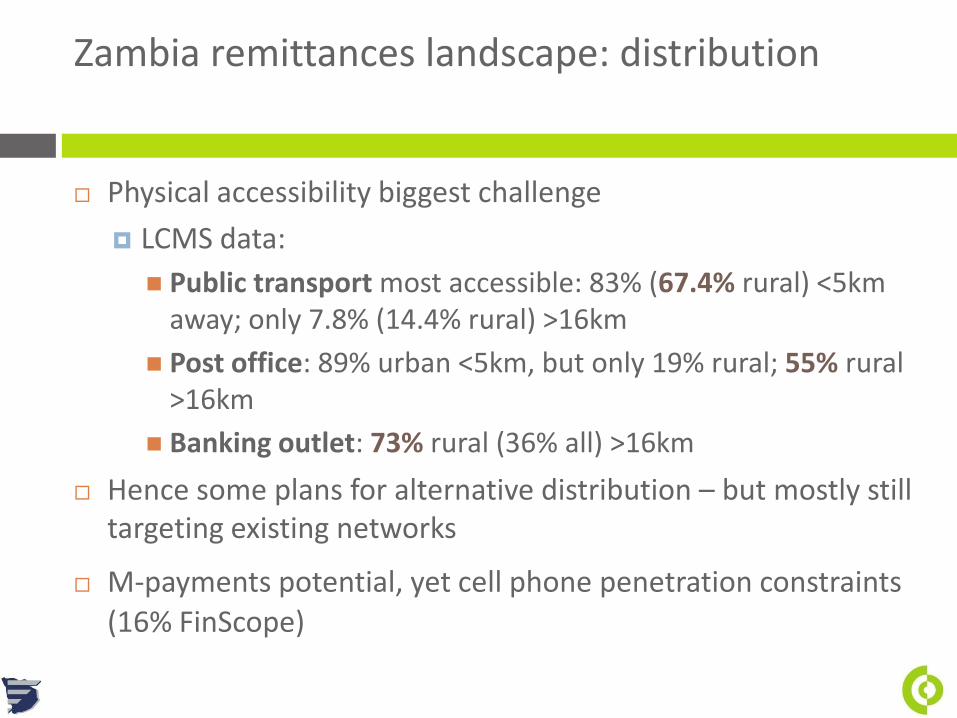
Zambia remittances landscape: distribution
Physical accessibility biggest challenge
LCMS data:
Public transport most accessible: 83% (67.4% rural) <5km away; only 7.8% (14.4% rural) >16km
Post office: 89% urban <5km, but only 19% rural; 55% rural >16km
Banking outlet: 73% rural (36% all) >16km
Hence some plans for alternative distribution – but mostly still targeting existing networks
M-payments potential, yet cell phone penetration constraints
(16% FinScope)
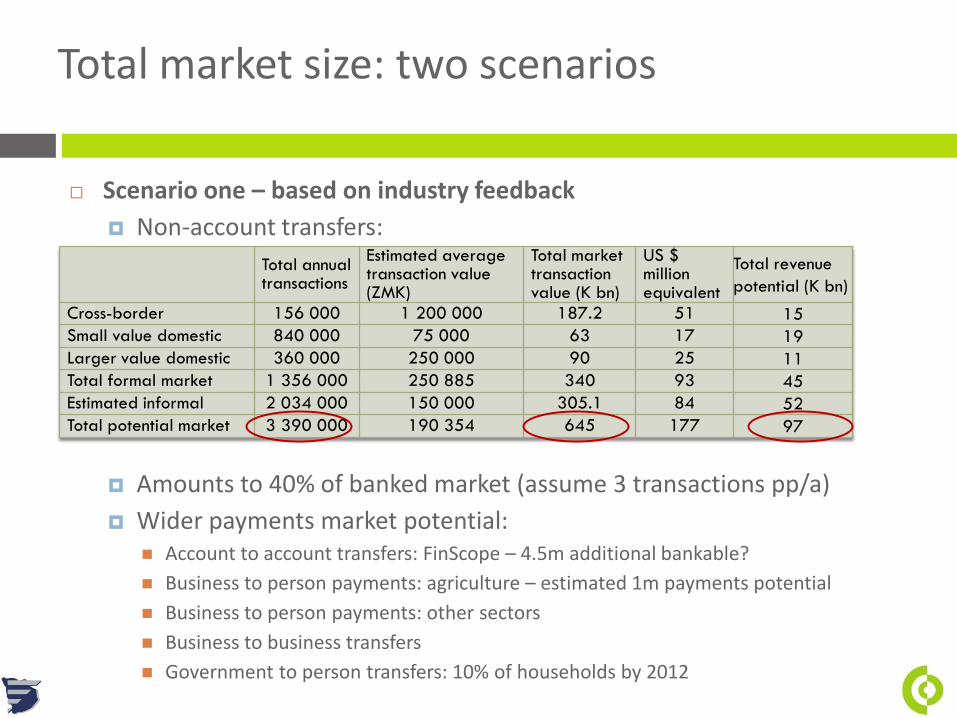
Total market size: two scenarios
Scenario one – based on industry feedback
Non-account transfers:
Amounts to 40% of banked market (assume 3 transactions pp/a)
Wider payments market potential: Account to account transfers: FinScope – 4.5m additional bankable?
Business to person payments: agriculture – estimated 1m payments potential
Business to person payments: other sectors
Business to business transfers
Government to person transfers: 10% of households by 2012
Total annual transactions
Estimated average transaction value (ZMK)
Total market transaction value (K bn)
US $ million equivalent
Total revenue
potential (K bn)
Cross-border 156 000 1 200 000 187.2 51 15
Small value domestic 840 000 75 000 63 17 19
Larger value domestic 360 000 250 000 90 25 11
Total formal market 1 356 000 250 885 340 93 45
Estimated informal 2 034 000 150 000 305.1 84 52
Total potential market 3 390 000 190 354 645 177 97
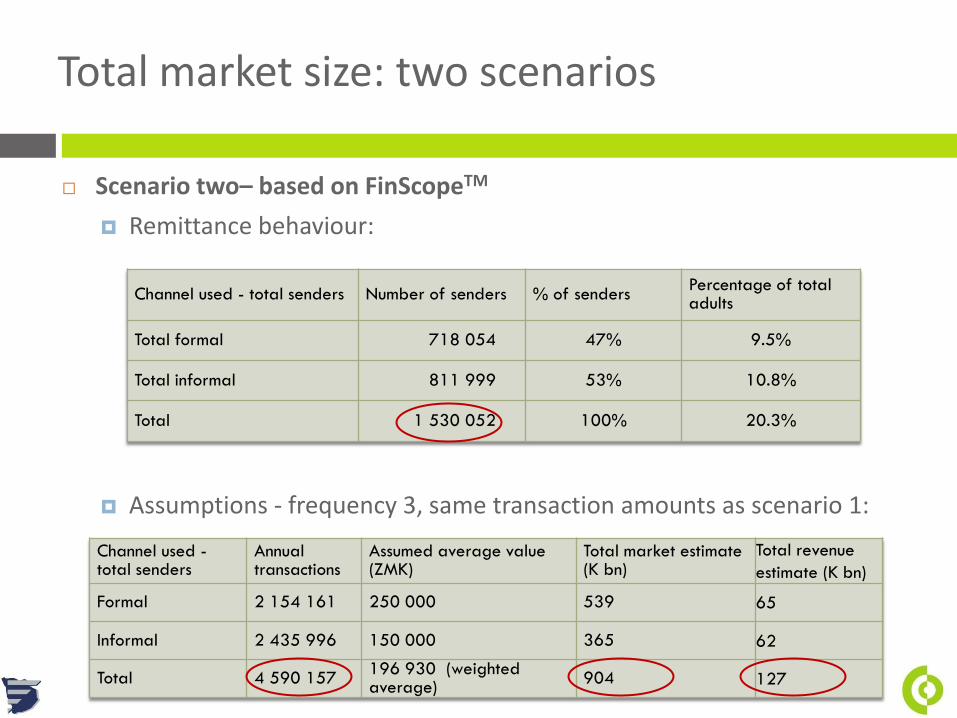
Total market size: two scenarios
Scenario two– based on FinScopeTM
Remittance behaviour:
Assumptions - frequency 3, same transaction amounts as scenario 1:
Channel used - total senders Number of senders % of sendersPercentage of total adults
Total formal 718 054 47% 9.5%
Total informal 811 999 53% 10.8%
Total 1 530 052 100% 20.3%
Channel used -total senders
Annual transactions
Assumed average value (ZMK)
Total market estimate (K bn)
Total revenue
estimate (K bn)
Formal 2 154 161 250 000 539 65
Informal 2 435 996 150 000 365 62
Total 4 590 157196 930 (weighted average)
904 127
Overview
Context
Zambian remittances landscape
Demand
Supply
Total size?
Regulation
Opportunities and challenges
Discussion
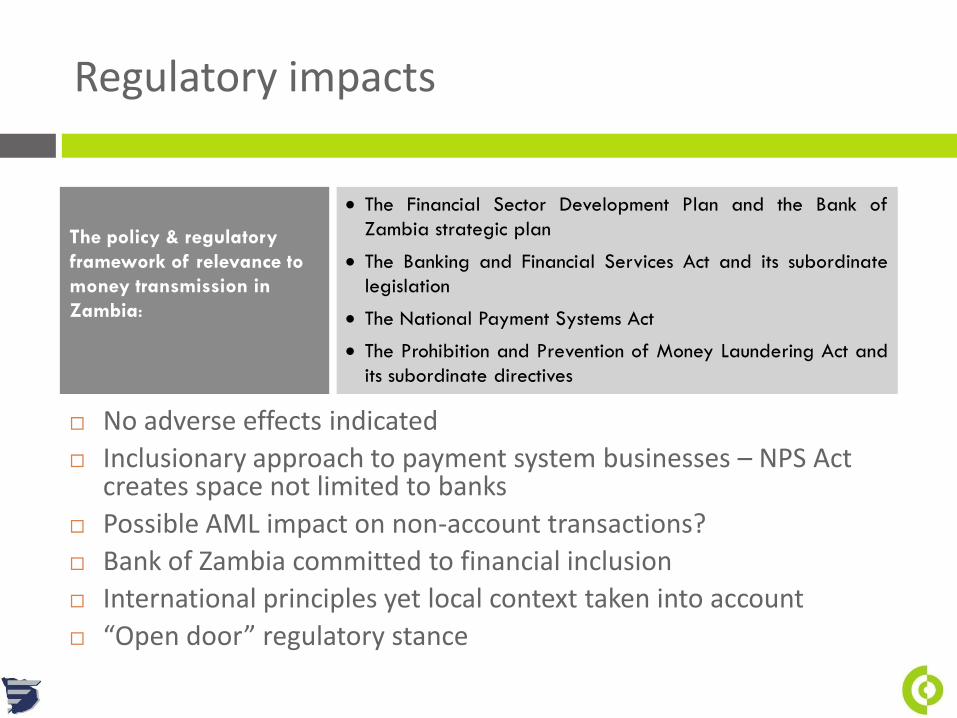
Regulatory impacts
No adverse effects indicated
Inclusionary approach to payment system businesses – NPS Act creates space not limited to banks
Possible AML impact on non-account transactions?
Bank of Zambia committed to financial inclusion
International principles yet local context taken into account
“Open door” regulatory stance
The Financial Sector Development Plan and the Bank of
Zambia strategic plan
The Banking and Financial Services Act and its subordinate
legislation
The National Payment Systems Act
The Prohibition and Prevention of Money Laundering Act and
its subordinate directives
The policy & regulatory
framework of relevance to
money transmission in
Zambia:
Overview
Context
Zambian remittances landscape
Demand
Supply
Total size?
Regulation
Opportunities and challenges
Discussion
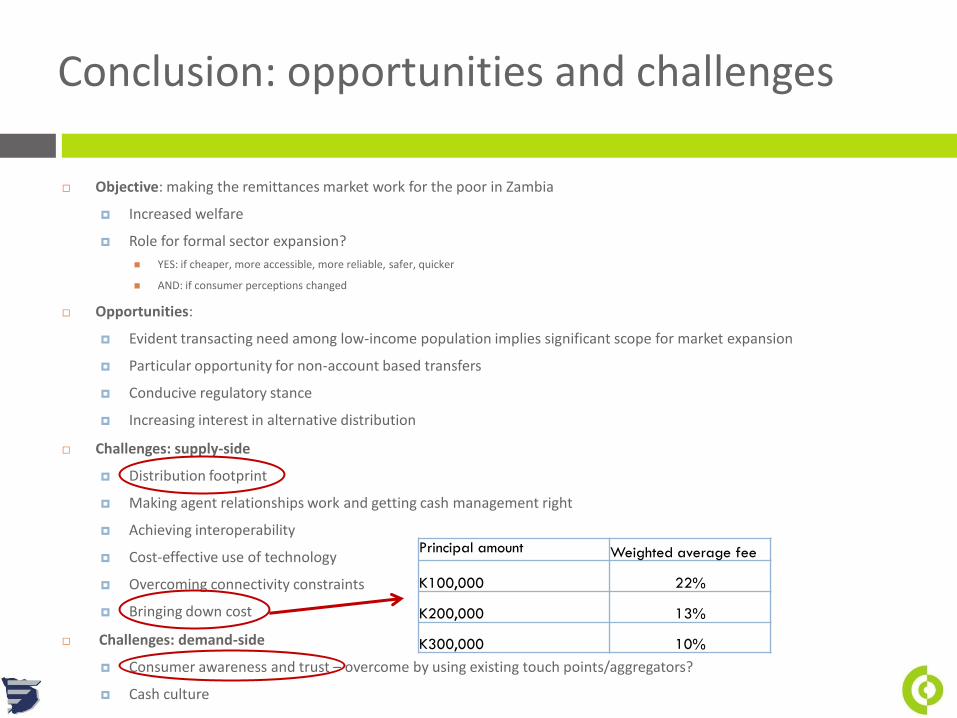
Conclusion: opportunities and challenges
Objective: making the remittances market work for the poor in Zambia
Increased welfare
Role for formal sector expansion?
YES: if cheaper, more accessible, more reliable, safer, quicker
AND: if consumer perceptions changed
Opportunities:
Evident transacting need among low-income population implies significant scope for market expansion
Particular opportunity for non-account based transfers
Conducive regulatory stance
Increasing interest in alternative distribution
Challenges: supply-side
Distribution footprint
Making agent relationships work and getting cash management right
Achieving interoperability
Cost-effective use of technology
Overcoming connectivity constraints
Bringing down cost
Challenges: demand-side
Consumer awareness and trust – overcome by using existing touch points/aggregators?
Cash culture
Principal amount Weighted average fee
K100,000 22%
K200,000 13%
K300,000 10%
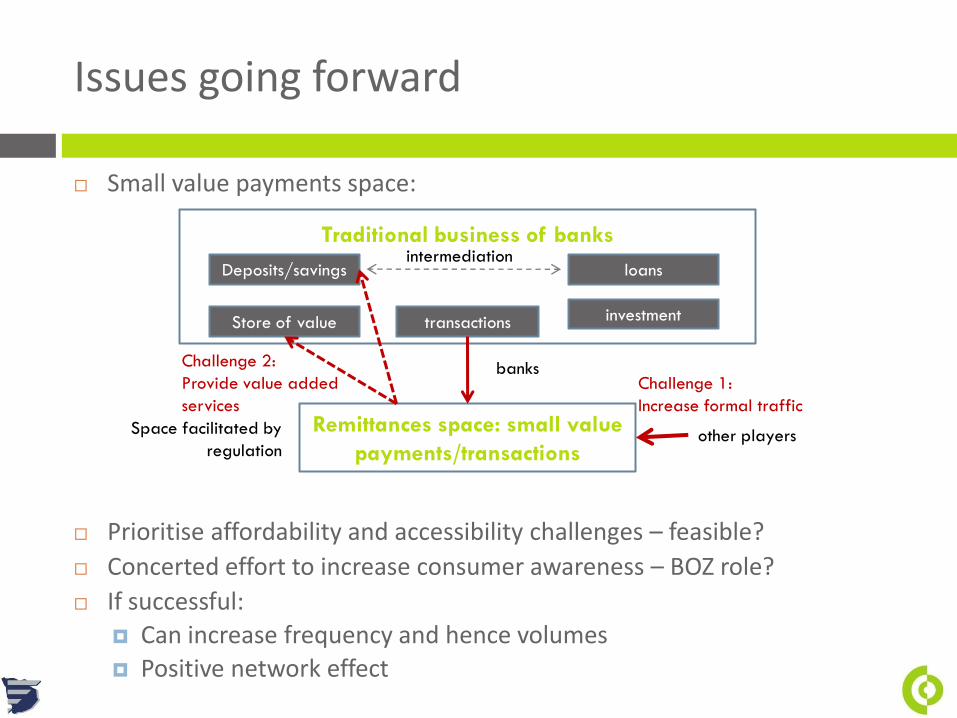
Issues going forward
Small value payments space:
Prioritise affordability and accessibility challenges – feasible?
Concerted effort to increase consumer awareness – BOZ role?
If successful:
Can increase frequency and hence volumes
Positive network effect
Traditional business of banks
Deposits/savings
Store of value investment
loans
transactions
Remittances space: small value
payments/transactions
banks
other playersSpace facilitated by
regulation
Challenge 2:
Provide value added
services
Challenge 1:
Increase formal traffic
intermediation
Overview
Context
Zambian remittances landscape
Demand
Supply
Total size?
Regulation
Opportunities and challenges
Discussion?
Thank you!
Cenfri – Centre for Financial Regulation and Inclusion
Johannesburg, South Africa
+27 11 888 9548
www.cenfri.org
Personal contact details:
Christine Hougaard
+255 23 262 5213 (landline)
+255 78 499 5438 (mobile)