are disks the dominant contributor for storage failures? · are disks the dominant contributor for...
TRANSCRIPT

Are Disks the Dominant Contributor for Storage Failures?A Comprehensive Study of Storage Subsystem Failure Characteristics
Weihang Jiang, Chongfeng Hu, Yuanyuan Zhou, and Arkady Kanevsky†
Department of Computer Science,University of Illinois at Urbana Champaign
{wjiang3,chu7,yyzhou}@cs.uiuc.edu
†Network Appliance, [email protected]
Abstract
Building reliable storage systems becomes increas-ingly challenging as the complexity of modern storagesystems continues to grow. Understanding storage fail-ure characteristics is crucially important for designingand building a reliable storage system. While several re-cent studies have been conducted on understanding stor-age failures, almost all of them focus on the failure char-acteristics of one component – disks – and do not studyother storage component failures.This paper analyzes the failure characteristics of stor-
age subsystems. More specifically, we analyzed the stor-age logs collected from about 39,000 storage systemscommercially deployed at various customer sites. Thedata set covers a period of 44 months and includes about1,800,000 disks hosted in about 155,000 storage shelf en-closures. Our study reveals many interesting findings,providing useful guideline for designing reliable stor-age systems. Some of our major findings include: (1)In addition to disk failures that contribute to 20-55%of storage subsystem failures, other components such asphysical interconnects and protocol stacks also accountfor significant percentages of storage subsystem failures.(2) Each individual storage subsystem failure type andstorage subsystem failure as a whole exhibit strong self-correlations. In addition, these failures exhibit “bursty”patterns. (3) Storage subsystems configured with redun-dant interconnects experience 30-40% lower failure ratesthan those with a single interconnect. (4) Spanning disksof a RAID group across multiple shelves provides a moreresilient solution for storage subsystems than within asingle shelf.
1 Introduction
1.1 Motivation
Reliability is a critically important issue for storagesystems because storage failures can not only cause ser-
vice downtime, but also lead to data loss. Building re-liable storage systems becomes increasingly challengingas the complexity of modern storage systems grows intoan unprecedented level. For example, the EMCTM Sym-metrix DMX-4 can be configured with up to 2400disks [8], the GoogleTM File System cluster is composedof 1000 storage nodes [9], and the NetApp R© FAS6000series can support more than 1000 disks per node, withup to 24 nodes in a system [12].To make things even worse, disks are not the only
component in storage systems. To connect and accessdisks, modern storage systems also contain many othercomponents, including shelf enclosures, cables and hostadapters, and complex software protocol stacks. Failuresin these components can lead to downtime and/or dataloss of the storage system. Hence, in complex storagesystems, component failures are very common and criti-cal to storage system reliability.To design and build a reliable storage system, it is cru-
cially important to understand the storage failure charac-teristics. First, accurate estimation of storage failure ratecan help system designers decide how many resourcesshould be used to tolerate failures and to meet certainservice-level agreement (SLA) metrics (e.g., data avail-ability). Second, knowledge about factors that greatlyimpact the storage system reliability can guide designersto select more reliable components or build redundancyinto unreliable components. Third, understanding the sta-tistical properties such as failure distribution over time ofmodern storage systems is necessary to build right testbedand fault injection models to evaluate existing resiliencymechanisms and to develop better fault-tolerant mecha-nisms.While several recent studies have been conducted on
understanding storage failures, almost all of them focusedon the failure characteristics of one storage component—disks. For example, disk vendors have studied thedisk failure characteristics through running acceleratedlife tests and collecting statistics from their return unitdatabases [4, 21]. Based on such tests, they calculate
FAST ’08: 6th USENIX Conference on File and Storage TechnologiesUSENIX Association 111

the mean-time-to-failure (MTTF) and record it in a diskspecification. For most of the disks, the specified MTTFis typically more than one million hours, equivalent to alower than 1% annualized failure rate (AFR). But suchlow AFR is usually not what has been experienced byusers. Motivated from this observation, recently some re-searchers have studied disk failures from a user’s perspec-tive by analyzing disk replacement logs collected in thefield [14, 16]. Interestingly, they found disks are replacedmuch more frequently (2-4 times) than vendor-specifiedAFRs. But as this study indicates, there are other storagesubsystem failures besides disk failures that are treatedas disk faults and lead to unnecessary disk replacements.Additionally, some researchers analyzed the characteris-tics of disk sector errors, which can potentially lead tocomplete disk failures [2], and they found that sector er-rors exhibit strong temporal locality (i.e., bursty patterns).While previous works provide very good understand-
ing of disk failures and an inspiring starting point, it is notenough since, besides disks, there are many other com-ponents that may contribute to storage failures. With-out a good understanding of these components’ failurerates, failure distributions, and other characteristics, aswell as impacts of these component failures on the stor-age system, it can make our estimation of the storage fail-ure rate/distribution inaccurate. For example, as we willshow in our study from real-world field data, having alower disk failure rate does not necessarily mean that thecorresponding storage system is more reliable—becausesome other components may not be as reliable.More importantly, if we only focus on disk failures
and ignore other component failures, we may fail to builda highly reliable storage system. For example, RAID isusually the only resiliency mechanism built in to mostmodern storage systems (various forms of checksummingare considered as part of RAID). As RAID is mainly de-signed to tolerate disk failures, it is insufficient to handleother component failures such as failures in shelf enclo-sures, interconnects, and software protocol layers.While we are interested in failures of a whole storage
system, this study is concentrated on the core part of it— the storage subsystem, which contains disks and allcomponents providing connectivity and usage of disks tothe entire storage system.We conducted a study using real-world field data from
Network ApplianceTMAutoSupport Database, to answerthe following questions:
• Howmuch do disk failures contribute to storage sub-system failures? What are other major factors thatcan lead to storage subsystem failures?
• What are the failure rates of other types of stor-age subsystem components such as physical inter-connects and protocol stacks? What are the failure
characteristics such as failure distribution and fail-ure correlation for these components?
• Typically, some resiliency mechanisms such asRAID and redundancy mechanisms such as multi-pathing are used in practice to achieve high relia-bility and availability [5, 9]. How effective are thesemechanisms in handling storage subsystem failures?
Data from the same AutoSupport Database was firstanalyzed in [2] on latent sector errors and was furtheranalyzed in [3] on data corruptions.There are other redundancy and resiliency mecha-
nisms in storage system layers higher than the storagesubsystem and RAID-based resiliency mechanism stud-ied in this paper. These mechanisms handle some of thestorage subsystem failures. Studying impacts of these re-siliency and redundancy mechanisms on storage failures,including storage subsystem failures, is part of the futurework.
1.2 Our Contributions
This paper analyzes the failure characteristics of stor-age subsystems, including disks and other system com-ponents, based on a significant amount of field data col-lected from customers. Specifically, we analyzed the stor-age logs collected from about 39,000 storage systemscommercially deployed at various customer sites. Thedata set covers a period of 44 months and includes about1,800,000 disks hosted in about 155,000 storage shelfenclosures. Furthermore, our data covers a wide rangeof storage system classes, including near-line (backup),low-end, mid-range, and high-end systems.This paper studies failure characteristics from sev-
eral angles. First, we classify storage subsystem failuresinto four failure types based on their symptoms and rootcauses and examine the relative frequency of each failuretype. Second, we study the effect of several factors onstorage subsystem reliability. These factors include diskmodels, shelf enclosure models, and network redundancymechanisms. Finally, we analyze the statistical propertiesof storage subsystem failures, including the correlationbetween failures and their time distribution.Our study reveals many interesting findings, providing
useful guideline for designing reliable storage systems.Following is a summary of our major findings and thecorresponding implications:• In addition to disk failures that contribute to 20-55% of storage subsystem failures, other compo-nents such as physical interconnects (including shelfenclosures) and protocol stacks also account for sig-nificant percentages (27-68% and 5-10%, respec-tively) of failures. Due to these component failures,even though storage systems of certain types (e.g.,
FAST ’08: 6th USENIX Conference on File and Storage Technologies USENIX Association112

low-end primary systems) use more reliable disksthan some other types (e.g., near-line backup sys-tems), their storage subsystems exhibit higher fail-ure rates. These results indicate that, to build highlyreliable and available storage systems, only usingresiliency mechanisms targeting disk failures (e.g.,RAID) is not enough. We also need to build re-siliency mechanisms such as redundant physical in-terconnects and self-checking protocol stacks to tol-erate failures in these storage components.
• Each individual storage subsystem failure type andstorage subsystem failure as a whole exhibit strongcorrelations, (i.e. after one failure, the probabilityof additional failures of the same type is higher).In addition, failures also exhibit bursty patterns intime distribution, (i.e. multiple failures of the sametype tend to happen relatively close together). Theseresults motivate a revisiting of current resiliencymechanisms such as RAID that assume independentfailures. These results also motivate development ofbetter resiliency mechanisms that can tolerate multi-ple correlated failures and bursty failure behaviors.
• Storage subsystems configured with two indepen-dent interconnects experienced much (30-40%)lower AFRs than those with a single interconnect.This result indicates the importance of interconnectredundancy in the design of reliable storage systems.
• RAID groups built with disks spanning multipleshelf enclosures show much less bursty failure pat-terns than those built with disks from the same shelfenclosure. This indicates that the former is a moreresilient solution for large storage systems.The rest of the paper is organized as follows. Section 2
provides the background and describes our methodology.Section 3 presents the contribution of disk failures to stor-age subsystem failures and frequency of other types ofstorage subsystem failures. Section 4 quantitatively ana-lyzes the effects of several factors on storage subsystemreliability, while Section 5 analyzes the statistical prop-erties of storage subsystem failures. Section 6 discussesthe related work, and Section 7 concludes the paper andprovides directions for future work.
2 Background and Methodology
In this section, we detail the typical architecture ofstorage systems, the definition and terminology used inthis paper, and the source of the data studied in this pa-per.
2.1 Storage System Architecture
Figure 1 shows the typical architecture of a modernstorage system.
Shelf Enclosure 1Disk
Storage Subsystem
Resilient Mechanism (RAID)
Storage Layer(software protocol stack)
HBA
FC Cables
AC power
Fan
Backplane
Shelf Enclosure 2
HBA
Redundant Cables
Storage System
Figure 1. Storage system architecture.From the customers’ perspective, a storage system is a
virtual device that is attached to customers’ systems andprovides customers with the desired storage capacity withhigh reliability, good performance, and flexible manage-ment.Looking from inside, a storage system is composed
of storage subsystems, resiliency mechanisms, storagehead/controller, and other higher-level system layers. Thestorage subsystem is the core part of a storage systemand provides connectivity and usage of disks to the entirestorage system. It contains various components, includ-ing disks, shelf enclosures, cables and host adapters, andcomplex software protocol stacks. Shelf enclosures pro-vide power supply, cooling service and prewired back-plane for the disks mounted in them. Cables initiatedfrom host adapters connect one or multiple shelf enclo-sures to the network. Each shelf enclosure can be option-ally connected to a secondary network for redundancy. InSection 4.3 we will show the impact of this redundancymechanism on failures of the storage subsystem.Usually, on top of the storage subsystem, resiliency
mechanisms, such as RAID, are used to tolerate failuresin storage subsystems.
2.2 Terminology
We use the followings terms in this paper.
• Disk family: A particular disk product. The sameproduct may be offered in different capacities. Forexample, “Seagate Cheetah 10k.7” is a disk family.
• Disk model: The combination of a disk family anda particular disk capacity. For example, “SeagateCheetah 10k.7 300 GB” is a disk model. For diskfamily and disk model, we use the same naming con-vention as in [2, 3].
• Failure types: Refers to the four types of storagesubsystem failures: disk failure, physical intercon-
FAST ’08: 6th USENIX Conference on File and Storage TechnologiesUSENIX Association 113

nect failure, protocol failure, and performance fail-ure.
• Shelf enclosuremodel: A particular shelf enclosureproduct. All shelf enclosure models studied in thispaper can host at most 14 disks.
• Storage subsystem failure: Refers to failures thatprevent the storage subsystem from providing stor-age service to the whole storage system. However,not all storage subsystem failures are experienced bycustomers, since some of the failures can be handledby resiliency mechanisms on top of storage subsys-tems (e.g. RAID) and other mechanisms at higherlayers.
• Storage system class: Refers to the capability andusage of storage systems. There are four storage sys-tem classes studied in this paper: near-line systems(mainly used as secondary storage), low-end, mid-range, and high-end (mainly used as primary stor-age).
• Other terms in the paper are used as defined bySNIA [19].
Disk Drivers
SCSI Protocol
FC Adapter w/ drivers
Disk
Storage Layer
Networks
ProtocolStack
Figure 2. I/O request path in storage sub-system
2.3 Definition andClassification of Storage Sub-system Failures
Figure 2 shows the steps and components that are in-volved in fulfilling an I/O request in a storage subsystem.As shown in Figure 2, for the storage layer to fulfill an I/Orequest, the I/O request will first be processed and trans-formed by protocols and then delivered to disks through
networks initiated by host adapters. Storage subsystemfailures are the failures that break the I/O request path,and can be caused by hardware failures, software bugs,and protocol incompatibilities along the path.To better understand storage subsystem failures, we
partition them into four categories along the I/O requestpath:
• Disk Failure: This type of failure is triggered byfailure mechanisms of disks. Imperfect media, me-dia scratches caused by loose particles, rotational vi-bration, and many other factors internal to a diskcan lead to this type of failures. Sometimes, thestorage layer proactively fails disks based on statis-tics collected by on-disk health monitoring mecha-nisms (e.g., a disk has experienced too many sectorerrors [1]. These incidences are also counted as diskfailures).
• Physical Interconnect Failure: This type of fail-ure is triggered by errors in the networks connect-ing disks and storage heads. It can be caused byhost adapter failures, broken cables, shelf enclosurepower outage, shelf backplanes errors, and/or er-rors in shelf FC drivers. When physical interconnectfailures happen, affected disks appear to be missingfrom the system.
• Protocol Failure: This type of failure is causedby incompatibility between protocols in disk driversor shelf enclosures and storage heads and softwarebugs in the disk drivers. When this type of failurehappens, disks are visible to the storage layer butI/O requests are not correctly responded by disks.
• Performance Failure: This type of failure happenswhen the storage layer detects that a disk cannotserve I/O requests in a timely manner while noneof previous three types of failures are detected. It ismainly caused by partial failures, such as unstableconnectivity or when disks are heavily loaded withdisk-level recovery (e.g., broken sector remapping).
The occurrences of these four types of failures arerecorded in logs collected by Network Appliance.
2.4 Data Sources
Table 1 provides an overview of the data used in thisstudy. Support logs from about 39,000 commercially de-ployed storage systems in four system classes are usedfor the results presented in this paper. There are totallyabout 1,800,000 disks mounted in 155,000 shelf enclo-sures. The disks are a combination of SATA and FCdisks. The population of disks contains at least 9 diskfamilies and 15 disk models. The storage logs used for
FAST ’08: 6th USENIX Conference on File and Storage Technologies USENIX Association114

SystemClasses
Duration # Systems # Shelves Multipathing # Disks DiskTypes
# RAIDGroups
RAIDTypes
# Failure Types # FailureEvents
Near-line(Backup)
1/04 - 8/07 4,927 33,681 single path 520,776 SATA 67,227 RAID4RAID6
Disk FailurePhysical Inter. FailureProtocol FailurePerformance Failure
10,1054,8881,8191,080
Low-end 1/04 - 8/07 22,031 37,260 single-path 264,983 FC 44,252 RAID4RAID6
Disk FailurePhysical Inter. FailureProtocol FailurePerformance Failure
3,2304,3381,0211,235
Mid-range 1/04 - 8/07 7,154 52,621 single-pathdual-path
578,980 FC 77,831 RAID4RAID6
Disk FailurePhysical Inter. FailureProtocol FailurePerformance Failure
8,9897,9492,2982,060
High-end 1/04 - 8/07 5,003 33,428 single-pathdual-path
454,684 FC 49,555 RAID4RAID6
Disk FailurePhysical Inter. FailureProtocol FailurePerformance Failure
8,2407,3951,576153
Table 1. Overview of studied storage systems. Note that the “# Disks” given in the table is the number of disks that have ever beeninstalled in the system during the 44 months. For some systems, disks have been replaced during the period, and we account for that in ouranalysis by calculating the life time of each individual disk. The “# Failure Events” given in the table are the numbers of the four types ofstorage subsystem failures (disk failure, physical interconnect failure, protocol failure, and performance failure) that happened during theperiod.
this study were collected between January 2004 and Au-gust 2007.Below we describe each storage system class.Near-line systems are deployed as cost-efficient
archival or backup storage systems. Less expensiveSATA disks are used in nearline systems. In nearline sys-tems, one storage subsystem on average contains about 7shelf enclosures and 98 disks. Both RAID4 and RAID6are supported as resiliency mechanisms in nearline sys-tems.Primary storage systems, including low, mid, and
high-end systems, are mainly used in mission- orbusiness-critical environments and primarily use FCdisks. Low-end storage systems have embedded storageheads with shelf enclosures, but external shelf enclosurescan be added. Mid-range and high-end systems use ex-ternal shelves and are usually configured with more shelfenclosures and disks than low-end systems. Each mid-range system has about 7 shelf enclosures and 80 disks(not every shelf is fully utilized and configured with 14disks), and high-end systems are in similar scale. Goingfrom low to high-end systems, more reliable componentsand more redundancy mechanisms are used. For exam-ple, both mid-range and high-end systems support dualpaths for redundant connectivity.
2.5 Support Logs and Analysis
The storage systems studied in this paper have a low-overhead logging mechanism that automatically recordsinformational and error events on each layer (softwareand hardware) and each subsystem during operation.Several recent works such as [2, 3] also studied the sameset of storage logs from different aspects.Figure 3 shows a log example that reports a physical
interconnect failure. As can be seen in the figure, when afailure happens, multiple events are generated as the fail-ure propagates from lower layers to higher layers (FibreChannel to SCSI to RAID). By keeping track of eventsgenerated by lower layers, higher layers can identify thecause of events and tag the events with correspondingfailure types. In this example, the RAID layer, which isright above the storage subsystem, generates a disk miss-ing event, indicating a physical interconnect failure. Inthis paper, we look at four types of events generated bythe RAID layer, corresponding to four categories of stor-age subsystem failures.Besides the events shown in the example, there are
many other events recorded in the logs. For example,standard error reports from the SCSI protocol layer tell uswhat failure mechanisms happen inside disks [18]. Diskmedium error messages from disk drivers provide infor-mation about broken sectors [2]. Similarly, messagesfrom FC protocol and FC host adapter drivers report er-rors that occur in FC networks and FC adapters.It is important to notice that not all failures propagate
to the RAID layer, as some failures are recovered or tol-erated by storage subsystems. For example, an intercon-nect failure can be recovered through retries at SCSI layeror be tolerated through multipathing. Therefore, storagefailures characterized as storage subsystem failure as awhole are those errors exposed by storage subsystems tothe rest of the system.As Figure 3 shows, each event is tagged with the time-
stamps when the failure is detected and with the ID of thedisk affected by the failure. Since all the storage systemsstudied in this paper periodically send data verificationrequests to all disks as a proactive method to detect fail-ures, the lag between the occurrence and the detection ofthe failure is usually shorter than an hour.
FAST ’08: 6th USENIX Conference on File and Storage TechnologiesUSENIX Association 115

System information is also copied with snapshots andrecorded in storage logs on a weekly basis. This informa-tion is particularly important for understanding storagesubsystem reliability since it provides the insight into thesystem parameters of storage subsystems. More specif-ically, storage logs contain the information about hard-ware components used in storage subsystems, such asdisk models and shelf enclosure models, and they alsocontain the information about the layout of disks, suchas which disks are mounted in the same shelf enclosures,and which disks are in the same RAID group. This in-formation is used for analyzing statistical properties ofstorage subsystem failures in Section 5.
3 Frequency of Storage Subsystem Failures
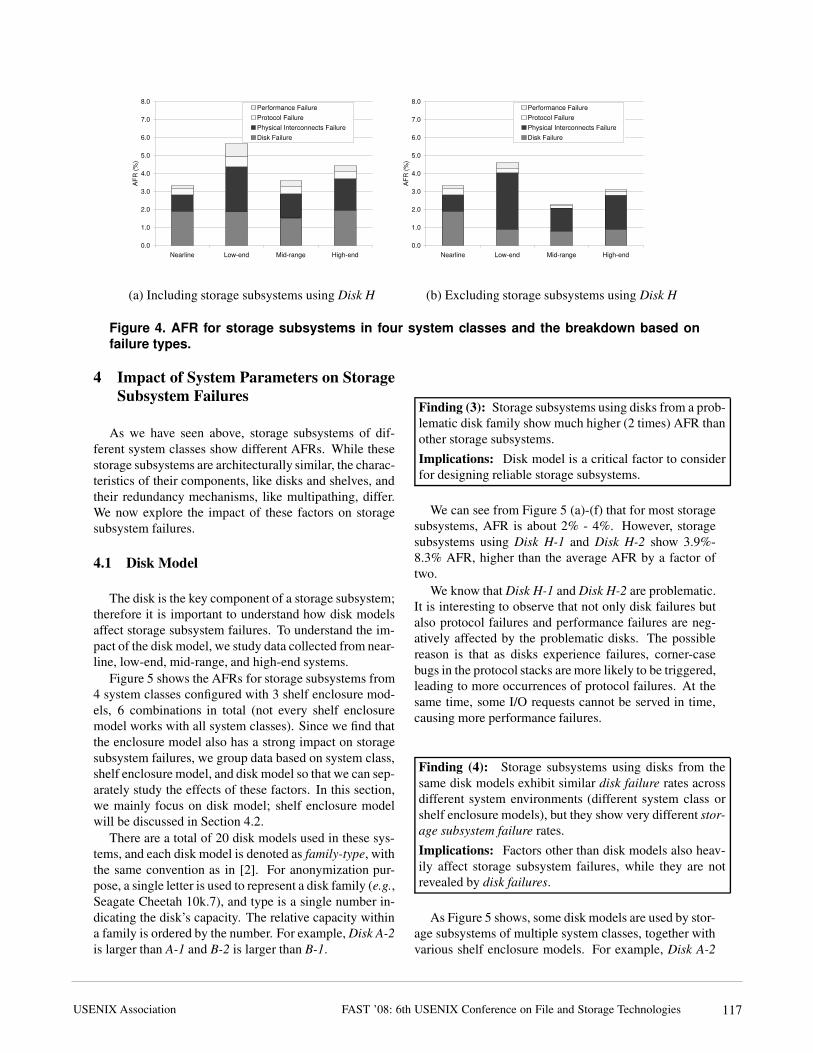
As we categorize storage subsystem failures into fourfailure types based on their root causes, a natural questionis therefore what the relative frequency of each failuretype is. To answer this question, we study the storagelogs collected from 39,000 storage systems.Figure 4(a) presents the breakdown of AFR for stor-
age subsystems based on failure types, for all four sys-tem classes studied in this paper. Since one problematicdisk family, denoted asDisk H, has already been reportedin [2], for Figure 4(b) we exclude data from storage sub-systems using Disk H, so that we can analyze the trendwithout being skewed by one problematic disk family.The discussion on Disk H is presented in Section 4.1.
Finding (1): In addition to disk failures (20-55%), phys-ical interconnect failures make up a significant part (27-68%) of storage subsystem failures. Protocol failures andperformance failures both make up noticeable fractions.Implications: Disk failures are not always a dominantfactor of storage subsystem failures, and a reliability studyfor storage subsystems cannot only focus on disk failures.Resilient mechanisms should target all failure types.
• Sun Jul 23 05:43:36 PDT [fci.device.timeout:error]: Adapter 8 encountered a device timeout on device 8.24
• Sun Jul 23 05:43:50 PDT [fci.adapter.reset:info]: Resetting Fibre Channel adapter 8.
• Sun Jul 23 05:43:50 PDT [scsi.cmd.abortedByHost:error]: Device 8.24: Command aborted by host adapter:
• Sun Jul 23 05:44:12 PDT [scsi.cmd.selectionTimeout:error]: Device 8.24: Adapter/target error: Targeted device did not respond to requested I/O. I/O will be retried.
• Sun Jul 23 05:44:22 PDT [scsi.cmd.noMorePaths:error]: Device 8.24: No more paths to device. All retries have failed.
• Sun Jul 23 05:46:22 PDT [raid.config.filesystem.disk.missing:info]: File system Disk 8.24 S/N [3EL03PAV00007111LR8W] is missing.
Figure 3. Example of a piece of log reportinga physical interconnect failure.
As Figure 4(b) shows, across all system classes, diskfailures do not always dominate storage subsystem fail-ures. For example, in low-end storage systems, the AFRfor storage subsystems is about 4.6%, while the AFR fordisks is only 0.9%, about 20% of overall AFR. On theother hand, physical interconnect failures account for asignificant fraction of storage subsystem failures, rangingfrom 27% to 68%. The other two failure types, protocolfailures and performance failures, contribute to 5-10%and 4-8% of storage subsystem failures, respectively.
Finding (2): For disks, near-line storage systems showhigher (1.9%) AFR than low-end storage systems (0.9%).But for the whole storage subsystem, near-line storage sys-tems show lower (3.4%) AFR than low-end storage sys-tems (4.6%).Implications: Disk failure rate is not indicative of thestorage subsystem failure rate.
Figure 4(b) also shows that near-line systems, whichmostly use SATA disks, experience about 1.9% AFR fordisks, while for low-end, mid-range, and high-end sys-tems, which mostly use FC disks, the AFR for disks isunder 0.9%. This observation is consistent with the com-mon belief that enterprise disks (FC) are more reliablethan near-line disks (SATA).However, the AFR for storage subsystems does not
follow the same trend. Storage subsystem AFR of near-line systems is about 3.4%, lower than that of low-endsystems (4.6%). This indicates that other factors, suchas shelf enclosure model and network configurations,strongly affect storage subsystem reliability. The impactsof these factors are examined in the next section.Another interesting observation that can be seen in
Figure 4(b) is that for FC drives, the disk failure rate isconsistently below 1%, as published by disk drive manu-facturers, while some previous works claim that the AFRfor disks is much higher [14, 16]. We believe that themain reason for the discrepancy is that these studies lookat disk failures from different angles. Our study is froma system’s perspective, as we extract disk failure eventsfrom system logs, similar to disk drive manufacturers’studies. On the other hand [14, 16], look at disk failuresfrom a user’s perspective. Since their studies are based ondisk replacement logs, they cannot identify the reasonsfor disk replacement. As system administrators often re-place disks when they observe unavailability of disks, thedisk replacement rates reported in these studies are ac-tually close to the storage subsystem failure rate of thispaper.
FAST ’08: 6th USENIX Conference on File and Storage Technologies USENIX Association116
0.0
1.0
2.0
3.0
4.0
5.0
6.0
7.0
8.0
Nearline Low-end Mid-range High-end
AFR
(%)
Performance FailureProtocol FailurePhysical Interconnects FailureDisk Failure
0.0
1.0
2.0
3.0
4.0
5.0
6.0
7.0
8.0
Nearline Low-end Mid-range High-end
AFR
(%)
Performance FailureProtocol FailurePhysical Interconnects FailureDisk Failure
(a) Including storage subsystems using Disk H (b) Excluding storage subsystems using Disk H
Figure 4. AFR for storage subsystems in four system classes and the breakdown based onfailure types.
4 Impact of System Parameters on StorageSubsystem Failures
As we have seen above, storage subsystems of dif-ferent system classes show different AFRs. While thesestorage subsystems are architecturally similar, the charac-teristics of their components, like disks and shelves, andtheir redundancy mechanisms, like multipathing, differ.We now explore the impact of these factors on storagesubsystem failures.
4.1 Disk Model
The disk is the key component of a storage subsystem;therefore it is important to understand how disk modelsaffect storage subsystem failures. To understand the im-pact of the disk model, we study data collected from near-line, low-end, mid-range, and high-end systems.Figure 5 shows the AFRs for storage subsystems from
4 system classes configured with 3 shelf enclosure mod-els, 6 combinations in total (not every shelf enclosuremodel works with all system classes). Since we find thatthe enclosure model also has a strong impact on storagesubsystem failures, we group data based on system class,shelf enclosure model, and disk model so that we can sep-arately study the effects of these factors. In this section,we mainly focus on disk model; shelf enclosure modelwill be discussed in Section 4.2.There are a total of 20 disk models used in these sys-
tems, and each disk model is denoted as family-type, withthe same convention as in [2]. For anonymization pur-pose, a single letter is used to represent a disk family (e.g.,Seagate Cheetah 10k.7), and type is a single number in-dicating the disk’s capacity. The relative capacity withina family is ordered by the number. For example,Disk A-2is larger than A-1 and B-2 is larger than B-1.
Finding (3): Storage subsystems using disks from a prob-lematic disk family show much higher (2 times) AFR thanother storage subsystems.Implications: Disk model is a critical factor to considerfor designing reliable storage subsystems.
We can see from Figure 5 (a)-(f) that for most storagesubsystems, AFR is about 2% - 4%. However, storagesubsystems using Disk H-1 and Disk H-2 show 3.9%-8.3% AFR, higher than the average AFR by a factor oftwo.We know that Disk H-1 and Disk H-2 are problematic.
It is interesting to observe that not only disk failures butalso protocol failures and performance failures are neg-atively affected by the problematic disks. The possiblereason is that as disks experience failures, corner-casebugs in the protocol stacks are more likely to be triggered,leading to more occurrences of protocol failures. At thesame time, some I/O requests cannot be served in time,causing more performance failures.
Finding (4): Storage subsystems using disks from thesame disk models exhibit similar disk failure rates acrossdifferent system environments (different system class orshelf enclosure models), but they show very different stor-age subsystem failure rates.Implications: Factors other than disk models also heav-ily affect storage subsystem failures, while they are notrevealed by disk failures.
As Figure 5 shows, some disk models are used by stor-age subsystems of multiple system classes, together withvarious shelf enclosure models. For example, Disk A-2
FAST ’08: 6th USENIX Conference on File and Storage TechnologiesUSENIX Association 117

0.01.02.03.04.05.06.07.08.09.0
10.0
Disk I - 1 Disk J - 1 Disk J - 2 Disk K - 1 Disk I - 2
AFR
(%)
Performance FailureProtocol FailurePhysical Interconnects FailureDisk Failure
0.01.02.03.04.05.06.07.08.09.0
10.0
Disk A - 2 Disk A - 3 Disk D - 2 Disk D - 3 Disk H - 2
AFR
(%)
Performance FailureProtocol FailurePhysical Interconnects FailureDisk Failure
0.01.02.03.04.05.06.07.08.09.0
10.0
Disk A - 2 Disk A - 3 Disk D - 2 Disk D - 3 Disk H - 2
AFR
(%)
Performance FailureProtocol FailurePhysical Interconnects FailureDisk Failure
(a) Near-line w/ Shelf Model C (b) Low-end w/ Shelf Model A (c) Low-end w/ Shelf Model B
0.01.02.03.04.05.06.07.08.09.0
10.0
Disk B - 1 Disk C - 1 Disk G - 1 Disk H - 1
AFR
(%)
Performance FailureProtocol FailurePhysical Interconnects FailureDisk Failure
0.01.02.03.04.05.06.07.08.09.0
10.0
DiskA - 1
DiskA - 2
DiskC - 1
DiskC - 2
DiskD - 1
DiskD - 2
DiskD - 3
DiskE - 1
DiskH - 1
DiskH - 2
AFR
(%)
Performance FailureProtocol FailurePhysical Interconnects FailureDisk Failure
0.01.02.03.04.05.06.07.08.09.0
10.0
DiskA - 2
DiskA - 3
DiskC - 2
DiskD - 2
DiskD - 3
DiskE - 1
DiskF - 1
DiskF - 2
DiskH - 1
DiskH - 2
AFR
(%)
Performance FailureProtocol FailurePhysical Interconnects FailureDisk Failure
(d) Mid-range w/ Shelf Model C (e) Mid-range w/ Shelf Model B (f) High-end w/ Shelf Model BFigure 5. AFR for storage subsystems by disk models.
and Disk D-2 are used in low-end systems with differ-ent shelf models and by mid-range and high-end systemswith the same shelf model.As we can see from Figure 5, for the storage subsys-
tems using the same disk models, disk failure rates do notchange much. For example, disk AFR of Disk D-2 variesfrom 0.6% to 0.77%with a standard deviation of 8%. Forall storage subsystems sharing the same disk models, theaverage standard deviation of disk AFR is less than 11%.On the other hand, the storage subsystemAFR exhibits
strong variation. For example, AFR for storage subsys-tems using Disk D-2 varies from 2.2% to 4.9%, with astandard deviation of 127%. For all such storage subsys-tems, the average standard deviation of storage subsys-tem AFR is as high as 98%. This observation indicatesthat storage subsystem AFR is strongly affected by fac-tors other than disk model, while these factors do not af-fect disk failures much.
Finding (5): The AFR for disks and storage subsystemsdoes not increase with disk size.Implications: As disk capacity rapidly increases, stor-age subsystems will not necessarily experience more diskfailures or storage subsystem failures.
We do not observe increasing disk failure rate or stor-age subsystem failure rate with increasing disk capacity.For example, as Figure 5 (e) shows, storage subsystems
using Disk D-2 show lower disk and storage subsystemAFR than those using Disk D-1.
4.2 Shelf Enclosure Model
Shelf enclosures contain power supplies, cooling de-vices, and prewired backplanes that carry power and I/Obus signals to the disks mounted in them. Different shelfenclosure models are different in design and have differ-ent mechanisms for providing these services; therefore,it is interesting to see how shelf enclosure model affectsstorage subsystem failures.In order to study the impact of the shelf enclosure
model, we look at the data collected from low-end storagesystems, since low-end systems use the same disk mod-els with different shelf enclosure models, so that we canstudy the effect of shelf enclosure models without infer-ence from disk models.
Finding (6): The shelf enclosure model has a strong im-pact on storage subsystem failures, and different shelf en-closure models work better with different disk models.Implications: To build a reliable storage subsystem,hardware components other than disks (e.g., shelf enclo-sure) should also be carefully selected. And due to com-ponent interoperability issues, there might be a different“best choice” for one component depending on the choiceof other components.
FAST ’08: 6th USENIX Conference on File and Storage Technologies USENIX Association118

0.01.02.03.04.05.06.07.08.09.0
Shelf Enclosure Model A Shelf Enclosure Model B
AFR
(%)
Performance FailureProtocol FailurePhysical Interconnects FailureDisk Failure
0.01.02.03.04.05.06.07.08.09.0
Shelf Enclosure Model A Shelf Enclosure Model B
AFR
(%)
Performance FailureProtocol FailurePhysical Interconnects FailureDisk Failure
0.01.02.03.04.05.06.07.08.09.0
Shelf Enclosure Model A Shelf Enclosure Model B
AFR
(%)
Performance FailureProtocol FailurePhysical Interconnects FailureDisk Failure
0.01.02.03.04.05.06.07.08.09.0
Shelf Enclosure Model A Shelf Enclosure Model B
AFR
(%)
Performance FailureProtocol FailurePhysical Interconnects FailureDisk Failure
(a) Disk-A2 (b) Disk-A3 (c) Disk-D2 (d) Disk-D3
Figure 6. AFR for storage subsystems of low-end storage systems by shelf enclosure modelsusing the same disk models (a subset of data from Figure 5). The error bars show 99.5%+confidence intervals for physical interconnect failures.
Figure 6 (a)-(d) shows AFR for storage subsystemswhen configured with different shelf enclosure modelsbut the same disk models. As expected, shelf enclosuremodel primarily impacts physical interconnect failures,with little impact on other failure types, different fromdisk model, which impacts all failure types.To confirm this observation, we tested the statistical
significance using a T-test [15]. As Figure 6 (a) shows,the physical interconnect failures with different shelf en-closure models are quite different (2.66 ± 0.23% versus2.18 ± 0.13%). A T-test shows that this is significantat the 99.5% confidence interval, indicating that the hy-pothesis that physical interconnect failures are impactedby shelf enclosure models is very strongly supported bythe data. Figure 6(b)-(d) shows similar observations withsignificance at 99.5%, 99.9%, and 99.9% confidence.It is also interesting to observe that for different disk
models, different shelf enclosure models work better. Forexample, forDisk-A2, storage subsystems using Shelf En-closure B show better reliability than those using ShelfEnclosure A, while for Disk-A3, Disk-D2, and Disk-D3,Shelf Enclosure A is more reliable. Such observationsmight be due to component interoperability issues be-tween disks and shelf enclosures. This indicates that wemight not be able to make the best decision on selectingthe most reliable hardware components without evaluat-ing the components from a system perspective and takingthe effect of interoperability into account.
4.3 Network Redundancy Mechanism
As we have seen, physical interconnect failures con-tribute to a significant fraction (27-68%) of storage sub-system failures. Since physical interconnect failures aremainly caused by network connectivity issues in storagesubsystems, it is important to understand the impact ofnetwork redundancy mechanisms on storage subsystemfailures.For the mid-range and high-end systems studied in this
paper, FC drivers support a network redundancy mecha-nism, commonly called active/passive multipathing. Thisnetwork redundancy mechanism connects shelves to twoindependent FC networks, and redirects I/O requeststhrough the redundant FC network when one FC networkexperiences network component failures (e.g., broken ca-bles).To study the effect of this network redundancy mech-
anism, we look at the data collected from mid-rangeand high-end storage systems, and group them based onwhether the network redundancymechanism is turned on.As we observed from our data set, about 1/3 of storagesubsystems are utilizing the network redundancy mech-anism, while the other 2/3 are not. We call these twogroups of storage subsystems dual paths systems and sin-gle path systems, respectively. In our data set, there arevery few disk models used in both configurations; otherdisk models are mainly used in either dual paths sys-tems or single path systems. Therefore, we cannot furtherbreak down the results based on disk models and shelf en-closure models.
Finding (7): Storage subsystems configured with net-work redundancy mechanisms experience much lower(30-40% lower) AFR than other systems. AFR for physi-cal interconnects is reduced by 50-60%.Implications: Network redundancy mechanisms such asmultipathing can greatly improve the reliability of storagesubsystems.
Figure 7 (a) and (b) show the AFR for storage subsys-tems in mid-range and high-end systems, respectively. Asexpected, secondary path reduces physical interconnectfailures by 50-60% (1.82 ± 0.04% versus 0.91 ± 0.09%and 2.13 ± 0.07% versus 0.90 ± 0.06%), with little im-pact on other failure types. Since physical interconnectfailure is just a subset of all storage subsystem failures,AFR for storage subsystems is reduced by 30-40%. This
FAST ’08: 6th USENIX Conference on File and Storage TechnologiesUSENIX Association 119

0.00.51.01.52.02.53.03.54.04.55.0
Single Path Dual Paths
AFR
(%)
Performance FailureProtocol FailurePhysical Interconnects FailureDisk Failure
0.00.51.01.52.02.53.03.54.04.55.0
Single Path Dual Paths
AFR
(%)
Performance FailureProtocol FailurePhysical Interconnects FailureDisk Failure
(a) Mid-range systems (b) High-end systems
Figure 7. AFR for storage subsystems broken down by the number of paths. The error barsshow 99.9% confidence intervals for physical interconnect failures.
indicates that multipathing is an exceptionally good re-dundancy mechanism that delivers reduction of failurerates as promised. As we applied a T-test on these re-sults, we found out that for both mid-range and high-endsystems the observation is significant at the 99.9% con-fidence interval, indicating that the data strongly supportthe hypothesis that physical interconnect failures are re-duced by multipathing configuration.However, the observation also tells us that there is still
further potential in network redundancy mechanism de-signs. For example, given that the probability for one net-work to fail is about 2%, the idealized probability for twonetworks to both fail should be a few magnitudes lower(about 0.04%). But the AFR we observe is far from theideal number.One reason is that not only failures from networks
between shelves contribute to physical interconnect fail-ures; other failures, such as shelf backplane errors, canalso lead to physical interconnect failures, while mul-tipathing does not provide redundancy for shelf back-plane. Another possible reason is that most modern hostadapters support more than one port, and each port can beused as a “logical” host adapter. If two independent net-works are initiated by two “logical” host adapters sharingthe same physical host adapter, a host adapter failure cancause failures of both networks.
5 Statistical Properties of Storage Subsys-tem Failures
An important aspect of storage subsystem failures istheir statistical properties. Understanding the statisticalproperties such as failure distribution of modern storagesubsystems is necessary to build right testbed and faultinjection models to evaluate existing resiliency mecha-
Disk Disk Disk Disk Disk Disk
Disk Disk Disk Disk Disk Disk
Disk Disk Disk Disk Disk Disk
Shelf 1
Shelf 2
Shelf 3
RAID group 1 RAID group 2 RAID group 3
Figure 8. Disk layout in shelf enclosuresand RAID groups.
nisms and to develop better ones. For example, someresearchers have assumed a constant failure rate, whichmeans an exponentially distributed time between failures,and that failures are independent, when calculating theexpected time to failure for a RAID [13].
Figure 8 illustrates how disks are laid out in stor-age subsystems. As Figure 8 shows, multiple disks aremounted in one shelf enclosure and share the cooling ser-vice, power supply, and intrashelf connectivity providedby the shelf enclosure.
The figure also shows how disks are assigned to buildup RAID groups, which include both data disks and par-ity disks containing redundant data. In order to preventshelf enclosure from being the single point of failures fora whole RAID group, it is a common practice for a RAIDgroup to span disks from multiple shelf enclosures.
In this section, we will study the statistical property ofstorage subsystem failures both from a shelf perspectiveand from a RAID group perspective.
FAST ’08: 6th USENIX Conference on File and Storage Technologies USENIX Association120

Empirical CDF
0.0
0.1
0.2
0.3
0.4
0.5
0.6
0.7
0.8
0.9
1.0
1 100 10000 1000000 100000000Time between failures(sec)
Frac
tion
of fa
ilure
s
PhysicalInterconnects Failure
Protocol Failure
Performance Failure
Overall StorageSubsystem Failure
Disk Failure
Gamma (DiskFailure)
Weibull (Disk Failure)
Exponential (DiskFailure)
(a) Failure distribution in a shelf (b) Failure distribution in a RAID group
Figure 9. Distribution of time between failures in about 155,000 shelves and 230,000 RAIDgroups during 44 months.
5.1 Time Between Failures
Figure 9 (a) and (b) show the empirical cumulativedistribution function (CDF) of time between storage sub-system failures from a shelf and from a RAID group, re-spectively. To study the failure distribution from differentdisks in the same shelf/RAID group, we filtered out allduplicate failures. Since we only know when the failuresare detected, instead of when the failures occur, the CDFsdo not start from “zero” point. As all the storage subsys-tems studied in this paper send data verification requeststo all disks hourly, as a proactive method to detect fail-ures, we expect a short lag (up to an hour) between theoccurrence and the detection of storage subsystem fail-ures.
Finding (8): Physical interconnect failures, protocol fail-ures, and performance failures show much stronger tem-poral locality (“bursty” pattern) than disk failures.Implications: RAID-based resiliency mechanisms,which are designed for handling disk failures, might not beeffective in handling all storage subsystem failure types.
As can be seen in Figure 9 (a), overall storage sub-system failures are very “bursty.” About 48% of overallstorage subsystem failures arrive at the same shelf within10,000 seconds of the previous failure. As expected,physical interconnect failures show the highest tempo-ral locality, while even protocol failures and performancefailures show strong temporal locality. None of these fail-ure types follows distributions commonly used in failuretheory, such as exponential distribution, Gamma distribu-tion, or Weibull distribution.
On the other hand, disk failures show a much less“bursty” pattern, and the Gamma distribution provides abest fit for disk failure. For disk failures, we cannot rejectthe null hypothesis that disk failures follow the Gammadistribution with the Chi-Square-Test at the significancelevel of 0.05.
Finding (9): Storage subsystem failures from a RAIDgroup exhibit lower temporal locality (less “bursty” pat-tern) than failures from a shelf enclosure.Implications: Spanning RAID groups across multipleshelves is an effective way to reduce the probability formultiple storage subsystem failures to happen during ashort period of time.
As wementioned above, it is common to build a RAIDgroup across multiple shelves, in order to prevent shelffrom being a single point of failure. As we found outfrom the storage logs, a RAID group on average spansabout 3 shelves.Figure 9 (b) shows the CDF of time between failures
from the same RAID group. Compared to Figure 9 (a),failures are less “bursty.” About 30% of failures arriveat the same RAID group within 10,000 seconds of theprevious failure, lower than 48% for failures from thesame shelf enclosure. For all failure types, the temporallocality is reduced. This observation supports the com-mon practice of building a RAID group across multipleshelves and encourages storage system designers to dis-tribute RAID groups more sparsely.
FAST ’08: 6th USENIX Conference on File and Storage TechnologiesUSENIX Association 121

Finding (10): Storage subsystem failures of one RAIDgroup still exhibit strong temporal locality.Implications: We need resiliency mechanisms that canhandle “bursty” failures.
However, Figure 9 (b) still shows strong temporal lo-cality, since multiple shelves may share the same physi-cal interconnect, and a network failure can still affect alldisks in the RAID group.We repeated this analysis using data broken down by
system classes and shelf enclosure models. In all cases,similar patterns and trends were observed.
5.2 Correlations Between Failures
Our analysis of the correlation between failures iscomposed of two steps:(1) Derive the theoretical failure probability modelbased on the assumption that failures are indepen-dent.(2) Evaluate the assumption by comparing the theo-retical probability against empirical results.Next, we describe the statistical method we use for
deriving the theoretical failure probability model.
5.2.1 Statistical Method
We denote the probability for a shelf enclosure (includingall mounted disks) to experience one failure during timeT as P(1) and denote the probability for it to experiencetwo failures during T as P(2). Let f(t) specify the failureprobability at moment t.Assume failures are independent, then we know that
P (1) =
∫T
0
f(t)dt (1)
P (2) =
∫ T
t2
(
∫ t2
0
f(t1)dt1)dt2
=1
2(2 ∗
∫ T
t2
(
∫ t2
0
f(t1)dt1)dt2)
=1
2(
∫ T
0
f(t)dt)2 (2)
Therefore,
P (2) =1
2P (1)2 (3)
and more generally(the proof is skipped due to limitedspace),
P (N) =1
N !P (1)N (4)
We can derive the same formula for RAID group fail-ure probability by replacing shelf enclosure with RAIDgroup in the derivation above.It is important to notice that the relation shown in
equation 3 is a variation of a more common form:
P (A1, A2) = P (A1) ∗ P (A2) (5)The main difference is that we do not care about the
order of failures in equation 3.In the next section, we will compare this theoreti-
cally derived model against the empirical results col-lected from storage logs.
5.2.2 Correlation Results
To evaluate the theoretical relation between P(1) and P(2)shown in equation 3, we first calculate empirical P(1) andempirical P(2) from storage logs. Empirical P(1) is thepercentage of shelves (RAID groups) that have experi-enced exactly one failure during time T (we set T as oneyear), and empirical P(2) is the percentage of the onesthat have experienced exactly two failures during time T.Only storage systems that have been in the field for oneyear or more are considered.
Finding (11): For each failure type, storage subsystemfailures are not independent. After one failure, probabilityof additional failures (of the same type) is higher.Implications: The probability of storage subsystem fail-ures depends on factors shared by all disks in the sameshelf enclosures (or RAID groups).
Figure 10 (a) shows the comparison between empiri-cal P(2) and theoretical P(2), which is calculated basedon empirical P(1). As we can see in the figure, empiricalP(2) is higher than theoretical P(2). More specifically,for disk failure, the observed empirical P(2) is higherthan theoretical P(2) by a factor of 6. For other typesof storage subsystem failures, the empirical probability ishigher than the theoretical correspondences by a factor of10-25. Furthermore, T-tests confirm that the theoreticalP(2) and the empirical P(2) are statistically different with99.5% confidence intervals.This is a strong indication that, when a shelf experi-
ences a storage subsystem failure, the probability for itto have another storage subsystem failure increases. Inanother word, storage subsystem failures from the sameshelves are not independent.Figure 10 (b) shows the similar trend for the failures
from the same RAID groups. Therefore, the same con-clusion can be made for storage subsystem failures fromthe same RAID groups.Although in Figure 10 we set T to be one year, the
conclusion is general to different values of T. We have set
FAST ’08: 6th USENIX Conference on File and Storage Technologies USENIX Association122

0.00.20.40.60.81.01.21.41.61.82.02.2
Disk Failure PhysicalInterconnects
Failure
Protocol Failure PerformanceFailure
Failu
re R
ate
(%)
Empirical P(2)Theoretical P(2)
0.00.20.40.60.81.01.21.41.61.82.02.22.4
Disk Failure PhysicalInterconnects
Failure
Protocol Failure PerformanceFailure
Failu
re R
ate
(%)
Empirical P(2)Theoretical P(2)
(a) Shelf enclosure failures (b) RAID group failures
Figure 10. Comparison between theoretical model against empirical results. Theoretical P(2)is calculated based on equation 3. The error bars show 99.5%+ confidence intervals.
T to 3 months, 6 months, and 2 years, and also groupeddata based on other factors, such as system classes andshelf enclosure models. In all cases, similar correlationswere observed.
5.2.3 Causes of Correlation
There are several reasons that can explain the correlationbetween each type of storage subsystem failures.The disk failure probability depends on environmental
factors, such as temperature [4]. Disks in the same shelfor the same RAID group are close to each other, shar-ing the same room temperature. Furthermore, disks inthe same shelf are also sharing the cooling facility (e.g.,fans) provided by the shelf. When the machine room tem-perature is above or below the normal range, all disks inthe same shelf and the same RAID group may experiencea higher than normal failure probability. Similarly, whenshelf cooling facility does not work properly, all disks inthe same shelf may have higher probability to fail.Most physical interconnect components, such as host
adapters, cables, and FC terminators on the shelf, areshared by disks in the same shelf or in the same RAIDgroup. When a physical interconnect component such asa host adapter experiences transient hardware errors, alldisks in the same shelf or the same RAID group have ahigher than normal probability of physical interconnectfailures.Similarly, drivers for disks in the same shelf or the
same RAID group are usually updated around the sametime. If a particular version is buggy or has compatibilityissues, all disks will have a higher probability of protocolfailures.
6 Related Work
Disk failure characteristic studies There are generallytwo categories of disk failure studies: vendor studies anduser experience studies.For example, Seagate and Quantum study long-term
reliability characteristics through accelerated life tests ofsmall populations and collecting statistics from their re-turn unit databases [4, 21]. Based on such tests, theycalculate the mean-time-to-failure (MTTF) and record itin a disk specification. For most of the disks, the spec-ified MTTF is typically more than one million hours,equivalent to a lower than 1% annualized failure rate(AFR), which is slightly lower than what we observed(0.9-1.9%).But vendor-specified MTTF is usually not what has
been experienced by users. A study explained how diskmanufactures and end customers can calculate MTTF indifferent ways [7].Motivated by this observation, recently researchers
have studied disk failures from a user’s perspective by an-alyzing disk replacement logs collected in the field [14,16]. Interestingly, they found disks are replaced muchmore frequently (2-4 times) than vendor-specified AFRs.More interestingly, [16] found that the time betweendisks replacements in the same machine room does notfollow the exponential distribution and exhibits signifi-cant levels of correlation. This finding is consistent withwhat we find about the time between storage subsystemfailures in the same shelf and the same RAID group,while we further found out that different failure typesshow different statistical properties.Additionally, some researchers analyzed the charac-
teristics of disk latent sector errors, which can potentiallylead to complete disk failures, using the data from Net-
FAST ’08: 6th USENIX Conference on File and Storage TechnologiesUSENIX Association 123

work Appliance AutoSupport Database as in [2]. Basedon the same set of data, they further conducted a study ondata corruption in [3]. They found enterprise class (e.g.FC) disks are more reliable than near-line (SATA) disks.Similarly, we discovered that FC disks have lower AFR(0.9%) compared to SATA disks (1.9%). However, wealso observed that storage systems using FC disks are notnecessarily more reliable than those using SATA disks,due to other component failures.Some studies also look at the factors affecting disk
failure rate, such as disk model, the number of disk heads,disk size, and environmental factors [2, 6, 14]. Similarly,in this paper, we looked at factors affecting storage fail-ure rate, and found out that some factors strongly affect-ing storage failure rate have little impact on disk failurerate.
System component failure studies Unfortunately, thereis little work published on analyzing the reliability ofstorage system components. Early work [17] presenteda reliability analysis on disk array, and claimed that othersystem components such as power supplies, HBAs, cool-ing equipment, and cabling cannot be ignored when ana-lyzing the reliability of a disk array. However, their studywas not based on real-world data. Instead, they estimatedreliability of disk array based on formula and datasheet-specified MTTF of each components, assuming compo-nent failures follow exponential distributions and failuresare independent.One of the very few empirical studies on storage sys-
tem failures was presented in [20]. This paper presentedan analysis of hardware failures in their prototype stor-age systems during 6 months. They found out that disksare among the most reliable components in the system,while SCSI components (physical interconnects in theirprototypes) generated a considerable number of failures.These findings are consistent with our study. However,limited by the scale of the study, their failure sample size(limited to 16 storage systems and a few hundred failures)is too small to study important characteristics of failuressuch as failure distribution and failure correlations, nor toidentify factors affecting storage system reliability. An-other related empirical study looked at storage systemoutages based on 4,400 system-year records, and cate-gorized the outages based on their root causes [11]. Al-though sharing the similar goal of categorizing failures,our study looks into the details of the storage subsys-tem failure, which is considered as one outage categoryin [11]. Furthermore, our study is based on data in a muchlarger scale (about 137,000 system-years).Beyond storage systems, an analysis of Tandem sys-
tems found out that software errors are an increasing por-tion of failures reported by customers [10]. Similarly, wefound that protocol stacks account for 5-10% of storagesubsystem failures.
7 Conclusion
This paper presents a study of the real-world storagesubsystem failures, examining the contribution of differ-ent failure types, the effect of some factors on failures,and the statistical properties of failures.
Our study is based on support logs collected from39,000 commercially deployed storage systems, whichcontain about 1,800,000 disks mounted in about 155,000shelf enclosures. The studied data cover a period of 44months. The result of our study provides guidelines fordesigning more reliable storage systems and developingbetter resiliency mechanisms.
Although disks are the primary components of stor-age subsystems and disk failures contribute to 20-55%of storage subsystem failures, other components such asphysical interconnects and protocol stacks also accountfor significant percentages (27-68% and 5-10%, respec-tively) of storage subsystem failures. The results clearlyshow that the rest of storage subsystem components can-not be ignored when designing a reliable storage system.
One way to improve storage system reliability is to se-lect more reliable components. As data suggests, storagesystem reliability is highly dependent on both disk modeland shelf enclosure model. We also found out that theremight be a different “better” model for different storagesystems, depending on other components used in the sys-tems. Another way to improve reliability is to employredundancy mechanisms to tolerate component failures.One suchmechanism studied in the paper is multipathing,which can reduce AFR for storage systems by 30-40%when the number of paths is increased from one to two.Storage system designers should also think about usingsmaller shelves (fewer disks per shelf) but more shelvesin storage systems, since data indicates that spanning aRAID group across multiple shelves can reduce the prob-ability of “bursty” failures.
We also found out that storage subsystem failure andindividual storage subsystem failure type exhibit strongself-correlations. In addition, these failures also exhibit“bursty” patterns. These results motivate a revisit to re-siliency mechanisms such as RAID that assume indepen-dent failures.
Future work will compare the impact of different fail-ure types and study how to design resiliency mechanismstargeting individual failure types, given that different fail-ure types show different statistical properties. Anotherfuture direction is to design storage failure prediction al-gorithms based on component errors. We also want toextend this study to other components of storage systemsbeyond the storage subsystem.
FAST ’08: 6th USENIX Conference on File and Storage Technologies USENIX Association124

8 Acknowledgments
We greatly appreciate our shepherd, Andrea Arpaci-Dusseau, for her invaluable feedback and precious time,and the anonymous reviewers for their insightful com-ments. We also wish to thank Rajesh Sundaram andSandeep Shah for providing us with insights on storagefailures. We are thankful to Frederick Ng, George Kong,Larry Lancaster, and Aziz Htite for offering help on un-derstanding and gathering storage logs. We appreciateuseful comments from members of the Advanced De-velopment Group, including David Ford, Jiri Schindler,Dan Ellard, Keith Smith, James Lentini, Steve Byan, SaiSusarla, and Shankar Pasupathy. Finally, we would liketo thank Lakshmi Bairavasundaram for his useful com-ments. This research has been funded by Network Ap-pliance under the “Intelligent Log Mining” project at CSUIUC. Work of the first two authors was conducted inpart as summer interns at Network Appliance.
References
[1] B. Allen. Monitoring hard disks with smart. Linux Journal,2004(117):9, 2004.
[2] L. N. Bairavasundaram, G. R. Goodson, S. Pasupathy, andJ. Schindler. An analysis of latent sector errors in disk drives.SIGMETRICS Perform. Eval. Rev., 35(1):289–300, 2007.
[3] L. N. Bairavasundaram, G. R. Goodson, B. Schroeder, A. C.Arpaci-Dusseau, and R. H. Arpaci-Dusseau. An Analysis of DataCorruption in the Storage Stack. In FAST ’08: Proceedings of the6th USENIX Conference on File and Storage Technologies, SanJose, CA, Feb. 2008.
[4] G. Cole. Estimating drive reliability in desktop computers andconsumer electronics systems. Technical report, Seagate Tech-nology Paper TP-338.1, 2000.
[5] P. Corbett, B. English, A. Goel, T. Grcanac, S. Kleiman, J. Leong,and S. Sankar. Row-diagonal parity for double disk failure cor-rection. In FAST ’04: Proceedings of the 3rd USENIX Conferenceon File and Storage Technologies, pages 1–14, 2004.
[6] J. G. Elerath and S. Shah. Disk drive reliability case study: de-pendence upon head fly-height and quantity of heads. Reliabilityand Maintainability Symposium, pages 608–612, 2003.
[7] J. G. Elerath and S. Shah. Server class disk drives: how reliableare they. IEEE Reliability and Maintainability Symposium, pages151–156, 2004.
[8] EMC Symmetrix DMX-4 Specification Sheet.http://www.emc.com/products/systems/symmetrix/symmetriDMX1000/pdf/DMX3000.pdf, July 2007.
[9] S. Ghemawat, H. Gobioff, and S.-T. Leung. The Google file sys-tem. In SOSP ’03: Proceedings of the nineteenth ACM sympo-sium on Operating systems principles, pages 29–43, New York,NY, USA, 2003.
[10] J. Gray. A census of tandem system availability between 1985and 1990. In Proceedings of the IEEE Transactions on Reliability,1990.
[11] L. Lancaster and A. Rowe. Measuring real-world data availabil-ity. In LISA ’01: Proceedings of the 15th USENIX conference onsystem administration, pages 93–100, Berkeley, CA, USA, 2001.
[12] FAS6000 Series Technical Specifications.http://www.netapp.com/products/filer/fas6000 tech specs.html.
[13] D. A. Patterson, G. A. Gibson, and R. H. Katz. A case for redun-dant arrays of inexpensive disks (RAID). In H. Boral and P.-A.Larson, editors, Proceedings of the 1988 ACM SIGMOD Inter-national Conference on Management of Data, Chicago, Illinois,June 1-3, 1988, pages 109–116. ACM Press, 1988.
[14] E. Pinheiro, W.-D. Weber, and L. A. Barroso. Failure trends in alarge disk drive population. In FAST ’07: Proceedings of the 5thconference on USENIX Conference on File and Storage Technolo-gies, Berkeley, CA, USA, 2007.
[15] A. C. Rosander. Elementary Principles of Statistics. D. Van Nos-trand Company, 1951.
[16] B. Schroeder and G. A. Gibson. Disk failures in the real world:what does an MTTF of 1,000,000 hours mean to you? In FAST’07: Proceedings of the 5th conference on USENIX Conferenceon File and Storage Technologies, Berkeley, CA, USA, 2007.
[17] M. Schulze, G. A. Gibson, R. H. Katz, and D. A. Patterson. Howreliable is a RAID? In COMPCON, pages 118–123, 1989.
[18] S. Shah and J. G. Elerath. Reliability analysis of disk drive failuremechanisms. In IEEE Reliability and Maintainability Symposium,pages 226–231, 2005.
[19] Storage Networking Industry Association Dictionary.http://www.snia.org/education/dictionary/.
[20] N. Talagala and D. Patterson. An analysis of error behaviourin a large storage system. Technical Report UCB/CSD-99-1042,EECS Department, University of California, Berkeley, Feb 1999.
[21] J. Yang and F.-B. Sun. A comprehensive review of hard-disk drivereliability. In Reliability and Maintainability Symposium, pages403–409, 1999.Trademark Notice: NetApp, the Network Appliance logo are reg-
istered trademarks and Network Appliance is a trademark of NetworkAppliance, Inc. in the U.S. and other countries. All other brands orproducts are trademarks or registered trademarks of their respectiveholders and should be treated as such.
FAST ’08: 6th USENIX Conference on File and Storage TechnologiesUSENIX Association 125