are cross-cultural comparisons of personality profiles
TRANSCRIPT

PERSONALITY PROCESSES AND INDIVIDUAL DIFFERENCES
Are Cross-Cultural Comparisons of Personality Profiles Meaningful?Differential Item and Facet Functioning in the Revised NEO
Personality Inventory
A. Timothy Church, Juan M. Alvarez,Nhu T. Q. Mai, Brian F. French, and
Marcia S. KatigbakWashington State University
Fernando A. OrtizGonzaga University
Measurement invariance is a prerequisite for confident cross-cultural comparisons of personality profiles.Multigroup confirmatory factor analysis was used to detect differential item functioning (DIF) in factorloadings and intercepts for the Revised NEO Personality Inventory (P. T. Costa, Jr., & R. R. McCrae,1992) in comparisons of college students in the United States (N � 261), Philippines (N � 268), andMexico (N � 775). About 40%–50% of the items exhibited some form of DIF and item-levelnoninvariance often carried forward to the facet level at which scores are compared. After excluding DIFitems, some facet scales were too short or unreliable for cross-cultural comparisons, and for some otherfacets, cultural mean differences were reduced or eliminated. The results indicate that considerablecaution is warranted in cross-cultural comparisons of personality profiles.
Keywords: measurement invariance, differential item functioning, cross-cultural comparisons, RevisedNEO Personality Inventory
The cross-cultural generalizability of the five-factor model(FFM) of personality has been demonstrated in many cultures(McCrae & Allik, 2002), particularly when measured by importedinventories such as the Revised NEO Personality Inventory (NEO-PI-R; Costa & McCrae, 1992). Researchers have begun to drawconclusions about cultural differences in average trait levels bycomparing mean profiles on the NEO-PI-R and other measures ofthe Big Five dimensions of Neuroticism, Extraversion, Opennessto Experience, Agreeableness, and Conscientiousness (McCrae,2001, 2002; McCrae et al., 2010; Schmitt, Allik, McCrae, &Benet-Martınez, 2007; Terracciano et al., 2005). In the presentstudy, we investigated the validity or meaningfulness of suchcomparisons by testing an important prerequisite, the cross-cultural measurement invariance of the NEO-PI-R at the item andfacet levels.
We also address an important methodological issue—the extent towhich lack of measurement invariance at the item level can carryforward to the scale level of personality inventories (French, Maller,& Zumbo, 2007; Li & Zumbo, 2009; Waller, Thompson, & Wenk,2000; Zumbo, 2003; Zumbo & Koh, 2005). Although this issue hasbeen addressed primarily by quantitative psychologists, it is also ofcentral importance to personality psychologists, because it is at thescale level that scores on personality inventories are compared acrosscultures. In the case of the NEO-PI-R, lack of measurement invari-ance at the item level would call into question cross-cultural compar-isons of facet scores. Lack of measurement invariance at the facetlevel would suggest that the facet scores are not equivalent indicatorsof the respective Big Five traits, and would call into question com-parisons of either the facet or domain scores.
There are cogent theoretical reasons for comparing mean pro-files across cultures. Such comparisons could increase our under-standing of ecological, cultural, and biological influences on per-sonality. For example, Hofstede and McCrae (2004) foundrelationships between dimensions of culture (i.e., Individualism,Uncertainty Avoidance, Power Distance, and Masculinity) andcountry-level means for the NEO-PI-R Big Five domain scoresthat suggested cultural influences on personality. Other researchershave observed higher average Extraversion and Openness to Ex-perience scores of immigrant groups—or Europeans and Ameri-cans, as compared with Africans and Asians—and attributed thesedifferences to selective emigration and resulting gene flow (Cam-perio Ciani, Capiluppi, Veronese, & Sartori, 2007; Olson, 2007).From an applied perspective, knowledge of cultural mean differ-ences in trait levels, if large and reliable, might facilitate intercul-tural communications and adjustment.
This article was published Online First September 12, 2011.A. Timothy Church, Juan M. Alvarez, Nhu T. Q. Mai, Brian F. French,
and Marcia S. Katigbak, Department of Educational Leadership and Coun-seling Psychology, Washington State University; Fernando A. Ortiz, Coun-seling Center, Gonzaga University.
The research was supported by National Institute of Mental Health GrantMH59941 and National Science Foundation Grant 0953940. The data setsthat were combined for this study were from previous studies that ad-dressed different research questions and did not investigate differentialitem functioning (Church et al., 2007, 2008; Ortiz et al., 2007).
Correspondence concerning this article should be addressed to A. Tim-othy Church, Department of Educational Leadership and Counseling Psy-chology, Cleveland Hall, Washington State University, Pullman, WA99164-2136. E-mail: [email protected]
Journal of Personality and Social Psychology, 2011, Vol. 101, No. 5, 1068–1089© 2011 American Psychological Association 0022-3514/11/$12.00 DOI: 10.1037/a0025290
1068

Despite their potential value, comparisons of mean profilesacross cultures continue to generate controversy (e.g., Church,2008; Poortinga, Van de Vijver, & Van Hemert, 2002). For ex-ample, Bock (2000) pointed out that one of the primary reasons forthe downfall of the classic culture-and-personality school in an-thropology was its tendency to characterize the personality or“national character” of whole populations, while deemphasizingindividual variability. Bock has warned against fostering the same“uniformity assumption” in present cross-cultural studies of per-sonality profiles. With this in mind, McCrae (2004) remindedreaders that ascribing the mean trait level to all or specific indi-viduals represents unwarranted stereotyping, because there is sub-stantial within-culture variation in all traits. In addition, observedcultural differences are subject to a variety of substantive andartifactual interpretations that are difficult to disentangle, contrib-uting further to questions about the validity of cross-cultural pro-file comparisons.
Evidence For and Against Mean Profile Comparisons
Several sources of evidence suggest that aggregate personalityprofiles may be meaningful. Perhaps the most persuasive is thegeographical patterning of such profiles (Allik & McCrae, 2004;McCrae et al., 2010; Schmitt et al., 2007). For example, Allik andMcCrae (2004) found that neighboring countries were generallygrouped together in cluster and multidimensional scaling analysesof NEO-PI-R mean profiles. For example, European and Americancultures were generally contrasted with Asian and African cul-tures, with the former higher in Extraversion and Openness toExperience and lower in Agreeableness. There were also a numberof anomalies in the grouping of cultures, however. Schmitt et al.(2007) also reported sensible geographical patterning (with someanomalies) of Big Five Inventory profiles (Benet-Martınez & John,1998).
Meaningful external correlates of country-level trait means havealso been reported, including, for example, cultural dimensions,values, subjective well-being, organizational commitment, socio-sexuality, and various health-related behaviors and outcomes (e.g.,Allik & McCrae, 2004; Gelade, Dobson, & Gilbert, 2006; Hofst-ede & McCrae, 2004; McCrae & Terracciano, 2008; Schmitt et al.,2007). However, some correlations have been more difficult tointerpret or have not replicated well across studies or methods. Forexample, McCrae and Terracciano (2008) identified 530 statisti-cally significant (p � .05) culture-level correlates of NEO-PI-Rscores in observer data, but only 272 of the relationships replicatedin self-report data (McCrae, 2002).
Finally, the generalizability of country-level means across gen-der and age groups in both self-report and observer data suggeststhat these means may be reasonably valid (Costa, Terracciano, &McCrae, 2001; McCrae, 2001, 2002; McCrae, Terracciano, & 78Members of the Personality Profiles of Cultures Project, 2005a;McCrae et al., 2010; Schmitt et al., 2007). The average culturaldifferences that are observed with personality inventories—whatever their meaning—are reliably found across gender and age.
However, the validity of cultural mean profiles may be calledinto question by the limited convergence of country-level meansobtained with different Big Five measures (McCrae et al., 2010;Schmitt et al., 2007) and the failure of cultural mean profiles toconverge with informants’ ratings of typical personality in a cul-
ture (Church & Katigbak, 2002; McCrae et al., 2010; Terraccianoet al., 2005)—what Terracciano et al. have referred to as “nationalcharacter stereotypes.” In addition, cross-cultural psychologistshave noted various method and item biases that can reduce themeasurement equivalence of personality inventories across cul-tures (Church, 2010; Vanderberg & Lance, 2000; van de Vijver &Leung, 1997). These include sampling biases, translation inequiva-lencies, cultural differences in response styles or negative itembias, differential familiarity with test materials, and items that arenot equally relevant indicators of the personality constructs acrosscultures. Heine, Lehman, Peng, and Greenholtz (2002) have alsoargued that reference group effects—the tendency for respondentsin different countries to rate their traits in comparison to differentcultural norms or reference groups—will also confound cross-cultural mean comparisons.
Measurement Invariance
In the present study, we focused on one of the most fundamentalfactors that could invalidate—or at least raise significant concernsabout—mean profile comparisons across cultures, a lack of mea-surement invariance. Researchers have delineated several levels ofmeasurement invariance (Church, 2010; Vandenberg & Lance,2000; van de Vijver & Leung, 1997). Configural invariance isexhibited when the same number of constructs or factors, and thesame pattern of salient loadings, defines the structure of the in-strument across cultures. Metric invariance is present when thefactor loadings (i.e., regression slopes) for items that define theconstruct can be considered equal across cultures. Metric equiva-lence implies equivalent scale intervals, which facilitates compar-isons of the nomological networks of the constructs across cultures(Steenkamp & Baumgartner, 1998). Meaningful comparisons ofmean scores across cultures also require scalar invariance, a morestringent level in which the item intercepts can also be constrainedto be equal across cultures. The item intercepts, which are thevalues of each item corresponding to the zero value of the latentconstruct or trait, indicate whether the measurement scales havethe same origin or zero point across cultures (G. W. Cheung &Rensvold, 2000). Lack of measurement invariance at the item levelis often referred to as differential item functioning (DIF).
Configural and metric invariance have already been demon-strated at the facet level for the NEO-PI-R using principal com-ponents analysis (e.g., Katigbak, Church, Guanzon-Lapena, Car-lota, & del Pilar, 2002; McCrae & Allik, 2002; Ortiz et al., 2007).However, scalar invariance is rarely tested in personality inven-tories. In particular, we could identify only two previous studies inwhich DIF was examined across cultures in measures of the BigFive dimensions. Nye, Roberts, Saucier, and Zhou (2008) foundthat over 60% of the items in the Big Five Mini-Markers (Saucier,1994) exhibited DIF across American, Greek, and Chinese sam-ples. Elimination of DIF items had dramatic effects on the com-parisons of cultural means. Huang, Church, and Katigbak (1997)found that about 40% of the items in the original NEO-PI exhibitedDIF and that many apparent cultural differences between Ameri-cans and Filipinos were eliminated after DIF items were removed.In a comparison of Americans and Germans, Johnson, Spinath,Krueger, Angleitner, and Riemann (2008) found that over onethird of the items in the Multidimensional Personality Question-naire (MPQ; Tellegen & Waller, 2008) exhibited DIF and that
1069DIFFERENTIAL ITEM FUNCTIONING IN THE NEO-PI-R

removal of DIF items eliminated cultural mean differences for allbut one of the 11 scales. Applications of DIF methods to otherpersonality measures have yielded variable results, with someresearchers reporting small proportions of DIF items (i.e., 15% orless; Ellis, Becker, & Kimmel, 1993) and others reporting largerpercentages (e.g., 20%–60%; Butcher, 1996; Taylor & Boeyens,1991; van Leest, 1997; Waller et al., 2000).
On the basis of their MPQ results, Johnson et al. (2008) con-cluded that “it is not unreasonable to expect that many, if not most,of the translated questionnaires used in [cross-cultural] NEO-PI-Rcomparisons contain items that would show DIF if the appropriateanalyses were carried out” (p. 693). If so, then some apparentcultural differences might be artifactual, whereas some valid cul-tural differences might be masked by DIF. In addition, when manyDIF items are removed, it raises questions about construct under-representation and content validity in what remains of the instru-ment, making it unclear what aspects of the construct are beingcompared. Researchers differ in their views regarding the propor-tion of items that need to demonstrate invariance to enable cross-cultural comparisons (e.g., Byrne, Shavelson, & Muthen, 1989;Steenkamp & Baumgartner, 1998; Vandenberg & Lance, 2000).Ideally, most of the items will exhibit invariant factor loadings andintercepts, so that estimates of cultural means will be based largelyon equivalent items.
Item Versus Scale-Level Invariance
In considering the measurement invariance issue, McCrae, Ter-racciano, & 79 Members of the Personality Profiles of CulturesProject (2005b) and McCrae and Terracciano (2008) suggestedthat DIF may cancel out at the scale level, allowing for validcross-cultural comparisons of NEO-PI-R facet and domain scores.More generally, Labouvie and Ruetsch (1995) have argued that itis unrealistic to require invariance at the item level—for example,because most items are factorially complex—and that group com-parisons require only invariance at the scale level. A few research-ers have investigated the possibility that DIF might cancel out atthe scale level in personality inventories.
Consistent with the suggestion of McCrae, Terracciano, & 79Members (2005b), Waller et al. (2000) found substantial DIF in aninvestigation of Minnesota Multiphasic Personality Inventory fac-tor scales, but little differential test functioning (DTF). Similarly,Reise, Smith, and Furr (2001) found that one third of the items inthe NEO-PI-R Neuroticism scale exhibited gender DIF in a com-parison of American men and women, but very little differentialscale functioning was found. In contrast, Ellis and Mead (2000)found that about three fourths of the scales in a Spanish translationof the Sixteen Personality Factor Questionnaire (Cattell, Cattell, &Cattell, 1993) showed significant DTF, suggesting that DIF didtranslate to the scale level. Recent simulation studies suggest thatDIF can influence the psychometric properties of test scores (e.g.,coefficient alphas, score variances) depending on DIF type andseverity (French & Finch, 2008; French & Maller, 2006) and,ultimately, statistical tests regarding group mean differences (Li &Zumbo, 2009). In short, more attention needs to be placed onexamining the influence of DIF at the score level, the critical levelat which decisions and interpretations about groups are typicallymade. Overall, previous findings with both real and simulated data,although not extensive, suggest that DIF may not cancel out at the
scale or score level. However, this question has not yet beenexamined with the inventory that is most widely used in cross-national comparisons, the NEO-PI-R.
DIF Paradox
There is a paradox in the investigation of DIF. On the one hand,researchers interested in cross-cultural comparisons will prefer tofind little or no DIF. On the other hand, items that exhibit DIFmight reveal interesting cultural differences in the relevance orprevalence of the behavioral indicators of traits (Church, Katigbak,Miramontes, del Prado, & Cabrera, 2007; Huang et al., 1997;Johnson et al., 2008). Although a number of researchers havecommented on the difficulty of explaining DIF, they nonethelessnote the potential value of looking for patterns in the content ofDIF items (Ellis, 1990; Ellis et al., 1993; Huang et al., 1997;Johnson et al., 2008; Reise et al., 2001). Some DIF could be theresult of translation inequivalencies, sampling differences, moti-vational differences, or how cultural groups respond to particularitem formats (e.g., reverse-keyed items). Of greater interest forpersonality psychologists would be cultural differences in therelevance of the behaviors (items) as indicators of the associatedtraits, or the prevalence of the behaviors in the cultural groups.Researchers have tried to explain such differences in terms ofcultural values, norms, or practices. This DIF paradox reminds usthat some DIF may represent valid cultural differences in thebehavioral indicators of traits, rather than measurement artifacts.Even so, the presence of DIF detracts from measurement invari-ance and researchers’ ability to make confident mean comparisonsacross cultures.
Overview of the Present Study
We had several goals. The primary goal was to determine themeaningfulness of cross-cultural comparisons of mean profiles byexamining the item- and facet-level invariance of the NEO-PI-Racross three cultural samples, the United States, Mexico, and thePhilippines. Second, we sought to address the methodologicalquestion of whether lack of invariance at the item level carriesforward to the facet level at which personality scores are actuallycompared across cultures. In so doing, we also tested McCrae,Terracciano, & 79 Members’s (2005b) proposal that DIF maycancel out at the facet level. Third, we wished to determinewhether elimination of DIF items impacts apparent cultural meandifferences in trait levels. Fourth, we sought to explore whetherDIF items can reveal meaningful patterns of cultural differences inthe behavioral indicators of personality traits.
We used multigroup confirmatory factor analysis (CFA) toachieve these goals. CFA was favored over item response theory(IRT) methods (Camilli & Shepard, 1994; Embretson & Reise,2000) for several reasons. First, use of CFA enabled us to test foritem-level and facet-level invariance using the same analytic strat-egy. Second, whereas our sample sizes were sufficient for CFA(Kahn, 2006), only one of our three cultural samples met the largersample size requirement (e.g., 500 or more) typically recom-mended for IRT methods (Stark, Chernyshenko, & Drasgow,2006). Third, IRT methods are more complex than CFA and thusless accessible to most readers, as well as researchers who maywant to conduct their own measurement invariance analyses. For
1070 CHURCH ET AL.

detailed comparisons of CFA and IRT-based DIF analyses, seeStark et al. (2006); Raju, Laffitte, and Byrne (2002); Reise, Wida-man, and Pugh (1993); Meade and Lautenschlager (2004); andFinch and French (2007).
We investigated DIF for each pairwise comparison among thethree cultures, that is, the United States versus the Philippines, theUnited States versus Mexico, and the Philippines versus Mexico.This provided an opportunity to replicate DIF across comparisonsto determine whether some items are more prone to DIF thanothers, or whether DIF tends to be specific to particular culturalcomparisons. In each pairwise cultural comparison, we expected tofind a moderate proportion of DIF items (e.g., 30%–40%) in theNEO-PI-R and that at least some DIF would carry forward to thefacet or score level. We also expected some cultural mean differ-ences in NEO-PI-R facet scores to be impacted by elimination ofDIF items. If so, it would suggest that some cultural mean com-parisons can be distorted by the presence of DIF.
Method
Sample.The United States. The United States sample included 261
students (69 men, 180 women, 12 not reporting gender) at Wash-ington State University, a midsize public university. Mean age was21.48 (SD � 3.60). Self-reported ethnic backgrounds were asfollows: White/Caucasian (81.6%), Chicano/Latino/Hispanic(2.7%), Asian/Pacific Islander (2.3%), African American (1.5%),Native American (.4%), bi- or multiracial (5.0%), and “other” ornot reporting (6.5%). Students received extra credit in their coursesfor participation. This sample was obtained by combining theparticipants from two previous studies that related NEO-PI-Rdomain scores to daily behaviors but did not examine DIF (Churchet al., 2007, 2008).
The Philippines. The Philippine sample included 268 stu-dents (103 men, 149 women, 16 not reporting gender) at twoprivate universities in Manila (University of Santo Tomas, n �168; De La Salle University, n � 80), and a smaller college in amedium-size city 60 km south of Manila (De La Salle Lipa, n �20). Mean age was 18.40 (SD � 1.45). About 94% self-reportedtheir ethnicity as Filipino, whereas the remaining participantsreported Chinese (4%) or biracial (e.g., Filipino-Chinese) ethnicity(2%). The sample was obtained by combining the participantsfrom two previous studies that related NEO-PI-R domain scores todaily behaviors but did not examine DIF (Church et al., 2007,2008).
Mexico. The Mexican sample included 775 students (302men, 473 women) from the National Autonomous University ofMexico at Iztacala (n � 202), the Hidalgan Institute of HigherLearning Studies (n � 189), and the Autonomous University ofYucatan (n � 384). Mean age was 19.79 (SD � 2.41). Allparticipants reported their ethnic background to be Mestizo, thepredominant ethnicity in Mexico and a mixture of European (usu-ally Spanish) and American Indian ancestry. The sample waspreviously used in a study in which the relationship between theFFM and indigenous Mexican personality inventories were inves-tigated, but it did not examine DIF (Ortiz et al., 2007).
The NEO-PI-R. The 240-item NEO-PI-R (Costa & McCrae,1992) measures the Big Five traits of Neuroticism, Extraversion,Openness to Experience, Agreeableness, and Conscientiousness.
Each domain encompasses six eight-item facet scales that measurespecific traits in each Big Five domain (see Table 1). Items wererated on a 5-point scale (1 � strongly disagree, 2 � disagree, 3 �neutral, 4 � agree, 5 � strongly agree). The NEO-PI-R has beentranslated in over 70 cultures (McCrae & Allik, 2002). In thePhilippine sample, the Filipino (Tagalog) version was used, whichwas previously derived using back-translation methods (Del Pilar,1998; McCrae, Costa, del Pilar, Rolland, & Parker, 1998). Previ-ous studies have demonstrated the generalizability of the facet-level structure of the NEO-PI-R to Philippine samples and theconvergent validity of the Filipino NEO-PI-R with indigenous traitand behavior measures (Church et al., 2007, 2008; Katigbak et al.,2002; McCrae et al., 1998). In discussing the Filipino translation,McCrae et al. (1998) noted that four items were replaced entirelywith content deemed to be more culturally relevant. In addition,our inspection of the Filipino translation revealed six more itemsthat were viewed as significant modifications or substitutions, plus12 items (including one of the modified items) that reversed thekeying of the original English language item (the reverse-keyeditems were, or course, recoded appropriately before conducting theDIF analyses). Rather than discard these items, they were retained
Table 1Internal Consistency Reliabilities (�s) for NEO-PI-R Facets inThree Cultures
NEO-PI-R facet United States Philippines Mexico
NeuroticismN1: Anxiety .72 .64 .57N2: Hostility .69 .76 .70N3: Depression .80 .77 .69N4: Self-consciousness .66 .58 .62N5: Impulsivity .63 .44 .55N6: Vulnerability .70 .67 .68
ExtraversionE1: Warmth .73 .68 .66E2: Gregariousness .77 .73 .67E3: Assertiveness .76 .72 .68E4: Activity .61 .57 .55E5: Excitement-Seeking .63 .49 .50E6: Positive emotions .77 .64 .70
Openness to ExperienceO1: Fantasy .76 .62 .62O2: Aesthetics .79 .58 .69O3: Feelings .71 .64 .52O4: Actions .55 .51 .24O5: Ideas .79 .66 .75O6: Values .69 .46 .31
AgreeablenessA1: Trust .82 .68 .70A2: Straightforwardness .67 .61 .61A3: Altruism .74 .57 .63A4: Compliance .68 .63 .55A5: Modesty .70 .66 .65A6: Tender-Mindedness .58 .57 .32
ConscientiousnessC1: Competence .65 .66 .62C2: Order .68 .71 .46C3: Dutifulness .64 .52 .61C4: Achievement-Striving .73 .71 .62C5: Self-Discipline .81 .75 .74C6: Deliberation .70 .70 .69
Note. NEO-PI-R � Revised NEO Personality Inventory.
1071DIFFERENTIAL ITEM FUNCTIONING IN THE NEO-PI-R
because the present DIF analyses would enable us to test whetherthese substituted or reversed items provided equivalent measure-ment, as compared with the original items.
In Mexico, a Spanish version of the NEO-PI-R (Gellman, 1994)was used. Gellman (1994) reported acceptable equivalence of theEnglish and Spanish versions in a bilingual test–retest study withcollege students in the United States, and the Spanish version hasalso been used previously in Mexico (McCrae, Terracciano, & 78Members, 2005a). Ortiz et al. (2007) had it further reviewed by aclinical psychology professor in Mexico and a Spanish languageprofessor at Washington State University, both of whom were bornin Mexico and fluent in Mexican Spanish. On the basis of theirrecommendations, some minor corrections in grammar and syntaxwere made. Our inspection of the Spanish translation revealed onlyone item that qualifies as a culture-specific substitution. The E5:Excitement-seeking item about not wishing to vacation in LasVegas refers instead to Cancun. No Spanish translations resulted ina reversal of the keying of the original items. Ortiz et al. (2007)demonstrated the generalizability of the facet-level structure of theNEO-PI-R and the convergent validity of the NEO-PI-R domainscores with indigenous Mexican inventories.
Table 1 shows the internal consistency (�) reliabilities of the 30facet scales in each sample. The � values provide one indication ofmeasurement invariance at the facet level. The mean �s across all30 facets were .71 in the United States (Mdn � .70), .61 in thePhilippines (Mdn � .64), and .60 in Mexico (Mdn � .62). A fewfacets had � values lower than .50 in the Filipino and Mexicansamples, which are clearly marginal (Nunnally & Bernstein, 1994).
Procedure. In the United States, some students were paid forresearch participation and completed the NEO-PI-R in monitoredgroups, whereas others received extra credit in class and completedthe instrument on their own time. In the Philippines, some studentswere paid and completed the NEO-PI-R in monitored groups,whereas others volunteered to complete the instrument in regularclasses. In Mexico, volunteer students completed the NEO-PI-Rduring regular classes.
Data analysis. The samples described above excluded a smallnumber of respondents in each culture who had left 12 or moreNEO-PI-R items blank. Following the procedure described in theNEO-PI-R manual (Costa & McCrae, 1992), any remaining blankresponses were replaced with a neutral response.
Multigroup CFA was used, as implemented by the AMOS 16.0program, to test the measurement invariance of the NEO-PI-Ritems, then the facets, in pairwise comparisons of the three culturalsamples. The extent of DIF was examined in each of the 30NEO-PI-R facet scales, as well as the extent to which DIF canceledout or carried forward to the facet level. Maximum likelihoodestimation was used to derive all model parameters.
In a CFA framework, the raw score for an item can be expressedas shown in Equation 1, where the latent variable is the facet-leveltrait (e.g., N1: Anxiety). Scalar invariance holds when the regres-sion parameters (i.e., intercept and loading) can be consideredequal across groups, so that people in two different cultures whohave the same position on the latent variable have the same rawscore.
Equation 1: Raw item score � Intercept
� Loading �Latent Variable�.
To conduct DIF analyses, it is first necessary to select one of theeight items in each facet to serve as a referent or anchor item toidentify the CFA model and define the metric of the latent variableor facet. To do so, a principal components analysis was conductedon the eight items in each facet in each culture. For each culturalcomparison (e.g., United States vs. Philippines), what was selectedas the anchor was the item within each facet that had the mostsimilar factor loadings in the two cultural samples (Finch &French, 2008). Across the three cultural comparisons, the meancultural difference in the factor loadings for the anchor items was.03, and the factor loadings for the anchor items ranged from .30to .83. These principal components analyses also served to dem-onstrate the essential unidimensionality of the items in each facetscale. Thus, although responses to personality items may be morecomplex or multifaceted than mental ability items, it is appropriateto conduct DIF analyses on them (Reise et al., 2001).
CFA can identify DIF in the item factor loadings or intercepts.Assuming translation equivalence, loading DIF can indicate thatthe thought, feeling, or behavior referred to in the item is lessrelevant as an indicator of the trait in one of the two cultures beingcompared (and conversely, more relevant in the other culture). Ifan item exhibits intercept DIF, it can indicate that the thought,feeling, or behavior is less prevalent or endorsed less in one of thetwo cultures by individuals with comparable levels of the trait. Itis only meaningful to test for intercept DIF if the factor loading(i.e., regression slope) for a given item is invariant across cul-tures.1 Accordingly, the following steps were used to examine themeasurement invariance of the items in each facet for each culturalcomparison (Steenkamp & Baumgarten, 1998). The latent variablein each DIF analysis was one of the 30 facets in the NEO-PI-R(e.g., N1: Anxiety), and the eight items in the facet scale were theobserved indicators.
Testing for factor loading DIF:
Step 1. Test a CFA model in which the factor loadings forall items in the facet are freely estimated in bothcultures (except for the anchor item, which is fixedto 1.0 in each culture).
Step 2. Test a CFA model in which all of the item factorloadings are constrained to be equal in the twocultures.
1 Recently, Stark et al. (2006) offered several reasons for testing DIF infactor loadings and intercepts simultaneously: to make the analysis lesscumbersome, to reduce the total number of statistical tests and Type I error,and to avoid errors in DIF detection for the loadings propagating tosubsequent tests of intercept DIF. Also, because item slopes (loadings) andintercepts can be correlated to some extent, metric (loading) and scalar(intercept) invariance are not necessarily strictly independent. Finally, inpractice, researchers are likely to discard items that exhibit either kind ofDIF, so it is arguably unimportant whether an item exhibits DIF in theloading or intercept. However, if one is interested, as we were, in differ-entiating the amount of loading and intercept DIF—because the two typesof DIF have different conceptual meanings and implications for cross-cultural measurement—it is necessary to test for the two types of DIFseparately. Indeed, this is the common practice in DIF analyses based onCFA (Steenkamp & Baumgarten, 1998; Vandenberg & Lance, 2000).
1072 CHURCH ET AL.

Step 3. Compare the overall fit of the constrained (Step 2)and freely estimated (Step 1) models using a chi-square difference test. If the chi-square differencetest is not statistically significant (p � .01), thenthere is no DIF in the item factor loadings for thatfacet, and one should proceed to test for DIF in theitem intercepts (i.e., Step 6). If the chi-square dif-ference test is statistically significant, then proceedto Step 4 to test for factor loading DIF in theindividual items.
Step 4. Successively test for factor loading DIF in eachindividual (focal) item by constraining the factorloadings for that item to be equal in the two cul-tures, while freely estimating the factor loadings ofall the remaining items (except the anchor item) inboth cultures.
Step 5. Compare the fit of each of the models in Step 4, inwhich the factor loading for a focal item is con-strained to be equal in the two cultures, with themodel in Step 1 in which all factor loadings werefreely estimated in the two cultures. If the chi-square difference test is statistically significant, thenthe factor loading for the focal item exhibits DIF.
Testing for intercept DIF:
Step 6. Test a CFA model in which all item intercepts,including for the anchor item, are freely estimatedin the two cultures. In this model, and in all subse-quent models testing for intercept DIF, retain thefactor loading equality constraints for those itemsthat did not exhibit factor loading DIF in Step 5.
Step 7. Test a CFA model in which all item intercepts areconstrained to be equal in the two cultures.
Step 8. Compare the fit of the constrained (Step 7) andfreely estimated (Step 6) intercept models using achi-square difference test. If the chi-square differ-ence test is not statistically significant (p � .01),then there is no DIF in the item intercepts for thatfacet. If the chi-square difference test is statisticallysignificant, then proceed to Step 9 to test for inter-cept DIF in the individual items.
Step 9. Successively test for intercept DIF in each (focal)item that did not exhibit factor loading DIF. Do soby constraining the intercept for that item to beequal in the two cultures, while freely estimating theintercept of all the remaining items in both cultures.
Step 10. Compare the fit of each of the models in Step 9, inwhich the intercept for a focal item is constrainedto be equal in the two cultures, with the model inStep 7, in which all intercepts were freely esti-mated in the two cultures. If the chi-square differ-ence test is statistically significant, then the inter-cept for the focal item exhibits intercept DIF.
After these DIF analyses were completed, analogous CFA anal-yses were conducted at the facet level to test for measurementinvariance in the factor loadings and intercepts of each facet as anindicator of the relevant Big Five dimension. For example, for theNeuroticism domain, Neuroticism was the single latent variable inthe CFA model, and scores for the six facet scales were theobserved indicators. These “higher level” facet analyses enabled usto determine the extent to which DIF within each facet scalecanceled out or carried forward to the facet level at which NEO-PI-R scores are typically computed and compared.
In the above steps, the chi-square difference test provides adirect statistical test of whether the factor loadings or interceptscan be considered equivalent in two cultures. However, whensample sizes are large, even modest differences in loadings orintercepts can result in significant changes in chi-square valuesbetween constrained and freely estimated models. In addressingthis issue of statistical versus practical significance, G. W. Cheungand Rensvold (2002) recommended that researchers consultBentler’s (1990) comparative fit index (CFI) to identify itemslacking measurement invariance. The CFI is a relative fit indexthat quantifies the fit of each model in terms of its proportionalimprovement over a null model of no covariation between theobserved variables (i.e., no common factors) (Bentler, 1990).2
Specifically, G. W. Cheung and Rensvold recommended thatchanges in the CFI (�CFI) between constrained and freely esti-mated models that exceed .01 be used to designate items that lackmeasurement invariance. In a simulation study, these authorsfound that the �CFI value has a number of desirable features. It isindependent of both model complexity and sample size and un-correlated with overall model fit indices.
Accordingly, two criteria were used to designate items or facetsas noninvariant. The chi-square difference test criterion (��2)—which was applied in the sequence of steps outlined above—provides a direct test of statistical significance and is the mostcommonly applied criterion in the literature. Because of the num-ber of statistical tests, a more conservative alpha level of .01 wasused for the chi-square difference test criterion. The �CFI � .01criterion has only recently been applied in DIF analyses (e.g.,French & Finch, 2006). However, unlike the chi-square differencetest, it is independent of sample size and thus will be moreequivalent across our three pairwise cultural comparisons. Wemake use of both criteria in reporting the amount of DIF, but relyon the more conservative �CFI � .01 criterion for some analyses,because this criterion points to DIF of greater practical signifi-cance. In the present study, the mean loading differences forloading DIF items identified using the �CFI criteria were substan-tial (M � 0.41, SD � 0.18), and the mean intercept differences forintercept DIF items corresponded to about half a scale point (M �0.52, SD � 0.27). It should be noted that any item that qualifies asa DIF item based on the �CFI � .01 criterion will also satisfy thechi-square difference test criterion.
2 Bentler’s (1990) CFI index is computed as 1 (max [m,0]/max [n,m, 0]), where m � �model
2 – dfmodel, n � �null2 – dfnull. The index is
normed to values between 0 and 1. Its rationale derives from the fact thatthe maximum likelihood fit function is distributed asymptotically as anoncentral chi-square distribution with noncentrality parameter when thehypothesized model is false.
1073DIFFERENTIAL ITEM FUNCTIONING IN THE NEO-PI-R

Results
Overview. We address the following questions in the results:How much DIF is exhibited in the pairwise cultural comparisons?Are there consistencies across cultural comparisons in the itemsand facets that exhibit the most DIF? When DIF is detected, isthere any pattern in which cultural samples exhibit the highestloadings or intercepts? Does DIF in the factor loadings or inter-cepts cancel out or carry forward to the facet level at which scoresare compared across cultures? Are mean differences between cul-tures on the facet scales impacted by elimination of DIF items?Finally, can any patterns in the content of the DIF items bedetected?
The DIF. Tables 2,3, and 4 summarize the results for com-parisons of the United States and Philippines, United States andMexico, and Philippines and Mexico, respectively. The first twocolumns in each table show the number of items in each facet scale
exhibiting loading DIF based on the chi-square difference test(��2) and �CFI � .01 criteria, respectively. In the third column ofTables 2–4, we show the mean �CFI values for those items in eachfacet for which loading DIF was detected on the basis of thechi-square difference tests. The �CFI values provide a measure ofthe size of the model misfit that results from constraining itemloadings or intercepts to equality across cultures. In the fourthcolumn of these tables, we show, for those items with loading DIFbased on the chi-square difference tests, ratios showing the numberof DIF items that had higher loadings in each of the two cultureswhen the loadings were freely estimated. These ratios indicatewhether there were any consistent tendencies for one or the otherculture to exhibit higher freely estimated loadings when the load-ings could not be constrained to equality. The next several columnsin each table contain analogous information related to interceptDIF.
Table 2Summary of Noninvariant NEO-PI-R Items and Facets in U.S.-Philippines Comparison
NEO-PI-R facet
Factor loadings Intercepts Facet noninvariance
# of DIFitems
Mean �CFIUS:Phil.
ratio
# of DIFitems
Mean �CFIUS:Phil.
ratio
Loadings Intercepts
��2 �CFI ��2 �CFI ��2 �CFI ��2 �CFI
NeuroticismN1: Anxiety 0 0 — — 2 2 .05 1:1 7.13 U.S. .00 — —N2: Angry Hostility 1 0 .00 0:1 4 4 .04 1:3 17.24 Phil. .01 — —N3: Depression 0 0 — — 2 2 .04 0:2 Anchor — 7.72 Phil. .01N4: Self-Consciousness 0 0 — — 5 4 .11 1:4 — — 33.68 Phil. .03N5: Impulsivity 0 0 — — 4 4 .14 3:1 — — 23.70 U.S. .02N6: Vulnerability 0 0 — — 2 2 .05 0:2 — — 9.85 Phil. .01
ExtraversionE1: Warmth 0 0 — — 6 5 .09 6:0 — — 68.55 U.S. .09E2: Gregariousness 0 0 — — 4 1 .02 2:2 Anchor — — —E3: Assertiveness 2 2 .02 2:0 4 2 .05 2:2 — — 6.85 U.S. .01E4: Activity 0 0 — — 3 3 .15 3:0 — — 31.95 U.S. .04E5: Excitement-Seeking 0 0 — — 4 4 .07 4:0 — — 27.01 U.S. .04E6: Positive Emotions 2 0 .01 2:0 2 2 .06 2:0 — — 42.11 U.S. .05
Openness to ExperienceO1: Fantasy 1 0 .01 1:0 5 4 .04 4:1 — — 13.70 U.S. .03O2: Aesthetics 0 0 — — 6 6 .04 1:5 Anchor — 11.79 Phil. .02O3: Feelings 0 0 — — 4 4 .05 3:1 — — — —O4: Actions 0 0 — — 4 4 .32 1:3 — — 74.48 Phil. .18O5: Ideas 0 0 — — 3 1 .02 0:3 — — 9.38 Phil. .02O6: Values 0 0 — — 7 7 .30 7:0 — — 211.64 U.S. .51
AgreeablenessA1: Trust 2 1 .02 2:0 3 1 .02 2:1 — — 34.48 U.S. .05A2: Straightforwardness 1 1 .05 0:1 5 5 .09 4:1 — — 30.73 U.S. .04A3: Altruism 1 1 .02 0:1 3 3 .16 3:0 — — 62.00 U.S. .08A4: Compliance 2 2 .03 1:1 5 5 .05 2:3 — — — —A5: Modesty 0 0 — — 3 3 .04 3:0 Anchor — 9.64 U.S. .01A6: Tender-Mindedness 1 1 .03 1:0 6 5 .21 2:4 — — 17.78 Phil. .02
ConscientiousnessC1: Competence 0 0 — — 5 5 .06 4:1 — — 10.94 U.S. .01C2: Order 3 2 .02 1:2 5 1 .01 3:2 — — — —C3: Dutifulness 0 0 — — 2 2 .05 1:1 Anchor — — —C4: Achievement-Striving 1 0 .01 1:0 2 1 .06 0:2 — — 15.07 Phil. .02C5: Self-Discipline 0 0 — — 4 2 .02 1:3 — — — —C6: Deliberation 0 0 — — 4 3 .04 0:4 — — 23.49 Phil. .02
Note. In the Facet noninvariance columns, facets with significant loading or intercept noninvariance (��2) are annotated to indicate the culture with thehigher loading or intercept. NEO-PI-R � Revised NEO Personality Inventory; DIF � differential item functioning; CFI� comparative fit index; U.S. �United States; Phil. � Philippines. Dashes indicate the absence of DIF or facet noninvariance involving the loadings or intercepts for a given facet.
1074 CHURCH ET AL.

As an example in Table 2, only one item in the N2: AngryHostility facet was identified as having loading DIF on the basis ofthe chi-square difference tests, and there were no loading DIFitems based on the more conservative �CFI criterion. Althoughstatistically significant in the chi-square difference test, the changein model fit resulting from constraining the factor loading for theDIF item was very small (mean �CFI � .00). The 0:1 ratio in thefourth column indicates that the freely estimated factor loading forthe single loading DIF item was larger in the Philippine sample.Four of the items in the N2: Angry Hostility facet were identifiedas intercept DIF items on the basis of both the ��2 and �CFIcriteria. Model misfit resulting from constraining the interceptswas moderately large (mean �CFI � .04). Finally, one interceptwas larger in the United States sample, and three intercepts werelarger in the Philippine sample.
Amount of loading and intercept DIF. One noteworthy find-ing in Tables 2, 3, and 4 was that loading DIF was relatively
infrequent in all three pairwise cultural comparisons, whereasintercept DIF was quite frequent. This ratio of occurrence isconsistent with what is seen in large standardized tests and hasbeen used in DIF simulation work (e.g., French & Maller, 2007).Across the three cultural comparisons, the percentage of items thatexhibited loading DIF ranged from 7.1% to 18.8% as indexed bythe ��2 criterion and from 4.2% to 9.6% as indexed by the �CFIcriterion. In contrast, the percentages of items that exhibited in-tercept DIF ranged from 47.5% to 56.7% as indexed by the ��2
criterion and from 39.1% to 40.4% as indexed by the �CFIcriterion (and recall that intercept DIF is not tested for those itemsthat exhibit loading DIF). In addition, as seen in the tables, themisfit in models (i.e., mean �CFI values) that resulted fromconstraining factor loadings was generally modest, whereas con-straints on the item intercepts resulted in more substantial modelmisfit. In total, the percentages of items exhibiting some form ofDIF in the three pairwise cultural comparisons ranged from 56.3%
Table 3Summary of Noninvariant NEO-PI-R Items and Facets in U.S.-Mexico Comparison
NEO-PI-R facet
Factor loadings Intercepts Facet noninvariance
# of DIFitems
Mean �CFIUS:Mex.
ratio
# of DIFitems
Mean �CFIUS:Mex.
ratio
Loadings Intercepts
��2 �CFI ��2 �CFI ��2 �CFI ��2 �CFI
NeuroticismN1: Anxiety 4 3 .02 4:0 4 3 .03 3:1 — — 26.13 U.S. .01N2: Angry Hostility 3 1 .01 1:2 2 2 .02 0:2 13.06 Mex. .01 — —N3: Depression 4 1 .01 4:0 3 3 .04 3:0 — — 16.28 U.S. .01N4: Self-Consciousness 0 0 — — 5 5 .04 3:2 Anchor — 23.23 U.S. .01N5: Impulsivity 1 1 .03 1:0 6 3 .03 5:1 — — 36.00 U.S. .02N6: Vulnerability 0 0 — — 5 3 .02 2:3 — — — —
ExtraversionE1: Warmth 0 0 — — 6 5 .06 6:0 — — 100.26 U.S. .06E2: Gregariousness 0 0 — — 5 4 .02 2:3 — — — —E3: Assertiveness 1 0 .01 1:0 4 4 .05 2:2 — — — —E4: Activity 0 0 — — 6 5 .04 5:1 — — 22.01 U.S. .01E5: Excitement-Seeking 1 0 .01 1:0 6 3 .06 5:1 Anchor — — —E6: Positive Emotions 2 0 .00 1:1 2 0 .01 2:0 — — — —
Openness to ExperienceO1: Fantasy 0 0 — — 6 4 .02 4:2 — — — —O2: Aesthetics 0 0 — — 7 4 .02 2:5 — — 14.21 Mex. .02O3: Feelings 0 0 — — 5 5 .08 5:0 Anchor — 69.68 U.S. .08O4: Actions 5 5 .07 4:1 1 1 .12 0:1 — — 300.53 Mex. .33O5: Ideas 1 0 .00 0:1 6 1 .01 1:5 — — 16.33 Mex. .02O6: Values 3 3 .07 3:0 3 3 .09 1:2 — — — —
AgreeablenessA1: Trust 1 0 .01 1:0 7 4 .02 7:0 Anchor — 141.63 U.S. .03A2: Straightforwardness 0 0 — — 4 3 .05 4:0 — — 67.64 U.S. .06A3: Altruism 0 0 — — 7 4 .03 7:0 — — 58.89 U.S. .05A4: Compliance 1 0 .01 1:0 3 2 .04 2:1 — — 27.94 U.S. .02A5: Modesty 2 1 .02 1:1 6 6 .05 6:0 — — 92.53 U.S. .08A6: Tender-Mindedness 1 1 .07 1:0 7 7 .11 2:5 — — 16.78 U.S. .01
ConscientiousnessC1: Competence 0 0 — — 3 0 .01 3:0 — — — —C2: Order 2 2 .02 2:0 2 1 .03 2:0 13.61 U.S. .00 — —C3: Dutifulness 2 0 .01 2:0 1 1 .05 0:1 — — 17.29 Mex. .00C4: Achievement-Striving 1 0 .01 1:0 6 3 .02 2:4 — — 8.03 Mex. .00C5: Self-Discipline 1 0 .00 1:0 4 2 .02 2:2 Anchor — — —C6: Deliberation 0 0 — — 4 3 .02 1:3 — — 9.78 Mex. .00
Note. In the Facet noninvariance columns, facets with significant loading or intercept noninvariance (��2) are annotated to indicate the culture with thehigher loading or intercept. NEO-PI-R � Revised NEO Personality Inventory; DIF � differential item functioning; CFI� comparative fit index; U.S. �United States; Mex. � Mexico. Dashes indicate the absence of DIF or facet noninvariance involving the loadings or intercepts for a given facet.
1075DIFFERENTIAL ITEM FUNCTIONING IN THE NEO-PI-R
to 71.2% as indexed by the ��2 criterion and from 44.6% to 48.8%as indexed by the �CFI criterion. The latter range is similar to theapproximately 40% of DIF items detected in the original NEO-PIby Huang et al. (1997) using IRT methods.
In summary, the relatively small amount of DIF in the itemloadings indicates that item-level metric equivalence was generallygood for most facets. Thus, the behaviors referred to in most of theitems are equally relevant indicators of the traits measured by thefacet scales. In contrast, scalar equivalence (i.e., invariant itemintercepts) was lacking for a substantial percentage of the items.This suggests that the behaviors referred to in the items are lessprevalent, or are endorsed to a lesser extent, in some cultures thanothers for a given level of the associated trait.
Consistency of DIF across pairwise cultural comparisons.In the Appendix, we list—for each of the three pairwise culturalcomparisons—the NEO-PI-R item numbers for those items exhib-
iting loading or intercept DIF based on the more conservative�CFI criterion. We also show which culture had the higher loadingor intercept in each cultural comparison. There was a fair amountof overlap in the items exhibiting DIF across the three culturalcomparisons. Of the total of 38 items that exhibited loading DIF onthe basis of the �CFI criterion in one or more cultural compari-sons, 13 (34.2%) exhibited loading DIF in more than one culturalcomparison. Of the total of 170 items that exhibited intercept DIFon the basis of the �CFI criterion in one or more cultural com-parisons, 99 (58.2%) exhibited intercept DIF in more than onecultural comparison. This indicates that some items are prone toDIF across multiple cultural comparisons, whereas other itemsexhibited DIF in only particular cultural comparisons.
We did not observe any definitive trend for DIF to be more orless frequent in any of the three pairwise cultural comparisons.However, we did observe that when loading DIF was detected,
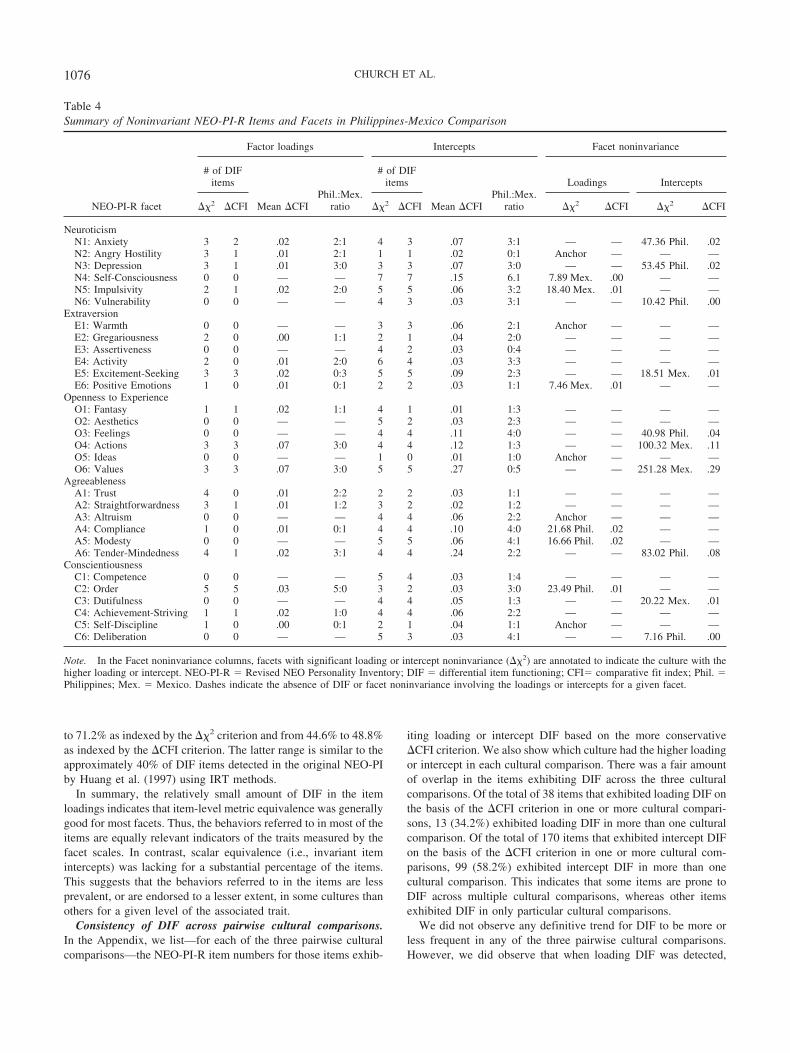
Table 4Summary of Noninvariant NEO-PI-R Items and Facets in Philippines-Mexico Comparison
NEO-PI-R facet
Factor loadings Intercepts Facet noninvariance
# of DIFitems
Mean �CFIPhil.:Mex.
ratio
# of DIFitems
Mean �CFIPhil.:Mex.
ratio
Loadings Intercepts
��2 �CFI ��2 �CFI ��2 �CFI ��2 �CFI
NeuroticismN1: Anxiety 3 2 .02 2:1 4 3 .07 3:1 — — 47.36 Phil. .02N2: Angry Hostility 3 1 .01 2:1 1 1 .02 0:1 Anchor — — —N3: Depression 3 1 .01 3:0 3 3 .07 3:0 — — 53.45 Phil. .02N4: Self-Consciousness 0 0 — — 7 7 .15 6.1 7.89 Mex. .00 — —N5: Impulsivity 2 1 .02 2:0 5 5 .06 3:2 18.40 Mex. .01 — —N6: Vulnerability 0 0 — — 4 3 .03 3:1 — — 10.42 Phil. .00
ExtraversionE1: Warmth 0 0 — — 3 3 .06 2:1 Anchor — — —E2: Gregariousness 2 0 .00 1:1 2 1 .04 2:0 — — — —E3: Assertiveness 0 0 — — 4 2 .03 0:4 — — — —E4: Activity 2 0 .01 2:0 6 4 .03 3:3 — — — —E5: Excitement-Seeking 3 3 .02 0:3 5 5 .09 2:3 — — 18.51 Mex. .01E6: Positive Emotions 1 0 .01 0:1 2 2 .03 1:1 7.46 Mex. .01 — —
Openness to ExperienceO1: Fantasy 1 1 .02 1:1 4 1 .01 1:3 — — — —O2: Aesthetics 0 0 — — 5 2 .03 2:3 — — — —O3: Feelings 0 0 — — 4 4 .11 4:0 — — 40.98 Phil. .04O4: Actions 3 3 .07 3:0 4 4 .12 1:3 — — 100.32 Mex. .11O5: Ideas 0 0 — — 1 0 .01 1:0 Anchor — — —O6: Values 3 3 .07 3:0 5 5 .27 0:5 — — 251.28 Mex. .29
AgreeablenessA1: Trust 4 0 .01 2:2 2 2 .03 1:1 — — — —A2: Straightforwardness 3 1 .01 1:2 3 2 .02 1:2 — — — —A3: Altruism 0 0 — — 4 4 .06 2:2 Anchor — — —A4: Compliance 1 0 .01 0:1 4 4 .10 4:0 21.68 Phil. .02 — —A5: Modesty 0 0 — — 5 5 .06 4:1 16.66 Phil. .02 — —A6: Tender-Mindedness 4 1 .02 3:1 4 4 .24 2:2 — — 83.02 Phil. .08
ConscientiousnessC1: Competence 0 0 — — 5 4 .03 1:4 — — — —C2: Order 5 5 .03 5:0 3 2 .03 3:0 23.49 Phil. .01 — —C3: Dutifulness 0 0 — — 4 4 .05 1:3 — — 20.22 Mex. .01C4: Achievement-Striving 1 1 .02 1:0 4 4 .06 2:2 — — — —C5: Self-Discipline 1 0 .00 0:1 2 1 .04 1:1 Anchor — — —C6: Deliberation 0 0 — — 5 3 .03 4:1 — — 7.16 Phil. .00
Note. In the Facet noninvariance columns, facets with significant loading or intercept noninvariance (��2) are annotated to indicate the culture with thehigher loading or intercept. NEO-PI-R � Revised NEO Personality Inventory; DIF � differential item functioning; CFI� comparative fit index; Phil. �Philippines; Mex. � Mexico. Dashes indicate the absence of DIF or facet noninvariance involving the loadings or intercepts for a given facet.
1076 CHURCH ET AL.

Mexicans tended to have lower loadings in comparisons withAmericans (see Table 3) and Filipinos (see Table 4), and Filipinostended to have lower loadings than Americans (see Table 2).However, this was not always the case. Also, with the exceptionsof two Openness to Experience facets (O4: Actions; O6: Values)and the A6: Tender-mindedness facet, we did not observe anyconsistent tendency for some facets to contain more DIF items orlarger mean �CFI values than others across the three pairwisecomparisons. These three facets were among those with the lowestalpha reliabilities in Mexico and the Philippines. Overall, DIFtended to be rather uniformly distributed across all domains andfacets.
Interpretation of DIF. As previous researchers have noted, itis difficult to explain DIF items, for example, in terms of culturalnorms, contexts, or practices (Ellis, 1990; Huang et al., 1997; Nyeet al., 2008). Indeed, some interpretations may be speculative. Wefirst examined whether the culture-specific item substitutionsmade in the Filipino and Spanish translations resulted in DIF. Wefocused on DIF based on the more conservative �CFI � .01criterion. Of the 10 item substitutions in the Filipino version, sevenexhibited loading or intercept DIF in one or both comparisonsinvolving the Filipino sample. The one culture-specific adaptationin the Spanish version (Las Vegas vs. Cancun) did not exhibit DIFin the United States-Mexican comparison, but did exhibit DIF withthe Filipino item, which was also an item substitution referring toa willingness to try anything.
We next examined whether items whose keying had been re-versed in the translations tended to exhibit DIF. Of 12 such itemsin the Filipino translation, all but one exhibited loading or interceptDIF in one or both cultural comparisons involving the Filipinosample. There were no such reversed items in the Spanish trans-lation. In summary, most of the culture-specific item substitutionsor reversals resulted in DIF in one or more cultural comparisons.
To determine whether some DIF might be due to translationinequivalencies, we had a Filipino–English bilingual and aSpanish–English bilingual carefully examine the Filipino andMexican translations, respectively, and indicate any DIF items thatmight involve slight differences in meaning, as compared with theoriginal English. On the basis of the bilinguals’ judgments, a smallnumber of additional cases of DIF may have been caused bytranslation inequivalencies, more so in comparisons involving theFilipino sample, in which direct or literal translation was appar-ently more difficult than in the Spanish translation. For example, inthe E1: Warmth facet, Item 152 states: “I find it easy to smile andbe outgoing with strangers.” The Filipino translation, “Madali sa‘king makisama sa mga di-kakilala” (“It is easy for me to get alongwith strangers”) is probably reasonable. However, the commonlyused expression makisama (roughly meaning to get along) prob-ably implies greater depth of interaction or relationship than isconnoted by the English item, which could imply more superficialfriendliness. This item exhibited intercept DIF, with Americansaveraging higher than Filipinos.
Loading DIF. Aside from DIF that was attributed to itemsubstitutions or translation inequivalencies, one additional patternwas observed for the loading DIF items. Items that involvednegations (i.e., terms such as not, don’t, and rarely) were morethan twice as likely to exhibit loading DIF in one or more pairwisecultural comparisons, as compared with items that did not involvesuch negation terms. Almost one third of the inventory items that
involved negations exhibited loading DIF, whereas only about13% of the items without negations exhibited loading DIF. Thus,although the majority of items with negations did not exhibitloading DIF, the likelihood of loading DIF was greater with suchitems.
In some cases, the reasons for loading DIF may be moresubstantive or content-based. For example, a loading DIF item inthe E5: Excitement-seeking facet makes reference to loving theexcitement of roller coasters. The poor loading for this item in theFilipino sample indicates that this item is a poor indicator ofexcitement-seeking in the Philippine context, in which there arefew roller coasters of any size. As another example, a loading DIFitem in the A4: Compliance facet refers to one’s hesitation toexpress anger even when justified. This item had a poor loading inthe Philippines, as compared with the United States, perhapsbecause overt expression of anger is more strongly discouraged inthe Philippines (Church, 1987; Lynch, 1973). Overall, however,aside from the items with negations, we were unable to identifyconsistent patterns or explanations for most of the small number ofitems that exhibited loading DIF.
Intercept DIF. We were able to discern plausible explana-tions for some intercept DIF. For example, the higher intercept inthe Philippines, as compared with the United States, for an item inthe N3: Depression facet about guilt or sinfulness might be ex-plained by the greater religiosity (particularly Catholicism) ofFilipinos. Filipinos also had higher intercepts than Americans onitems that refer to pessimism about the future or to things lookinghopeless. These differences might be due to the limited economicopportunities of many Filipinos, including college graduates. Asanother example, Mexicans had lower intercepts than Americansfor two items in the E4: Activity facet that referred to being in ahurry or having a fast-paced life. These differences might beexplained by the slower pace of life in Mexico (Levine & Noren-zayan, 1999). These few examples illustrate that some interceptDIF is plausibly due to cultural differences in the prevalence ormanifestation of specific attitudes and behaviors. However, likeprevious researchers, we found it difficult to discern definitivecultural explanations for many of the DIF items. Nonetheless, thesubstantial number of DIF items will make cross-cultural compar-isons of facet scores risky, unless DIF cancels out at the facet-scalelevel.
Facet-level invariance: Does DIF cancel out or carry for-ward? As noted earlier, the question of whether DIF carriesforward to the facet level of the NEO-PI-R is of central importanceto personality psychologists, because it is at the facet level thataggregate scores are compared across cultures. Noninvariance atthe facet level would call into question cross-cultural comparisonsof the facet and Big Five domain scores.
We tested facet-level invariance by treating each Big Fivedimension as a latent variable in separate multigroup CFA modelswith six facet scores as indicators of each Big Five trait. Nonin-variant factor loadings would indicate that the given facet (e.g.,N1: Anxiety) was not an equivalent or equally relevant indicator ofthe associated Big Five trait (e.g., Neuroticism) in two cultures. Anoninvariant intercept would indicate that individuals with thesame level of the Big Five trait, but from different cultural groups,averaged systematically lower or higher on the facet (Bollen,1989). For example, if the intercept for the Self-consciousnessfacet of Neuroticism was higher in the Philippines than in the
1077DIFFERENTIAL ITEM FUNCTIONING IN THE NEO-PI-R

United States, it would suggest that self-consciousness is a moreprevalent manifestation of neuroticism in the Philippines than inthe United States.
The nature and extent of facet-level invariance is summarized inthe last four columns of Tables 2, 3, and 4. For each facet thatexhibited noninvariance based on the chi-square difference test, weshow the ��2 values (with one degree of freedom) obtained whenthe facet loading or intercept was constrained to be equal acrosscultures rather than freely estimated. For these facets, we alsoshow the size of the CFI difference (�CFI) between the con-strained and freely estimated models. Also indicated is the culturethat had the higher facet loading or intercept when freely esti-mated. Note that loading invariance cannot be tested for facets thatserved as the anchor in the facet-level CFA models.
Loading noninvariance. As seen in Tables 2, 3, and 4,loading noninvariance was very infrequent at the facet level,especially using the �CFI � .01 criterion. Across the three pair-wise cultural comparisons, the percentage of facets that exhibitedloading noninvariance ranged from 6.7% to 20.0% as indexed bythe ��2 criterion and from 0% to 6.7% as indexed by the �CFIcriterion. We might anticipate that loading noninvariance at theitem level would translate to loading noninvariance at the facetlevel, because poor item indicators of the facet traits would detractfrom the quality of the facet scales as measures of the Big Fiveconstructs. However, inspection of each facet in Tables 2, 3, and 4reveals that loading DIF rarely carried forward to the facet level.This may be due to the relatively small size and amount of loadingDIF. For example, in the United States-Philippines comparison inTable 2, three items in the C2: Order facet exhibited loading DIFon the basis of the ��2 criterion and two items on the basis of the�CFI criterion. However, the facet-level loadings for the C2:Order facet on the Big Five Conscientiousness construct wereinvariant across the two cultures.
Intercept noninvariance. In contrast to the infrequent loadingnoninvariance, intercept DIF frequently carried forward to thefacet level. The percentages of facets that exhibited interceptnoninvariance ranged from 33.3% to 73.3% as indexed by the ��2
criterion and from 20.0% to 56.7% as indexed by the �CFIcriterion. Intercept DIF was particularly likely to carry forwardwhen one of the two cultures had the higher item intercept for mostof the DIF items and indices of model misfit (i.e., mean �CFIvalues) were substantial. For example, in Table 2, there were fiveitems that exhibited intercept DIF (mean �CFI � .11) for the N4:Self-consciousness facet on the basis of the ��2 criterion, and theFilipino sample had a higher intercept than the American sampleon four of those five items. This pattern of intercept DIF was thenreflected in intercept noninvariance at the facet level (��2[1] �33.68; �CFI � .03), with the Filipino sample having a higherintercept than the Americans for the N4: Self-consciousness facetscale. Similarly, four items in the N5: Impulsivity facet exhibitedintercept DIF (mean �CFI � .14), and the American sampleaveraged higher on three of the four items. This pattern of interceptDIF was then reflected in intercept noninvariance at the facet level(��2[1] � 23.70; �CFI � .02), with Americans having a higherintercept than the Filipinos for the N5: Impulsivity facet scale.
In the comparisons of the American sample with the Filipinoand Mexican samples, intercept DIF carried forward in this mannerfor a clear majority of the facets (see Tables 2 and 3). In thePhilippine-Mexican comparison (see Table 4), intercept DIF car-
ried forward to the facet level for a smaller percentage of the facets(about one third), probably because for many of the remainingfacets, there was no consistent trend for one or the other culture tohave the higher intercept for the DIF items in the facet. In theselatter cases, intercept DIF can be viewed as having canceled out atthe facet level (e.g., in Table 4, see facets E1, E4, O2, A1, A2, A3,C4, and C5). For three additional facets in the Philippine-Mexicocomparisons (N4, N5, and E6), intercept DIF may appear to havecanceled out at the facet level because no intercept noninvarianceis shown for these facets in Table 4. However, recall that interceptinvariance would not have been tested for these facets becausethey had already been shown to exhibit loading noninvariance.
In summary, the percentages of facets exhibiting some form ofnoninvariance (i.e., in either the loadings or intercepts) rangedfrom 53.3% to 80.0% as indexed by the ��2 criterion and from26.7% to 56.7% as indexed by the �CFI criterion. These resultsindicate that a substantial amount of the DIF detected in the items,particularly in the item intercepts, was carried forward to the facetlevel.
Impact on cultural mean differences.Original facet scales. Most of the original facet scales had
statistically significant mean differences in the pairwise culturalcomparisons. This was determined by conducting multivariateanalyses of variance (MANOVAs) with culture as the independentvariable and the 30 facet scales as dependent variables. Genderwas introduced as a covariate in these analyses so that any signif-icant effects would be attributable to culture rather than differencesin the gender makeup of the three cultural samples (Johnson et al.,2008). The multivariate tests of cultural effects were statisticallysignificant in each pairwise cultural comparison (Wilks’s �range � .36–.55, p � .01). In follow-up ANOVAs of the individ-ual facet scales, we observed significant (p � .01) cultural differ-ences for 21 scales in the United States-Philippines comparison(partial �p
2 range � .01–.32), 21 scales in the United States-Mexicocomparison (�p
2 range � .01–.08), and 16 scales in the Philippines-Mexico comparison (�p
2 range � .01–.29).Purified facet scales. The usual procedure when DIF is
detected is to eliminate the DIF items before making cross-culturalcomparisons (e.g., Huang et al., 1997; Johnson et al., 2008). Todetermine the impact of eliminating DIF items, we compared thesize and significance of the cultural effects for the original facetscores and for “purified” facet scores derived by deleting DIFitems with �CFI values greater than .01 (gender was again acovariate in these analyses). Different purified facet scales werederived for each pairwise cultural comparison, because the DIFitems varied somewhat for each pairwise comparison. We retainedonly purified scales that had at least four items and alpha reliabili-ties of .50 or higher in both cultures being compared. Having doneso, we found that a majority of the facet scales were no longersufficiently reliable for cultural comparisons after eliminating DIFitems. In all three pairwise cultural comparisons of the retainedpurified scales, the overall cultural effects were statistically sig-nificant (Wilks’s � range � .89–.94, p � .01). Therefore, wecompared the F statistics and effects sizes in follow-up ANOVAswith the original and purified scales.
In the comparison of the American and Filipino samples, puri-fied scales of sufficient length and reliability were derived for 14of the 30 facets. For six of these 14 facets, no cultural differenceswere observed for either the original or purified scales. Of the
1078 CHURCH ET AL.
remaining eight facets, all showed modest to moderate reductionsin the size of the cultural effects with the purified scales ascompared with the original scales (�p
2 decreases of .01 to .06). Forseven of these eight facets, the cultural differences that werestatistically significant for the original scales were no longersignificant for the purified scales. In summary, for eight of the 14facets that could be compared, conclusions about the existence(i.e., statistical significance) or size of cultural mean differenceswould be different based on the purified scales, as compared withthe original scales.
In the comparison of the American and Mexican samples, pu-rified scales were derived for 13 facets (and one facet did not needto be purified). For six of these 13 facets, no cultural differenceswere observed for either the original or purified scales. Of theremaining seven facets, six showed modest to moderate reductionsin the size of the cultural effects with the purified scales ascompared with the original scales (�p
2 decreases of .01 to .05). Forthree of these seven facets, the cultural differences that werestatistically significant for the original scales were no longersignificant for the purified scales. One facet scale exhibited sig-nificant cultural mean differences of comparable size for both theoriginal and purified scales. In summary, for six of the 13 facetsthat could be compared, conclusions about the existence or size ofcultural mean differences would be different based on the purifiedscales, as compared with the original scales.
Finally, in the comparison of the Filipino and Mexican samples,purified scales were derived for 11 facets. For six of these 11facets, no cultural differences were observed for either the originalor purified facet scales. Of the remaining five facets, three showedmodest reductions in the size of the cultural effects (�p
2 decreasesof .01 to .03), although one of these effects was still statisticallysignificant, and two showed slightly larger cultural effects for thepurified scales as compared with the original scales. In summary,for five of the 11 facets that could be compared, conclusions aboutthe size, direction, or existence of cultural mean differences wouldbe different based on the purified scales, as compared with theoriginal scales.
In summary, across the three pairwise cultural comparisons,conclusions about the statistical significance of cultural meandifferences would have been different for 12 (31.6%) of the 38possible comparisons of original and purified scales. For just under50% of the comparisons, conclusions about the size of the culturaleffects would have been different, although some of the effect sizechanges were modest. We could not discern any consistent patternsregarding which facets would have resulted in the same or differ-ent conclusions regarding cultural differences. Indeed, facets fromall of the Big Five domains exhibited such changes between theoriginal and purified scales in one or more of the cultural com-parisons.
Taking into account invariance at the facet level. Althoughresearchers typically remove DIF items from their scales beforemaking cross-cultural comparisons, as described in the previoussection, a case can be made for retaining the original scales inthose cases in which DIF canceled out at the facet level. However,this is not a simple matter of retaining all of those facets thatexhibited invariance in Tables 2, 3, and 4—that is, those facets forwhich DIF appeared to have cancelled out at the facet level. Ifother facet scales in the same Big Five domain were not invariant,then the facets defining the Big Five latent construct exhibited only
partial invariance (Byrne et al., 1989). In particular, if many of thefacets defining the same Big Five construct lack invariance, then itwould call into question the cross-cultural equivalence of the latentBig Five domain scores used to test the invariance of the remainingfacets, including those facets that appear to be invariant.
Researchers disagree on the proportion of invariant facetsneeded to enable cross-cultural comparisons. A rather liberal cri-terion was suggested by Byrne et al. (1989), who argue that as longas at least one indicator—in this case, one facet scale—beyond theanchor facet is invariant, sufficient partial invariance exists topermit cross-cultural comparisons. However, other researcherssuggest that a partial invariance strategy should be used only whena large number of indicators (facets) are invariant (Brown, 2006;Vandenberg & Lance, 2000). In the present study, we used amoderately conservative strategy as follows: If in addition to theanchor facet (with the anchor intercept also being invariant), threeof the five additional facets in the Big Five domain were invariant,then we considered it permissible to compare the four invariantfacets across cultures, even in the presence of item-level DIFwithin these facets.
Using this partial invariance strategy, only a few additional facetscales would qualify for comparison based on the ��2 criterion—zero in the United States-Philippines comparison (see Table 2) andthree in both the United States-Mexico and Philippine-Mexicocomparisons (see Tables 3 and 4). In contrast, with the �CFIcriterion, which detects less noninvariance, many more facet scaleswould qualify for comparison. In the United States-Philippinescomparison, these include four Conscientiousness facets (C1, C2,C3, and C5; see Table 2). In the United States-Mexico comparison,these include five Neuroticism facets (N1, N2, N3, N4, and N6),five Extraversion facets (E2, E3, E4, E5, E6), and all six Consci-entiousness facets (see Table 3). In the Philippines-Mexico com-parison, these include four Neuroticism facets (N2, N4, N5, andN6) plus all of the Extraversion and Conscientiousness facets (seeTable 4).
For several of these facet scales, the purified scales had been tooshort or unreliable to retain for cross-cultural comparisons. Thus,by using this partial invariance strategy, the number of facets thatcould be compared increased from 14 to 15 in the United States-Philippines comparison, from 14 to 20 in the United States-Mexicocomparison, and from 11 to 19 for the Philippines-Mexico com-parison. Thus, for each cultural comparison, there were still from11 to 15 facets that could not be compared, either because they didnot meet our criterion for partial invariance or because the purifiedscales were too short or unreliable.
Note that scales that qualified for comparison on the basis of ourpartial invariance strategy would no longer need to be purified ofDIF items; DIF could be viewed as having cancelled out at thefacet level. This would then reduce the number of scales showingdifferent conclusions in tests of mean cultural differences, ascompared with our earlier comparisons of original and purifiedscales.
Of the 15 facets that could now be compared in the UnitedStates-Philippines comparison, conclusions about the statisticalsignificance and size of cultural differences would still change forseven and eight facets, respectively. Of the 20 facets that couldnow be compared in the United States-Mexico comparison, con-clusions about the statistical significance and size of culturaldifferences would only change for one and three facets, respec-
1079DIFFERENTIAL ITEM FUNCTIONING IN THE NEO-PI-R

tively. Of the 19 facets that could now be compared in thePhilippines-Mexico comparison, conclusions about the statisticalsignificance and size of cultural differences would only change forone and two facets, respectively. In summary, of 54 possiblecomparisons across the three pairwise cultural comparisons, con-clusions about the significance and size of cultural mean differ-ences would change for about 17% and 24% of the comparisons,respectively. These percentages are about half the size of thosereported in our comparison of the original and purified scales.Keep in mind, however, that from one third to one half of the facetscales, depending on the particular pairwise cultural comparison,could still not be compared even in the partial invariance analysis.
Discussion
The primary goal of this study was to investigate the validity ormeaningfulness of cross-cultural comparisons of mean personalityprofiles. Such comparisons have potential theoretical importancein increasing researchers’ understanding of the ecological, cultural,and biological factors that influence personality. However, theyhave also generated controversy (e.g., Bock, 2000; Church, 2008;Poortinga et al., 2002). We focused on one important prerequisitefor such comparisons, measurement invariance, using the NEO-PI-R, which is presently the most prominent inventory used incross-cultural comparisons of personality profiles. Relatively fewstudies have investigated measurement invariance in personalityinventories (e.g., Ellis et al., 1993; Ellis & Mead, 2000; Huang etal., 1997; Johnson et al., 2008; Waller et al., 2000), and onlyHuang et al. did so with a version of the NEO-PI. Thus, the presentstudy is the first to examine measurement invariance in translatedversions of the NEO-PI-R.
Our overall conclusion is that DIF is prevalent in the NEO-PI-Rand frequently carries forward to the facet level. Using a partialinvariance strategy can increase the number of facet scales thatqualify for comparison across cultures, but still leaves many scalesthat cannot be confidently compared due to the presence of DIF orfacet-level noninvariance. Thus, considerable caution is needed indrawing conclusions about mean trait differences between cultureson the basis of aggregate NEO-PI-R profiles.
Nature and extent of DIF. In total, about 40%–50% of theitems in the NEO-PI-R exhibited some form of DIF across thethree cultural comparisons. Approximately half of the DIF itemsexhibited DIF in more than one cultural comparison, revealingsome replication of DIF and that some items are prone to DIFacross multiple comparisons. One might argue that our primarycriterion for identifying DIF (�CFI � .01) is arbitrary and thatdifferent DIF criteria would result in different percentages of DIFitems. It should be noted, however, that G. W. Cheung andRensvold (2002) recommended this criterion as a way to identifydifferences in CFA model fit that have practical (not just statisti-cal) significance. Indeed, as reported earlier, the DIF items iden-tified using this criterion had cultural differences in freely esti-mated loadings and intercepts that were substantial in size. Thus,although the exact percentage of items showing DIF will, ofcourse, depend on the significance level or other criterion applied,the items designated as DIF items in the present study exhibitednontrivial differences in loadings and intercepts.
The total percentage of DIF items in this study is slightly largerthan the 40% reported by Huang et al. (1997) with the original
NEO-PI and the approximately 30% reported by Johnson et al.(2008) with the MPQ. Johnson et al. examined DIF in a compar-ison of American and German samples, so it is possible that thegreater proportion of DIF items in the present study was due, inpart, to our inclusion of more diverse cultural samples. Carefulback-translation procedures were used to derive the Filipino andMexican versions of the NEO-PI-R, and our inspection of the DIFitems suggested that translation inequivalence contributed to DIFfor only a small number of items. In contrast, culture-specific itemsubstitutions, although few in number, generally resulted in DIF.Although such adaptations may be necessary in some cases—andare not a problem for within-culture applications—our resultssuggest that they are likely to contribute to a lack of measurementinvariance. Much of the remaining DIF is likely due to culturaldifferences in the relevance or prevalence (i.e., endorsement rate)of the behavioral indicators of the traits, although it can be difficultto explain these differences in terms of cultural norms, contexts, orpractices (Ellis, 1990; Huang et al., 1997; Reise et al., 2001). Thepotential significance of this DIF for cultural comparisons isdiscussed in the following paragraphs.
Loading DIF. The most definitive finding of our study wasthat loading DIF was relatively infrequent and much less commonthan intercept DIF. This is important because it indicates that thethoughts, feelings, and behaviors referred to in the items are, in thevast majority of cases, equally relevant indicators of the associatedtraits in all three cultures. This provides strong evidence for thecross-cultural conceptual equivalence of the traits assessed by thefacet scales and the Big Five dimensions. DIF in the factor load-ings would represent a more fundamental problem for cross-cultural personality assessment, because it would indicate that theconstructs being measured are defined differently, or manifested indifferent behaviors, in varied cultural contexts.
When loading DIF was detected, Mexicans tended to have lowerloadings in comparisons with Americans and Filipinos, and Fili-pinos tended to have lower loadings than Americans, although thiswas not always the case. This is not a surprising finding, given thatthe items and associated behaviors were selected as relevant indi-cators of the traits for Americans. However, it does point to onebenefit of DIF analyses, which can identify those behavioral ex-emplars of traits that are less relevant in assessing the traits inparticular cultures.
Our finding that loading DIF was more likely for items thatinvolved negations suggests that such items should be avoided incross-cultural personality assessment. Test construction guidelinesoften call for inclusion of a balance of positively keyed andreverse-keyed items, in large part to offset the effects of acquies-cence bias. However, if reverse-keyed items are obtained by usingnegations (e.g., “I don’t find it easy to take charge”), rather thandirect indicators of the opposite pole of the trait (e.g., “In meetings,I usually let others do the talking”), it may contribute to lessinvariant measurement across cultures.
Intercept DIF. In contrast to loading DIF, intercept DIF wasfairly common—about 40% of the items based on the more con-servative �CFI criterion. This indicates that there were culturaldifferences in the extent to which the thoughts, feelings, andbehaviors referred to in these items were endorsed by respondents.It should be noted that a lack of intercept invariance could reflecteither systematic measurement bias or valid group differences intrait levels (Cole, Maxwell, Arvey, & Salas, 1993; Hancock,
1080 CHURCH ET AL.

1997). Systematic bias would indicate that individuals with thesame level of the latent trait but from different cultures rate theitem differently, leading to noninvariant intercepts. However, it isalso possible that respondents in a particular culture endorse anitem less, and hence have lower intercepts, because they actuallyaverage lower on the latent trait. This latter possibility is morelikely when the same culture shows lower intercepts on many ofthe items in the facet scale, revealing a fairly uniform pattern oflower endorsement of the behavioral exemplars of the trait (i.e.,analogous to a cultural main effect). In contrast, when there is noconsistent or uniform pattern of DIF within a facet, DIF morelikely reflects bias associated with the content of specific DIFitems (i.e., analogous to a Culture Item interaction).
For many of the facet scales in our pairwise cultural compari-sons, a fairly uniform pattern of DIF was exhibited, suggesting thatsome DIF was due to average latent trait differences. For manyother facets, however, this was not the case. That is, there was noconsistent trend for one or the other culture to have the higherintercept for the DIF items in the facet. Furthermore, many appar-ent cultural mean differences were reduced or eliminated whenDIF items were removed. These findings suggest that at least someDIF was, in fact, due to measurement bias, that is, cultural differ-ences in the relevance or prevalence of the specific behaviors(items) used as indicators of the respective traits. Unfortunately,elimination of DIF items to remove such biases can also raisequestions about the content-representativeness of the remainingitems and thus descriptions of manifest trait levels in each culture.Certainly, more confident conclusions about cultural differenceswould be possible if relatively few items exhibit DIF, which wasnot the case here.
Does DIF carry forward to the facet scale level? As notedearlier, McCrae, Terracciano, & 79 Members (2005b) suggestedthat DIF might cancel out at the facet level, allowing valid cross-cultural comparisons even in the presence of DIF. A second goalof our study was to investigate this possibility. A few studies withreal and simulated data have suggested that DIF may not cancelout at the scale level in cross-cultural comparisons (e.g., Ellis &Mead, 2000; Li & Zumbo, 2009; Nye et al., 2008; see, however,Waller et al., 2000). However, none of these studies investigatedthis question with the NEO-PI-R. Our results were clear. McCrae,Terracciano, & 79 Member’s (2005b) speculation was generallysupported in the case of loading DIF, but not intercept DIF.
Indeed, loading DIF rarely contributed to loading noninvarianceat the facet level. Of course, loading DIF was small and infrequent,so it is possible that loading DIF will carry forward to the scalelevel when loading DIF is more extensive. Furthermore, loadingDIF can also contribute to intercept noninvariance at the facetlevel.3 In contrast, intercept DIF frequently carried forward, con-tributing to intercept noninvariance at the facet level. Our partialinvariance analysis suggested that some intercept DIF cancelledout at the facet level, making more cross-cultural comparisonspossible. However, this was not the case for many other facets, andmany purified scales were too short or unreliable for cross-culturalcomparisons. Furthermore, our finding that some cultural differ-ences were reduced or eliminated after deleting DIF items suggeststhat item bias was carried forward for at least some facets. At aminimum, our results imply that considerable caution is necessaryin interpreting profile differences across cultures, particularlywhen the differences are not large.
How might we reconcile our findings with the results of studiesthat suggest such profile comparisons may be meaningful? Asnoted earlier, substantial (though imperfect) geographical pattern-ing of personality profiles, and sensible (although not consistentlyreplicable) country-level correlates of Big Five scores, have beenobserved (e.g., Allik & McCrae, 2004; Hofstede & McCrae, 2004;McCrae & Terracciano, 2008; McCrae et al., 2010; Schmitt et al.,2007). In addition, country-level means are generalizable acrossgender and age groups in both self-report and observer data (Costaet al., 2001; McCrae, 2001, 2002; McCrae, Terracciano, & 78Members, 2005a; McCrae et al., 2010; Schmitt et al., 2007).Several explanations seem plausible.
One possibility, examined in this study, is that intercept nonin-variance cancels out at the facet level or is caused by valid culturaldifferences in trait levels. Our results suggest that this may be thecase for some but not all facets. A second possibility is that culturaldifferences in trait levels are sufficiently large to overshadow anybiases associated with DIF. Although only 4% of the variance inNEO-PI-R scores is accounted for by culture (McCrae & Terrac-ciano, 2008), the scores for some facets do show nontrivial depar-tures from American norms in some cultures (see, e.g., McCrae,2002, Appendix I). A third possibility is that various sources ofbias (e.g., DIF, response styles) that impact personality scoresacross cultures also impact measures of other constructs withwhich these personality scores are correlated. Indeed, most of theconstructs that have been related to country-level NEO-PI-Rscores have also been measured using self-report, so they would besubject to similar response biases (e.g., Gelade et al., 2006; Hof-stede & McCrae, 2004; Leung & Bond, 2004; Schmitt et al., 2007).Finally, some culture-level studies have focused on the Big Fivedomain scores rather than the facet scores (Hofstede & McCrae,2004; Schmitt et al., 2007). It is possible that facet-level nonin-variance cancels out at the Big Five domain level, although thisseems unlikely given our finding that at least some DIF carriedforward to the facet level. Also, McCrae et al. (2010) recentlyargued that cross-cultural comparisons of aggregate traits shouldbe conducted at the facet level rather than the domain level.
Each of these explanations may have some validity and addi-tional research will be needed to determine their relative efficacy.One recent approach—which avoids some of the problems asso-ciated with shared method variance—has been to correlate NEO-PI-R profile scores with nation-level indices of relevant behaviors(e.g., pace of life, longevity, suicide rates, alcohol consumption,and corruption; see, e.g., Heine, Buchtel, & Norenazyan, 2008;McCrae et al., 2010; Mottus, Allik, & Realo, 2010; Oishi & Roth,2009). For example, Heine et al. (2008) found that national char-acter ratings (i.e., ratings of typical personality) predicted country-level indices of Conscientiousness better than did cultural meansfor self-reported and observer-reported Conscientiousness, sug-gesting that cultural mean profiles may be invalid. Oishi and Roth
3 Loading DIF could impact intercept invariance at the facet levelbecause items with different item factor loadings (i.e., regression slopes) intwo cultures will tend to have different item intercepts as well (althoughintercept DIF is not formally tested when loading DIF is present). How-ever, with the possible exception of the O4: Actions facet in the UnitedStates-Mexican comparison (see Table 3), loading DIF did not appear toaccount for intercept noninvariance at the facet level.
1081DIFFERENTIAL ITEM FUNCTIONING IN THE NEO-PI-R

(2009) replicated Heine et al.’s findings for Conscientiousness butdid find that country mean scores for Agreeableness and Neurot-icism predicted relevant country-level behavioral indices. How-ever, Mottus et al. noted a number of complexities in conductingsuch studies. For example, because different facets of Conscien-tiousness (and probably other Big Five traits) apparently relatevery differently to culture-level criteria, it will be important torelate aggregate profiles and culture-level criteria at the facet levelrather than the domain level. In addition, these relationships ap-parently depend on whether the aggregate facet scores are based onself- or observer ratings (Mottus et al., 2010). Noting such com-plexities, and the often theoretically loose hypotheses linkingpersonality profiles to culture-level criteria, Mottus et al. con-cluded that “previous research on the predictive validity of nation-level mean personality scores has not been theoretically and meth-odologically rigorous enough to warrant definitive conclusions” (p.639). In summary, it is too early to tell whether such studies willbe able to resolve the apparent discrepancy between DIF resultsand other evidence suggesting that aggregate personality profilesmay be meaningful.
Practical implications. What are some practical implicationsof our findings? On the basis of our results, and those of previousstudies, it is apparent that a substantial proportion of items inpersonality inventories—typically about 30%–50%—will exhibitDIF, and some DIF will carry forward to the facet or score level.Although not a desirable amount of DIF, this percentage rangemight be viewed as somewhat normative for carefully back-translated inventories and a target to improve on in subsequenttranslation efforts. Given that DIF was rather uniformly distributedacross all domains and facets, eliminating DIF will not be a simplematter of revising the items in specific facet scales. Extensive DIFmay not be a problem for within-culture applications of personalityinventories, although it will be best to develop local norms forapplied use, rather than relying on American norms. In addition, ifthe inventory will be used for mean comparisons of cultural orethnic subgroups within a culture, DIF analyses should be ex-tended to such subgroup comparisons. Cross-cultural or cross-ethnic comparisons of nomological networks (e.g., behavioral cor-relates) and mean trait levels may be misleading in the presence ofsubstantial DIF. In addition to DIF analyses, we recommend thatfacet-level invariance also be examined. Using a partial invariancestrategy, it may be possible to justify cross-cultural comparisonswith additional scales. Unfortunately, there is presently little con-sensus regarding the number of invariant facets needed to imple-ment such a strategy, and more research is needed in this regard(Brown, 2006; Byrne et al., 1989; Vandenberg & Lance, 2000).
In theory, one way that researchers might attempt to avoid theproblems associated with noninvariant measures would be to applya culturally decentered approach. Researchers could try to con-struct inventories simultaneously in several cultures and selectitems that have invariant loadings and intercepts. However, Strelauand Angleitner’s (1994) experience in developing the PavlovianTemperament Survey may reveal the challenges associated withthis approach. The researchers developed a pool of 252 items, fromwhich researchers selected subsets of items with good item dis-crimination in their respective countries. It is revealing, however,that only about 50% of the selected items overlapped in any twocultural versions of the instrument. These results indicate that it
will be difficult to construct culturally decentered measures thatcontain only universal or invariant indicators of traits.
Presently, if cross-cultural comparisons are desired, one recom-mendation would be to use scales that have many items, so thatDIF items can be eliminated without substantial reductions inreliability and content representativeness. It is premature, however,to recommend that DIF items in existing inventories always beeliminated before making cross-cultural comparisons. One reasonis that elimination of DIF items could result in scales that are tooshort, unreliable, or lacking in content representativeness. A sec-ond reason is that more studies are needed to reconcile the typicalfinding of substantial DIF with culture-level findings, which sug-gest that cross-cultural mean comparisons may be meaningful(e.g., Allik & McCrae, 2004; Hofstede & McCrae, 2004). Indeed,DIF analyses alone cannot tell us whether scale scores are valid oraccurate, but they do tell us whether the scales provide equivalentmeasurement across cultures. Presently, definitive conclusionsabout the validity of cross-cultural mean comparisons are notpossible, although our findings should caution researchers againsttaking too strong a stance in favor of their validity. We recommendthat researchers use—and attempt to reconcile—both “bottom-up”approaches (e.g., DIF studies) and “top-down” approaches (e.g.,studies of culture-level correlates of mean profiles) in cross-cultural studies. Hopefully, this combined approach will eventu-ally lead to more confident conclusions regarding the validity ofmean profile comparisons with particular instruments.
Strengths and limitations. Strengths of the study includedthe diverse cultural samples investigated, the examination of in-variance at both item and facet levels, and the fact that DIF wasinvestigated in three pairwise cultural comparisons. There werealso some limitations. First, our total sample sizes were sufficientfor CFA analyses, but were not large enough to investigate DIFseparately for men and women (which in any case is not typicallydone) or to match the cultural samples on the proportion of menand women (e.g., Johnson et al., 2008). We did control for genderdifferences in the MANOVAs that tested for cultural mean differ-ences in the original and purified scales.
Second, some authors have recommended that researchers applyiterative DIF procedures in which items initially identified as DIFare eliminated and the remaining items are tested again for DIF(e.g., Huang et al., 1997; Park & Lautenschlager, 1990). We didnot use an iterative process, in part, because there would not havebeen a large number of items remaining in each facet scale afterdeletion of the initial DIF items. In addition, our goal was not todevelop a more refined measure but rather to draw conclusionsabout the extent of DIF in the NEO-PI-R. Although iterativeprocedures might change the exact number of DIF items, it isunlikely that our overall conclusions would have changed.
Third, although it is commonplace for researchers to considercultural explanations of DIF, this may be premature without firstreplicating the DIF items in additional samples. Also, other factorsbesides language and culture (e.g., differential motivation of sam-ples, acquiescence bias) could contribute to DIF. Of course, suchfactors could also contribute to noninvariance in the samples nowbeing compared in multinational studies of personality profiles.
A final limitation was our focus on an imported or “imposed-etic” measure (Berry, 1969; Church, 2001). Imported measuressuch as the NEO-PI-R may miss salient culture-unique behavioralexemplars of the traits being assessed. Only indigenous instru-
1082 CHURCH ET AL.

ments, or measures developed using a combined “emic-etic”(indigenous-imported) approach can identify and incorporate suchbehaviors (e.g., F. M. Cheung, Cheung, Wada, & Zhang, 2003;Katigbak et al., 2002; Ortiz et al., 2007). Of course, an importantdrawback of indigenous approaches is that truly culture-uniqueitems, by their very nature, are unlikely to exhibit measurementinvariance across cultures.
Conclusion
Although cross-cultural comparisons of personality profileshave the potential to clarify the ecological, cultural, and biologicalbases of personality, the validity of such comparisons is stillunresolved in our view. Although a number of factors can con-found such comparisons (e.g., sampling differences, referencegroup effects), the present study focused on one important prereq-uisite—measurement invariance. DIF studies of personality mea-sures are still rare. However, the available evidence indicates thatthere is substantial DIF in major personality inventories and thatcultural differences are typically reduced or eliminated after DIFitems are removed (Huang et al., 1997; Johnson et al., 2008; Nyeet al., 2008). Further research on the impact of DIF on scorecomparisons is needed, using both real and simulated data. Onegoal of such research would be to reconcile the presence ofextensive DIF—which does not always cancel out at the scalelevel—with other findings (e.g., geographical patterning, externalcorrelates), which suggest that cultural mean profiles are reason-ably valid or accurate. In the meantime, the take-home message ofthe present study is that considerable caution is warranted incross-cultural comparison of personality profiles.
References
Allik, J., & McCrae, R. R. (2004). Toward a geography of personalitytraits: Patterns of profiles across 36 cultures. Journal of Cross-CulturalPsychology, 35, 13–28. doi:10.1177/0022022103260382
Benet-Martinez, V., & John, O. P. (1998). Los cinco grandes across cultureand ethnic groups: Multitrait multimethod analysis of the Big Five inSpanish and English. Journal of Personality and Social Psychology, 75,729–750.
Bentler, P. M. (1990). Comparative fit indexes in structural models. Psy-chological Bulletin, 107, 238–246. doi:10.1037/0033-2909.107.2.238
Berry, J. W. (1969). On cross-cultural comparability. International Journalof Psychology, 4, 119–128. doi:10.1080/00207596908247261
Bock, P. K. (2000). Culture and personality revisited. American BehavioralScientist, 44, 32–40. doi:10.1177/00027640021956071
Bollen, K. A. (1989). Structural equations with latent variables. NewYork, NY: John Wiley.
Brown, T. A. (2006). Confirmatory factor analysis for applied research.New York, NY: Guilford Press.
Butcher, J. N. (Ed.). (1996). International adaptations of the MMPI-2.Minneapolis: University of Minnesota Press.
Byrne, B. M., Shavelson, R. J., & Muthen, B. (1989). Testing for theequivalence of factor covariance and mean structures: The issue ofpartial measurement invariance. Psychological Bulletin, 105, 456–466.doi:10.1037/0033-2909.105.3.456
Camilli, G., & Shepard, L. A. (1994). Methods for identifying biased testitems (Vol. 4). Thousand Oaks, CA: Sage.
Camperio Ciani, A. S., Capiluppi, C., Veronese, A., & Sartori, G. (2007).The adaptive value of personality differences revealed by small islandpopulation dynamics. European Journal of Personality, 21, 3–22. doi:10.1002/per.595
Cattell, R. B., Cattell, A. K., & Cattell, H. E. P. (1993). Sixteen PersonalityFactor Questionnaire (5th ed.). Champaign, IL: Institute for Personalityand Ability Testing.
Cheung, F. M., Cheung, S. F., Wada, S., & Zhang, J. (2003). Indigenousmeasures of personality assessment in Asian countries: A review. Psy-chological Assessment, 15, 280–289. doi:10.1037/1040-3590.15.3.280
Cheung, G. W., & Rensvold, R. B. (2002). Evaluating goodness-of-fitindexes for testing measurement invariance. Structural Equation Mod-eling: A Multidisciplinary Journal, 9, 233–255. doi:10.1207/S15328007SEM0902_5
Church, A. T. (1987). Personality research in a non-Western culture: ThePhilippines. Psychological Bulletin, 102, 272–292. doi:10.1037/0033-2909.102.2.272
Church, A. T. (2001). Personality measurement in cross-cultural perspec-tive. Journal of Personality, 69, 979 –1006. doi:10.1111/1467-6494.696172
Church, A. T. (2008). Current controversies in the study of personalityacross cultures. Social and Personality Psychology Compass, 2, 1930–1951. doi:10.1111/j.1751-9004.2008.00132.x
Church, A. T. (2010). Measurement issues in cross-cultural research. In G.Walford, M. Viswanathan, & E. Tucker (Eds.), The Sage handbook ofmeasurement (pp. 151–177). Thousand Oaks, CA: Sage Publications.
Church, A. T., & Katigbak, M. S. (2002). The five-factor model in thePhilippines: Investigating trait structure and levels across cultures. InR. R. McCrae & J. Allik (Eds.), The five-factor model across cultures(pp. 129–154). New York, NY: Kluwer Academic/Plenum Publishers.
Church, A. T., Katigbak, M. S., Miramontes, L. G., del Prado, A. M., &Cabrera, H. F. (2007). Culture and the behavioral manifestations oftraits: An application of the act frequency approach. European Journalof Personality, 21, 389–417. doi:10.1002/per.631
Church, A. T., Katigbak, M. S., Reyes, J. A. S., Salanga, M. G. C.,Miramontes, L. A., & Adams, N. B. (2008). Prediction and cross-situational consistency of daily behavior across cultures: Testing traitand cultural psychology perspectives. Journal of Research in Personal-ity, 42, 1199–1215. doi:10.1016/j.jrp.2008.03.007
Cole, D. A., Maxwell, S. E., Arvey, R., & Salas, E. (1993). Multivariategroup comparisons of variable systems: MANOVA and structural equa-tion modeling. Psychological Bulletin, 114, 174–184. doi:10.1037/0033-2909.114.1.174
Costa, P. T. Jr., & McCrae, R. R. (1992). Revised NEO PersonalityInventory (NEO-PI-R) and NEO Five-Factor Inventory (NEO-FFI) pro-fessional manual. Odessa, FL: Psychological Assessment Resources.
Costa, P. T., Jr., Terracciano, A., & McCrae, R. R. (2001). Genderdifferences in personality traits across cultures: Robust and surprisingfindings. Journal of Personality and Social Psychology, 81, 322–331.doi:10.1037/0022-3514.81.2.322
Del Pilar, G. H. (1998). L’extraversion en psychologie differentielle etl’extratension au Test De Rorschach [Extraversion in differential psy-chology and Rorschach extratension] (Doctoral dissertation, Universityof Paris X-Nanterre).
Ellis, B. B. (1990). Extension and evaluation of the Humphreys/Hulin emicitem identification hypothesis using item response theory. In P. J. D.Drenth, J. A. Sergeant, & R. J. Takens (Eds.), European perspectives inpsychology (Vol. 1, pp. 43–55). New York, NY: John Wiley.
Ellis, B. B., Becker, P., & Kimmel, H. D. (1993). An item response theoryevaluation of an English version of the Trier Personality Inventory (TPI).Journal of Cross-Cultural Psychology, 24, 133–148. doi:10.1177/0022022193242001
Ellis, B. B., & Mead, A. D. (2000). Assessment of the measurementequivalence of a Spanish translation of the 16PF Questionnaire. Educa-tional and Psychological Measurement, 60, 787–807. doi:10.1177/00131640021970781
Embretson, S. E., & Reise, S. P. (2000). Item response theory for psychol-ogists. Mahwah, NJ: Lawrence Erlbaum.
1083DIFFERENTIAL ITEM FUNCTIONING IN THE NEO-PI-R

Finch, W. H., & French, B. F. (2007). Detection of crossing differentialitem functioning: A comparison of four methods. Educationaland Psychological Measurement, 67, 565–582. doi:10.1177/0013164406296975
Finch, W. H., & French, B. F. (2008). Using exploratory factor analysis forlocating invariant referents in factor invariance studies. Journal of Mod-ern Applied Statistical Methods, 7, 223–233.
French, B. F., & Finch, W. H. (2006). Confirmatory factor analytic pro-cedures for the determination of measurement invariance. StructuralEquation Modeling: A Multidisciplinary Journal, 13, 378–402. doi:10.1207/s15328007sem1303_3
French, B. F., & Finch, W. H. (2008, March). When under the influence ofnon-invariant factor loadings, does computation method of the factorscore matter? Paper presented at the American Educational ResearchAssociation, New York, NY.
French, B. F., & Maller, S. J. (2006, April). The influence of differentialitem functioning on internal consistency reliability. Paper presented atthe American Educational Research Association, San Francisco, CA.
French, B. F., & Maller, S. J. (2007). Iterative purification and effect sizeuse with logistic regression for DIF detection. Educational and Psycho-logical Measurement, 67, 373–393. doi:10.1177/0013164406294781
French, B. F., Maller, S. J., & Zumbo, B. (2007, April). The influence ofdifferential item functioning on multi-sample confirmatory factor anal-ysis. Paper presented at the National Council on Measurement in Edu-cation conference, Chicago, IL.
Gelade, G. A., Dobson, P., & Gilbert, P. (2006). National differences inorganizational commitment: Effect of economy, product of personality,or consequence of culture? Journal of Cross-Cultural Psychology, 37,542–556. doi:10.1177/0022022106290477
Gellman, M. (1994). The revised NEO Personality Inventory: Manualsupplement for the Spanish edition. Odessa, FL: Psychological Assess-ment Resources.
Hancock, G. R. (1997). Structural equation modeling methods of hypoth-esis testing of latent variable means. Measurement and Evaluation inCounseling and Development, 30, 91–105.
Heine, S. J., Buchtel, E. E., & Norenzayan, A. (2008). What do cross-national comparisons of personality traits tell us? The case of conscien-tiousness. Psychological Science, 19, 309–313. doi:10.1111/j.1467-9280.2008.02085.x
Heine, S. J., Lehman, D. R., Peng, K., & Greenholtz, J. (2002). What’swrong with cross-cultural comparisons of subjective Likert scales? Thereference-group effect. Journal of Personality and Social Psychology,82, 903–918. doi:10.1037/0022-3514.82.6.903
Hofstede, G., & McCrae, R. R. (2004). Personality and culture revisited:Linking traits and dimensions of culture. Cross-Cultural Research, 38,52–88. doi:10.1177/1069397103259443
Huang, C. D., Church, A. T., & Katigbak, M. S. (1997). Identifyingcultural differences in items and traits: Differential item functioning inthe NEO Personality Inventory. Journal of Cross-Cultural Psychology,28, 192–218. doi:10.1177/0022022197282004
Johnson, W., Spinath, F., Krueger, R. F., Angleitner, A., & Riemann, R.(2008). Personality in Germany and Minnesota: An IRT-based compar-ison of MPQ self-reports. Journal of Personality, 76, 665–706. doi:10.1111/j.1467-6494.2008.00500.x
Kahn, J. H. (2006). Factor analysis in counseling psychology research,training, and practice: Principles, advances, and applications. The Coun-seling Psychologist, 34, 684–718. doi:10.1177/0011000006286347
Katigbak, M. S., Church, A. T., Guanzon-Lapena, M. A., Carlota, A. J., &del Pilar, G. H. (2002). Are indigenous personality dimensions culturespecific? Philippine inventories and the five-factor model. Journal ofPersonality and Social Psychology, 82, 89–101. doi:10.1037/0022-3514.82.1.89
Labouvie, E., & Ruetsch, C. (1995). Testing for equivalence of measure-ment scales: Simple structure and metric invariance reconsidered.
Multivariate Behavioral Research, 30, 63–76. doi:10.1207/s15327906mbr3001_4
Leung, K., & Bond, M. H. (2004). Social axioms: A model for socialbeliefs in multicultural perspective. In M. P. Zanna (Ed.), Advances inexperimental social psychology (Vol. 36, pp. 119–197). San Diego, CA:Elsevier Academic Press.
Levine, R. V., & Norenzayan, A. (1999). The pace of life in 31 countries.Journal of Cross-Cultural Psychology, 30, 178 –205. doi:10.1177/0022022199030002003
Li, Z., & Zumbo, B. D. (2009). Impact of differential item functioning onsubsequent statistical conclusions based on observed test score data.Psicologica, 30, 343–370.
Lynch, R. (1973). Social acceptance reconsidered. In F. Lynch & A. deGuzman II (Eds.), Four readings on Philippine values (4th ed., enlarged,Institute of Philippine Culture Papers No. 2, pp. 1–68). Quezon City,Philippines: Ateneo de Manila University Press.
McCrae, R. R. (2001). Trait psychology and culture: Exploring intercul-tural comparisons. Journal of Personality, 69, 819–846. doi:10.1111/1467-6494.696166
McCrae, R. R. (2002). NEO-PI-R data from 36 cultures: Further intercul-tural comparisons. In R. R. McCrae & J. Allik (Eds.), The five-factormodel of personality across cultures (pp. 105–125). New York, NY:Kluwer Academic/Plenum Publishers.
McCrae, R. R. (2004). Human nature and culture: A trait perspective.Journal of Research in Personality, 38, 3–14. doi:10.1016/j.jrp.2003.09.009
McCrae, R. R., & Allik, J. (Eds.). (2002). The five-factor model acrosscultures. New York, NY: Kluwer/Plenum.
McCrae, R. R., Costa, P. T., Jr., del Pilar, G. Y., Rolland, J.-P., & Parker,W. D. (1998). Cross-cultural assessment of the five-factor model: TheRevised NEO Personality Inventory. Journal of Cross-Cultural Psychol-ogy, 29, 171–188. doi:10.1177/0022022198291009
McCrae, R. R., & Terracciano, A. (2008). The five-factor model and itscorrelates in individuals and cultures. In F. J. R. van de Vijver, D. A. vanHemert, & Y. H. Poortinga (Eds.), Multilevel analyses of individuals andcultures (pp. 249–283). Mahwah, NJ: Erlbaum.
McCrae, R. R., Terracciano, A., & 78 Members of the Personality Profilesof Cultures Project. (2005a). Universal features of personality traits fromthe observer’s perspective: Data from 50 cultures. Journal of Personalityand Social Psychology, 88, 547–561. doi:10.1037/0022-3514.88.3.547
McCrae, R. R., Terracciano, A., & 79 Members of the Personality Profilesof Cultures Project. (2005b). Personality profiles of cultures: Aggregatepersonality traits. Journal of Personality and Social Psychology, 89,407–425. doi:10.1037/0022-3514.89.3.407
McCrae, R. R., Terracciano, A., De Fruyt, F., De Bolle, M., Gelfand, M. J.,Costa, P. T., Jr., & 42 Collaborators of the Adolescent PersonalityProfiles of Cultures Project. (2010). The validity and structure ofculture-level personality scores: Data from ratings of young adolescents.Journal of Personality, 78, 815– 838. doi:10.1111/j.1467-6494.2010.00634.x
Meade, A. W., & Lautenschlager, G. J. (2004). A comparison of itemresponse theory and confirmatory factor analytic methodologies forestablishing measurement equivalence/invariance. Organizational Re-search Methods, 7, 361–388. doi:10.1177/1094428104268027
Mottus, R., Allik, J., & Realo, A. (2010). An attempt to validate nationalmean scores of Conscientiousness: No necessarily paradoxical findings.Journal of Research in Personality, 44, 630 – 640. doi:10.1016/j.jrp.2010.08.005
Nunnally, J. C., & Bernstein, I. H. (1994). Psychometric theory. New York,NY: McGraw-Hill.
Nye, C. D., Roberts, B. W., Saucier, G., & Zhou, X. (2008). Testing themeasurement equivalence of personality adjective items across cultures.Journal of Research in Personality, 42, 1524 –1536. doi:10.1016/j.jrp.2008.07.004
1084 CHURCH ET AL.

Oishi, S., & Roth, D. P. (2009). The role of self-reports in culture andpersonality research: It is too early to give up on self-reports. Journal ofResearch in Personality, 43, 107–109. doi:10.1016/j.jrp.2008.11.002
Olson, K. R. (2007). Why do geographic differences exist in the worldwidedistribution of extraversion and openness to experience? The history ofhuman emigration as an explanation. Individual Differences Research, 5,275–288.
Ortiz, F. A., Church, A. T., Vargas-Flores, J., Ibanez-Reyes, J., Flores-Galaz, M., Iuit-Briceno, J. I., & Escamilla, J. M. (2007). Are indigenouspersonality dimensions culture-specific? Mexican inventories and thefive-factor model. Journal of Research in Personality, 41, 618–649.doi:10.1016/j.jrp.2006.07.002
Park, D. G., & Lautenschlager, G. J. (1990). Improving IRT item biasdetection with iterative linking and ability scale purification.Applied Psychological Measurement, 14, 163–173. doi:10.1177/014662169001400205
Poortinga, Y. H., Van de Vijver, F. J. R., & Van Hemert, D. A. (2002).Cross-cultural equivalence of the Big Five: A tentative interpretation ofthe evidence. In R. R. McCrae & J. Allik (Eds.), The five-factor modelof personality across cultures (pp. 281–302). New York, NY: KluwerAcademic/Plenum Publishers.
Raju, N. S., Laffitte, L. J., & Byrne, B. M. (2002). Measurement equiva-lence: A comparison of methods based on confirmatory factor analysisand item response theory. Journal of Applied Psychology, 87, 517–529.doi:10.1037/0021-9010.87.3.517
Reise, S. P., Smith, L., & Furr, R. M. (2001). Invariance on the NEO PI-RNeuroticism scale. Multivariate Behavioral Research, 36, 83–110. doi:10.1207/S15327906MBR3601_04
Reise, S. P., Widaman, K. F., & Pugh, R. H. (1993). Confirmatory factoranalysis and item response theory: Two approaches for exploring mea-surement invariance. Psychological Bulletin, 114, 552–566. doi:10.1037/0033-2909.114.3.552
Saucier, G. (1994). Mini-markers: A brief version of Goldberg’s unipolarBig Five markers. Journal of Personality Assessment, 63, 506–516.doi:10.1207/s15327752jpa6303_8
Schmitt, D. P., Allik, J., McCrae, R. R., & Benet-Martınez, V. (2007). Thegeographic distribution of big five personality traits: Patterns and pro-files of human self-description across 56 nations. Journal of Cross-Cultural Psychology, 38, 173–212. doi:10.1177/0022022106297299
Stark, S., Chernyshenko, O. S., & Drasgow, F. (2006). Detecting differ-ential item functioning with confirmatory factor analysis and item re-
sponse theory: Toward a unified strategy. Journal of Applied Psychol-ogy, 91, 1292–1306. doi:10.1037/0021-9010.91.6.1292
Steenkamp, J.-B. E. M., & Baumgartner, H. (1998). Assessing measure-ment invariance in cross-national consumer research. Journal of Con-sumer Research, 25, 78–107. doi:10.1086/209528
Strelau, J., & Angleitner, A. (1994). Cross-cultural studies on tempera-ment: Theoretical considerations and empirical studies based on thePavlovian Temperament Survey. Personality and Individual Differ-ences, 16, 331–342. doi:10.1016/0191-8869(94)90170-8
Taylor, T. R., & Boeyens, J. C. (1991). The comparability of scores ofBlacks and Whites on the South African Personality Questionnaire: Anexploratory study. South African Journal of Psychology, 21, 1–11.
Tellegen, A., & Waller, N. G. (2008). Exploring personality through testconstruction: Development of the Multidimensional Personality Ques-tionnaire. In G. J. Boyle, G. Matthews, & D. H. Saklofske (Eds.),Handbook of personality theory and testing: Personality measurementand assessment (Vol. 2, pp. 261–292). London, England: Sage.
Terracciano, A., Abdel-Khalek, A. M., Adam, N., Adamovova, L., Ahn,C.-K., Ahn, H.-N., . . . McCrae, R. R. (2005, October 7). National char-acter does not reflect mean personality trait levels in 49 cultures.Science, 310, 96–100. doi:10.1126/science.1117199
Vandenberg, R. J., & Lance, C. E. (2000). A review and synthesis of themeasurement invariance literature: Suggestions, practices, and recom-mendations for organizational research. Organizational Research Meth-ods, 3, 4–70. doi:10.1177/109442810031002
van de Vijver, F. J., & Leung, K. (1997). Methods and data analysis forcross-cultural research. Thousand Oaks, CA: Sage.
van Leest, P. F. (1997). Bias and equivalence research in the Netherlands.European Review of Applied Psychology/Revue Europeenne de Psy-chologie Appliquee, 47, 319–329.
Waller, N. G., Thompson, J. S., & Wenk, E. (2000). Using IRT to separatemeasurement bias from true group differences on homogeneous andheterogeneous scales: An illustration with the MMPI. PsychologicalMethods, 5, 125–146. doi:10.1037/1082-989X.5.1.125
Zumbo, B. D. (2003). Does item-level DIF manifest itself in scale-levelanalysis? Implications for translating language tests. Language Testing,20, 136–147. doi:10.1191/0265532203lt248oa
Zumbo, B. D., & Koh, K. H. (2005). Manifestation of differences initem-level characteristics in scale-level measurement invariance tests ofmulti-group confirmatory factor analysis. Journal of Modern AppliedStatistical Methods, 4, 275–282.
(Appendix follows)
1085DIFFERENTIAL ITEM FUNCTIONING IN THE NEO-PI-R

Appendix
NEO-PI-R Items With Loading and Intercept DIF in One or More Cultural Comparisons
NEO-PI-R facet
Loading DIF Intercept DIF
US-Phil US-Mex Phil-Mex US-Phil US-Mex Phil-Mex
N1: Anxiety1 — US�M P�M — — —31 — — — — US�M P�M61 — US�M — — — P�M91 — — — — US�M —121 — — — US�P — P�M151 — US�M P�M — — —181 — — — US�P — —211 — — — — US�M —
N2: Angry Hostility36 — — — — — P�M66 — — — US�P US�M —96 — — P�M US�P — —156 — — — US�P US�M —186 — US�M — — — —216 — — — US�P — —
N3: Depression11 — US�M P�M — — —101 — — — US�P US�M P�M131 — — — — US�M P�M161 — — — — US�M P�M191 — — — US�P — —
N4: Self-Consciousness16 — — — US�P — P�M46 — — — — US�M P�M76 — — — US�P — P�M106 — — — US�P US�M P�M136 — — — — US�M P�M166 — — — US�M —196 — — — US�P US�M P�M226 — — — — — P�M
N5: Impulsiveness21 — US�M — US�P — P�M51 — — — — US�M P�M111 — — — US�P — P�M141 — — P�M US�P US�M —171 — — — — US�M P�M231 — — — US�P — P�M
N6: Vulnerability56 — — — US�P — —146 — — — — US�M P�M176 — — — — US�M P�M206 — — — — — P�M236 — — — US�P US�M —
E1: Warmth2 — — — US�P US�M P�M32 — — — US�P US�M —62 — — — US�P US�M —92 — — — US�P US�M P�M152 — — — US�P — —212 — — — — US�M P�M
E2: Gregariousness7 — — — — US�M —37 — — — — US�M —97 — — — — US�M P�M127 — — — US�P US�M —
(Appendix continues)
1086 CHURCH ET AL.
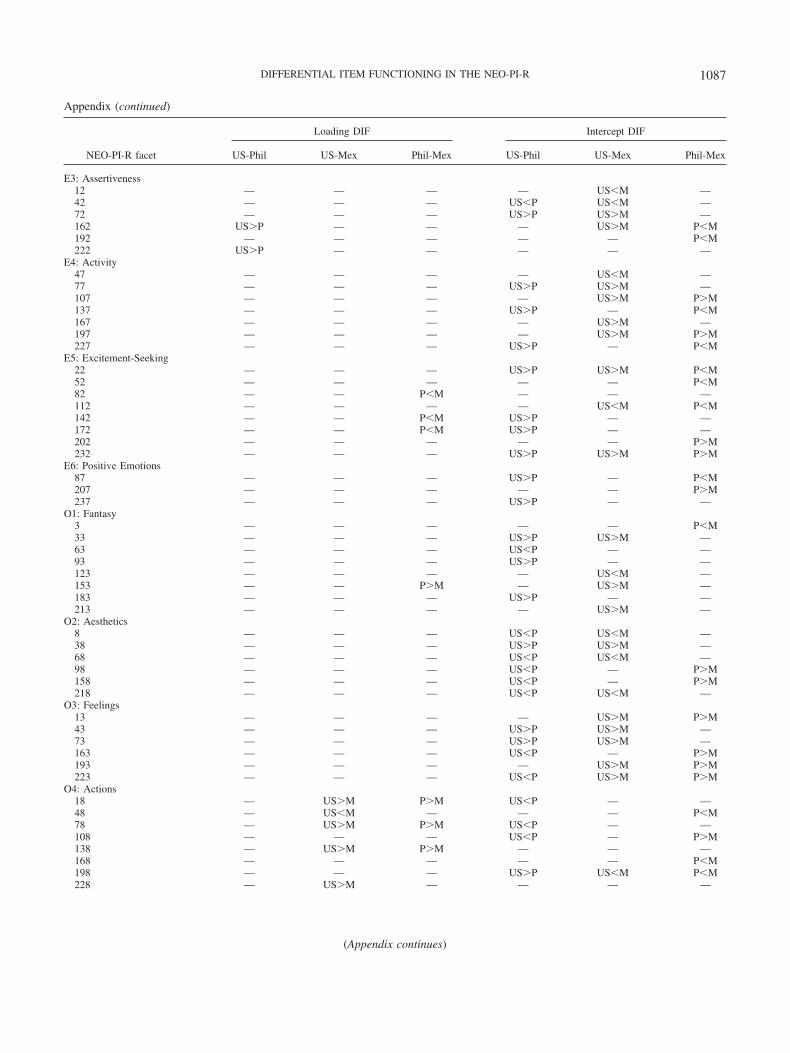
Appendix (continued)
NEO-PI-R facet
Loading DIF Intercept DIF
US-Phil US-Mex Phil-Mex US-Phil US-Mex Phil-Mex
E3: Assertiveness12 — — — — US�M —42 — — — US�P US�M —72 — — — US�P US�M —162 US�P — — — US�M P�M192 — — — — — P�M222 US�P — — — — —
E4: Activity47 — — — — US�M —77 — — — US�P US�M —107 — — — — US�M P�M137 — — — US�P — P�M167 — — — — US�M —197 — — — — US�M P�M227 — — — US�P — P�M
E5: Excitement-Seeking22 — — — US�P US�M P�M52 — — — — — P�M82 — — P�M — — —112 — — — — US�M P�M142 — — P�M US�P — —172 — — P�M US�P — —202 — — — — — P�M232 — — — US�P US�M P�M
E6: Positive Emotions87 — — — US�P — P�M207 — — — — — P�M237 — — — US�P — —
O1: Fantasy3 — — — — — P�M33 — — — US�P US�M —63 — — — US�P — —93 — — — US�P — —123 — — — — US�M —153 — — P�M — US�M —183 — — — US�P — —213 — — — — US�M —
O2: Aesthetics8 — — — US�P US�M —38 — — — US�P US�M —68 — — — US�P US�M —98 — — — US�P — P�M158 — — — US�P — P�M218 — — — US�P US�M —
O3: Feelings13 — — — — US�M P�M43 — — — US�P US�M —73 — — — US�P US�M —163 — — — US�P — P�M193 — — — — US�M P�M223 — — — US�P US�M P�M
O4: Actions18 — US�M P�M US�P — —48 — US�M — — — P�M78 — US�M P�M US�P — —108 — — — US�P — P�M138 — US�M P�M — — —168 — — — — — P�M198 — — — US�P US�M P�M228 — US�M — — — —
(Appendix continues)
1087DIFFERENTIAL ITEM FUNCTIONING IN THE NEO-PI-R

Appendix (continued)
NEO-PI-R facet
Loading DIF Intercept DIF
US-Phil US-Mex Phil-Mex US-Phil US-Mex Phil-Mex
O5: Ideas113 — — — — US�M —143 — — — US�P — —
O6: Values28 — — — US�P US�M P�M58 — — — US�P US�M P�M88 — US�M — US�P — P�M118 — — P�M US�P US�M —148 — US�M P�M — — —178 — — — US�P — P�M208 — US�M P�M US�P — —238 — — — US�P — P�M
A1: Trust4 — — — — — P�M34 — — — — US�M —64 US�P — — — US�M —124 — — — US�P — —154 — — — — US�M —184 — — — — US�M —214 — — — — — P�M
A2: Straightforwardness9 — — — US�P US�M —39 — — — US�P — P�M129 — — — US�P US�M —159 US�P — P�M — — —189 — — — US�P — P�M219 — — — US�P US�M —
A3: Altruism14 — — — US�P — P�M44 — — — — US�M —74 — — — US�P US�M P�M134 — — — — US�M —164 — — — US�P US�M —194 US�P — — — — P�M224 — — — — — P�M
A4: Compliance19 — — — US�P — P�M49 US�P — — — — P�M79 US�P — — — — —109 — — — US�P — —139 — — — US�P US�M P�M169 — — — — US�M P�M199 — — — US�P — —229 — — — US�P — —
A5: Modesty24 — — — US�P US�M —54 — — — — US�M P�M84 — — — US�P US�M —114 — US�M — — — —144 — — — — US�M P�M174 — — — — US�M P�M204 — — — — US�M P�M234 — — — US�P — P�M
A6: Tender-Mindedness29 — — — US�P US�M P�M59 — — — US�P US�M —89 — US�M P�M — — —119 — — — US�P US�M P�M149 US�P — — — US�M —179 — — — US�P US�M P�M209 — — — — US�M P�M239 — — — US�P US�M —
(Appendix continues)
1088 CHURCH ET AL.

Appendix (continued)
NEO-PI-R facet
Loading DIF Intercept DIF
US-Phil US-Mex Phil-Mex US-Phil US-Mex Phil-Mex
C1: Competence5 — — — US�P — P�M65 — — — US�P — —125 — — — US�P — P�M185 — — — US�P — P�M215 — — — US�P — P�M
C2: Order10 — — P�M — US�M —70 — — P�M — — —100 — — P�M — — —130 — — — — — P�M160 US�P — P�M — — —190 US�P US�M — — — P�M220 — US�M P�M US�P — —
C3: Dutifulness15 — — — US�P — P�M45 — — — — — P�M105 — — — — US�M P�M225 — — — US�P — P�M
C4: Achievement-Striving20 — — P�M US�P — —80 — — — — US�M P�M110 — — — — US�M —140 — — — — US�M P�M200 — — — — — P�M230 — — — — — P�M
C5: Self-Discipline25 — — — US�P — —55 — — — — US�M —85 — — — US�P — —235 — — — — US�M P�M
C6: Deliberation60 — — — US�P — —90 — — — — US�M —120 — — — US�P — P�M150 — — — — US�M —210 — — — — US�M P�M240 — — — US�P — P�M
Note. NEO-PI-R � Revised NEO Personality Inventory; DIF � differential item functioning; Phil. � Philippines; Mex. � Mexico. Dashes indicate thatthere was no loading or intercept DIF for the item in a given cultural comparison.
Received June 22, 2010Revision received April 11, 2011
Accepted April 27, 2011 �
1089DIFFERENTIAL ITEM FUNCTIONING IN THE NEO-PI-R