archundia tena grande engstru 2013
TRANSCRIPT

8/12/2019 Archundia Tena Grande EngStru 2013
http://slidepdf.com/reader/full/archundia-tena-grande-engstru-2013 1/17

8/12/2019 Archundia Tena Grande EngStru 2013
http://slidepdf.com/reader/full/archundia-tena-grande-engstru-2013 2/17
Author's personal copy
Behavior of reinforced concrete haunched beams subjected to cyclicshear loading
Hans I. Archundia-Aranda a,b, Arturo Tena-Colunga a,⇑ , Alejandro Grande-Vega a
a Departamento de Materiales, Universidad Autónoma Metropolitana, Edicio P4, Último Piso, Av, San Pablo 180, Col. Reynosa Tamaulipas, 02200 México, DF, Mexicob División de Estudios de Posgrado, Facultad de Ingeniería, UNAM, Ciudad Universitaria, 04510 México, DF, Mexico
a r t i c l e i n f o
Article history:Received 18 November 2011Revised 23 October 2012Accepted 24 October 2012
Keywords:Haunched beamsTapered elementsNonprismatic elementsShear strengthDeformation capacityCyclic testing
a b s t r a c t
Final research results and interpretations of the testing of ten prototype simply-supported reinforcedconcrete beams (eight haunched and two prismatic) designed to develop a shear failure under cyclicloading are presented. Five beams (four haunched and one prismatic) were tested without shear rein-forcement whereas the remaining ve (four haunched and one prismatic) were tested with a shear rein-forcement satisfying the minimum required for prismatic beams by the concrete norms of Mexico’sFederal District Code (MFDC). These haunched beams are identical in geometry and reinforcement to aset of haunched beams previously tested under static loading. These additional cyclic testing conrmedthe usefulness of a proposed equation to estimate the shear strength of reinforced concrete haunchedbeams, taking into account parameters such as the haunch angle, the concrete compressive strength,the shear reinforcement and the contribution of the inclined longitudinal reinforcement. From theobtained results, it can be observed that haunched beams have a different cyclic shear behavior withrespect to prismatic beams, having higher deformation and energy dissipation capacities, among otherreasons, because non-prismatic beams favor an arching action in the haunched length as the main resist-ing mechanism, that develops smoother cracking patterns.
2012 Elsevier Ltd. All rights reserved.
1. Introduction
Reinforced concrete haunched beams (RCHBs) are often used insimply-supported or continuous bridges worldwide ( Figs. 1 and 2)and in midrise framed buildings in Latin American countries likeMexico and Ecuador or in European countries like Germany. Rein-forced concrete haunched beams (RCHBs) are often used becausethey offer some structural and nonstructural advantages over pris-matic elements, such as stiffness or moment capacity to self-weight ratio, providing an smaller effective height at midspan forsupporting frames (bridges and buildings) which eases the place-ment of different facilities (i.e., air conditioning, piping) along thebuilding. Nevertheless, in some countries RCHBs are unlikely acommon structural solution in buildings because their use involvehigher construction costs, as special formwork and qualied con-struction workersare required. In particular,haunched beams havebeen used in RC bridges and buildings in Mexico City from a longtime ago. Despite this fact, there are no specic recommendations
for haunched beams in reinforced concrete norms for Mexico [1](NTCC-04,2004) andtheUnitedStates [2] (ACI-318-11) that wouldinsure the ductile detailing of these elements.
Although the German code [3] (DIN 1045-1, 2001) and sometextbooks [4–8] have some brief recommendations for the sheardesign of RCHBs, these guidelines do not include experimentaldata. The experimental evidence available is reduced to monotonictests of prototypes failing in shear [9–14]. The analytical researchrelated to the shear design of RCHBs is also limited. Besides theworks in which the shear resistance of a haunched section is thesum of the contributionof the concrete, plus the contribution of in-clined andtransverse steel reinforcements [4–5,7,9–14] , few worksare available where a plastic truss model has been used to analyzethe haunched element [6,8,15–17].
In order to insure the desirable ductile behavior of RCHBsaccording to capacity-design rules, it is necessary rst to under-stand howsuddenfailures under monotonic andcyclic loads occur,for example, the shear failure. Once this goal is achieved, it can bepossible to study how to warrant a ductile exural failure. There-fore, in this paper the experimental results of ten RCHBs designedto develop shear failure and tested under cyclic loading are pre-sented. This study complements a previous study of twin RCHBbut subjected to static loading [14]. The described study is summa-rized in following sections.
0141-0296/$ - see front matter 2012 Elsevier Ltd. All rights reserved.http://dx.doi.org/10.1016/j.engstruct.2012.10.037
⇑ Corresponding author. Tel.: +52 55 5318 9460; fax: +52 55 5318 9085.E-mail addresses: [email protected] (H.I. Archundia-Aranda),
[email protected] (A. Tena-Colunga), [email protected](A. Grande-Vega).
Engineering Structures 49 (2013) 27–42
Contents lists available at SciVerse ScienceDirect
Engineering Structures
j ou rna l homepage : www. e l s ev i e r. com / lo ca t e / engs t r uc t

8/12/2019 Archundia Tena Grande EngStru 2013
http://slidepdf.com/reader/full/archundia-tena-grande-engstru-2013 3/17
Author's personal copy
2. Description of test beams
The geometry of prototypes RCHBs was dened according to asurvey conducted in existing bridges and buildings in Mexico City(Figs. 2 and 3). The width (b) for all beams was 220mm, the effec-tive span (L) was 2800 mm, and the shear span ( a) was 1083 mm.The haunched length ( Lh) at both beam ends was one-third theeffective span (Lh =L/3 933 mm). Five different linear taperinggeometries were obtained by keeping constant the overall depthat each beam end ( hmax = 450 mm) and reducing the overall depth
at the central prismatic length to hmin = 450 (prismatic control ele-ment), 400, 350, 300 and 250mm. Therefore, haunched anglesfrom the horizontal ( a ) were 0 , 3.07 , 6.12 , 9.13 and 12.10respectively.
Thegeometry of all prototypes satisedthe requirement L/ h > 5
to be considered as slender beams by the Mexican code (L/hmax > 5). In addition, with the purpose of not magnifying the char-acteristic archingmechanism observed experimentallyand analyt-ically in haunched beams [9,10,18], all prototypes were checked tofulll the well-known a/d limiting ratio between slender beamsand short beams ( a/dmax > 2.5). The top and bottom reinforcementcover was 40 mm.
Thespecied material properties fordesign were a compressivestrength f 0c ¼24:5 MPað f 0c ¼250 kg=cm2Þ for the concrete, and ayield tensile stress f y = 412 MPa ( f y =4200 kg/cm2) for all the steelreinforcement. The measured properties for the steel reinforce-ment from coupon tests are given in Table 1. The measured prop-erties from compression tests of small cylindrical specimens at thedate of testing are identied in Table 2.
Two beams were constructed for each one of the ve differentgeometries considered: (a) onebeamwithout shear reinforcement,only with four stirrups outside the shear span to hold the longitu-dinal steel reinforcement and (b) one beam with minimum shearreinforcement according to NTCC-04 for prismatic elements con-sidering the effective depth at the support ( dmax). Therefore, tenprototype haunched beams were tested.
To insure a shear failure along the haunches, the design wasmade providing the exural capacity in the central prismaticlength and keeping continuous the longitudinal reinforcementalong the prototypes. As described in a previous paper [14], allthe specimens (monotonic and cyclic) were originally designed toinsure that they failed in shear while following general NTCC-04guidelines for prismatic beams. The following considerations weredone:
(a) The nominal contribution of concrete to shear ( V c ) wasassessed according to NTCC-04 considering an effectivedepth.
(b) The transverse steel reinforcement was placed at the maxi-mum spacingallowedby NTCC-04, smax =d/2. Theseparationused for the construction of the specimens was obtainedfrom adjusting the theoretical smax = 205 mm to smax = 185 -mm, in order to have stirrups almost equally spaced at thehaunched length Lh = 933 mm (Fig. 3), and
(c) additional shear reinforcement at the vertex zone wasplaced to account for the abrupt change of direction of thebottomlongitudinal reinforcement ( Fig. 4). For this purpose,a recommendation originally proposed by Park and Paulay
Fig. 1. Urban bridge with RC haunched beams in downtown Seattle.
Fig. 2. Urban bridges with RC haunched beams in Buenavista District, Mexico City(photo courtesy of Luis A. Urbina–Californias).
h L25 = 93.3 93.3 93.3 25
25 L = 280
330
25
h m a x
= 4
5
= 0°, 3.07°, 6.12°,9.13° and 12.10°
α
5
a = 108.3 V V
10
( 4 5
, 4 0
, 3 5
, 3 0 a n
d 2
5 )
[cm]
= v
a r
i a b l e
ααα
+ +
V -- V m i n
h
Fig. 3. Geometry and loading for the test specimens.
28 H.I. Archundia-Aranda et al. /Engineering Structures 49 (2013) 27–42

8/12/2019 Archundia Tena Grande EngStru 2013
http://slidepdf.com/reader/full/archundia-tena-grande-engstru-2013 4/17
Author's personal copy
[4] was adapted. According to Fig. 4, the additional vertical(shear) force that canbe transmittedat the vertexat yieldingis:
F v ¼ T y sin a ¼ As f y sin a ð1 Þ
where As is the area of the longitudinal inclined steel reinforcementand a is the angle of slope of haunch fromhorizontal. Therefore, theseparation of the additional shear reinforcement at the vertex re-gion (scd) can be computed as:
scd ¼ Av f ydmin
F v
ð2 Þ
where dmin is the effective depth at the prismatic section of thehaunched beam and Av is the areaof the transverse shear reinforce-ment. The theoretical separation scd wascomputed according to Eqs.(1) and (2) and then adjusted to practical values in order to ease theconstruction of the specimens. If the computed or adjusted scd wassmaller than the maximum separation for the transverse steel rein-forcement ( smax = 185 mm), thetransversereinforcement at thever-tex zone was spaced at scd; otherwise, the transverse reinforcementat the vertex zone was spaced at smax.
The shear capacity at the haunched sections was later checkedwith semi-empirical equations previously proposed by the authors[14], as described later in this paper in the section ‘‘comparisonwith nominal shear strength’’.
The cryptogram for the identication of the prototypes is TAS-Ca i-R j-c, where i is an index that indicates the consideredhaunched angle: i = 0 = 0 , i = 1 = 3.07 , i = 2 = 6.12 , i = 3 = 9.13 ,and i = 4 = 12.10 ; j is an index that indicates the shear reinforced: j = 0 indicates the absence of shear reinforced whereas j = 1
indicates the use of a minimum shear reinforced with the charac-teristic already referred.
Following the described general design procedure, the providedlongitudinal reinforcement for all beams consisted of 3#8 bars atthe top and 4#8 bars at the bottom (#8 bars= bars one inch indiameter). For all beams with shear reinforcement, the transverseshear reinforcement consisted of seven closed stirrups (two legs)made with#2.5 bars (#2.5 bars = bars 5/16 inch in diameter) alongthe haunched length (7S#2.5@ 185 mm) and 2S#2.5@ 185 mm atthe prismatic length. The reinforcement at the vertex zone con-sisted of 3S#2.5@ 185mm for beams up to 3.07 (TASCa 0-R1-cand TASCa 1-R1-c), 3S#2.5@ 140 mm for beam TASCa 2-R1-c,3S#2.5@ 75 mm for beam TASCa 3-R1-c and 3S#2.5@ 45 mm forbeam TASCa 4-R1-c. Typical arrangements are shown in Figs. 5–7.
3. Instrumentation and test displacement history
In order to assess the contribution of the steel reinforcement,beams were internally instrumented with strain gages to measuretensional and compressional strains in the longitudinal steel rein-forcementalong the haunched length, as well as to measure strainsof some stirrups in the same zone, as schematically depicted inFigs. 8 and 9.
Beams were simply supported and tested under concentratedcyclic loads (V ) that were applied 100 mm from the vertex formedby the intersection of tapered sections with the prismatic sectiontowards the centerline, as depicted in Fig. 3 and 10a. Loads andreactions were applied through 25.4 100 220mm steel platesto avoid local bearing crushing failures. The load was measuredwith load cells at each point of loading.
Table 1
Measured experimental properties for the steel reinforcement.
Bar number f y kg/cm2 (MPa) e y f sh kg/cm2 (MPa) esh f u kg/cm2 (MPa) eu
8 4348 (426.5) 0.00237 4348 (426.5) 0.0086 7707 (756.1) –2.5 4592 (450.5) 0.00235 4592 (450.5) 0.0074 7436 (729.5) –
Table 2
Measured experimental shear forces and characteristic displacements from cyclic tests.
Beam ID a ( ) h+ ( ) f 0c kg=cm2ðMPaÞ V cr t (kN) V u t (kN) V collapse t (kN) V nHB t (kN) V nHB/V u dcr (mm) du (mm) dcollapse (mm)
TASCa 0-R0-c 0 51 454 (44.5) 8.78 (86.1) 12.61 (123.7) 12.06 (118.3) 9.94 (97.5) 0.788 6.06 12.10 18.10TASCa 1-R0-c 3.07 43 433 (42.5) 4.41 (43.3) 4.41 (43.3) 4.41 (43.3) 8.58 (84.2) 1.946 6.12 9.48 19.00TASCa 2-R0-c 6.12 41 354 (34.7) 5.97 (58.6) 6.08 (59.6) 4.21 (41.3) 6.69 (65.6) 1.100 6.14 8.88 24.30TASCa 3-R0-c 9.13 35 395 (38.7) 3.83 (37.6) 3.85 (37.8) 4.37 (42.9) 5.98 (58.7) 1.553 6.10 9.22 30.22TASCa 4-R0-c 12.10 33 361 (35.4) 1.61 (15.8) 2.76 (27.1) 3.41 (33.5) 4.67 (45.8) 1.692 3.08 18.14 60.46TASCa 0-R1-c 0 38 227 (22.3) 4.56 (44.7) 24.89 (244.2) 12.92 (126.1) 17.88 (175.4) 0.718 4.14 20.42 33.60TASCa 1-R1-c 3.07 40 245 (24.0) 8.18 (80.2) 20.75 (203.6) 11.38 (111.6) 16.05 (157.5) 0.733 8.04 24.10 36.46TASCa 2-R1-c 6.12 33o 217 (21.3) 6.16 (60.4) 13.23 (129.8) 7.55 (74.1) 13.73 (134.7) 1.038 8.00 20.02 32.40TASCa 3-R1-c 9.13 36 284 (27.9) 2.92 (28.6) 13.70 (134.4) 9.77 (95.8) 12.43 (121.9) 0.907 4.06 29.28 40.56
TASCa
4-R1-c 12.10 29 245 (24.0) 1.52 (14.9) 7.88 (77.3) 5.12 (50.2) 9.94 (97.5) 1.261 4.08 33.92 57.88
Fig. 4. Additional shear reinforcement at the vertex zone due to the abrupt change of direction of the bottom longitudinal reinforcement.
H.I. Archundia-Aranda et al./ Engineering Structures 49 (2013) 27–42 29

8/12/2019 Archundia Tena Grande EngStru 2013
http://slidepdf.com/reader/full/archundia-tena-grande-engstru-2013 5/17
Author's personal copy
External instrumentation for cyclic loading was designed tomeasure vertical deections at midspan (two micrometers, oneto measure deections of beams with respect to the reaction beamand one to measure the deection of the reaction beam with re-spect to the ground oor, to correct beam deections) and the ap-plied loads with four load cells ( Fig. 10a).
Cyclic tests were displacement-controlled in terms of the mea-sured displacement at midspan d. According to previous results of monotonic tests [14], in order to capture rst shear cracking andfailure states, midspan displacement increments of 3 mm wereset in the displacement history in beams without shear reinforce-ment, whereas in beams with stirrups, displacement incrementsof 4 mm were used. Positive loads (gravity direction) induce a
positive moment and vice versa. Two cycles at the same displace-ment were set in the displacement history, as schematically de-picted in Fig. 10b. This was done in order to evaluate keystructural parameters such as stiffness and strength degradation,energy dissipation, and equivalent viscous damping. Tests werestopped when beams lost the ability of supporting more load,due to excessive damage (structural instability).
4. Experimental results
4.1. Hysteretic response
Hysteretic curves obtained for the test specimens without andwith shear reinforcement are depicted in Figs. 11 and 12 respec-tively. The deection ( d) at midspan was corrected by a xed co-lineal measurement to take into account the exibility of thestrong beam where the hydraulic jacks reacted ( Fig. 10a).The shearforce (V ) corresponds to the haunched end where the failureoccurred.
Because prototypes were subjected to the same deection his-tory, which means that deection history is not a variable [19], itis feasible to describe a general behavior for the RCHBs: increasingthe haunched angle diminishes the shearcapacity and the stiffnessof the beams (directly related with the fact that when thehaunched angle increases, the volume of concrete diminishes[14]), but increases the number of cycles that can sustain and theirdeformation capacity (primarily related to the capacity of RCHB toredistribute cracking along the haunched length). All elementsexhibited a pinching at the origin which is characteristic of
25 93.3
SECTION 1
93.3
SECTION 1
33093.3
3 # 2.5 @ 4.5
4 # 83 # 8
SECTION 2
25
[cm]
8 # 2.5 @ 18.5
Fig. 6. Reinforcement for beam TASCa 4-R1-c.
4 # 8
3 # 8
SECTION 2
# 2.5
SECTION 1
4 # 8
22
3545
[cm]
2530
22
4045
3 # 8VARIABLE
4
4
4
4
VARIABLE
30354045
25
STIRRUPS
STIRRUPS
# 2.5
Fig. 7. Typical cross sections.
Fig. 8. Typical internal instrumentation for beams TASC a i-R0-c.
25 93.3SECTION 1SECTION 1
93.3
2 # 2.5 @ 110
4 # 8
330
3 # 8
93.3SECTION 2
25[cm]
Fig. 5. Reinforcement for beam TASCa 1-R0-c.
30 H.I. Archundia-Aranda et al. /Engineering Structures 49 (2013) 27–42

8/12/2019 Archundia Tena Grande EngStru 2013
http://slidepdf.com/reader/full/archundia-tena-grande-engstru-2013 6/17
Author's personal copy
elements failing in shear [20]. As the haunch angle a increases, thepinching behavior is more pronounced ( Figs. 11 and 12) due to the
sliding along shear cracks. In addition, it is evident a slight asym-metry in the hysteresisdue to: (1) the geometry and reinforcementasymmetry of the prototypes with respect to a longitudinal axisand (2) the self weight of the beams.
On the basis of experimental observations and in agreementwith the monotonic testing [14], three characteristic forces were
identied from the full hysteretic response: (1) the shear force thatcaused the rst diagonal cracking ( V cr ), (2) the ultimate (maxi-mum) shear force ( V u) and (3) the shear that caused the collapseof the beams ( V collapse). All characteristic stages occurred under
(a)
-24-20
-16-12
-8-4048
12162024
0 1 2 3 4 5 6 7 8 9 10 11
(mm) first cyclessecond cycles
(b)
CYCLE NUMBER
Fig. 10. Experimental program: (a) testing setup (prototype TASC a 4-R1-c) and (b) cyclic displacement history.
Fig. 11. Hysteretic curves for beams TASCa i-R0-c (without shear reinforcement).
Fig. 9. Typical internal instrumentation for beams TASC a i-R1-c.
H.I. Archundia-Aranda et al./ Engineering Structures 49 (2013) 27–42 31
8/12/2019 Archundia Tena Grande EngStru 2013
http://slidepdf.com/reader/full/archundia-tena-grande-engstru-2013 7/17
Author's personal copy
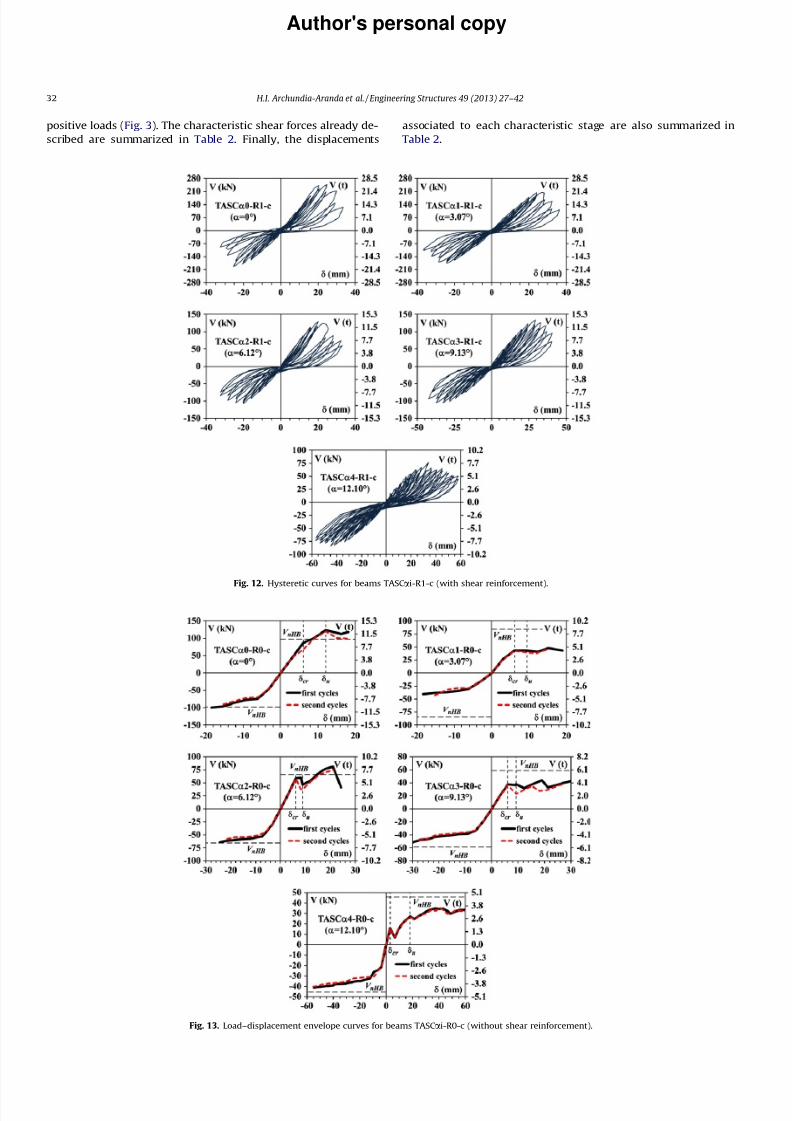
positive loads ( Fig. 3). The characteristic shear forces already de-scribed are summarized in Table 2. Finally, the displacements
associated to each characteristic stage are also summarized inTable 2.
Fig. 12. Hysteretic curves for beams TASCa i-R1-c (with shear reinforcement).
Fig. 13. Load–displacement envelope curves for beams TASC a i-R0-c (without shear reinforcement).
32 H.I. Archundia-Aranda et al. /Engineering Structures 49 (2013) 27–42
8/12/2019 Archundia Tena Grande EngStru 2013
http://slidepdf.com/reader/full/archundia-tena-grande-engstru-2013 8/17
Author's personal copy
4.2. Peak response envelopes
Load–displacement envelopes for peak responses obtained forthe rst and second cycles of deformation (distinguished with dif-ferent lines) are depicted in Fig. 13 for the test specimens without
shear reinforcement and in Fig. 14 for the test specimens withshear reinforcement, where plots are in different scale to improvevisualization. Nominal shear strength ( V nHB) capacities assessed asdescribed in the following section are also depicted.
In these curves it can be conrmed that as the haunched angleincreases: (a) the deformation capacity increases and, (b) the shearstrength is reduced. As it is explained with more detail in next sec-tion, it is evident in Fig. 13 that the expected shear capacity inbeams without shear reinforcement (R0-c beams) was overesti-mated, whereas in Fig. 14 it is observed that the prediction of the
shear capacity was much better for haunched beams with mini-mum shear reinforcement.
It is worth noting in Fig. 13 that beam TASCa 1-R0-c (3 ) pre-sented an anomalous brittle failure at a smaller shear force thanTASCa 2-R0-c (6 ), as in the monotonic tests it was alwaysobserved
that the shear strength was reduced as the haunched angle a in-creased (Table 3). First diagonal cracking occurred in most beamsat a displacement around 6 mm ( Table 2), except for beam TAS-Ca 4-R0-c (12 ), where rst cracking occurred at 3 mm.
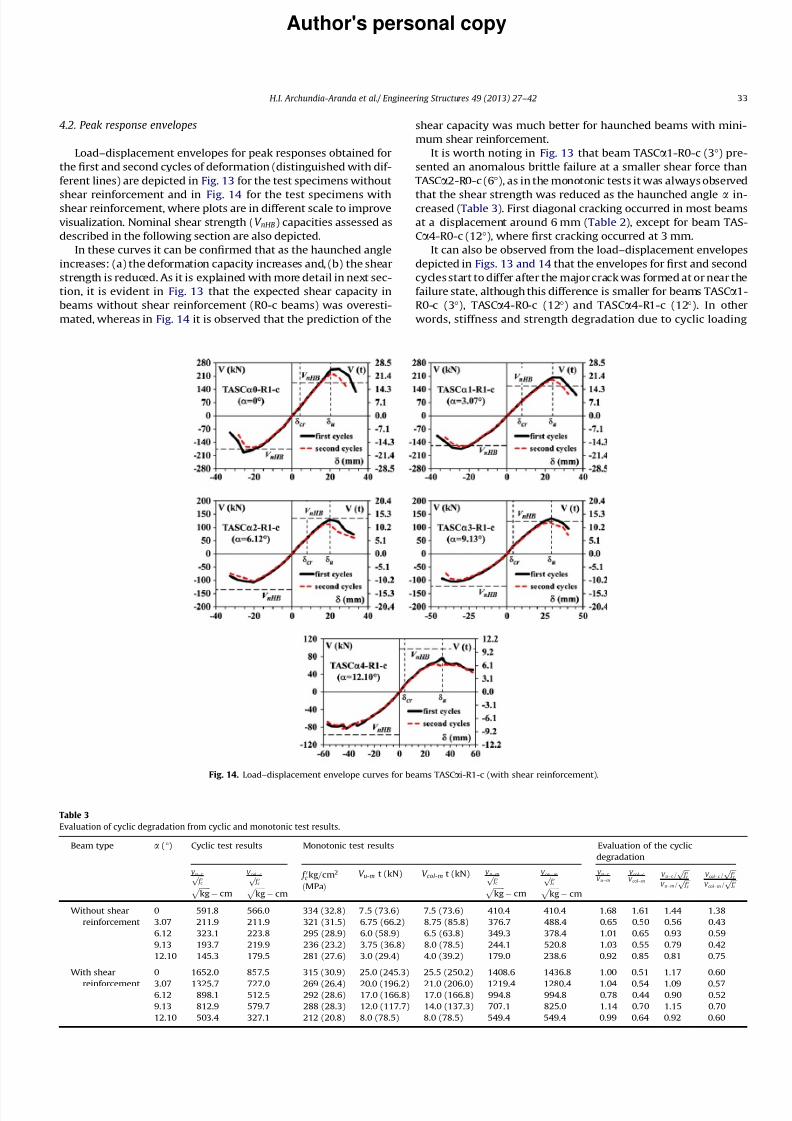
It can also be observed from the load–displacement envelopesdepicted in Figs. 13 and 14 that the envelopes for rst and secondcyclesstart to differ after the majorcrack was formedat ornear thefailure state, although this difference is smaller for beams TASC a 1-R0-c (3 ), TASCa 4-R0-c (12 ) and TASCa 4-R1-c (12 ). In otherwords, stiffness and strength degradation due to cyclic loading
Fig. 14. Load–displacement envelope curves for beams TASC a i-R1-c (with shear reinforcement).
Table 3
Evaluation of cyclic degradation from cyclic and monotonic test results.
Beam type a ( ) Cyclic test results Monotonic test results Evaluation of the cyclicdegradation
V u c
ffiffiffi f 0c p ffiffiffiffiffiffi kgp cm
V col c
ffiffiffi f 0c p ffiffiffiffiffiffi kgp cm
f 0c kg=cm2
ðMPaÞV u-m t (kN) V col-m t (kN) V u m
ffiffiffi f 0c p ffiffiffiffiffiffi kgp cm
V col m
ffiffiffi f 0c p ffiffiffiffiffiffi kgp cm
V u c V u m
V col c V col m
V u c = ffiffiffi f 0c p V u m= ffiffiffi f 0c p
V col c = ffiffiffi f 0c p V col m= ffiffiffi f 0c p
Without shearreinforcement
0 591.8 566.0 334 (32.8) 7.5 (73.6) 7.5 (73.6) 410.4 410.4 1.68 1.61 1.44 1.383.07 211.9 211.9 321 (31.5) 6.75 (66.2) 8.75 (85.8) 376.7 488.4 0.65 0.50 0.56 0.436.12 323.1 223.8 295 (28.9) 6.0 (58.9) 6.5 (63.8) 349.3 378.4 1.01 0.65 0.93 0.599.13 193.7 219.9 236 (23.2) 3.75 (36.8) 8.0 (78.5) 244.1 520.8 1.03 0.55 0.79 0.4212.10 145.3 179.5 281 (27.6) 3.0 (29.4) 4.0 (39.2) 179.0 238.6 0.92 0.85 0.81 0.75
With shearreinforcement
0 1652.0 857.5 315 (30.9) 25.0 (245.3) 25.5 (250.2) 1408.6 1436.8 1.00 0.51 1.17 0.603.07 1325.7 727.0 269 (26.4) 20.0 (196.2) 21.0 (206.0) 1219.4 1280.4 1.04 0.54 1.09 0.576.12 898.1 512.5 292 (28.6) 17.0 (166.8) 17.0 (166.8) 994.8 994.8 0.78 0.44 0.90 0.529.13 812.9 579.7 288 (28.3) 12.0 (117.7) 14.0 (137.3) 707.1 825.0 1.14 0.70 1.15 0.7012.10 503.4 327.1 212 (20.8) 8.0 (78.5) 8.0 (78.5) 549.4 549.4 0.99 0.64 0.92 0.60
H.I. Archundia-Aranda et al./ Engineering Structures 49 (2013) 27–42 33
8/12/2019 Archundia Tena Grande EngStru 2013
http://slidepdf.com/reader/full/archundia-tena-grande-engstru-2013 9/17
Author's personal copy
have a negligible impact almost up to the ultimate load V u, as thecurves for the rst and second cycles are almost identical; how-ever, strength and stiffness degradation become very importantafter V u.
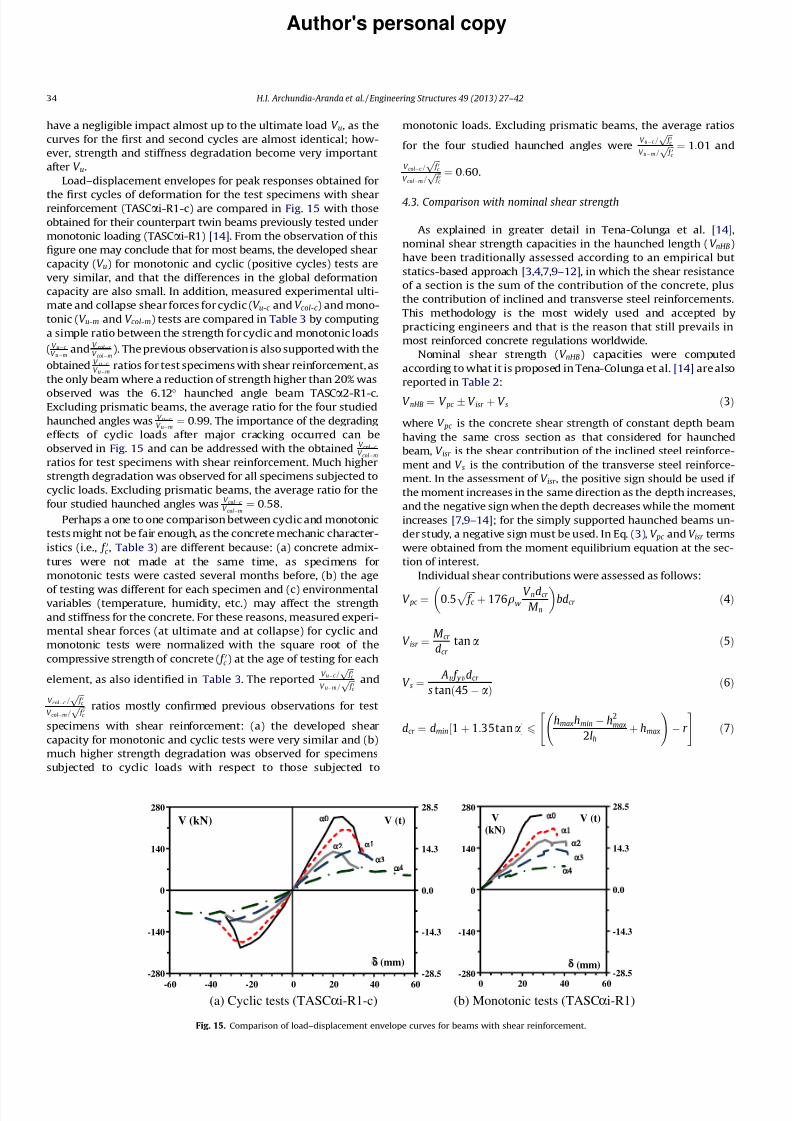
Load–displacement envelopes for peak responses obtained for
the rst cycles of deformation for the test specimens with shearreinforcement (TASCa i-R1-c) are compared in Fig. 15 with thoseobtained for their counterpart twin beams previously tested undermonotonic loading (TASCa i-R1) [14]. From the observation of thisgure one may conclude that for most beams, the developed shearcapacity (V u) for monotonic and cyclic (positive cycles) tests arevery similar, and that the differences in the global deformationcapacity are also small. In addition, measured experimental ulti-mate and collapse shear forces forcyclic ( V u-c and V col-c ) and mono-tonic (V u-m and V col-m) tests are compared in Table 3 by computinga simple ratio between the strength forcyclic and monotonic loads(V u c V u m and V col c
V col m). Theprevious observationis also supportedwith the
obtained V u c V u m
ratios for test specimens with shear reinforcement,asthe only beam where a reduction of strength higher than 20% wasobserved was the 6.12 haunched angle beam TASCa 2-R1-c.Excluding prismatic beams, the average ratio for the four studiedhaunched angles was V u c
V u m ¼0:99. The importance of the degradingeffects of cyclic loads after major cracking occurred can beobserved in Fig. 15 and can be addressed with the obtained V col c
V col mratios for test specimens with shear reinforcement. Much higherstrength degradation was observed for all specimens subjected tocyclic loads. Excluding prismatic beams, the average ratio for thefour studied haunched angles was V col c
V col m ¼0:58.Perhaps a one to one comparisonbetween cyclic and monotonic
testsmight not be fair enough, as the concretemechanic character-istics (i.e., f 0c , Table 3) are different because: (a) concrete admix-tures were not made at the same time, as specimens formonotonic tests were casted several months before, (b) the age
of testing was different for each specimen and (c) environmentalvariables (temperature, humidity, etc.) may affect the strengthand stiffness for the concrete. For these reasons, measured experi-mental shear forces (at ultimate and at collapse) for cyclic andmonotonic tests were normalized with the square root of thecompressive strength of concrete ( f 0c ) at the age of testing for each
element, as also identied in Table 3. The reported V u c = ffiffiffi f 0c p V u m= ffiffiffi f 0c p and
V col c = ffiffiffi f 0c p V col m= ffiffiffi f 0c p ratios mostly conrmed previous observations for testspecimens with shear reinforcement: (a) the developed shearcapacity for monotonic and cyclic tests were very similar and (b)much higher strength degradation was observed for specimenssubjected to cyclic loads with respect to those subjected to
monotonic loads. Excluding prismatic beams, the average ratiosfor the four studied haunched angles were V u c = ffiffiffi f 0c p
V u m= ffiffiffi f 0c p ¼1:01 andV col c = ffiffiffi f 0c p V col m= ffiffiffi f 0c p ¼ 0:60.
4.3. Comparison with nominal shear strength
As explained in greater detail in Tena-Colunga et al. [14],nominal shear strength capacities in the haunched length ( V nHB)have been traditionally assessed according to an empirical butstatics-based approach [3,4,7,9–12], in which the shear resistanceof a section is the sum of the contribution of the concrete, plusthe contribution of inclined and transverse steel reinforcements.This methodology is the most widely used and accepted bypracticing engineers and that is the reason that still prevails inmost reinforced concrete regulations worldwide.
Nominal shear strength ( V nHB) capacities were computedaccording to what it is proposed in Tena-Colunga et al. [14] arealsoreported in Table 2:V nHB ¼ V pc V isr þ V s ð3 Þ
where V pc is the concrete shear strength of constant depth beamhaving the same cross section as that considered for haunchedbeam, V isr is the shear contribution of the inclined steel reinforce-ment and V s is the contribution of the transverse steel reinforce-ment. In the assessment of V isr , the positive sign should be used if the moment increases in the same direction as the depth increases,and the negative sign when the depth decreases while the momentincreases [7,9–14]; for the simply supported haunched beams un-der study, a negative sign must be used. In Eq. (3), V pc and V isr termswere obtained from the moment equilibrium equation at the sec-tion of interest.
Individual shear contributions were assessed as follows:
V pc ¼ 0 :5 ffiffiffiffi f c p þ 176 q wV ndcr
M nbdcr ð4 Þ
V isr ¼M cr
dcr tan a ð5 Þ
V s ¼ Av f yv dcr
s tan ð45 a Þ ð6 Þ
dcr ¼ dmin ½1 þ 1 :35tan a 6hmax hmin h2
max2 lh
þ hmax !r " # ð7 Þ
-28.5
-14.3
0.0
14.3
28.5
-280
-140
0
140
280
-60 -40 -20 0 20 40 60
V (t)V (kN)
δ (mm)
0
12
4 3
-28.5
-14.3
0.0
14.3
28.5
-280
-140
0
140
280
0 20 40 60
V (t)V(kN)
(mm)
0
1
2
3
4
(a) Cyclic tests (TASC α i-R1-c) (b) Monotonic tests (TASC α i-R1)
Fig. 15. Comparison of load–displacement envelope curves for beams with shear reinforcement.
34 H.I. Archundia-Aranda et al. /Engineering Structures 49 (2013) 27–42

8/12/2019 Archundia Tena Grande EngStru 2013
http://slidepdf.com/reader/full/archundia-tena-grande-engstru-2013 10/17
Author's personal copy
where V n and M n are the nominal shear force and bending momentat the critical haunched section (absolute values), qw is the ratio of longitudinal reinforcement, b is the width of the beam, dcr is the
effective equivalent depth at the critical haunched section, M cr isthe developed bending moment at the critical section (taking intoaccount premature bond-slip failures of the inclined reinforcement
Fig. 16. Final damage patterns for beams TASCa i-R0-c (without shear reinforcement).
Fig. 17. Cracking patterns in beam TASCa 0-R1-c at dened damage states.
H.I. Archundia-Aranda et al./ Engineering Structures 49 (2013) 27–42 35

8/12/2019 Archundia Tena Grande EngStru 2013
http://slidepdf.com/reader/full/archundia-tena-grande-engstru-2013 11/17
Author's personal copy
in over-reinforced beams), a is the angle of slope of haunch fromhorizontal, hmax and hmin are the maximum and minimum depthof the haunched beam respectively, Lh is the haunched length, r isthe concrete cover for the longitudinal reinforcement, Av is the areaof the transverse shear reinforcement, f yv is the yield stress of the
shear reinforcement and s is the separation of the transverse shearreinforcement.It is worth noting that for consistency with prismatic sections,
V pc (Eq. (4)) was derived in terms of the equation proposed bythe ACI 318 code [2], whereas V isr (Eq. (5)) is the contribution of the inclined steel reinforcement as already proposed in the litera-ture [7,9–14]. The contribution of the transverse steel reinforce-ment V s (Eq. (6)) was derived considering the angle of inclinationof the principal shear crack with respect to an horizontal axis ( h),which was proposed as h = 45-a based upon experimental evi-dence, practical considerationsand for consistency with the designalready established for prismatic sections [14]. The rst term of dcr (Eq. (7)) was obtained from a linear regression of experimentaldata [14], whereas the limiting value provided in the second term
of Eq. (7) was derived analytically to insure that dcr would keep aphysical meaning, avoiding that it could be numerically greaterthan the maximum effective depth [14].
Based upon previous experimental data [14], for simply sup-ported beams without shear reinforcement, the assessment of the developed moment at the critical section ( M cr ) could be doneas follows:
M cr ¼ 0 :15 M nð1 2 :5 tan a Þ ð8 Þ
and for simply supported beams with shear reinforcement:
M cr ¼ 0 :5 M nð1 1 :6 tan a Þ ð9 Þ
Then, shear capacities V nHB were computed considering the mea-sured properties for the concrete and steel reinforcement. The mea-sured compressive strength for the concrete ( f 0c ) is reported in Table2. The measured yield stresses were f y = 426.5 MPa ( f y = 4348kg/cm2) for the longitudinal reinforcement and f y =450.5 MPa ( f y =4592 kg/cm 2) for the shear reinforcement ( Table 1).
From the reported values in Table 2 it is evident that theexpected shear capacity in beams without shear reinforcement(R0-c beams) was overestimated. This can be explained by the factthat the absence of stirrups favored a more pronounced concrete
degradation that was increased by load reversals [21]. As observedin monotonic testing [14] for the haunched beams with shear rein-forcement, the shear capacity prediction was good principally in
Fig. 18. Cracking patterns in beam TASCa 1-R1-c at dened damage states.
36 H.I. Archundia-Aranda et al. /Engineering Structures 49 (2013) 27–42
8/12/2019 Archundia Tena Grande EngStru 2013
http://slidepdf.com/reader/full/archundia-tena-grande-engstru-2013 12/17
Author's personal copy
haunched beams up to haunched angles of nine degrees for thebeams with minimum shear reinforcement. The average ratio forall ve beams with transverse shear reinforcement was V nHB/V u = 0.94 with and standard deviation of 0.218. However, if onlythe four haunched beams are considered, the average ratio in-
creases to V nHB/V u = 0.995 and the standard deviation decreasesto 0.208. Beam TASCa 2-R1-c (a = 6.12 ) was tested at early age(32 days old) in comparison with the rest of the beams (200–250 days old, because the testing lab in the university was closedas it was going to be upgraded). In addition, this element had thelowest concrete strength ( Table2). Thesefacts favored anexcessiveexural cracking along the element which could explain the devel-oped strength.
4.4. Deformation capacity
It can be observed from the load–displacement envelopes forpeak responses depicted in Figs. 13 and 14 and the data provided
in Table 2 that curves for beams with (R1-c) and without (R0-c)shear reinforcement are similar until V cr , but after the rst crack-ing, the strength anddeformation of R0-c andR1-c specimens startto differ because of the contribution of the steel shear reinforce-ment. It is alsoevident from Fig. 13that RCHBhave somedeforma-tioncapacity evenwithout shear reinforcement, situation differentfrom prismatic beams, where once the diagonal cracking occurred,prismatic beams lose allcapacity to sustain the load through defor-mation. This increment is primarily related to the capacity of RCHB
to redistribute cracking along the haunched length, as discussed inmore detail in the following section.
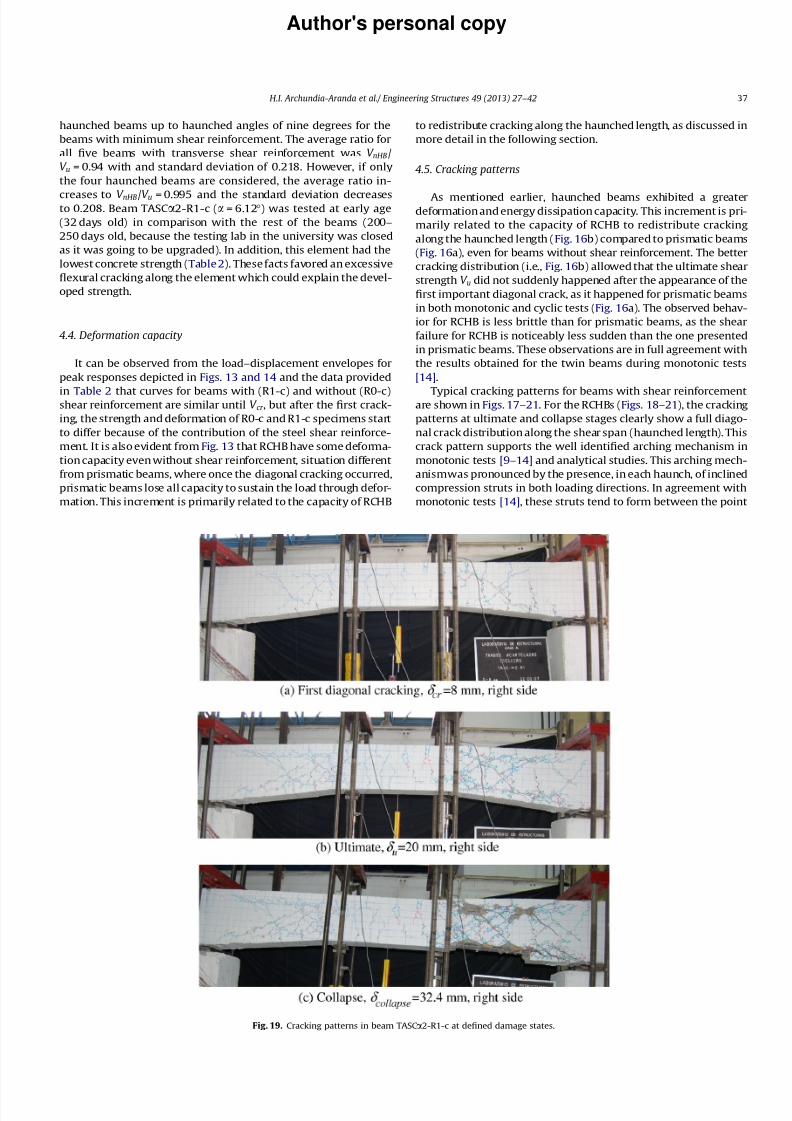
4.5. Cracking patterns
As mentioned earlier, haunched beams exhibited a greaterdeformationandenergy dissipationcapacity. This increment is pri-marily related to the capacity of RCHB to redistribute crackingalong the haunched length ( Fig. 16b) comparedto prismatic beams(Fig. 16a), even for beams without shear reinforcement. The bettercracking distribution (i.e., Fig. 16b) allowedthat the ultimate shearstrength V u did not suddenly happened after the appearance of therst important diagonal crack, as it happened for prismatic beamsin both monotonic and cyclic tests ( Fig. 16a). The observed behav-ior for RCHB is less brittle than for prismatic beams, as the shearfailure for RCHB is noticeably less sudden than the one presentedin prismatic beams. These observations are in full agreement withthe results obtained for the twin beams during monotonic tests[14].
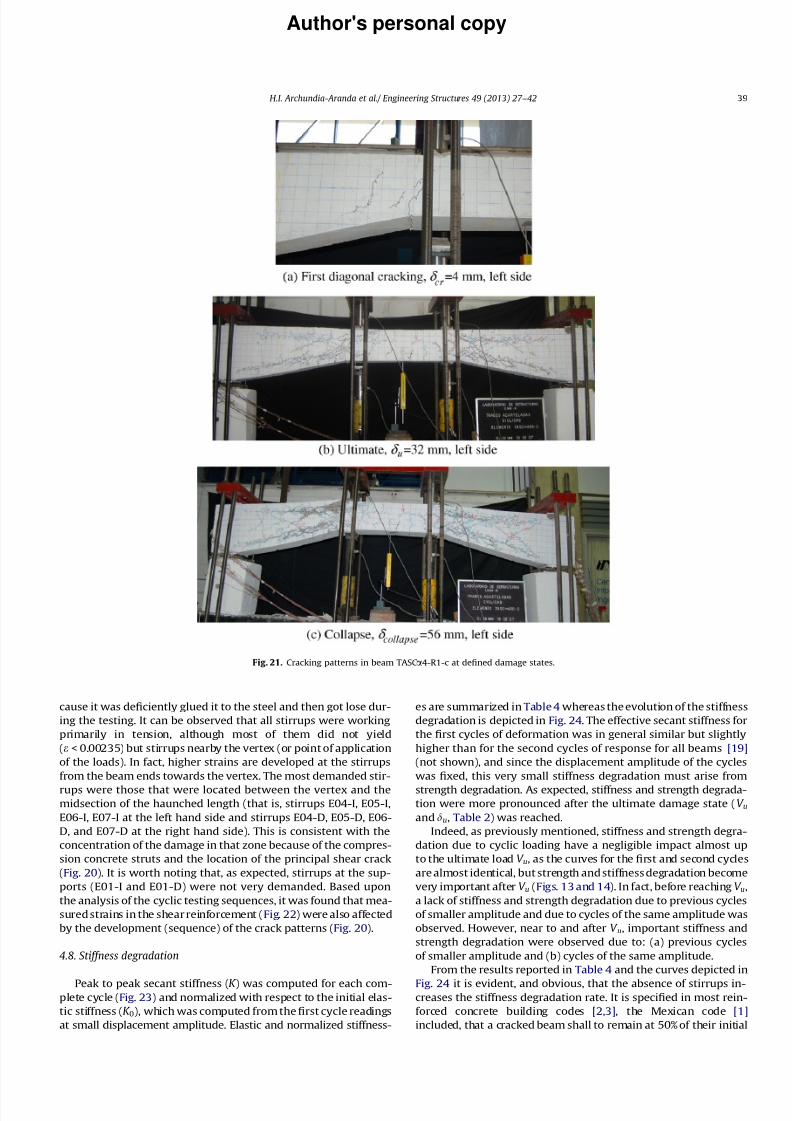
Typical cracking patterns for beams with shear reinforcementare shown in Figs. 17–21. For the RCHBs (Figs. 18–21), the crackingpatterns at ultimate and collapse stages clearly show a full diago-nal crackdistributionalong the shear span (haunched length). Thiscrack pattern supports the well identied arching mechanism inmonotonic tests [9–14] and analytical studies. This arching mech-anismwas pronouncedby the presence, ineach haunch, of inclinedcompression struts in both loading directions. In agreement withmonotonic tests [14], these struts tend to form between the point
Fig. 19. Cracking patterns in beam TASCa 2-R1-c at dened damage states.
H.I. Archundia-Aranda et al./ Engineering Structures 49 (2013) 27–42 37

8/12/2019 Archundia Tena Grande EngStru 2013
http://slidepdf.com/reader/full/archundia-tena-grande-engstru-2013 13/17
Author's personal copy
of application of the load and the midpoint of the haunched length.As expected, deformation demands were higher in the struts of RCHB with shear reinforcement, where the force developed bythe strut considerably deformed the initial geometry of the beam(Figs. 18c, 19c, 20c and 21c). Therefore, it can be concluded thatthe greatest deformation capacity observed in RCHBs in compari-son with the prismatic elements is associated to the ability of RCHBs to redistribute cracks. As a general rule, increasing thehaunched angle increases the allowed damage ( Figs. 17–21) andincreases the pinching ( Fig. 12) due to the sliding along the cracks.Moreover, the characteristic brittle and sudden shear failure of prismatic elements ( Fig. 17) is reduced inRCHBs due to this behav-ior (Figs. 18–21).
As summary, the cracking patterns identied in the testedRCHBs under cyclic loading conrmed the arch mechanism previ-ously reported for RCHBs with shear reinforcement [10,14] andwithout shear reinforcement [13,14]. This arch mechanism waspronounced by the presence, in each haunch, of inclined compres-sion struts. The struts tend to form between the point of applica-tion of the load and the midpoint of the haunched length. Asexpected, deformation demands were higher in the struts of RCHBswith shear reinforcement, where the force developed by the strutconsiderably deformed the initial geometry of the beam. For allRCHBs, the shear cracking was distributed, and more than oneimportant diagonal crack always appeared with or without shearreinforcement.
Finally, it was conrmed that as observed in monotonic tests[14], there is a trend where the angle of inclination of the principalshear crack with respect to a horizontal axis ( h+, Table 2) seem todecrease as the haunch angle a increases.
4.6. Longitudinal reinforcement
In agreement with previous monotonic tests [14], readings of the strain gages in the inclined longitudinal steel reinforcement
in tension showed that the deformations associated to the failureof the specimens without shear reinforcement were much smallerthan the yield strain of the steel reinforcement obtained fromcoupon tests (about 12%). These values were obtained usuallybetween V u and V collapse (Table 2) and a displacement around12–13 mm, before readings were lost when the opening of a majorcrack damaged the strain gage. The longitudinal steel reinforce-ment at the top had similar readings than the ones obtained forthe inclined reinforcement; however, as they were not damagedbecause of the presence of a major crack, they kept giving readingsup to displacements near dcollapse. For example, for beam TASCa 4-R0-c, at d = 55.6mm, the peak strain reading was about 56% theyield strain of the steel reinforcement.
The applied shear force ( V ) was then related to the measuredstrain of the top and bottom longitudinal steel reinforcement forall specimens as described in detail in Grande-Vega [22]. As ex-pected, higher strains developed at the steel reinforcement frombeam ends towards the points of application of the concentratedloads, as the bending moment increases in this direction. Yieldingof the steel reinforcement ( e P 0.00213) was measured at straingages located at the vertex and at the tapered section nearby thevertex and at midspan. It was also evident that the developmentof crack patterns affected the readings of the strain gages, as onecan relate the developed crack patterns ( Fig. 20) with the curvesobtained from the measured strains (not shown, Grande Vega[22]).
4.7. Shear reinforcement
The contribution of the shear reinforcement of R1-c specimenswas quantied with the measured deformations in the stirrups asreported in detail elsewhere [22]. For illustrationpurposes, the ap-plied shear force ( V ) versus measured strains in the stirrups curvesfor the haunched element TASC a 3-R1-c is depicted in Fig. 22. It isworth noting that stirrup E03-I had wrong readings, perhaps be-
Fig. 20. Cracking patterns in beam TASCa 3-R1-c at dened damage states.
38 H.I. Archundia-Aranda et al. /Engineering Structures 49 (2013) 27–42
8/12/2019 Archundia Tena Grande EngStru 2013
http://slidepdf.com/reader/full/archundia-tena-grande-engstru-2013 14/17
Author's personal copy
cause it was deciently glued it to the steel and then got lose dur-ing the testing. It can be observed that all stirrups were workingprimarily in tension, although most of them did not yield(e < 0.00235) but stirrups nearby the vertex (or pointof applicationof the loads). In fact, higher strains are developed at the stirrupsfrom the beam ends towards the vertex. The most demanded stir-rups were those that were located between the vertex and themidsection of the haunched length (that is, stirrups E04-I, E05-I,E06-I, E07-I at the left hand side and stirrups E04-D, E05-D, E06-D, and E07-D at the right hand side). This is consistent with theconcentration of the damage in that zone because of the compres-sion concrete struts and the location of the principal shear crack(Fig. 20). It is worth noting that, as expected, stirrups at the sup-ports (E01-I and E01-D) were not very demanded. Based uponthe analysis of the cyclic testing sequences, it was found that mea-suredstrains in the shearreinforcement ( Fig. 22) werealso affectedby the development (sequence) of the crack patterns ( Fig. 20).
4.8. Stiffness degradation
Peak to peak secant stiffness ( K ) was computed for each com-plete cycle ( Fig. 23) and normalized with respect to the initial elas-tic stiffness ( K 0), which was computed fromtherst cycle readingsat small displacement amplitude. Elastic and normalized stiffness-
es are summarized in Table4 whereas theevolution of the stiffnessdegradation is depicted in Fig. 24. The effective secant stiffness forthe rst cycles of deformation was in general similar but slightlyhigher than for the second cycles of response for all beams [19](not shown), and since the displacement amplitude of the cycleswas xed, this very small stiffness degradation must arise fromstrength degradation. As expected, stiffness and strength degrada-tion were more pronounced after the ultimate damage state ( V uand du, Table 2) was reached.
Indeed, as previously mentioned, stiffness and strength degra-dation due to cyclic loading have a negligible impact almost upto the ultimate load V u, as the curves for the rst and second cyclesarealmost identical, butstrength andstiffnessdegradation becomevery important after V u (Figs. 13and 14). In fact, before reaching V u,a lack of stiffness and strength degradation due to previous cyclesof smaller amplitude and due to cycles of the same amplitude wasobserved. However, near to and after V u, important stiffness andstrength degradation were observed due to: (a) previous cyclesof smaller amplitude and (b) cycles of the same amplitude.
From the results reported in Table 4 and the curves depicted inFig. 24 it is evident, and obvious, that the absence of stirrups in-creases the stiffness degradation rate. It is specied in most rein-forced concrete building codes [2,3], the Mexican code [1]included, that a cracked beam shall to remain at 50%of their initial
Fig. 21. Cracking patterns in beam TASCa 4-R1-c at dened damage states.
H.I. Archundia-Aranda et al./ Engineering Structures 49 (2013) 27–42 39

8/12/2019 Archundia Tena Grande EngStru 2013
http://slidepdf.com/reader/full/archundia-tena-grande-engstru-2013 15/17
Author's personal copy
stiffness properties at the moment to develop their exural capac-ity. As canbe observed from Table4, RCHBs wouldbe able to fulllthis requirement, because even under a brittle failure (shearfailure) the beams kept 60% of their original stiffness at the ulti-mate stage.
4.9. Energy dissipation
Even though the haunch diminishes the concrete volume re-spect to a prismatic element, the experimental evidence shownthat RCHBs dissipate, at least, energy equal to the prismatic ele-ments ( Table 5). To further highlight this fact, the accumulated en-ergy density U o [23] was assessed, this is, the accumulated
E - 0
8 -
I
E - 0
7 -
I
E - 0
6 -
I
E - 0
5 -
I
E - 0
4 -
I
E - 0
3 -
I
E - 0
2 -
I
E - 0
1 -
I
E - 0
1 -
D
E - 0
2 -
D
E - 0
3 -
D
E - 0
4 -
D
E - 0
5 -
D
E - 0
6 -
D
E - 0
7 -
D
E - 0
8 -
D
Fig. 22. Measured strain versus shear curves for the strain gages of the transverse reinforcement of haunched beam TASC a 3-R1-c.
Fig. 23. Peak-to-peak secant stiffness K.
Table 4
Peak to peak stiffness.
Beam ID K o (ton/mm) K cr /K o K u/K o K collapse/K o Beam ID K o (ton/mm) K cr /K o K u/K o K collapse/K oTASCa 0-R0-c 1.46 0.92 0.60 0.42 TASCa 0-R1-c 1.22 1.0 0.86 0.27TASCa 1-R0-c 0.72 0.85 0.61 0.31 TASCa 1-R1-c 1.01 0.97 0.77 0.29TASCa 2-R0-c 0.95 0.98 0.58 0.20 TASCa 2-R1-c 0.73 0.90 0.75 0.31TASCa 3-R0-c 0.64 0.92 0.55 0.25 TASCa 3-R1-c 0.63 1.0 0.66 0.37TASCa 4-R0-c 0.57 0.98 0.28 0.06 TASCa 4-R1-c 0.35 1.0 0.67 0.32
40 H.I. Archundia-Aranda et al. /Engineering Structures 49 (2013) 27–42

8/12/2019 Archundia Tena Grande EngStru 2013
http://slidepdf.com/reader/full/archundia-tena-grande-engstru-2013 16/17
Author's personal copy
hysteretic energy at failure ( EH ) was normalized with respect to thehalf-volume of each beam ( V beam/2), to point out the haunched ef-fect (geometric effect). Therefore, U o was calculated as:
U 0 ffiR ncycles
0 @ E H
V beam2
ð10 Þ
The resulting accumulated energy densities are depicted in Fig. 25. Itcan be conrmed that the accumulated energy density tend to in-crease as thehaunch angle a increases, as a direct consequence thatthe number of cycles also tend to increase as the haunch angle a
increases.
5. Concluding remarks
This paper presented the results and interpretations about thetesting of prototype reinforced concrete haunched beams (RCHBs)with and without shear reinforcement designed to develop a shearfailure under cyclic loading. The haunched length at both beam
ends of the considered RCHB was one-third the effective span of the beam, whereas the haunched angle ( a ) varied from 3 to 12 .
It was conrmed from cyclic tests what it was observed inmonotonic tests [14]: RCHB develop an arch mechanism whichallows the damage to be distributed in terms of several ssuresalong the haunched length before the main diagonal cracksdevelops, then causing smoother cracking patterns and a failuremechanismthat is less fragile than the typical sudden shear failureobserved in prismatic beams. The presence of a haunch modiesimportant structural properties such as ultimate strength anddeformation capacity, stiffness and energy dissipation. RCHB haveindeed more deformation capacity in shear than prismatic beamsand dissipate more energy or at least energy equal to those dissi-pated by prismatic beams. On the other hand, the stiffness andstrength of RCHB is smaller with respect to those of prismaticbeams of the same depth.
From strain gages measurements it was conrmed that for sim-ply-supported haunched beams, the presence of stirrups contrib-utes indirectly to develop a higher negative vertical force by theinclined longitudinal steel reinforcement, then, lessen in some ex-
Fig. 24. Peak to peak stiffness (computed from the rst cycles at a given displacement amplitude): (a) beams without shear reinforcement and (b) beams with shearreinforcement.
Table 5
Accumulated hysteretic energy.
Beam ID Half volume (m3) Cracking Ultimate Collapse
EH t-mm (kN-mm) Cycle number EH t-mm (kN-mm) Cycle number EH t-mm (kN-mm) Cycle number
TASCa 0-R0-c 0.144 26.53 (260.3) 3 144.55 (1418.0) 7 455.59 (4469.3) 11.5TASCa 1-R0-ca 0.133 8.99 (88.2) 3 36.78 (360.8) 5 189.15 (1855.6) 11TASCa 2-R0-c 0.123 8.66 (85.0) 3 55.37 (543.2) 5 413.88 (4060.2) 15TASCa 3-R0-c 0.113 4.94 (48.5) 3 30.69 (301.1) 5 564.20 (5534.8) 20TASCa 4-R0-c 0.102 0.39 (3.8) 1 116.21 (1140.0) 11 2291.85 (22483.0) 36.5TASCa 0-R1-c 0.144 7.88 (77.3) 1 338.87 (3324.3) 9 1345.47 (13199.1) 15TASCa 1-R1-c 0.133 33.74 (331.0) 3 499.63 (4901.4) 11 1612.12 (15814.9) 17TASCa 2-R1-ca 0.123 20.64 (202.5) 3 198.94 (1951.6) 9 904.19 (8870.1) 16TASCa 3-R1-c 0.113 4.53 (44.4) 1 491.53 (4821.9) 13 1418.89 (13919.3) 20TASCa 4-R1-c 0.102 2.34 (23.0) 1 425.13 (4170.5) 15 1739.62 (17062.7) 28
a These elements had a premature failure.
Fig. 25. Accumulated energy density: (a) beams without shear reinforcement and (b) beams with shear reinforcement.
H.I. Archundia-Aranda et al./ Engineering Structures 49 (2013) 27–42 41

8/12/2019 Archundia Tena Grande EngStru 2013
http://slidepdf.com/reader/full/archundia-tena-grande-engstru-2013 17/17
Author's personal copy
tent the positive effect of the same stirrups to resist higher shearforces.
It was also found from cyclic tests that stiffness and strengthdegradation have a negligible impact almost up to the ultimateload V u, but they become very important after V u. In fact, before
reaching V u, a lack of stiffnessand strength degradationdue to pre-vious cyclesof smaller amplitudeand cyclesof the same amplitudewas observed. However, near to and after V u, important stiffnessandstrength degradation were observed dueto: (a)previous cyclesof smaller amplitude and (b) cycles of the same amplitude.
The results obtained from the cyclic testing also conrmed theusefulnessof an empirical equation previously proposed [14] toas-sess the shear strength of reinforced concrete haunched beams,taking into account parameters such as the haunch angle, the con-crete compressive strength, the shear reinforcement and the con-tribution of the inclined longitudinal reinforcement. Therefore,until more evidence would be available, it is advisable to estimatethe shear strength of simply supported RCHBs with that equationfor haunched beams with a haunch angle a up to nine degrees.
This study constitutes a step forward towards the understand-ing of the behavior of RCHBunder shear whichmay allowdevelop-ing, in the near future, coherent guidelines to prevent brittle shearfailures. However, additional analytical and experimental researchis still needed to try to achieve this goal, mainly: (a) developmentof truss (strut-and-tie) andcompression eldanalytical models, (b)additional testing must be conducted in RCHB where the maxi-mum shear force and bending moment occurs at the same section(continuity condition) for cyclic loading, as this condition is closerto the one that RCHB in framed buildings must face under lateralloading.
Steps are currently being taken in this direction, as they are in-deed needed before starting experimental programs devoted to in-sure the ductile behavior of RCHB designed to develop exuralfailure under cyclic loading.
Acknowledgments
Financial support of Conacyt, Secretaría General de Obras delGobierno del Distrito Federal and Universidad Autónoma Metro-politana are gratefully acknowledged. The construction of testspecimens was possible because of the enthusiastic collaborationof several students: José RamónÁguila, José Manuel Alonso, MisaelBahena, Marco Antonio Castillo, César Carpio, Arturo de la Cruz,Eleuterio Flores, Antonio Gascón, Eder Gudiño, Efraín Joaquín Die-go, Alejandro Herrera, Gerardo Ibarra, María Fernanda Juan, SergioLópez, Daniel Miranda, Miguel Ángel Mendoza, Elías Josué Morán,Roberto Moreno, Pablo Pineda, Carlos Ramírez, Rosaura Ramírez,
Marco Antonio Rico, Martín Santos, Alejandra Salcedo, SalvadorVargas and Francisco Javier Vidal. MSc. Artemio Juárez-AngelesVíctor H. Salinas-Vallejo and technicians Leopoldo Quiroz, JuanMateos, José Luis Caballero and Rubén Barreda assisted us in theprototype testing.
References
[1] NTCC-2004. Normas Técnicas Complementarias para Diseño y Construcción deEstructuras de Concreto’’ Gaceta Ocial del Distrito Federal. México, October;2004 [in Spanish].
[2] ACI-318-11. Building code requirements for structural concrete (ACI-318-11)and commentary (ACI 318R-11). American Concrete Institute, FarmingtonHills, Michigan, USA; 2011.
[3] DIN 1045-1. Concrete, reinforcement and prestressed concrete structures, part1: design. Deutsches Institut für Normung e.V.; 2001.
[4] Park R, Paulay T. Estructuras de concreto reforzado, ninth printing of the rstedition. Limusa, México; 1997. p. 279–84, 691–2 [in Spanish].
[5] MacGregor JG. Reinforced concrete: mechanics and design. 3rded. USA: Prentice Hall; 1997.
[6] Muttoni A, Shwartz J, Thürlimann B. Design of concrete structures with stresselds. Germany: Birkhäuser; 1997.
[7] Nilson AH. Diseño de estructuras de concreto. 12th ed. Santafé de Bogotá,
Colombia: Mc Graw Hill; 1999. p. 132–3 (in Spanish).[8] Nilsen MP. Limit analysis and concrete plasticity. 2nd ed. Boca Raton,Florida: CRC Press; 1999. p. 435.
[9] Mörsch E. Teoría y práctica del hormigón armado. Tomo II, rst edition Gili,Argentina; 1952 [translated to Spanish from German].
[10] Debaiky SY, El-Niema EI. Behavior and strength of reinforced concretehaunched beams in shear. ACI J 1982;79(3):184–94.
[11] Stefanou GD. Shear resistance for reinforced concrete beams with non-prismatic sections. Eng Fract Mech 1983;18(3):643–67.
[12] El-Niema EI. Investigation of concrete haunched beams under shear. ASCEStruct J 1988;114(4):917–30.
[13] MacLeod IA, Houmsi A. Shear strength of haunched beams without shearreinforcement. ACI Struct J 1994;91(1):79–89.
[14] Tena-Colunga A, Archundia-Aranda HI, González-Cuevas OM. Behavior of reinforced concrete haunched beams subjected to static shear loading. EngStruct 2008;30(2):478–92. http://dx.doi.org/10.1016/j.engstruct.2007.04.017.
[15] Marti P. Basic tools of reinforced concrete beam design. ACI J1985;82(1):46–56.
[16] Dilger WH, Langorh P. Shear design of haunched concrete box girders of theConfederation Bridge. Can J Civil Eng 1997;24(6):898–907.
[17] Muttoni A. Exercice 6: Dimensionnement d’une poutre à hauteur variable.Structures en béton I, Ecole Polytechnique Fédérale de Lausanne, ENAC, IS-BETON, Switzerland; 2008 [in French].
[18] El-Mezaini N, Balkaya C, Çitipitioglu E. Analysis of frames with nonprismaticmembers. ASCE J Struct Eng 1991;117(6):1573–92.
[19] Hwang T, Scribner CF. R/C members cyclic response during various loadings.ASCE J Struct Eng 1984;110(3):477–89.
[20] Brown RH, Jirsa JO. Reinforced concrete beams under load reversals. ACI J1971;68(5):380–90.
[21] Gosain NK, Brown RH, Jirsa JO. Shear requirements for load reversals on RCmembers. ASCE J Struct Eng 1977;103(7):1461–76.
[22] Grande-Vega A. Mecanismos de resistencia y deformación a cortante de trabesacarteladas de concreto reforzado sujetas a cargas cíclicas. MSc. Thesis,Posgrado en Ingeniería Estructural, División de Ciencias Básicas e Ingeniería.Universidad Autónoma Metropolitana Azcapotzalco, July 2009 [in Spanish].
[23] Popov EP. Engineering mechanics of solids. 2nd ed. USA: Prentice Hall; 1999.
42 H.I. Archundia-Aranda et al. /Engineering Structures 49 (2013) 27–42