arcgis - biu · streetmap, the esri press logo, and gis by esri, and are trademarks, registered...
TRANSCRIPT

ArcGIS®
9
G08807_U-AGIS-3DA_tp_94692.ind 3/11/04, 10:24 AM1

Copyright © 2005 ESRI.All rights reserved.Printed in the United States of America.The information contained in this document is the exclusive property of ESRI. This work is protected under United States copyright law and otherinternational copyright treaties and conventions. No part of this work may be reproduced or transmitted in any form or by any means, electronic ormechanical, including photocopying and recording, or by any information storage or retrieval system, except as expressly permitted in writing by ESRI.All requests should be sent to Attention: Contracts Manager, ESRI, 380 New York Street, Redlands, CA 92373-8100, USA.
The information contained in this document is subject to change without notice.
CONTRIBUTING WRITERSTarun Chandrasekhar
U.S. GOVERNMENT RESTRICTED/LIMITED RIGHTSAny software, documentation, and/or data delivered hereunder is subject to the terms of the License Agreement. In no event shall the U.S. Government acquire greater than RESTRICTED/LIMITED RIGHTS. At a minimum, use, duplication, or disclosure by the U.S. Government is subject to restrictions as set forth in FAR §52.227-14 Alternates I, II, and III (JUN 1987); FAR §52.227-19 (JUN 1987) and/or FAR §12.211/12.212 (Commercial Technical Data/Computer Software); and DFARS §252.227-7015 (NOV 1995) (Technical Data) and/or DFARS §227.7202 (Computer Software), as applicable. Contractor/Manufacturer is ESRI, 380 New York Street, Redlands, CA 92373-8100, USA.
ESRI, ArcView, SDE, and the ESRI globe logo, ArcInfo, ArcSDE, ArcCatalog, ArcMap, ArcToolbox, ArcStorm, ArcEditor, ArcGIS, ArcObjects, StreetMap, the ESRI Press logo, and GIS by ESRI, and www.esri.com are trademarks, registered trademarks, or service marks of ESRI in the United States, the European Community, or certain other jurisdictions.
The names of other companies and products herein are trademarks or registered trademarks of their respective trademark owners.

iii
Contents
Exercise 1: Creating a Shapefile based Network Dataset 1
Exercise 2: Creating a geodatabase network dataset 5
Exercise 3: Creating a multimodal network dataset 9
Exercise 4: Finding the best route using a network dataset 15
Exercise 5: Finding the closest fire stations 19
Exercise 6: Calculating service area and creating a OD Cost Matrix 23
Exercise 7: Creating a Model for Route Analysis 31

15
Exercise 4: Finding the best route using a network dataset
In this Exercise you will find the best route for the given order of stops based on travel time.
Preparing your display
1. If you have Exercise4.mxd open in ArcMap, skip steps 2 to 5.2. Start ArcMap by either double-clicking a shortcut installed on your
desktop or using the programs list in your Start menu.3. Click File on the Main menu and click Open.4. In the Open dialog box, navigate to C:\arcgis\ArcTutor\Network_
Analyst\Exercise4\Exercise4.mxd. (This is the default install location for this data.)
5. Double-click Exercise4.mxd.6. If the Network Analyst Extension is not enabled, on the Tools
menu, click Extensions and in the Extensions dialog, click Network Analyst.
7. If the Network Analyst toolbar is not already present, on the Main menu, click View, point to Toolbars, and click Network Analyst.
8. If the Network Analyst Window is not already open, click the Network Analyst Window button
on the Network Analyst toolbar. This is a dockable window which you can dock
within the ArcMap window or leave undocked. In this Exercise the window is docked below the Table of Contents.
Creating the Route analysis layer
1. On the Network Analyst toolbar, click the Network Analyst dropdown menu and click New Route.
The Network Analyst Window now contains
empty lists of Stops, Routes and Barriers categories.
Additionally, the table of contents contains a new Route analysis layer.
Adding a stop
Next, you will add the stops between which you will be creating the best route.1. Click Stops(0) on the Network Analyst Window.2. On the Network Analyst Toolbar, click the Create Network Location
tool .3. Click anywhere on the street network in the map to define a new stop
location. The program then calculates the nearest network location and
symbolizes the stop with the located symbol. The stop will remain selected until another stop is placed or until it is unselected.
The located stop also displays the number 1. The number
represents the order in which the stops will be visited by the calculated route.
You will also notice that the Stops category on the Network Analyst Window now lists 1 stop.
4. Add two more stops on the map. The stops are numbered 2 and 3. The order of stops can be changed on the Network Analyst Window. The first stop is treated as the origin and the last, as the destination.

16
If a stop is not located on the network, it will appear with an unlocated symbol.
An unlocated stop can be located on the network by moving it, closer to any edge that belongs to the network. On the Network Analyst Toolbar, click Select/Move Network Location tool .Using the Select/Move Network Location tool , click and drag the unlocated stop closer to an edge on the network.
Setting up the parameters for the analysis
Next, you will specify that your route will be calculated based on time (minutes), that U-turns are allowed everywhere, and that one-way restrictions must be followed.1. Click the Analysis Layer Properties button next to Route layer on the
Network Analyst Window to bring up the Layer Properties dialog for Route.
2. In the Layer Properties dialog, click the Analysis Settings tab. Make sure the impedance selected is Minutes (Minutes).
3. Do not use time windows. (Leave the box unchecked). Time windows are used when certain stops can only be visited at certain times.
4. Do not reorder stops. (Leave the box unchecked). This preserves the order of stops as decided by you, when you created the stops.
5. Choose Everywhere from the Allow U-turns dropdown box.6. Choose True Shape from the Output Shape Type dropdown box.7. Check the box labeled Ignore Invalid Locations. This will let you
find the best route using located stops. Stops that were not located on the network will be ignored.
8. Check Oneway in the Restrictions list.
9. Click the Directions tab.10. Make sure the Distance Units are set to Miles, the Display Time box
is checked and the time attribute is set to Minutes.

17
4. The Directions Window can also be displayed with turn-by-turn maps that can be shown by clicking on the Map link.
5. Close the Directions Window.
Adding a barrier
In this sectoin, you will add a barrier on the route, that represents a road block and will find an alternate route to the destination, avoiding the road block.1. In the Window menu, click Magnifier to bring up the Magnifier
window.2. Click on the title bar of the Magnifier window and drag to reposition
the Magnifier window. 3. Move the Magnifier window over the route, to a point where you
want to add a barrier. The Magnifier window shows a part of the map where you can add a barrier at a zoom of 400%.
11. Click OK.
Run the process to compute the best route
1. Click the Solve button on the Network Analyst toolbar. The route polyline appears in the map and in the Route category of
the Network Analyst Window.
2. Click the plus (+) sign next to Routes on the Network Analyst Window to show the Route.
3. Right-click the new route called ‘Graphic Pick 1 - Graphic Pick 3’ and click Directions Window to display driving directions.

18
4. On the Network Analyst Window, click Barrier (0).5. On the Network Analyst Toolbar, click the Create Network Location
tool .6. In the Magnifier Window, click anywhere on the route, to place a
barrier.
7. Click the Solve button on the Network Analyst toolbar. A new alternative route is computed, avoiding the barrier.
8. Close the Magnifier Window.
Saving the best route
1. Right-click Routes (1) on the Network Analyst Window and click Export Data.
2. Type C:\arcgis\ArcTutor\Network_Analyst\Exercise4\Exercise4_Route.shp in the Output shapefile or feature class field.
3. Click OK. The best route generated is saved to the specified shapefile.
4. Click NO when prompted to add the exported data to the map as a layer.
5. If you do not plan to work on any other Exercise, close ArcMap. Click No to discard all changes.

19
Exercise 5: Finding the closest fire stations
In this Exercise you will find the closest four fire stations that can respond to a fire at a given address. You will also generate the fastest route from each of these fire stations that will be provided to each driver of the fire engine.
Preparing your display
1. If you have Exercise5.mxd open in ArcMap, skip steps 2 to 5.2. Start ArcMap by either double-clicking a shortcut installed on your
desktop or using the programs list in your Start menu.3. Click File on the Main menu and click Open.4. In the Open dialog box, navigate to C:\arcgis\ArcTutor\Network_
Analyst\Exercise5\Exercise5.mxd. (This is the default install location for this data.)
5. Double-click Exercise5.mxd.6. If the Network Analyst Extension is not enabled, on the Tools
menu, click Extensions and in the Extensions dialog, click Network Analyst.
7. If the Network Analyst toolbar is not already present, on the Main menu, click View, point to Toolbars, and click Network Analyst.
8. If the Network Analyst Window is not already open, click the Network Analyst Window button on the Network Analyst toolbar.
This is a dockable window which you can dock within the ArcMap window or leave undocked. In this Exercise the window is docked below the Table of Contents.
Creating the Closest Facility analysis layer1. On the Network Analyst toolbar, click the Network Analyst
dropdown menu and click New Closest Facility.
The Network Analyst Window now contains an empty list of Facilities, Incidents, Routes, and Barriers categories.
Additionally, the Table of Contents contains a new Closest Facility analysis (group) layer.
Adding facilities
Next you will add facilities from a point file for which a layer file has been created.1. Right-click Facilities (0) in the Network Analyst
window and click Load Locations.2. Select Fire_Station from the Load From dropdown list. 3. Click OK. 40 fire stations are listed in the Network Analysis
window and are displayed as facilities on the map.

20
Adding an incident
Next, you will find a street address (1202 Twin Peaks Blvd) and add it as an incident for Closest Facility Analysis.1. Click Incidents(0) on the Network Analyst Window to select it as the
feature layer to which you will add the street address as a network location.
2. Select Find from the Edit menu to bring up the Find Dialog
3. In the Addresses tab, Select “SanFranStreets” from the Choose and address locator dropdown list.
4. Enter “1202 Twin Peaks Blvd” in the text box labeled Street or Intersection.
5. Click Find. One location is found with that street address and is listed as a row in the table in the Find Dialog.
6. Right-click the row and click “Add as Network Location”. This adds the located address as an incident on the Network Analyst Window and on the map.
7. Close the Find Dialog.

21
Run the process to identify the closest facility
1. Click the Solve button on the Network Analyst toolbar. The routes appear in the Map and in the Route Category on the
Network Analyst Window.
Note that only 2 fire stations were found to be closest to the fire within the three minute cutoff. You can optionally, increase the cutoff value to 4 minutes and see how many fire stations are found.
2. Click the Directions Window button in the Network Analyst Toolbar to generate directions for routes from each fire station.
If you do not plan to work on any other Exercise, close ArcMap. 3. Click No to discard all changes.
Setting up the parameters for the analysis
Next, you will specify the parameters for your Closest Facility analysis.1. Click the Analyst Layer Properties Button next to Closest Facility on
the Network Analyst Window to bring up the Layer Properties dialog.
2. In the Layer Properties dialog, click the Analysis Settings tab.3. Click the Impedance dropdown arrow and click Minutes (Minutes).4. Set the Default Cutoff value to 3. ArcGIS will search for fire stations
that are within three minutes of the fire. Any fire station outside of three minutes drive time will be ignored.
5. Increase the Facilities to Find from 1 to 4. ArcGIS will attempt to search for four fire stations from the fire site, within the three minute cutoff. If there are only three fire stations within the three minute cutoff, then the fourth fire station will not be found.
6. Under Travel From, select Facility (fire station) to Incident (fire).7. Select Everywhere from the Allow U-Turns dropdown box.8. Select True Shape from the Output Shape Type dropdown box.9. Check the box labeled Ignore Invalid Locations. This will let you
find the best route using located stops. Stops that were not located on the network will be ignored.
10. Check Oneway in the Restrictions list.11. Click OK to save the settings.


23
Exercise 6: Calculating service area and creating a OD Cost Matrix
In this Exercise you will create a series of polygons representing the distance that can be reached from a facility within a specified amount of time. These polygons are known as service area polygons. You will calculate 3-, 5-, and 10-minute service area polygons for six warehouses in Paris. You will also find out how many stores lie within each of these service areas. You have to identify one warehouse that should be relocated to better service the stores. Additionally, you will create an Origin-Destination Cost Matrix for delivery of goods from the warehouses to all the stores within a 10-minute drive time. Such a matrix is used as an input for logistics, delivery, and routing analyses.
Preparing your display
1. If you have Exercise6.mxd open in ArcMap, skip steps 2 to 5. 2. Start ArcMap by either double-clicking a shortcut installed on your
desktop or using the programs list in your Start menu.3. Click File on the Main menu and click Open.4. In the Open dialog box, navigate to C:\arcgis\ArcTutor\Network_
Analyst\Exercise6\Exercise6.mxd. (This is the default install location for this data.)
5. Double-click Exercise6.mxd.6. If the Network Analyst Extension is not enabled, on the Tools
menu, click Extensions and in the Extensions dialog, click Network Analyst.
7. If the Network Analyst toolbar is not already present, on the Main menu, click View, point to Toolbars, and click Network Analyst.
8. If the Network Analyst Window is not already open, click the Show/Hide Network Analyst Window button on the Network Analyst toolbar.
This is a dockable window which you can dock within the ArcMap window or leave undocked. In this Exercise the window is docked below the Table of Contents.
Creating the Service Area analysis layer
1. On the Network Analyst toolbar, click the Network Analyst dropdown menu and click New Service Area.
The Network Analyst Window now contains an empty list of Facilities, Barriers, Lines, and Polygons categories.
Additionally, the table of contents contains a new Service Area analysis layer.
Adding facilities
Next, you will add warehouses as facilities for which the service area polygons will be generated.1. Right-click Facilities(0) on the Network Analyst Window and select
Load Locations. Select Warehouses in the Load From dropdown list and click OK.
Click the plus (+) sign next to Facilities(6) in the Network Analyst Window to show the list of six facilities. The facilities are also visible on the map.

24
Setting up the parameters for the analysis
Next, you will specify that your service area will be calculated based on Drivetime (minutes). Three service area polygons will be calculated for each facility, one at 3 minutes, one at 5 minutes, and another at 10 minutes. You will specify that the direction of travel will be from the facility, not towards the facility, that no U-turns are allowed, and that one-way restrictions must be followed.1. In the Network Analyst Window, click the Analysis Layer Properties
Button to bring up the Layer Properties dialog box2. Click the Analysis Settings tab.3. Click the Impedance dropdown list and select Drivetime (Minutes).4. Type “3 5 10” in the Default polygon breaks text box. (Enter this as 3
5 10, the three numbers are separated by a space, without the quotes.)5. Under Direction, click Away from facility.6. Click Nowhere from the Allow U-turns dropdown list.7. Check Oneway in the Restrictions list to honor one way restrictions.8. Check the Ignore Invalid Locations checkbox.
9. Click the Polygon Generation tab.10. Make sure that Generate Polygons is checked.11. Click Generalized for Polygon Type. This results in faster analysis.
Detailed polygons are much more accurate, but need more time to be generated.
12. Click Separate polygons per facility under Multiple Facilities Options. This results in individual polygons per facility that may or may not overlap.
13. Click Rings for the Overlap type. This excludes areas of smaller breaks from the polygons of a bigger break.
14. Click Apply to save the settings.
15. Click the Line Generation tab.16. Leave the box labeled Generate Lines unchecked.
17. Click OK to save your settings.

25
Run the process to compute the Service Area
1. Click the Solve button on the Network Analyst toolbar. The service area polygons appear on the map and on the Network
Analyst Window. There is a transparency set by default for the Polygons layer. This
shows the underlying layers and gives an idea of the area under the polygons with respect to the street network.
Identifying stores that do not lie within any polygon
1. In the table of contents select and move the Stores feature layer to the top to improve visibility.
2. Choose Select by Location from the Selection menu.
3. Create the selection query in the Select by Location to select features from Stores that are completely within Polygons, as shown below.
4. Click Apply. This will select all stores that lie within service area polygons.
5. Click Close. You want to select stores that are not within the service area
polygons, which is the inverse of the current selection. To get the selection of stores that are not within the service area polygons, you can switch the selection.
6. Right-click Stores in the Table of Contents, point to Selection and choose Switch Selection.

26
7. The selection now shows the distribution of stores not contained in any service area polygon. You use this selection to identify the area to which you will relocate a warehouse. This area appears to be in the center of the map.
8. Right-click Stores in the Table of Contents, point to Selection and choose Clear Selected Features.
Relocating the least accessible warehouse
1. Look at the service area polygons of Warehouse #2. There are no stores that lie within the 3-, 5- or 10-minute service areas of Warehouse #2. Hence, you will relocate Warehouse #2 to better service the stores.
2. On the Network Analyst Window, select Warehouse #2 under Facilities (6).
3. Use the Select\Move Network Location Tool to move Warehouse #2 to the center of the map, as shown in the figure below.
Run the process to compute the Service Area
1. Click the Solve button on the Network Analyst toolbar. The service area polygons appear on the map and on the Network
Analyst Window.
Identifying the service area polygon that each store lies within
1. In the table of contents, right-click Stores feature layer, point to Joins and Relates and select Join...

27
2. Choose Join data from another layer based on spatial location
3. Select Polygons as the layer to join to this layer.
4. Select the first radio button labeled “it falls inside” to add the attributes of polygon to all points that fall inside the polygon.
5. Specify the output shapefile to save the result of the join as StoreswithPoly.shp.
6. Click OK to perform the join.7. Right-click the newly added StoreswithPoly feature layer and select
Open Attribute Table. Each row displays the name of the store and polygon it falls under. You can use this table to generate other useful
categories such as the number of stores within 0-3 minute service area of warehouses.
8. Close the attribute table. You can optionally export your facilities (including the one you
moved to a new location) as a feature class. 9. Right-click Facilities (6) on the Network Analyst Window and click
Export Data10. In the Export dropdown list, click All features.11. Set the coordingate system to be used by choosing the third radio
button labeled “the feature dataset you export the data into”
12. Type “C:\arcgis\ArcTutor\Network_Analyst\Exercise6\NetworkAnalysis.mdb\AnalysisObjects\New_Warehouses” as the output feature class.
13. Click OK. 14. Choose No when prompted to add the
feature class to the map. You will not be using this feature class for the remaining exercise.

28
Optionally, you can create an Origin-Destination cost matrix for deliveries from the new warehouses to each store. The results of this matrix can be used to identify the stores that will be serviced by each warehouse within a 10-minute drive time. Also, you would like to find the total drive time from each warehouse to its stores.
Creating the OD Cost Matrix analysis layer1. In the table of contents, uncheck Service Area analysis layer to
improve readibility of the map.2. On the Network Analyst toolbar, click the Network Analyst
dropdown menu and click New OD Cost Matrix.
The Network Analyst Window now contains an empty list of Origins, Destinations, Lines, and Barriers categories.
Additionally, the table of contents contains a new OD cost matrix
analysis layer.
Adding origins
You can use the facilities from Service Area Analysis (in the previous section) as origins. If you have not completed the section on Service Area Analysis, you can alternately use the Warehouses feature layer.1. Right-click Origins (0) on the Network Analyst Window and click
Load Locations.2. Select ServiceArea\Facilities in the Load From dropdown list. (If you
did not complete the previous section on service area analysis, you can use Warehouses instead. Note that your results will not resemble the results in this exercise.)
3. Make sure the Selected Features Only check box is unchecked.
4. Click Use Network Location Fields radio button under Location Position. Using network location fields will allow ArcGIS to use the located position of Service Area facilities to locate the origins again. This is much faster than using search tolerance to locate them again. (If you are loading Warehouses, you will need to click the use Geometry radio button and set the Search Tolerance to 50 meters.)
5. Click OK. The Network Analyst Window now shows six origins under the
Origins list and on the map.
Adding destinations
Next you will add the stores as destinations.1. Right-click Destinations(0) on the Network Analyst Window and
click Load Locations.

29
2. Choose Stores in the Load From dropdown list.3. Under Location Analysis Properties, for the property Name, select
the field “NOM” from the dropdown list. Since the field name is in French, ArcGIS Network Analyst was unable to map the field name automatically.
4. Click OK.The Network Analyst Window now lists 21 destinations under the Destinations list.
These destinations are also displayed on the map.
Setting up the parameters for the analysis
Next, you will specify that your OD Cost Matrix will be calculated based on time (Drivetime).You will set a default cutoff value of 10 minutes and will ensure that all destinations are found within the specified cut off. Additionally, you will specify that U-turns are allowed everywhere and the output Shape type should be a straight line. Since all these trips are on roads, one-way restrictions must be followed. All invalid locations (locations that were not located) will be ignored.1. Click the Analysis Layer Properties Button next to OD Cost
Matrix on the Network Analyst Window.
2. Click the Analysis Settings tab.3. Click the Impedance dropdown list and click Drivetime(Minutes).4. Input 10 in the Default Cutoff Value dropdown list. This will create
origin-destination paths from each warehouse to all stores that can be reached within 10 minutes.
5. Select <All> from the Destinations to Find dropdown list.6. Select Everywhere from the Allow U-turns dropdown list.7. Select Straight Line from the Output Shape Type dropdown list.8. Check Oneway in the Restrictions list.9. Check Ignore Invalid Locations 10. Click OK save the parameters.
30
Run the process to create the OD Cost Matrix
1. Click the Solve button on the Network Analyst toolbar. The OD lines appear on the map. The number of lines in this tutorial
are 24. These may be different for you depending on where you relocated Werehouse #2.
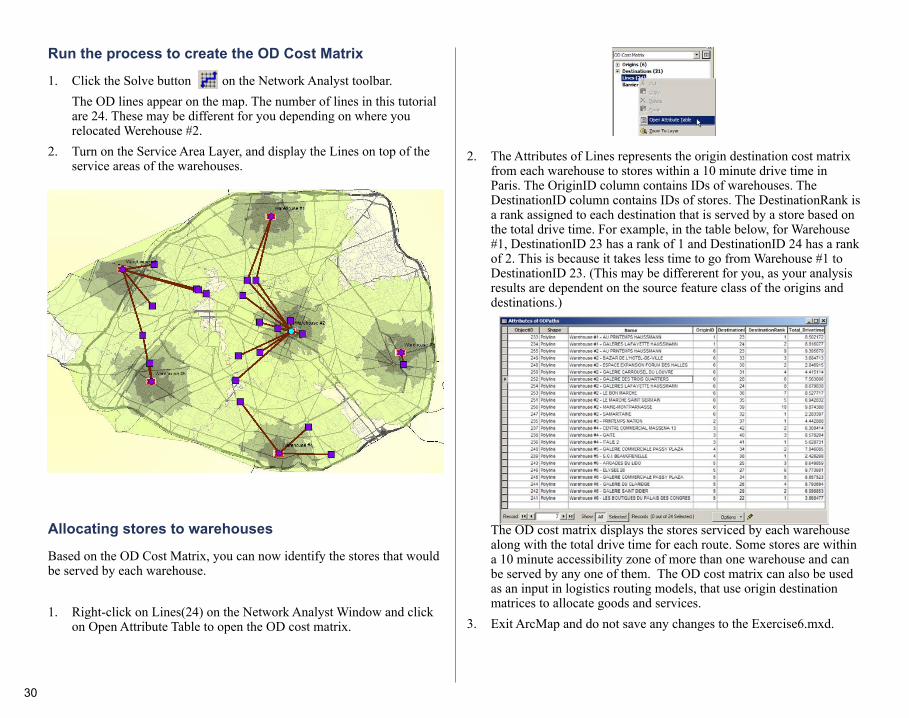
2. Turn on the Service Area Layer, and display the Lines on top of the service areas of the warehouses.
Allocating stores to warehouses
Based on the OD Cost Matrix, you can now identify the stores that would be served by each warehouse.
1. Right-click on Lines(24) on the Network Analyst Window and click on Open Attribute Table to open the OD cost matrix.
2. The Attributes of Lines represents the origin destination cost matrix from each warehouse to stores within a 10 minute drive time in Paris. The OriginID column contains IDs of warehouses. The DestinationID column contains IDs of stores. The DestinationRank is a rank assigned to each destination that is served by a store based on the total drive time. For example, in the table below, for Warehouse #1, DestinationID 23 has a rank of 1 and DestinationID 24 has a rank of 2. This is because it takes less time to go from Warehouse #1 to DestinationID 23. (This may be differerent for you, as your analysis results are dependent on the source feature class of the origins and destinations.)
The OD cost matrix displays the stores serviced by each warehouse along with the total drive time for each route. Some stores are within a 10 minute accessibility zone of more than one warehouse and can be served by any one of them. The OD cost matrix can also be used as an input in logistics routing models, that use origin destination matrices to allocate goods and services.
3. Exit ArcMap and do not save any changes to the Exercise6.mxd.