arab republic of egypt economic report - the world...
TRANSCRIPT

Report No. 870a-EGT F LUE C OPY
Arab Republic of EgyptEconomic Report
January 5, 1976
Europe, Middle East and North Africa Region
Not for Public Use
Document of the World Bank
Thits document has a restricted distribution and may be used by reciprents
only in the pettormanee ot their otficial duties Its contents may nototherwise be disclosed without \Vorld Batik authorization
Pub
lic D
iscl
osur
e A
utho
rized
Pub
lic D
iscl
osur
e A
utho
rized
Pub
lic D
iscl
osur
e A
utho
rized
Pub
lic D
iscl
osur
e A
utho
rized
Pub
lic D
iscl
osur
e A
utho
rized
Pub
lic D
iscl
osur
e A
utho
rized
Pub
lic D
iscl
osur
e A
utho
rized
Pub
lic D
iscl
osur
e A
utho
rized

CURRENCY EQUIVALENTS
Official Rate
1 Egyptian Pound (LE 1) = US$2.56 or SDR 2.118*1 US Dollar L LE 0.391
Parallel Market Rate
1 Egyptian Pound (LE) US$1.701 US Dollar - LE 0.587
* In the general realignment of currencies which occurred in February 1973the value of the Egyptian pound was kept constant in terms of SDRs atLE = SDR 2.118. This was equivalent to an appreciation against thedollar to LE = 2.56, from its previous value of LE 1 - 2.30.
NEIGHTS AND MEASURES
1 hectare = 2.379 feddans1 feddan = 1.038 acres1 acre = o.Q63 feddans1 sq. kilometer 238 feddans1 ardeb (metric) 198 liters
= 160 kilograms (kg) of lentils= 157 kg of clover
155 kg of beans, chick peas, lupine, fenugreek- o140 kg of maize, millet4 120 kg of cottonseed, barley, sesame= 60 kg of groundnuts
1 kantar = 157.5 kg of seed cotton= 50 kg of cotton lint= 45 kg of onions, sugarcane
FISCAL YEAR
Effective January 1, 1973, the fiscal year became identical with thecalendar year (Gregorian calendar). Previously, the Government's fiscalyear had been July 1-June 30.

FOR OFFICIL USE ONLY
TABLE OF CONTENTS
Page No.
MapCountry DataSummary and Conclusions . . . . . . . . . . . . . . . . . . . . . i-v
I. OBJECTIVES AND STRATEGY. .I................... . IThe October Working Paper . . . . . . . . . . . . . . . . . 1. Prospects: Long- and Short-Term . . . . . . . . . . . . . . . . . 3
II. RECENT ECONOMIC DEVELOPMENTS . . 6 . . . . . . . . . . . . . . . . 6Gross Domestic Product . . . . . . . . . . . . . . . . . . . . . . 6Performance of Major Sectors . . . . . . . . . . . . . . . . . . . 8Employment . . . . . . . . . . . . . . . . . . . . . . . . . . . 8Wages . . . . . . . . . . . . . . . . . . . . . . . . . . . . . 9Prices . .. .. . . . . . . . . . . . . . . . . . . . . . . . . 10The Domestic Budget . . . . . . . . . . . . . . . . . . . . . . . . 11Balance of Payments . . . . . . . . . . . . . . . . . . . . . . . . 13External Assistance . . . . . . . . . . . . . . . . . . . . 15
-External Debt . .... . . . . . . . . . . . . . . . . . . . . . . 16Planning and Priorities . . . . . . . . . . . . . . . . . . . . . . 17
III. POLICY IMPLICATIONS OF THE NEW ECONOMIC STRATEGY . . . . . . . . . 22The Balance of Payments . . . . . . . . . . . . . . . . . . . . . . 22Price System. . . ........ . 24The Public Sector . 26Government Expenditure . . . . . . . . . . . . . . . . . . . . . . 27Government Revenue . . . . . . . . . . . . . . . . . . . . . . . . 28Public Sector Enterprises . 29Revival of the Private Sector . . . . . . . . . . . . . . . . . . . 30New Methods of Economic Management . . . . . . . . . . . . . . . . 32Competing Objectives and Policies . . . . . . . . . . . . . . . . . 32
Exchange Rate Adjustment and Other Goals . . . . . . . . . . . . 34Agricultural Price Incentives and Domestic Resources . . . . . . 34Decentralization and Social Goals . . . . . . . . . . . . . . . 34
STATISTICAL APPENDIX
Table of Contents to the Statistical Appendix
Tables
This Economic Report is based on the findings of an economic mission which visitedEgypt in May-June 1975, and an updating mission in October 1975. The economicmission was composed of Messrs. Vinod Dubey (chief of mission), Khalid Ikram(deputy chief of mission), Francis X. Colaco (fiscal economist), Shahid AmjadChaudhry (general economist), Javad Khalilzadeh-Shirazi (industrial economist),Muhammad a! Ali (industrial economist; consultant), Miss Betty Dow (statistician),and Mrs. Lvnette Joseph (secretary). The updating mission was composed of Messrs.Khalid Ikram (chief of mission) and Shahid Amjad Chaudhry (general economist).
This document has a restricted disFAribtoi aimid may be used by recipients only in the performanceof their official duties. Its contents may not otherwis be disclosed without World Bank authorization.

BRD 10047
-:da : A1Jr,s 05 SosI
41~ ~~~~~~~1(~~~~~~~~~~5J 0 ~ ~ ~ ~ ~ ~ ~ ~ ~ ~ ~ ~~~AL
7' -, -a )ftXN A5
| | t < t' \ 9';: ' A ~~~~~~~~~~~~~~~~~~~~~~~~~~~~~R A B
SAHA R 0 f 0 0& e w;¢1 Mr t ;~~~~R o 5,
2*~~~~~~~~ /
ARAB REPUBLIC OF U1*,
r--~~ t>wi*woo EGYPT - -=7 -
5 8 1 ) Ho deurecend Freds,
- Qne or wider _ _ \
-0Ž
- - - - - - - - - - -
< ~ ~~ ~ ~~~~ - C)~ Cd_x -
- f ) Y 9 ¼S\_ reulnlb,nG¢>r o N!;S}/ ,/,
S l [ __ ___ __ __ _ __ 2 __ __ __ _#
. * i [l \ t fi _ i _ s wt i ubl T.Qs


COUNTRY DATA - EGYPT, ARAB REPUBLIC OF
AREA 2 POPULATION DENSITY 2
1,002,000 km 36.4 million (mid-1974 - Estimated) 36.3 per km 2Rate of Growth: 2.2% Over 1000 per km of inhabited area
POPULATION CHARACTERISTICS (1971) HFALTH (1973)Crude Birth Rate (per 1,000) 35.1 Population per physician 1,700
Crude Death Rate (per 1,000) 13.2 Population per hospital bed 435Infant Mortality (per 1,000 livebirths) 119.0 (1970)
INCOME DISTRIBUTION (1965) DISTRIBUTION OF LAND OWNERSHIP (1965)% of national income, highest quintile 47.07. % owned by top 5.5% of owners 43%
lowest quintile 4.2%
ACCESS TO PIPED WATER ACCESS TO ELECTRICITY% of population - urban .. % of population - urban
- rural .. - rural
NUTRITION EDUCATIONCalorie intake as % of requirements 103.0% (1970) Adult literacy rate 40% (1971)
Per capita protein intake 83.5% (1969) Primary school enrollment 70% (1970)
GNP PER CAPITA IN 1974.- US$280
GROSS NATIONAL PRODUCT IN 1974 ANNUAL RATE OF GROWTH (%, constant prices)
IS$Mln. % 1960-65 1965-70 1970-73 1974
G1P at Market Prices 10,109 100.0 6.6 3.8 3.0 3.8
Gross Domestic Investment 1,894 18.7 11.0 -1.1 8.8 26.4Gross National Saving 2/ 310 3.1 - - - -Current Account Balance 2/ -1,584 -15.6 - -Exports of Goods, NFS 2,196 21.7 5.0 1.9 (3/) (3/)Imports of Goods, NFS 3,823 37.8 8.0 1.0 (3/) (3/)
OUTPUT, LABOR FORCE AND PRODUCTIVITY IN 1974
Value Added- Employment V. A. Per WorkerUS $ Mln. % Mln. % US $ %_
Agriculture 3,187 34.2 4.21 46.6 757 73.4Industry and Mining 1,933 20.7 1.15 12.7 1,681 162.9Electricity 123 1.3 .04 0.4 3,075 298.0Construction 345 3.7 .31 3.4 1,113 107.9Distribution Sector 1,352 14.5 1.29 14.3 1,048 101.6Services Sector 2,389 25.6 2.04 22.6 1,171 113.5
Total/Average 9,329 100.0 9.04 100.0 1,032 100.0
GOVERNMENT FINANCE Central/Federal Government
($ Mln.) % of GDP
1974-t 1974 1969-71-/
Current Receipts 2,926 31.6 21.3Current Expenditure 3,105 33.5 20.7Current Surplus -179 -1.9 0.6Emergency Fund 7/ 1,308 14.1 9.2Capital Expenditures 1,492 16.1 11.7External Financing (net) 202 2.2 -0.4
1/ The Per Capita GNP estimate is at market prices, calculated by the same conversion technique as the1975 World Bank Atlas. All other conversions to dollars in this table are at the average exchange rate
prevailing during the period covered.2/ Excluding unrequited transfer receipts.3/ Accurate constant price growth rates are not available due to insufficient information concerning
trade deflators.4/ At current factor costs.5/ Preliminary figures.6/ 1969-71 current receipts and expenditures not comparable with 1974 data because of differences in
methodology.7/ A Government account for special defence facilities and reconstruction, funded by Arab grants and
earmarked revenue receipts. The operations of the Fund are excluded from the national budget.

- 2-
MONEY, CREDIT and PRICES 1971 1972 1973 1974(M-iillion z Outstanding End Period)
Money and Quasi Money 1,166 1,3)45 1,633 2,114Claims on Governient 1,342 1 5469 1,656 2,038Claims on Non-Government Sect.or 549 553 531 788
(Percentages or Index Nlumbers)
Money and Quasi Money as % of GDP 36.0 39.7 44h9 53.2Consumer Price Index (1966/67 = 100) 113.62.! 117.4 122.4 135.7
Annual percentage changes in:Cons-umer Price Index 4. 0/ 2.8 4.3 10.9Glaims on Government 13,6 9.5 12.7 23.1Claims on Nor-Govc-rnmsnbt Sector 5.0 0.7 -4.0 48.4
BALANCE OF PAY14E2TS MERCHANDISE EXPORTS (AVERAGE 1973-74)
1972 1973 197)4 S $ Min %(Millions US $)
Raw Cotton 545 !h0.7Exports of Goods 813 1,003 i,674 Yarns and textiles 218 16.3Timports of Goods 1,286 1 6602/ 3,4282,1 Rice 73 5.5Trade Balance (deficit -) 3 -657 -1,754 All other cormmodities 502 37.5
Total 1,338 100.0
Servicas, Net 7 7 170Net Transfers 295 727/ _ 1,2582/ EXTERNAL DEBT, DECEMBER 31, 1974Balance on Current Account -mI 77 -326
US $ Mln
Net t0LT Borrowing Public Debt Outstanding & Disbursed 2,760Disbursements 417 362 522Amortization 294 420 654Subtotal 123 -58 -132 3/
DEBT SERVICE RATIO for 197)4-Other Nxcn--Monetarv Capital 21 -13 -53 %
(net) -Overall_Balartce (sitRplus +) -27 6 -sal Public Debt Outstanding & Disbursed 32.3
Overall Balance (surp! s +) -27 6 -511
Gross reserves 356
RATE OP EYCHA.NGE IBRD/IDA LENDING, (Sept. 30, 1975) (Million US $):
Through Januar' 1973 IBRD IDAUS $ 1.0O = TE 0.435
1.00 = US 2.30 Outstanding & Disbursed 5.9 72.1Undisbursed 156.1 143.8
Since February, 1973 Outstanding incl. Undisbursed 162.0 215.9US $ 100 LE 0.390
1.00 = US $2856
1/ Due to non-availability of data on calendar year basis, figure refers to "fiscal" year 1970/71.2/ Includes the market value of petroleum grants.3/ Ratio of Debt Service to Exports of Goods and Non-Factor Services.
EMENA RegionDecember 19, 1975

SUMMARY AND CONCLUSIONS
i. In the period 1960-67, Egypt's GDP grew at an average rate of about6 percent a year in real terms. This was accompanied by a steady increasein the level of investment, which reached 18 percent of GDP in 1966-67, anddomestic savings (over 14 percent in 1966-67). Until the mid-1960's, therewas a substantial inflow of external capital. After the war of 1967, invest-ment was squeezed by the diversion of resources to defence and the virtualdrying up of the capital inflow; during 1968-72 there was a net outflow tothe West, if interest on debt is taken into account. There was a declinein the level of investment (to 12 percent of GDP in 1972) and in the growthof the GDP, which averaged around 3 percent a year in real terms in theperiod 1967-73. Domestic savings also dropped to about 8 percent of GDP in1973.
ii. After the war of October 1973, the changed situation called for anew economic strategy. President Sadat's "October Working Paper," whichwas approved in a national referendum in May 1974, enunciated the basicprinciples which guide Egypt's present development policies. These envisageconsolidation of state-owned enterprises, liberalization of the privatesector, incentives to private foreign investment and expanded economiccooperation with Arab countries. Accordingly, in 1974 and the first halfof 1975, Egypt initiated a number of steps in furtherance of these principles,which are expected to lead to a significant restructuring of the economy.In particular, steps were taken to remove some of the heavy restrictionson private business activities, to encourage foreign private invest-ment andto expand exchange transactions outside the official rate. It should benoted, moreover, that this policy of economic liberalization was pursuedin a largely unfavorable international political and economic environment.
Recent Economic Developments
iii. Egypt's economy in 1974 was dominated by pressures that originatedin the external sector but spilled aver into the rest of the economy. Onthe external side, these included the slow progress towards peace in theMiddle East; the steep rise in the prices of Egypt's main imports, therecession in the OECD countries; and the slow disbursements of concessionalassistance and private external capital. On the domestic side, the escalationin the world prices of food led to an almost three-fold increase in the netbudgetary subsidies on the items of mass consumption, as the Governmentattempted to maintain the domestic price of imported foodstuffs.
iv. The deficit on the balance of payments was met largely by the useof bank credit facilities, which reached a level of LE 1,055 million ($2.7billion) 1/ at the end of 1974. The debt structure worsened considerably andthe short maturity period associated with bankers' facilities created severe
1/ Including undisbursed amounts.
- ii -
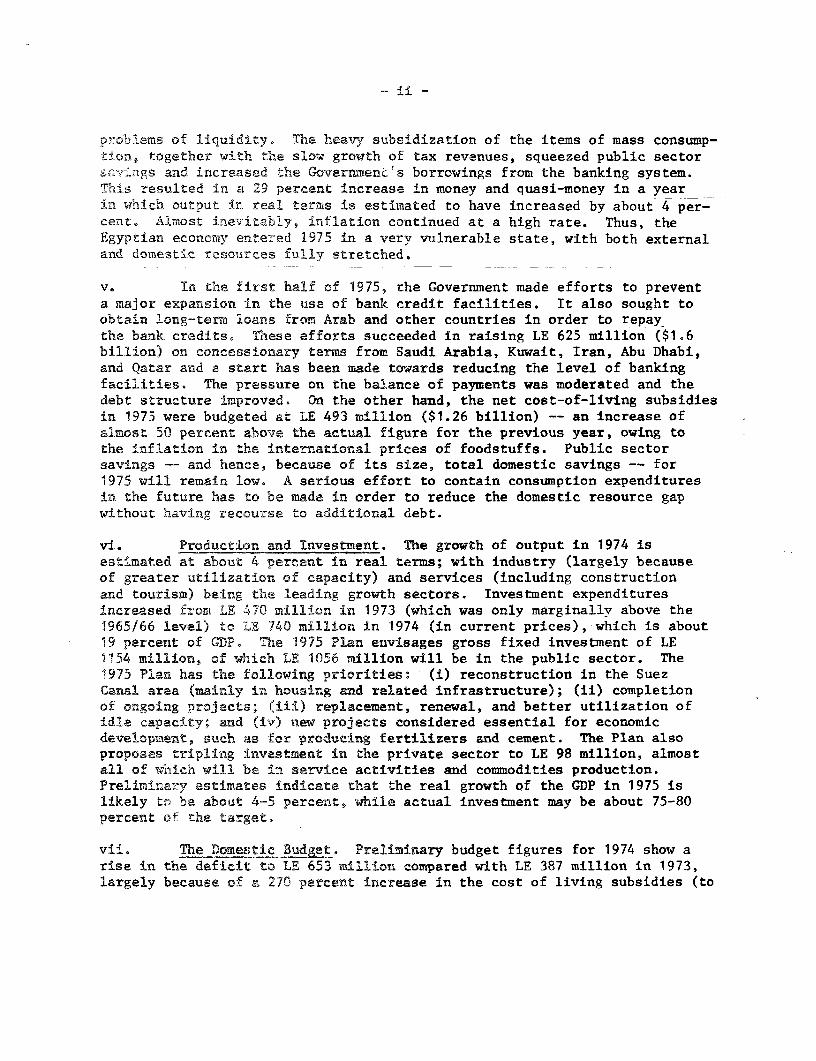
problems of liquid4Lty. The heavy subsidization of the items of mass consump-tion, together with the slow growth of tax revenues, squeezed public sectorsavrngs and increased the GovernmenCs borrowings from the banking system.is resulted in a 29 percent increase in money and quasi-money in a year
in 'Which output in real terms is estimated to have increased by about 4 per-cent. Almost in,evitably, inflation continued at a high rate. Thus, theEgyptian economy e!ntered 1975 in a very vulnerable state, with both externaland domestic resources fully stretched.
V. In the first half of 1975, the Government made efforts to preventa major expansion in the use of bank credit facilities. It also sought toobtain long-term loans from Arab and other countries in order to repaythe bank credits. These efforts succeeded in raising LE 625 million ($1.6billion) on concessionary terms from Saudi Arabia, Kuwait, Iran, Abu Dhabi,and Qatar and a start has been made towards reducing the level of bankingfacilities. The pressure on the balance of payments was moderated and thedebt structure improved. On the other hand, the net cost-of-living subsidiesin 1975 were budgeted at LE 493 million ($1.26 billion) -- an increase ofalmost 50 percent above the actual figure for the previous year, owing tothe inflation in the international prices of foodstuffs. Public sectorsavings - and hence, because of its size, total domestic savings -- for1975 will remain low. A serious effort to contain consumption expendituresin the future has to be made in order to reduce the domestic resource gapwithout having recourse to additional debt.
vi. Production and Investment. The growth of output in 1974 isestimated at about 4 percent in real terms; with industry (largely becauseof greater utilizaLtIon of capacity) and services (including constructionand tourism) being the leading growth sectors. Investment expendituresincreased from LE 47Q million in 1973 (which was only marginallv above the1965/66 level) to iLE 740 million in 1974 (in current prices), which is about19 percent of GDP. The 1975 Plan envisages gross fixed investment of LE1154 million, of which LE 1056 million will be in the public sector. The1975 Plan has the following priorities: (i) reconstruction in the SuezCanal area (mainly in housing and related infrastructure); (ii) completionof ongoing projects; (iii) replacement, renewal, and better utilization ofidle capacity; and (iv) new projects considered essential for economicdevelopment, such as for producing fertilizers and cement. The Plan alsoproposes tripling investment in the private sector to LE 98 million, almostall of which will be in service activities and commodities production.Preliminary estimates indicate that the real growth of the GDP in 1975 islikely to be about 4-5 percent, while actual investment may be about 75-80percent of the target.
vii. The Domestic Budget. Preliminary budget figures for 1974 show arise in the deficit to LE 653 million compared with LE 387 million in 1973,largely because of a 270 percent increase in the cost of living subsidies (to

- iii -
LE 330 million) t0, while current revenues increased bv about 12 percent.Despite an estimated 35 percent increase in current revenues (arising prin-cipally from a doubling of revenues from customs duties, including collec-tion of arrears), the 1975 budget projects a large deficit (LE 927 million).Direct bank financing of the budget deficit is projected at LE 125 million,but total lending by the banking sector to the Government may exceed thislevel. Preliminary figures for the first half of 1975 indicate that bothcurrent revenues and expenditures were in line with budgeted amounts. How-ever, the revenues comprised substantial arrears in payments on import dutiesoffset by a higher-than-projected growth of other taxes.
viii. Balance of Payments, Egypt's deficit on its commodity tradeamounted to LE 685 million ($1,754 million) in 1974 (more than twice thatexperienced in 1973); this was largely due to the steep rise in the priceof Egypt's main imports. Egypt's balance of payments difficulties werefurther compounded by a slow disbursement of medium-and long-term loanscommitted during 1973 and 1974 and a high level of debt repayment of LE 255million ($654 million) in 1974; this resulted in a net outflosw of LE 52million ($132 million) on official medium- and long-term capital. Substantiallyincreased Arab grants (LE 475 million ($1,217 million) in 1974) helped toreduce the current deficit but the overall deficit on the current and thecapital accounts nevertheless amounted to LE 199 million ($511 million),which was met bv the use of bank credit facilities.
ix. Estimates of Egvpt's balance of trade and services in 1975 indi-cate a deficit of about LE 860 million ($2,200 million). Repayments of aboutLE 213 million ($545 million) have to be made during the year on outstandingmedium- and long-term loans and supoliers' credits. The resulting deficit(of about LE 1.1 billion -- about $2,800 million) is expected to be financedlargelv through Arab grants, commodity loans, project loans and suppliers'credits.
Constraints on Development
x. The most severe constraints on Egyptian development are: (a) theheavy defense burden; (b) the pressing shortage of foreign exchange; (c) theexternal debt burden; (d) the rigid economic decision-making process; and (e)the rapid population growth, increasing the problems of food supply, unemploy-ment, underemployment, and urban congestion, Moreover, the new economic stra-tegy sketched out in the October Paper might give rise to competition amongobjectives, the simultaneous pursuit of all of which could act as a brake ondevelopment. The main areas of such potential conflict can be identifiedas: an equitable income distribution as against the incentives to be providedfor the growth of the private sector; the protection to be given to industryand its results on economic efficiency; the rationalization of the pricesystem (including both domestic prices and the foreign exchange rate) on
1/ Almost entirely due to the increase in international prices of importedfoodstuffs (largely flour, maize, sugar and edible oils).

- iv -
the one hand, and price stability on the other; and the decentralization ofdecision-making versus the need to maintain some centrall-7 deternined socialgoals,
Development Prosects
xie Despite the current economic difficulties, Egypt s economic poteri-tial over the long run is promising. The reasons for this assessment may bebriefly summarized: (i) the country has a large market, a skilled population,low wages, varied raw materials, and a key geographical location, wnich makesit a natural base for industries that wish to supply the domestic market andthe growing regional market. It is realized that the development prospectsin the medium-term hinge to a large extent on the country's ability to attractexternal capital and technology. For this purpose, Egypt has promulgated LawNo. 43 of 1974, which provides an incentive package for foreign in-vestment;Egypt is also making major and apparently successful efforts to attract bila-teral arnd international aid; (ii) Suez Canal revenues are estimated to reacha level of around LE 300 million per year by 1980; these could increasa to apossible LE 500 million per year as a result of physical expansion andgreater usage of the Canal; (iii) the improved prospects for oil production,which is put (by the oil companies) at one million barrels a day by 1980-82;(iv) considerably increased earnings from tourism; (v) a much more intensiveutilization of agricultural land, with greater emphasis on the higher value-added crops; and (vi) an increased flow of remittances from Egyptians working
in the richer Arab countries of the region.
xii. However, the realization of the long-term potential hinges upon anumber of complex factors, some of which are not entirely within Egypt's con-trol. The most important of these is a definite movement towards an equitableand permanent peace settlement in the Middle East. Moreover, the attainmentof Egyptts prospects requires the transfer of large amounts of capital fromabroad; this, in turn, must be preceded by a considerable amount of -work onpreparing a suitable portfolio of projects for the consideration of potentialinvestors (whether private or official). And finally, it requires fundamentalchanges in economic policies and institutions. Hence, a realistic estimate ofthe time required to achieve a significant restructuring of the economy wouldbe of the order of at least 5-10 years.
xiii. Furthermore, an inappropriate response to the short-term difficul-ties may obstruct or postpone the realization of the long-term potential.The Goverrnment has, therefore, formulated an economic managemeat program tosteer its way past the short-term obstacles. The main elements of this pro-gram are (i) improved coordination in economic policy-making; (ii) improvedpublic sector efficiency through decentralization and other measures; (iii)rationalization of consumption subsidies and increased national savings, whileprotectiLng lower income groups through appropriate price, fiscal and monetarypolicies; (iv) promotion of efficient resource allocation through wideningthe parallel foreign exchange market and pursuing price policies that wouldbetter reflect economic scarcities; and (v) rationalization of the externaldebt situation and implementation of a debt management program.

Structure of Report-
xiv. This Economic Report consists of three chapters. The first out-lines the new direction that the Egyptian economy is expected to follow overthe next few decades - the October Working Paper has as its horizon theyear 2000 AD - and the Government's management program for dealing withthe short-term economic problems. The second describes recent developmentsin the economy, including the Plan for 1975. The third chapter analysesthe policy implications of the new economic strategy, and discusses someof the more important areas in which the quest for the new goals may comeinto conflict with other, equally important, objectives.

I

I. OBJECTIVES AND STRATEGY
1.1 Since the war of October 1973, Egypt has had three main policyobjectives: (i) the maintenance of defense preparedness; (ii) reconstructionand economic development; and (iii) the preservation of the social welfareframework. It was also clear that after the war the political and economicmilieu -- within Egypt, in the region, and internationally -- had changeddramatically, and that in order to take advantage of the new environment,a fresh economic strategy would have to be articulated. This is what'President Sadat did in his October Working Paper.
The October Working Paper
1.2 This document was presented to the People's Assembly in April 1974and approved by a national referendum in May. It laid out a comprehensiveoutline for a major redirection of policies in both political and economicspheres. The argument for a change in economic strategy, and the newdirection that it outlined, were essentially as follows:
(1) The war of October 1973 had unified all sections of Egypt'ssociety. This unity must be harnessed for the "constructionbattle", which had as its aim the modernization of Egyptiansociety by the year 2000.
(2) The basic element in the modernization process was an accel-eration of economic growth. This would require changes in theroles of the different sectors. Moreover, Egypt would requireconsiderable assistance from aboad-in the form of both financeand technology--and would thus have to adopt an "outward-looking"economic policy.
(3) The public sector had played a crucial role in Egypt's pastdevelopment, but experience had highlighted a number ofshortcomings. In particular, the sector suffered from (a)an excess of bureaucracy, and (b) the "annexation" of someactivities that were not compatible with the public sectortsmission and should have been left to the private sector.
In the final analysis, however, the public sector hadplayed a positive role, especially in carrying out majorprojects, increasing production, and paying the price ofimplementing Egypt's policy of full employment and stabilizedprices. What was required was a reorientation of he sector,so as to rid it of obstructions, and increase its efficiency.In the future, the main focus of the public sector's activitieswould be: (a) to serve as the primary instrument for carryingout the development plan (as it was the only sector directly

-2-
committed by the Plan); (b) to undertake basic projects thatother sectors would not or could not take up; and (c) to provideessential services to private and foreign investment.
(4) The private sector had been neutralized as a productive agentowing to a number of "contradictory policies" in the past. Itwas now time for those conditions to disappear, and for theprivate sector to be provided with stability and encouragementfor maximizing production.
(5) Although the main burden of development would fall on its ownshoulders, Egypt would still require a great deal of foreignresources. The changed conditions in the world made it ex-tremely likely that, given a proper response, the necessaryamounts of external capital would be forthcoming.
The new circumstances were of two types: One was the vastincrease in the financial resources of the Arab world. Theowners of these surplus funds would wish to invest a part ofthem in Egypt, because of cultural and historical links, andbecause Egypt would provide a sound economic haven. The secondfactor was the status acquired by Egypt after the October war,which induced other countries to take its goals and effortsseriously, and to want to invest in it.
The Egyptian response must be to grasp these new opportuni-ties -- as the October Paper puts it: "our national respons-ibility does not permit us to miss such an opportunity." Toavail of this, however, would require an "outward-looking"attitude. Egypt was prepared to adopt such a policy by pro-viding foreign investors with all the necessary legislativeguarantees.
(6) The development effort could not be a haphazard affair, butmust take place in a planned framework. The priorities setfor the Plan would emphasize a modernized industry, an intensive,high-value agriculture, oil and energy development, and tourism.
(7) Finally, it would be ensured that social goals were not neglected.The Paper stressed that "economic development cannot proceedsoundly forth unless accompanied by a social development atcompatible rates." As part of a better balanced social develop-ment, there would be more equitable growth between the regions,thereby reducing the disparities that had developed between thecapital and the provinces.

1.3 The strategy sketched out in the October Paper has profound conse-quences for the structure and dynamics of the economy. The Egyptian economy,as it had developed in the last decade, was marked by a predominance of thepublic sector (following the wide-ranging nationalizations of 1961), rigidcontrols on prices, imports, investment, and indeed on virtually all econ-omic decisions, detailed central planning of most projects and policies,increasing resort to administrative fiat as a means of implementing policy,a lack of competition, low productivity in most sectors, and a falling rateof investment and external aid. In short, the economy had become cloisteredand anaemic, and the October Paper proposed a bold new strategy to enableit to break out of its relative isolation. This strategy has come to beknown as the "opening up," 1/ or "open door" policy, and essentially connotesthe movement towards a less regimented economy in which both the privatesector and foreign investment are permitted to play an active and competitiverole.
1.4 The movement towards the goal of a more open, liberal economy didnot proceed smoothly in 1974, but was interrupted by a number of factors, bothexternal and internal. The first was the slow movement towards a Middle Eastpeace settlement, which prevented a major shift of resources from defense todevelopment. The second major factor was the rapid inflation in the pricesof Egypt's main imports. Moreover, disbursements of external capital weremuch lower than expected, which led to a serious squeeze on the balance ofpayments and made it impossible to liberalize the allocation of foreign ex-change. Third, the sheer weight and inertia of established ideas and insti-tutions made it inevitable that such fundamental changes as proposed in theOctober Paper would not come about easily or automatically. And finally, thetranslation of policy pronouncements into a body of effective legislation tobe enacted by the People's Assembly was, unavoidably, a time-consuming process.
Prospects: Long- and Short-Term
1.5 The economy's potential over the longer run is considerable, be-cause of the array of development assets that it can deploy. Egypt's mostimportant asset, of course, is its human resources. For a country at itslevel of per capita income, Egypt possesses a large supply of trained en-gineers, doctors, educators, agricultural specialists, administrators, andother skilled workers required for modernization. This skilled manpower,together with Egypt's large internal market and key geographical location,make the country a natural base for industries that wish to expand into therapidly growing regional market.
1.6 Second, there is the dramatically increased financial capacity ofthe Arab world, and Egypt's unique position in it. The latter arises froma complex of factors: Egypt's long historical and cultural role in the re-gion; its protracted and vigorous espousal of the Arab cause; its politicalleadership; its size as the largest Arab state with a well-developed industrial
1/ "Al infitah" in Arabic.
-4-
and financial infrastructure and labor force. These elements combine to giveEgypt an unparalleled standing in the region, enabling it both to attract in-vestible funds from the oil-rich Arab countries, and to supply large amountsof skilled labor, which generate a considerable volume of remittances back toEgypt.
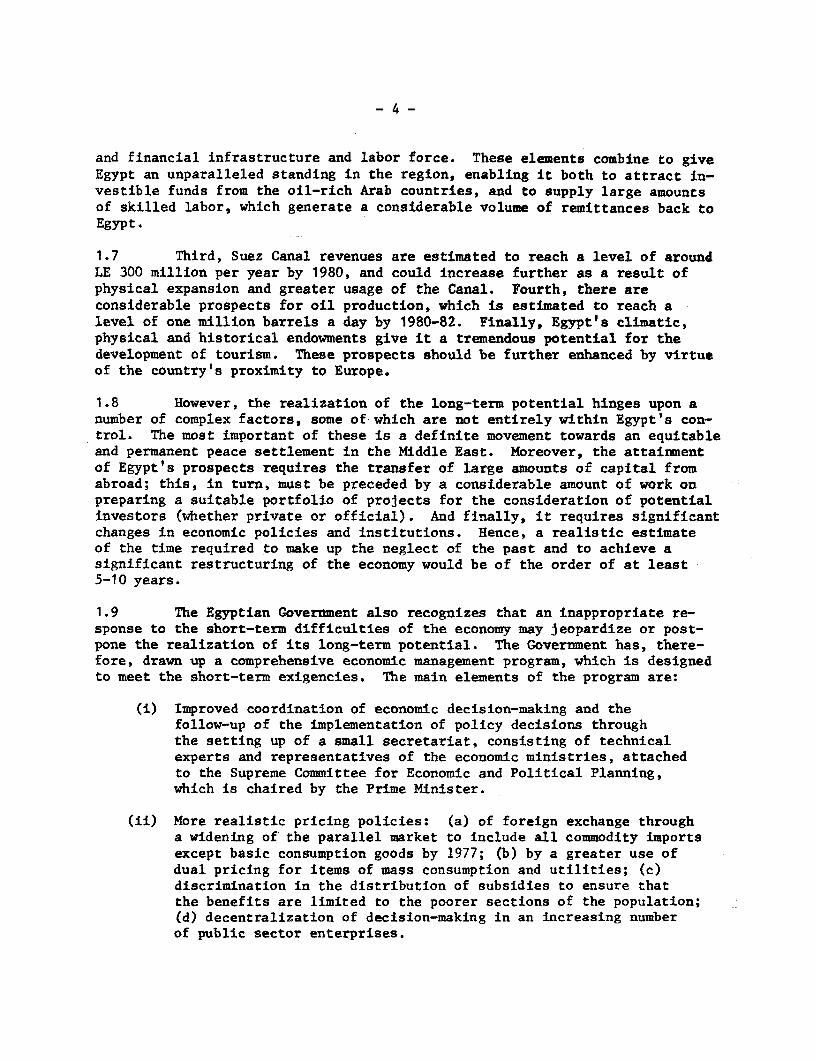
1.7 Third, Suez Canal revenues are estimated to reach a level of aroundLE 300 million per year by 1980, and could increase further as a result ofphysical expansion and greater usage of the Canal. Fourth, there areconsiderable prospects for oil production, which is estimated to reach alevel of one million barrels a day by 1980-82. Finally, Egypt's climatic,physical and historical endowments give it a tremendous potential for thedevelopment of tourism. These prospects should be further enhanced by virtueof the country's proximity to Europe.
1.8 However, the realization of the long-term potential hinges upon anumber of complex factors, some of which are not entirely within Egypt's con-trol. The most important of these is a definite movement towards an equitableand permanent peace settlement in the Middle East. Moreover, the attainmentof Egypt's prospects requires the transfer of large amounts of capital fromabroad; this, in turn, must be preceded by a considerable amount of work onpreparing a suitable portfolio of projects for the consideration of potentialinvestors (whether private or official). And finally, it requires significantchanges in economic policies and institutions. Hence, a realistic estimateof the time required to make up the neglect of the past and to achieve asignificant restructuring of the economy would be of the order of at least5-10 years.
1.9 The Egyptian Government also recognizes that an inappropriate re-sponse to the short-term difficulties of the economy may jeopardize or post-pone the realization of its long-term potential. The Government has, there-fore, drawn up a comprehensive economic management program, which is designedto meet the short-term exigencies. The main elements of the program are:
(i) Improved coordination of economic decision-making and thefollow-up of the implementation of policy decisions throughthe setting up of a small secretariat, consisting of technicalexperts and representatives of the economic ministries, attachedto the Supreme Committee for Economic and Political Planning,which is chaired by the Prime Minister.
(ii) More realistic pricing policies: (a) of foreign exchange througha widening of the parallel market to include all commodity importsexcept basic consumption goods by 1977; (b) by a greater use ofdual pricing for items of mass consumption and utilities; (c)discrimination in the distribution of subsidies to ensure thatthe benefits are limited to the poorer sections of the population;(d) decentralization of decision-making in an increasing numberof public sector enterprises.

- 5 -
(iMi) Better management of external resources and external debt by:(a) centralization of all iniormation relating to external debt;(b) establishment of a unit to analyze the implications of alter-native borrowing policies; (c) tightening up of procedures forthe foreign exchange budget; (d) imposing a ceiling on the use ofbanking facilities, and making a serious effort to reduce thembelow present levels by refinancing.
(iv) Outlining a clear set of economic priorities by: (a) theformulation of an indicative plan frame for 1976-80 withinwhich the Annual Plan for 1976 will be prepared; (b) thesubmission of quarterly reviews of the behavior of the lead-ing economic and social indicators to the Supreme Committeefor Economic and Political Planning.
1.10 The first steps in this program have already been taken. In Septem-her 1973 the Government had established a "parallel market" for certain classes-of transactions in foreign exchange, in which a devalued rate (about LE 1 -$1.70) of the Egyptian pound was applied. During 1974, this market was ex-panded by the introduction of the "own exchange imports scheme," wherebyEgyptians holding foreign exchange abroad were permitted to use their balancesto import commodities from a list of about 300 items. Imports under theparallel market and the own exchange import scheme are expected to accountfor about 15 percent of total imports in 1975. A comprehensive incentivepackage for foreign investment has been promulgated as Law No. 43 of 1974.
1.11 The Government has also adopted an active policy for managing debt.It has reduced the net use of bankers' facilities: in the first ten mont -
of 1975, new letters of credit opened under such facilities amounted to $1.5billion, compared with repayments of $1.74 billion. As part of its effortsin the debt management field, the Government is setting up a debt monitoringunit which will centralize all information relating to Egypt's indebtedness.
1.12 A number of reforms have also been instituted in other fields. Thesystem of dual pricing 1/ has been extended -- the commodities now covered arerice, fertilizer, sugar and tea, while kerosene has been taken off the rationlist. The Government has also undertaken some reforms in the banking sector:each bank is now allowed to offer a complete range of banking services; isgiven much more flexibility on personnel questions; and is permitted to com-pete with the joint venture banks that are being set up. Further reforms ofthe banking sector, including the abolition of the legal ceiling on interestrates, have been legislated. A revision of the taxation system is understudy and legislation for submission to Parliament is being drafted. TheGovernment has also enacted legislation to decentralize a considerable amountof decision-making in public industrial enterprises.
1/ See paragraph 2.13.

-6-
1.13 The system of planning, monitoring and policy coordination hasbeen strengthened. The Annual Plan for 1976 was submitted to Parliament inNovember, and was prepared in the context of a medium-term plan frameworkcovering the period 1976-80. The Ministry of Planning has also commenced aquarterly review of the economy, which is submitted to the Supreme PlanningCouncil of Ministers. Finally, a technical secretariat to coordinate im-portant economic policies is being established in the Prime Minister's office.
II. RECENT ECONOMIC DEVELOPMENTS
2.1 The behavior of the Egyptian economy in 1974 was largely dominatedby international events. To reiterate, the most important of these were:the slow progress towards peace in the Middle East; the steep rise in theprices of Egypt's main imports; the recession in the industrialized countriesof the free world and the consequent drop (towards the end of 1974) in thedemand for Egypt's major exports, especially of raw cotton; and the slowerdisbursements of concessional assistance and private external capital thanhad been envisaged. Consequently, Egypt's external accounts came undersevere pressure.
2.2 These events, of course, had repercussions on the rest of the econ-omy. The Government attempted to damp down the increase in the domestic priceof imported foodstuffs by a nearly threefold increase in net budgetary subsi-dies on the so-called "supply commodities". 1/ This reduced public savings,and induced the Government to borrow, directly and indirectly, large amountsfrom the banking system. The change in the composition of imports towards themore "essential" items decreased Government revenues from import duties. Thediversion of cotton exports to bilateral agreement countries reduced theearnings of urgently required convertible exchange. The shortfall in medium-and long-term external capital increased the pressures on the Government toresort to banking facilities; this, given the high interest rates whichprevailed during the year, significantly increased the effective costs ofdebt servicing and limited the room for maneuver of debt management policy.The behavior of the main macroeconomic variables is discussed below.
Gross Domestic Product
2.3 An analysis of Egypt's gross domestic product (GDP) is subject toa number of caveats, imposed by both conceptual difficulties and availabilityof data.
1/ The items of mass consumption, distributed by the General Authorityfor Supply Commodities.

- 7 -
2.4 The constant price series summarized in Table 1 shows that aftertwo years of expanding at over 4 percent annually, the economy slowed to agrowth rate of about 3.5 percent in 1973. The main factor responsible forthis was a fall in value-added in the mining sector of 9.8 percent (causedlargely by a falling-off in income generated in crude oil extraction) and adecrease of 14.7 percent in construction. Industrial growth in 1973 is esti-mated at 3 percent, and agricultural at 2.4 percent, i.e. roughly in line withthe increase in population (about 2.5 percent a year).
2.5 In 1974 the GDP is estimated to have increased in real terms by3.9 percent over 1973. The main increases were in manufacturing (6.6 percent)and construction (21.9 percent); the latter represented in part a recoveryfrom the war year of 1973, when value-added in the sector had fallen belowthe level in the previous year. The mining sector continued to show a fallin value-added (by 6.1 percent), while agricultural growth slipped to onepercent, i.e. considerably short of the growth rate of the population.
Table 1: GROSS DOMESTIC PRODUCT AT CONSTANT PRICES /1 /2(LE million)
1969/70 1970/71 1971/72 1972 1972 1973 1974(In 1969/70 prices) (In 1972 prices)
Agriculture 771.9 761.5 791.6 839.3 933.1 955.5 963.0Industry &mining 542.0 600.2 651.9 615.4 589.3 602.6 638.5
Construction 123.7 115.2 117.3 118.0 121.2 103.4 126.0Transport &communications 130.9 145.0 148.5 151.3 154.5 161.3 168.9
Trade and -
finance 229.0 237.5 253.1 264.4 280.0 297.2 311.0Other 755.3 811.2 820.6 867.9 878.4 940.6 1097.1
GDP at factorcost 2552.8 2670.6 2783.0 2856.3 2956.5 3060.6 3178.5
Growth of GDP (%) -- 4.5 4.1 3.5 3.9
/1 Calendar year data for some sectors may not be on a consistent basis withthe earlier fiscal year data.
/2 For details see Annex Table 2.2.
Source: Ministry of Planning.

- 8 -
2L6 The structure of the economy continued to be heavily influencedby the agricultural sector, which accounted for about 30 percent of the GDP.Another very important sector was "Other Services" -- consisting largely ofgovernment services -- which comprised nearly 35 percent of GDP, while theindustries and mining sector formed about 20 percent (Table 2.2 ofStatistical Appendix).
Performance of Major Sectors
2.7 Agriculture: The agricultural sector continued to be a major sourceof weakness during 1974, with value-added increasing by only one percent inreal terms. The most important reason for this was the decline in produc-tivity of all the major crops: the production per feddan of wheat in 1974was about 0.65 ardeb 1/ less than in 1973, of maize 0.70 ardeb, of millet(sorghum) 0.73 ardeb, of sugarcane about 0.5 ton, and of rice about 0.15 ton.Cotton was even worse, with declines in both productivity--of 0.17 metrickantar per feddan--and cultivated area--of 104,000 feddans. The (small) netincrease in the real value of agricultural production was brought about by(i) the increase in the output of the major crops (except cotton) as a resultof increases in their acreage (largely at the expense of cotton), and (ii)the increase in animal production (of 3.8 percent) and fish production (8.9percent). Industry: Value-added in the industry and mining sector increasedin real terms by nearly 6 percent. This conceals a fall in the output ofthe mining component, caused by a drop in the quantity of crude oil producedof over 900,000 tons, resulting from the closing down of the Suez Gulf oil-fields in the first quarter of 1974, following the war of October 1973. Theincrease in manufacturing output came mainly from the chemical industry,coal and coke products, the textile industry, and food and beverage industries.There were declines in the output of the artificial ghee (cooking fat), rubber,and cement industries. Transport and Communications: This sector showed anincrease in real value-added of 4.7 percent. All the components of the sectorcontributed to the rise, except railways, which suffered from a fall in thefreight carried of nearly 4 percent. Electricity: Electric power generatedincreased by nearly 15 percent above the level of the previous year. Powerutilization was also higher in 1974, by about 610 million KWH.
EmEoyment
2.8 The available data show an annual average growth in civilian employ-ment of about 2 percent to a total of 9.04 million in 1974. In a populationof nearly 37 million in 1974, the civilian labor force was estimated at about9.8 million, The level of employment in 1974 thus works out to about 92 per-cent of the civilian labor force. The increase in employment in 1974 (179,000jobs) is estimated to have covered only 70 percent of the increase in thelabor force in that year.
2.9 The main structural changes in employment have been the decline inthe share of agriculture (from 48.9 percent in 1969/70 to 46.6 percent in 1974)
1/ A unit of measurement that varies with the commodity; see inside frontcover.

and construction (from 4.7 percent in 1969/70 to 3.5 percent in 1974), andan increase in that of manufacturing and mining (from 11.1 percent in 1969/70to 12.7 percent in 1974). There has also been an increase in the share ofthe services sectors, from 35.3 percent in 1969/70 to an estimated 37.2 per-cent in 1974.
Table 2: EMPLOYMENT BY ECONOMIC SECTOR /1(in thousands of persons)
1969/70 1970/71 1972 1973 1974
Agriculture 4048.3 4056.9 4133.7 4163.8 4212.4Industry & mining 916.1 1052.8 1086.9 1112.4 1149.5Construction 387.9 365.8 348.4 302.3 315.2Transport &communications 347.2 374.5 385.5 401.8 405.0Trade and finance 801.7 815.6 828.9 864.3 883.2Other 1773.5 1840.4 2027.3 2115.1 2073.5
Total 8274.7 8506.0 8710.7 8859.7 9038.8
/1 For details see Annexure Table 1.1.
Source: Ministry of Planning.
2.10 It is difficult to quantify the extent of underemployment and actualunemployment. There does not appear to be any appreciable degree of unemploy-ment in the rural areas during the peak seasons, but seasonal and regionalunderemployment may be quite significant. In the urban areas, and particularlyin the services sector, there appears to be a considerable amount of under-employment and low productivity employment. This is accentuated by the driftof labor towards the towns. The sensitive problem of unemployment of educatedgroups has been partially defused by automatically providing jobs in thegovernment sector to all university graduates, but at the cost of increasingunderemployment in this sector. A much more liberal attitude towards emigra-tion, especially to the neighboring Arab countries, has also contributed toeasing the employment problem.
Wages
2.11 The Egyptian wage structure rests on legislation establishing mini-mum wage rates -- currently LE 12 (about $31) per month -- in both the publicand private sectors. These minimum wages are supplemented by fringe benefits,bonuses, and profit sharing, which are particularly important in the publicindustrial sector.
2.12 Wage increases are not formally linked to increases in productivity,but tend to be awarded to help keep up with the rising cost of living. Thus,

- 10 -
during the past two years, when price rises had accelerated, wage increaseswere more readily granted. The rise was especially large in 1974, and wasparticularly marked in some sectors, e.g., construction. However, as appearsfrom Table 3, these rises were insufficient to prevent a fall in averagereal wages. If the more realistic (unofficial) estimates of the inflationrate are considered, there is little doubt that the squeeze was quite marked.
Table 3: AVERAGE WAGES AND SALARIES BY ECONOMIC SECTOR /1(LE at current prices)
1969/70 1970/71 1972 1973 1974
Agriculture 53.0 55.6 57.3 60.5 65.1Industry & Mining 191.8 248.2 257.1 287.1 297.0Construction 184.6 190.5 198.6 222.6 233.2Transport &Communications 245.6 260.3 266.7 279.7 291.4
Trade & Finance 158.0 162.7 182.0 190.1 195.5Other 283.1 299.4 305.9 320.0 366.9Overall Average 142.6 157.3 167.5 179.7 195.2
Real Wages /2 142.6 153.6 158.5 156.5 153.9
Annual Change (Z) + 7.8 + 3.2 - 1.2 - 1.6
/1 Computed from Annexure Tables 1.1 and 9.1./2 Deflated by Consumer Price Index, with 1969/70 = 100.
Source: Ministry of Planning.
Prices
2.13 Largely as a result of controls, Egypt has experienced relativelystable prices for many years. The picture, however, began to change rapidlyin 1973. This was chiefly due to the rising import prices for food andother items, and the strains and dislocations caused by the October war.The consumer price index rose by 7 percent, with the food and beveragescomponent registering an increase of 11 percent. The authorities sought todamp down the increases by reducing the size of the subsidized bread and byadopting a "two-tier" price system for some commodities. Thus, for example,the price of sugar in excess of the basic ration was raised from 15 piastersa kilogram to 25 piasters a kilogram. However, the cost of maintainingstable domestic prices for the supply commodities in the face of risingimport prices rose substantially: the General Authority for Supply Commoditiesregistered a trading loss of LE 89 million in 1973 compared with LE 11 millionin 1972.

- 11 -
2.14 This trend was intensified in 1974. The consumer price index
(shown below) rose by 10 percent, with the food and beverages subindex in-creasing by about 15 percent. Mtuch of the increase in the latter was causedby the rapid spurt in prices of the non-controlled items, such as vegetables,fruits, and livestock products. The cost of subsidizing domestic prices alsorose sharply: the trading loss of the General Authority for Supply Commodi-ties rose to BE 330 million. Moreover, it was widely felt that the officialprice indices greatly understated the degree of inflation; unofficial esti-mates put the general price rise in 1974 at around 20 percent.
Table 4: CONSUMER PRICE INDEX FOR URBPN POPULATION /1(1966/67 = 100)
End of period 1969 1970 1971 1972 1973 1974
Food and beverages 109.9 115.7 120.2 126.0 139.9 161.3
Housing 109.1 108.5 108.5 105.7 106.2 106.5
Furniture and otherdurables 96.0 96.7 97.0 97.4 98.5 109.0
Clothing 102.5 101.7 103.7 107.7 117.8 129.9
Transport andcommunications 119.8 119.8 119.8 121.4 123.1 123.1
Services 108.6 113.8 117.0 119.7 121.8 127.3
Personal expenses 114.3 114.4 114.6 114.8 116.0 120.4
All items 109.6 112.8 115.9 119.1 127.7 141.0
/1 For details (including weights) see Annexure Table 9.2.
The Domestic Budget
2.15 Preliminary budget figures for 1974 show a deficit of BE 653 mil-lion compared with BE 386 million in 1973. On the basis of monetary data,it appears that financing of the deficit by the banking system amounted toBE 320 million. The increase in the budget deficit between 1973 and 1974is largely explained by the 270 percent increase in the cost-of-livingsubsidies, and the fact that current revenues increased by only about 12percent. The latter figure may understate the taxes actually levied; customsduties collected (the principal revenue item) increased by only 16 percentin a period when import value doubled, as a result of substantial arrearsin payments. Also worth noting is a 20 percent increase in transfers to thebudget from public enterprises (principally the profits of the Cotton GeneralOrganization).

- 12 -
Table 5: SUMMARY OF STATE BUDGET(LE million)
…---- 1974 …1972 1973 Prelim. 1975
Actual Actual Budget Actual Budget
its 903 1018 1196 1143 1543
Central Govt Revenues 664 694 799 778 1060Local Govt Revenues 58 60 67 48 88Public Economic Sector 181 264 330 317 395
Current Expenditure 792 953 1319 1213 1713
Central Govt 688 714 809 733 889Local Govt 42 51 63 50 88Public Authorities' Deficit 45 165 408 394 86Public Organisations' Deficit 17 23 20 17 8Subsidies --- --- 19 19 642
Current Account surplusor deficit (-) 111 65 -123 -70 -170
Investment expenditure 414 451 520 583 757
Overall Deficit (-) -303 -386 -643 -653 -927
Total Financing 303 387 644 653 927
External borrowing (net) 18 51 102 79 -10Domestic financing (net) 285 335 541 574 937
For details and notes see Annexure Table 5.1.
2.16 The 1975 budget projects a large deficit (LE 927 million), despitea 35 percent increase in current revenues (which in turn arises principallyfrom a doubling of revenues from customs duties, including collection ofarrears). Estimates based on revenue collections in the first half of 1975indicate that tax receipts are running at the budgeted amounts, except forimport duties, where arrears of about LE 100 million have accumulated.These arrears will have to be cut at least by half, if the budgeted targetfor tax collections is to be realised. Direct bank financing of the budgetdeficit is projected at LE 125 million, but total lending by the bankingsector to the Government may exceed this level.

- 13 -
2.17 In short, the budgetary outturn durine 1975 will remain under con-siderable strain. Much of the deficit will he accounted for by the weight ofconsumption subsidies, but given their importance in maintaining the real in-comes of low-income groups and the Government's commitment to this goal, areduction is feasible only over a period. However, some rationalization,price adjustment, and the elimination of certain anomalies should be possi-ble, so as to reduce subsidies and ensure that they go only to the poorersection of the population (see para 3.24). A summary of the budget ispresented above; public sector policy issues are addressed in Chapter III.
Balance of Payments
2.18 Egypt's balance of payments came under great pressure in 1974. Inconsiderable measure, this stemmed from international developments that wereoutside the Government's control, and have been described earlier. (See para-graph 2.1). The upshot was that despite a large increase in grants from Arabcountries, Egypt resorted to substantial short-term borrowing abroad, chieflyin the form of bank credit facilities.
2.19 Egypt's deficit on its commodity trade amounted to $1,754 million(BE 685 million) in 1974, more than twice that experienced in 1973. Exportsof goods increased by 67 percent to $1,674 million (hE 654 million), butfell far short of the increase in imports. Egypt's balance of paymentsdifficulties were further compounded by a slow disbursement of medium- andlong-term loans committed during 1973 and 1974; this resulted in a net out-flow of $132 million (BE 52) million on medium- and long-term capital.Substantially increased Arab grants amounting to $1,217 million (BE 475million in 1974) were inadequate to cover the overall deficit on the currentand capital accounts of $511 million (LE 199 million), which was met by theuse of bank credit facilities. Net utilization of bankers' facilities isestimated at $583 million (LE 228 million) in 1974.
- 14 -
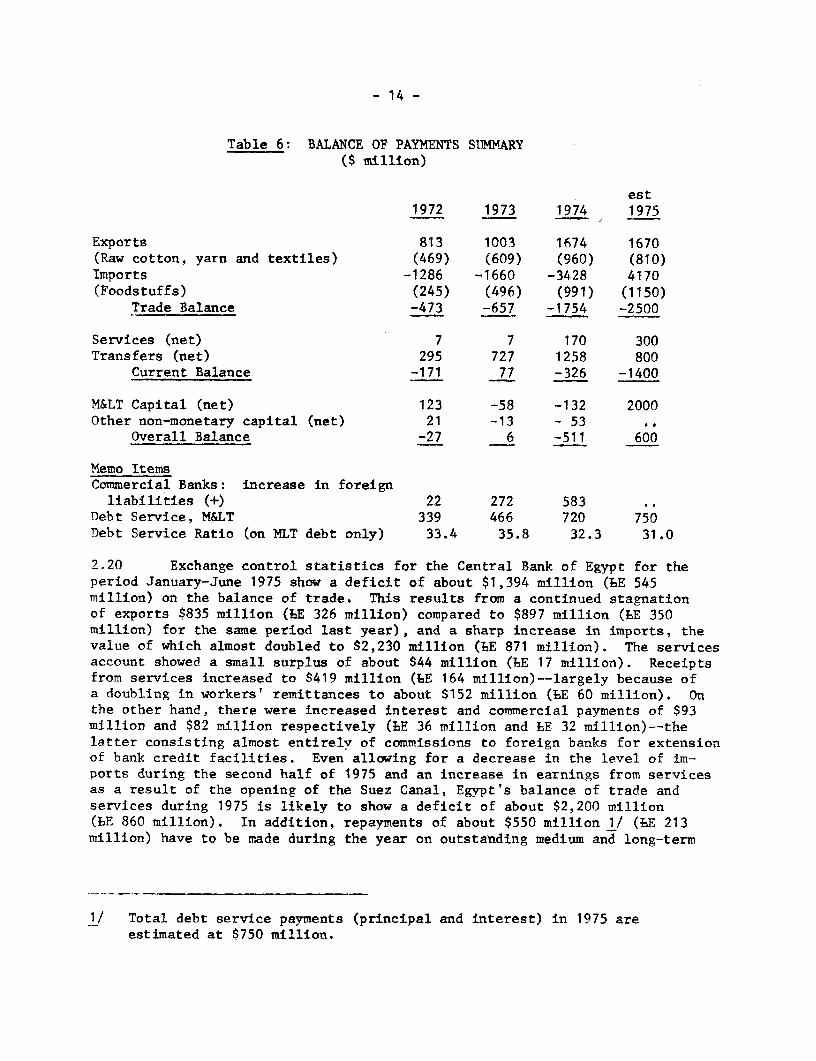
Table 6: BALANCE OF PAYMENTS SUMMARY($ million)
est1972 1973 1974 1975
Exports 813 1003 1674 1670(Raw cotton, yarn and textiles) (469) (609) (960) (810)Imports -1286 -1660 -3428 4170(Foodstuffs) (245) (496) (991) (1150)
Trade Balance -473 -657 -1754 -2500
Services (net) 7 7 170 300Transfers (net) 295 727 1258 800
Current Balance -171 77 -326 -1400
M< Capital (net) 123 -58 -132 2000Other non-monetary capital (net) 21 -13 - 53
Overall Balance -27 6 -511 600
Memo ItemsCommercial Banks: increase in foreignliabilities (+) 22 272 583
Debt Service, M< 339 466 720 750Debt Service Ratio (on NLT debt only) 33.4 35.8 32.3 31.0
2.20 Exchange control statistics for the Central Bank of Egypt for theperiod January-June 1975 show a deficit of about $1,394 million (LE 545million) on the balance of trade. This results from a continued stagnationof exports $835 million (LBE 326 million) compared to $897 million (LE 350million) for the same period last year), and a sharp increase in imports, thevalue of which almost doubled to $2,230 million (LBE 871 million). The servicesaccount showed a small surplus of about $44 million (EE 17 million). Receiptsfrom services increased to $419 million (LE 164 million)--largely because ofa doubling in workers' remittances to about $152 million (ME 60 million). Onthe other hand, there were increased interest and commercial payments of $93million and $82 million respectively (BE 36 million and LE 32 million)--thelatter consisting almost entirely of commissions to foreign banks for extensionof bank credit facilities. Even allowing for a decrease in the level of im-ports during the second half of 1975 and an increase in earnings from servicesas a result of the opening of the Suez Canal, Egypt's balance of trade andservices during 1975 is likely to show a deficit of about $2,200 million(BE 860 million). In addition, repayments of about $550 million 1/ (LE 213million) have to be made during the year on outstanding medium and long-term
1/ Total debt service payments (principal and interest) in 1975 areestimated at $750 million.

- 15 -
loans and suppliers' credits. The total projected deficit is thereforelikely to be about $2.8 million (BE 1.1 billion) and is expected to befinanced largely through Arab grants, cash and commodity loans, project loansand suppliers' credits. Long-term loans from Arab countries and Iran total-ling $1,600 million have been announced (see paragraph 2.26). As a result ofthe capital inflows the overall balance is likely to show a surplus of about$600 million (BE 235 million), which is expected to be used largely to reducebank credit facilities.
External Assistance
2.21 Egypt had been the beneficiary of substantial amounts of westernexternal aid until the mid-1960's. Thereafter, new commitments of Westernassistance practically ceased: the gross inflow of medium- and long-termcapital fell by nearly 50 percent immediately after the 1967 war. Althoughaid levels gradually rose again, net inflows from western countries averagedonly $10-12 million (BE 4-5 million) annually in medium- and long-term capitalover the five years FY1968-1972; in fact, amortization payments exceeded dis-bursements by about $7 million (BE 3 million) in 1973. During the period1968-1973, non-military aid from Eastern countries (estimated in excess of$1,200 million (LE 470 million)) financed the bulk of Egypt's development.These inflows, however, declined significantly in 1974 and new commitmentsin this year dropped to a relatively low level of $76 million (LE 30 million).On the aggregate, slow disbursements of medium and long-term aid resulted ina net outflow on this account, to both Eastern and Western bloc countries,of $132 million (LE 52 million) in 1974. Drawings on suppliers credits ex-ceeded repayments by about $21 million (BE 8 million); disbursements onmedium- and long-term loans amounted to about $249 million (LE 97 million)while repayments of such loans amounted to $402 million (LE 157 million).In addition, interest payments (mainly on bank credit facilities) amountedto about $156 million (LE 61 million).
2.22 Grants received from Arab countries in 1974 amounted to $1,217 million(BE 475 million) and financed about 36 percent of Egypt's merchandise imports.Of this, $996 million (BE 389 million) was received in convertible foreignexchange while the rest was in the form of petroleum grants. A major devel-opment during the year was the renewal of substantial aid commitments fromOECD countries.
16 -
Egypt's external debt profile worsened in 1974, almost entirely asa suult of its borrowing extremely short-term funds at high rates of interest(in the form of bank credit facilities). Bank credit facilities utilized(inciuding undisbursed) amounted to $2,700 million (BE 1055 million) at theend of 1974, compared with about $1,127 million (BE 440 million) at the endof. 1973 Outstanding debt to correspondent banks overseas (i.e. disbursedamounts or letters of credit encashed by these institutions) amounted to$1,082 million (LE 423 million) compared with $499 million (BE 195 million)at the end of 1973. The use of this type of financing created enormousexternal liquidity problems for Egypt in 1975, during which about $2,050million (LE 800 million) of repayments on these credits are expected tofaell due.
2.24 Egypts non-military medium- and long-term debt outstanding and dis-bursed at December 31, 1974, is estimated at $2,760 million (BE 1078 million),
a., roughly the same level as the previous year. The composition of thisdebt changed, however, with medium- and long-term loans increasing slightlyto $1,769 million (LE 691 million) and amounts owed as suppliers t creditsand balance of bilateral accounts showing significant declines to $474million and $417 mi-Illion (LE 185 million and BE 163 million), respectivelv.In addition, $100 million (6E 39 million) of medium-term debt was contractedfrom financial institutions. At end 1974, the USSR was Egypt's principalcreditor, followed in importance by Germany, Kuwait, the United States,Australia and Italy. IBRD/IDA debt comprised about 1 percent of the total.Of the reported external public debt at end 1974, about 31 percent was dueto be repaid within two years, 40 percent within three years, and 46 percent-ithin four years No reliable estimates of military debt are available,but it is understood that Egypt is seeking a rescheduling of service pay-ments on such debt.
S a5 During 1575, the Egyptian authorities embarked upon a four-prongedstrategy to place the country's external accounts on a sounder basis. Thefirst step -was to undertake a 'holding action' to stop outstanding foreignbank c.redit to Egypt spiralling even higher (and worsening the liquidityposition) by placing a 'one-to-one' limit on the use of banking facilities.Thus ghe amount of new letters of credit opened against bankers' facilitiesan any g_ven period could not exceed the amount of cash repayments made onsuch faoilties falling due in that period. In practice, this meant somepostporevant of future imports required by Egypt in the absence of othersources o. financing. Simultaneously, the Egyptian Government sought theaid of Arab and other states for substantial medium and long-term loans onconcessionary terms which would constitute a 'fund' to be held in the CentralBank to meet £urther payments due on bankers' facilities, and which would helpto provide a comprehensive solution to Egypt's liquidity problems. Third, anappeal was launched to Western countries to provide medium and long-term aidin a quick-disbursing form (such as program loans and commodity assistance)in order to finance Egypt's essential imports. Finally, the Soviet Union wasapproached for a rescheduling of debt service payments.

-17
2 C 26 E_xcevt in the rshedAing o .. debt to the Soviet Union, theGoverment's ef ort- hava largelv been au.ccessful. Control was successfullyexercised over th use oten.ew nig facilties: during the periodJanuary-October 1 9 75, new etters of credit authorized against banking fa-cilities amounted to $1.`:J -ul-ion (LE 488 million) or about 72 percent ofthe total repayments co'. $1735 million (LE 677 million) which were made inthis period for banking iac2ities previously utilized, Long-term loans,at concessionary terms, totalling $1600 million (LE 625 million) -- $500million from A e.it, $600 ailJ.o-n frr Saudi Arabia, $200 million each fromIran and Abu Dhabi9 an $100 mQOillion ftcm Qatar -- 'ave been announced todate. In additiioun OECD countries tieve ommitted about $650 million incalendar 1975 as concessional aid. Discussions with the USSR on a debtrearrangement are still going on.
2 27 Egypt 's external accounts have accordingly been strengthened. Thelong-term Arab loans have not only allowed Egypt to repay outstanding debt -
arrears on suppliers' credits have been cut down from six months to about twomonths, while arrears on ban],king facilities (which were about one month inJune 1975) have been eliminated -- but also enabled it to reduce the use ofbank credit facilities. The Cerment's policy is to continue this trend.
Planning and Priorities
2.28 The first attempt at comprehensive development planning in Egyptwas a Five-Year Plan which was issued in 1960 and covered the period July 1960to June 1965. A Second Five-Year Plan for the period 1965/66 to 1969/70 wasprepared, but never implemented. Owing largely to the uncertain situationcreated after the war of 1967., the system of medium2term planning was, ineffect, abandoned and replaced by annual plans. A fresh start towardslengthening the planning horizon was made in 1974 with the adoption of an18-month Interim Plan, and work has commnenced on a Five-Year Plan for theperiod 1976-80.
2.29 The Interim Plan runs from July 1974 to December 1975; for 1975 ithas the following priorities:
(i) reconstruction in the Suez Canal area;
(ii) completion of ongoing projects;
(iii) renewal, balancing, and better utilization of existing indus-trial capacity;
(iv) investment in new "strategic" projects, i.e. those consideredvital to the needs of the public, or those whose output formsan important input into other sectors; for example, fertilizersand cement..
- 18 -
2.30 Compared with previous Annual Plans, that for 1975 marks an impor-tant change as regards both strategy and size. The strategy for the 1975 Planreflects three broad features. First, it is an interim plan, to bridge theperiod of abnormal conditions that arose after the war of October 1973 and afuture time when planning for the usual quinquennial periods could be resumed.Second, it is the first attempt to give an operational meaning to the "OpenDoor" economic policy. The Plan thus assigns a much greater role to theprivate sector -- private investment in 1975 is projected at almost threetimes the level of the previous year -- and foreign capital. Third, in aneffort to rapidly increase output, it concentrates largely on short-gestationprojects, such as those for balancing and modernization, and the fuller useof existing industrial capacity. This emphasis on the so-called "productive"sectors does, however, lead to some neglect of the social sectors.
2.31 The Plan aims at raising the GDP (at factor cost in 1973 prices)by 9.2 percent. The major contributions to this growth are projected tocome from the commodity sectors, which are estimated to increase by 10.2percent. Within this group the fastest increases are forecast for construc-tion (51.4 percent), electricity (24.1), manufacturing (11.1) and petroleum(14.4); agriculture is expected to grow only at 3.7 percent. The distribu-tion sectors -- comprising transport and communications, and trade andfinance -- are projected to grow at 10.9 percent. The service sectors areprojected to grow at only 6.3 percent.
2.32 The 1975 Plan projects total investment at BLE 1465 million. Thisis made up of fixed capital formation of BE 1155 million (public sector LE1057 million, private sector LE 98 million), and a change in inventories ofBE 310 million (3E 40 million in the business sector, and BE 270 million of"strategic" commodities).
2.33 The distribution of investment follows the order of prioritiesdiscussed above. The bulk of investment (34 percent) is allocated to thetransportation and Suez Canal sector, followed by industry and mining (19.7percent), and housing (14.1 percent). Education, health, and other servicesare allocated a total of only 6.2 percent. Within the total allocations, theshares of the public and private sectors, of course, differ appreciably.Thus, the major portion of private sector investment (54 percent) is destinedfor housing, while another 32 percent is earmarked for industry and mining.The details of the sectoral distribution of fixed investment are shown inTable 7. Estimates based on preliminary figures for the first half of 1975indicate that investment during the year may amount to about 75-80 percentof the planned level.

- 19 -
Table 7: SECTORAL DISTRIBUTION OF PLANNED INVESTMENT, 1975(LE million)
PercentagePublic Private Total of Private
Sector Value % Value % Value % to Total
Agriculture 45.1 4.2 5.0 5.1 50.1 4.3 10.0Irrigation and Drainage 42.3 4.0 1.0 1.0 43.3 3.7 2.3Industry and Mining 196.3 18.6 31.1 31.5 227.4 19.9 9.7Petroleum 82.4 7.8 - - 82.3 7.1 -Transportation and
Communication, Storageand Suez Canal 388.2 36.8 4.8 4.9 393.0 34.0 1.2
Housing 109.1 10.3 53.0 54.0 162.1 14.1 32.7Others 192.8 18.3 3.3 3.5 196.1 16.9 6.5
Total 1056.2 100.0 98.2 100.0 1154.4 100.0 8.5
For details see Annexure Table 2.3.
2.34 The sectoral distribution of investment and the Plan strategy ofconcentrating on construction, the completion of ongoing projects, and thebetter use of available capacity, is expected to reduce the foreign exchangecomponent of fixed investment from about 54 percent in 1974 to 40.5 percentin 1975. The proportion of foreign exchange in total fixed capital formationvaries from 76 percent for construction machinery, and 67 percent for petro-leum to less than 9 percent for education and 11 percent for health. Itshould be noted that while construction machinery has the highest foreignexchange component, in absolute terms the sector's requirements are relativelymodest and account for only 4.5 percent of the total foreign exchange portionof the Plan. The details of the foreign exchange element are set out inTable 8.

- 20 -
Table 8: FOREIGN EXCHANGE COMPONENT OF PLANNED INVESTMENT, 1975(EE million)
Foreign Exchange PercentageComponent of Total
Total % of Total ForeignInvestment Value Investment Exchange
Agriculture 50.1 8.1 16.2 1.7Irrigation and Drainage 43.3 7.0 16.2 1.5Industry and Mining 227.4 107.6 47.3 23.0Petroleum 82.4 55.3 67.1 11.8Communication & Transporta-tion, Storage and Suez CanalCanal 393.0 129.9 49.1 41.2
Housing 162.1 22.1 13.6 4.7Others 196.1 75.0 38.2 16.1
Total 1154.4 468.0 40.5 100.0
For details, see Annexure Table 2.4.
2.35 The financing of the foreign exchange requirements shows a predomi-nant reliance on flows from free currency sources (87.3 percent). This canlargely be traced to the objectives of the Plan, particularly its emphasison construction, the needs of which were never incorporated in any bilateralpayments agreement. The Egyptian authorities hope that some part of thebilateral financing can be renegotiated to cover the changed priorities thatthe country has set for itself.
2.36 The Plan estimates that domestic savings of nearly LE 366 millionwill become available in 1975, compared with LE 248 million in the previousyear. This represents an increase of about 47 percent over the preliminaryestimate for 1974, but in terms of the requirements of investment in 1975it constitutes barely a quarter. Owing to the increase in the subsidy bill,even this figure may not be attained. The overwhelming amount of investmentwill perforce have to be financed through an inflow of external capital.
2.37 The major increases in domestic savings are projected to come fromthe private sector -- private savings are expected to more than double overthe previous year's level - and from larger surpluses in the public businesssector. The current transactions of the Government will remain in overalldeficit, even though a surplus on the Administration Budget has been fore-cast. The creation of this surplus depends to a considerable extent onwhether the actual collections of import duties come up to the expectationsof the authorities. The sources of domestic savings, as shown in the Plan,are as follows:

- 21 -
Table 9: SOURCES OF SAVINGS, 1975
LE million
Household Savings 54.0Surplus of Insurance Funds 275.0Surplus Transferred to Government 294.0Other Surpluses of Business Sector 140.6Private Sector 98.0Deficit of Government Service Sector -495.9
365.7
2.38 The Plan projects the external capital inflow at nearly LE 1100million, i.e. at 75 percent of the investment requirements in 1975. Itshould be noted that this figure does not include LE 250 million of unre-quited transfers from Arab countries. When this is taken into account, itbecomes extremely clear that Egypt's investment strategy for 1975 hinges al-most completely on obtaining funds from abroad. It also underlines themagnitude of the effort that Egypt will have to make in order to reduce thereliance on external sources of financing in the future.

- 22 -
III. POLICY IMPLICATIONS OF THE NEW ECONOMIC STRATEGY
3.1 The OctberWorkdng Paper spelt out the logic of a new economicstrategy; putting this into effect has a number of implications for policy.Moreover, there is a likelihood that the quest for the goals adumbrated inthe new strategy will give rise to competition with other objectives that theEgyptian authorities hold to be of equal moment. The most important themesfor policy and the potential areas of conflict are discussed in this chapter.
The Balance of Payments
3.2 (a) Exchange Rate: In the current situation, attention will per-haps have to be given first to the exchange rate. It had been apparent forsome time that the official exchange rate of bE 1 = $2.56 overvalued theEgyptian pound; hence, in September 1973 the authorities announced thecreation of a "parallel foreign exchange market," in which exporters ofspecified commodities were given a premium of 50 percent over the officialrate, thereby giving rise to an effective exchange rate for exports of aboutbE 1 = $1.70. The parallel market was further extended in 1974 by the intro-duction of the "own exchange import scheme," whereby Egyptians holding foreignexchange abroad could import, without requiring a license, goods (from a listof about 300 items) up to a value of BE 5,000. (For larger amounts a licensewas necessary, but required only a minimum of formalities,) The rapid growthof imports under this scheme, together with other evidence, indicates thatthe implicit exchange rate conferred by the sale of the imported item 1/probably offers a much greater premium than even the parallel market rate.It appears, therefore, that the degree of overvaluation of the officialexchange rate is very considerable. Moreover, it will be noted that thepresent schemes lead to a multiplicity of rates, some of which (i.e. thosefor the own exchange imports) are different for each transaction.
3.3 The Government is aware of the distortions that are caused by theexistence of the overvalued rate. However, it feels that an immediatedevaluation of the pound would not be the most appropriate response. Thisargument is based on the grounds that Egypt's exports comprise a large elementof items that are price-inelastic, (the "traditional" cotton-based exports)and go to the Eastern bloc countries (about 64 percent of Egypt's exports in1974 were to the bilateral agreements area), while most of Egypt's importsconsist of necessities (and hence cannot be curtailed) which come mainly fromthe free currency bloc -- about 74 percent of imports in 1974 originated insuch countries. Thus, in the short-term, the orthodox measure of a devalu-ation and reunification of the exchange rate might only worsen the foreignexchange situation.
1/ There is an element of uncertainty in this transaction, as the implicitexchange rate depends upon the sale price of the commodity.

- 23 -
3.4 This concern of the authorities is not entirely unwarranted. How-ever, if the economy is to be opened up to foreign competition, a start mustbe made towards compelling the exchange rate to reflect the realities of thesituation, so as to avoid a misallocation of resources. Moreover, the presentcomplexity of the exchange rate structure can make a meaningful analysis ofpolicies and projects very difficult, can encourage speculation, lead to adistortion of priorities, and produce unknown (and unintended) divergencesbetween the social and private profitability of some activities. As a firststep towards rationalizing the exchange rate, therefore, the authorities havedecided to gradually increase the scope of the parallel market and the "ownexchange"! scheme so as to encompass all transactions, other than the importof the basic items of mass consumption.
(b) Direction of Trade: Even a gradual adjustment of the exchangerate would be a major element in improving the allocation of foreign exchangeresources, and thus ameliorating the balance of payments position. However,there are some important structural constraints on Egypt's foreign trade andbalance of payments that will have to be tackled directly. One such restraintis the direction of Egypt's external trade, and particularly the imbalance withthe Western countries.
3.5 As pointed out above, the bulk of Egypt's exports go to the Easternbloc countries under various bilateral agreements, while most of her importsoriginate in the convertible currency areas. Egyptian policy is to shiftan increasing portion of its exports towards these areas, but this diversionhas been fairly small--the share of the convertible currency areas in exportsin 1974 rose to 36 percent from 33 percent the year before. The share ofimports, however, increased to 74 percent from 62 percent in 1973.
3.6 In part, the origin of imports is explained by the greater creditfacilities offered by the Western countries; in part, by the availability ofitems required by Egypt. The more difficult problem is the stimulation ofexports to these countries. The major factor appears to be that the qualityof much of Egypt's manufactures is acceptable to the Eastern bloc, but not toWestern markets; nearly 71 percent of total manufactured exports went tobilateral agreement countries in 1974. Moreover, the effective depreciationof the exchange rate (through the creation of the parallel market) was notof much help in redirecting private sector industrial exports--over 90 percentof these still went to the bilateral agreement countries in 1974.
3.7 This raises important questions for future export policy. Egypt'sdevelopment strategy casts industry, and especially a sophisticated engineer-ing goods sector, in the role of a spearhead in the thrust towards highergrowth rates of both production and exports. But for these goods price com-petitiveness is not enough by itself. Other important considerations arequality, design, reliability, running cost, regular availability of spares,and the extension of credit to potential buyers. Thus, a major structuralchange in the direction and composition of exports will require a consider-able amount of additional measures, quite apart from the rationalization ofthe exchange rate. The successful implementation of such a comprehensive

- 24 -
policy package, even if vigorously pursued, can be expected to occupy atleast the next five year plan period. Moreover, as Egypt will be aimingchiefly at the rich Middle East market, the improvement of quality willhave to be a continuing process.
3.8 (c) Debt ManaRement Policies: The success of the "open-door" policydepends to a considerable extent on Egypt's ability to attract inflows offoreign capital. In addition to providing legal safeguards for foreign in-vestment, Egypt will have to adopt a carefully articulated policy for manag-ing its external debt and for improving the time profile of debt repayment.At present, the structure of Egypt's external debt contains a large elementof short-term maturities (as short as 180 days), chiefly bank credit facili-ties; these reached a particularly high level (around $2.7 billion or LE 1.06billion) 1/ during 1974. The prevalence of this form of liability greatlyreduces the scope for maneuver in the foreign exchange budget by increasingthe liquidity requirements of the economy--it is estimated that about $2050_million (LE 800 million) of bankers' facilities would fall due for repaymentin 1975, which is more than the total projected export earnings for that year.
3.9 It appears that the authorlties have recently had a notable successin starting to bring this debt within manageable limits. The first step wasto limit the creation of new short-term debt in any period to the amournt ofrepayments made in that time. However, as the main element in its policy ofreducing short-term debt, the government has obtained cash loans amountingto about $1600 million (LE 625 million), on medium-term and concessionalconditions, from Saudi Arabia, Kuwait, Iran, Abu Dhabi, and Qatar. Theseloans are to be used largely to "fund" the bankers' facilities, and thesuccessful completion of this exercise should give Egypt much more flexibil-ity in its foreign exchange budgeting.
3.10 In order to maintain its creditworthiness, Egypt will have to con-tinue this trend. In addition, it would be helpful if some guidelines werealso formulated for borrowing on medium- and long-term; for example, in termsof the grant element, the minimum grace period, etc. This would help todiscriminate between the various loans being offered, and might also serve todecrease the reliance on suppliers' credits and lengthen the repayment profile.At present, nearly 40 percent of Egypt's external (medium- and long-term) debtis repayable within 3 years, and 46 percent in 4 years.
Price_Systtenm
3.11 The Egyptian economy is characterized by controls over prices atalmost all levels. These controls encompass the prices of inputs sold to thefarmers, the prices paid to the farmers by the agricultural cooperatives, theprices at which raw materials are sold to government-owned industries, andthe prices of final output produced by the latter. Much of the private manu-facturing sector is also formally subject to price controls, although there
1/ Including undisbursed amounts.

- 25 -
is some evidence that in recent years these have been honored more in thebreach than in the observance. In addition, a number of items of mass con-sumption -- the so-called "supply commodities" -- are also sold at controlledprices, (in some instances up to a specified quantity). Rent controls applyto housing, and much of the transportation system, of course, is governmentoperated. Excluded from controls are minor agricultural products, some partof the major crops, and products of small industries and handicrafts.
3.12 The price system, therefore, performs only a limited economic role,and one that is not in consonance with the new development strategy chartedout by Egypt. The "open-door" policy will entail a number of importantchanges in the structure and working of almost all aspects of the pricemechanism.
3.13 A major result of past price policy has been to cause agriculture'sterms-of-trade with industry to deteriorate, largely as a means of transfer-ring resources to the latter sector. This transfer was brought about throughan indirect tax on agriculture, which was effected by fixing producer pricesfor the major exported crops (cotton and rice) at low levels. A second majorelement of policy has been the maintenance of a low consumer price level forbasic foods, especially wheat. Fixing the prices of these commodities at theretail level and then allowing them to work their way back to the producerlevel, combined with the administered price of cotton and inputs, effectivelydetermined the cost and profitability relationships that dominate agriculturalproduction, especially in the "old"' lands 1/ which account for the overwhelm-ing part of agricultural output. Prices for livestock products, berseem(Egyptian clover), fruits and vegetables were left uncontrolled, and haveregistered rapid rises.
3.14 In the face of these large discrepancies in income-earning possi-bilities, there have been persistent pressures to alter the government-imposedcropping pattern so as to increase the area under fruits, vegetables, andberseem. 2/ Moreover, because of the high price of berseem, farmers havestretched out the short-season berseem crop to obtain a second cutting beforeplanting cotton. This delays cotton planting and increases the susceptibilityof cotton to insects and pests. Thus, while the farmer is induced, as aresult of the pricing policy, to move out of traditional crops, he is con-strained in doing so by the imposed cropping pattern and the lack of inputsfor such a move. On the other hand, while he is required to grow traditionalcrops, his inducement to do so is limited because of the fixed, low prices.These two competing forces are an important explanation for the slow growthof yields in Egyptian agriculture in the past decade.
1/ Those farmed prior to 1960.
2/ Once a permanent orchard is established, a farmer is freed from therequirement to follow the required cropping pattern on that land.
- 26 -
3.15 Another important price that will have to be revised is the interestrate. Prior to the enactment of Law No. 120 of 1975 (dated September 25, 1975),interest rates in Egypt were limited to a maximum of 7 percent a year, al-though this ceiling could be raised slightly in some cases by adding on anadministrative charge. The available evidence indicates that the existinginterest rates are well below the rate of profit in the economy. Moreover,with the implementation of the "liberalization" policies and the concomitantremoval or weakening of price controls, this divergence will become even moremarked. This could lead to serious distortions and misallocations in theeconomy, with capital-intensive techniques being encouraged and windfall gainsbeing bestowed on anyone who has access to credit facilities. It should alsobe pointed out that the existing interest rates constitute a serious disincen-tive to thrift, at least in the form of holding liquid assets. Commercialbanks are not permitted to pay interest on current deposits, while the maximumrate on savings deposits has up to now been only 4.5 percent. When the cur-rent rate of inflation is taken into account, the real interest rates are, infact, negative.
The Public Sector
3.16 The public sector dominates the economv of Egvpt. It accounts forabout 90 percent of total investment and 75 percent of industrial production;it owns all financial intermediaries, foreign trading, and wholesale firms:i.t controls most of the transport sector. it is the major source of domesticresource mobilization; and fiscal performance is the main determinant ofnonetary and credit expansion. The new economic strategy makes it clear thatthe adoption of a more liberal outlook does not mean the abandonment of theDublic sector, but only a change in its structure and functions.
3.17 There are two main issues in the reform of the public sector: themobilization of domestic resources, and the improvement of the efficiencyof public enterprises. The two are connected to some extent, because a moreefficient public industrial sector would be able to transfer larger amountsto the budget, but the improved efficiency of the public sector is also im-portant from the point of better resource allocation and use.
3.18 Because of the scope of public sector activities, the domesticresource mobilization effort is largelv synonymous with public sector savings.The urgency of increasing domestic savings derives additional importancefrom the financing of the development plans. The 1975 Plan, although largelyfinanced through external capital inflows, requires a considerable generationof domestic resources: each bE I invested in foreign exchange must be com-plemented by BE 1.50 in domestic resources. If the required level of currentaccount surpluses cannot be obtained, then recourse will perforce be had(as in 1974) to increased borrowing from the banking system, with itsattendant dangers of intensified inflationary pressures.
3.19 The inadequate mobilization of domestic resources threatens to be-come an increasingly important constraint on the development process. Grossdomestic savings reached a level of nearly 14.5 percent of gross domestic in-come in 1966/67. Thereafter the ratio fell sharply and has generally remained

- 27 -
at between 7-9 percent; in 1974 it is estimated at about 5 percent. It mayhave been politically difficult to restrain consumption expenditures in 1974and 1975, but a serious effort must be made to do so in the future; otherwiseit is not easy to see how the domestic resource gap can be filled without hav-ing recourse to additional debt.
Government Expenditure
3.20 The main determinants of current budgetary expenditures are de-fense spending and subsidies, especially cost-of-living subsidies.
3.21 Defence expenditures consumed a significant proportion (39 percentin 1974) of total Central Government current expenditures. It is unlikelythat the absolute amount of spending on defence will be decreased until aMiddle East peace settlement is reached. However, the government is makingan attempt to hold down the growth of these expenditures. Thus, the 1975budget estimates an increase of only about LE 20 million, so that the shareof defence in total Central Government current expenditures drops to 35percent.
3.22 Direct subsidies are provided for certain items of mass consumption-- wheat and flour, edible oil, maize, and sugar -- and for fertilizers, pes-ticides, and "utility" (i.e. low-grade) cloth. Since 1973, a two-tier pricingsystem has been in operation for some commodities. Under this system, acertain quantity of the rationed items is made available at the subsidizedprice, while additional amounts are sold at prices that yield a profit tothe General Authority for Supply Commodities. The difference between theloss on the subsidized part and the profit on the rest constitutes the netcost of subsidizing the "supply" commodities.
Table 10: SUPPLY AUTHORITY OPERATIONS(T6E million)
1974 19751972 1973 Budget Actual Budge*
Subsidies (losses) 42 136 375 393 514of which: wheat/flour 15 79 282 216 298
: maize - 4 11 17 44: sugar (rationed) 6 19 10 69 25: edible oil (rationed) 16 17 47 55 77
Profits 31 47 54 63 21of which: tea 18 14 11 14 10
: sugar (non-rationed) 6 23 32 36 -
: edible oil (non-rationed) 3 5 7 8 5
Net loss 11 89 322 330 493
ror details see Annexure Tables 5.3 and 5.4.

- 28 -
3.23 This cost has increased precipitously, largely as a result ofrlisng import prices. Thus, in 1972 the Supply Authority had a net loss ofonly LE 11 million. In 1973 this rose to BE 89 million, in 1974 to LE 322million, while the estimate for 1975 is BE 493 million. Quite clearly, thecontrol of these subsidies could produce substantial additions to domesticresource mobilization.
3.24 The Government regards the maintenance of stable prices of theessential items of consumption as being crucial to its economic and socialpolicies. It points to the unrest, triggered off largely by deterioratingeconomic conditions, which preceded the change in government (in April 1975),and is (understandably) reluctant to risk social unrest by reducing the cost-of-living subsidies. However, it is still possible to control increases inthem, and to use them more effectively, by a variety of means. First, theuse of subsidies should be made more selective. At present, there is nocorrelation between income and subsidies: the bread subsidy is availableto both the rich and the poor; the fertilizer subsidy is given equally tothe cotton grower, who must. sell a part of his output at prices fixed bythe government, and the fruits and vegetables farmer, who also benefits fronuncontrolled prices. Second, the heavy subsidization of some items can leadto a wasteful, or uneconomic, use of them. It would be worthwhile, therefore,to extend the dual-pricing system to additional commodities, so that essentialquantities are made available at low prices, while amounts in excess of thisquantity are sold at economic prices. Third, attention must be given to sub-sidies that exist in the form of pricing below economic cost. These are par-ticularly apparent in the pricing of petroleum products, and for public util-ities, especially public transport and electricity. Fourth, it would be usefulfor formulating policy to bring together all the subsidies, direct and indirect,that are paid. This would make explicit the total cost of subsidization, andfocus attention on alternative uses of those resources.
Government Revenue
3.25 The revenue side of the budget is dominated by two elements: taxes,ancd receipts from public enterprises. According to preliminary budget esti-mates, Certral Government tax revenues accounted for 61 percent of totalbudgetary receipts in 1974, while transfers from the public economic sectorprovided 28 percent.
3.26 Egypt's tax effort ranks high relative to other countries withcomparable per capita income, sectoral composition of GDP, and degree ofopenness of the economy. However, much of the tax revenues are realizedfrom indirect taxes. In 1974, for example, receipts from customs dutiesamounted to 34 percent of Central Government tax revenues, and 30 percentfrom taxes on goods and services (excise duties and price differentials);only 25 percent came from business profits and personal income taxes. More-over, the 1975 budget projects an increase in the share of customs revenuesto 38 percent of the total. A reform of the tax system which has equity asa goal, therefore, must examine the degree of regressivity, and formulatemeasures to decrease it.

- 29 -
3.27 Second, the elasticity of the tax system--i.e., its ability torespond automatically to changes in the variables on which it is based--alsoneeds to be examined, with a view to increasing it. Excluding transfers fromthe public economic sector, it appears that government revenues have not keptpace with the growth of the GDP in recent years. Current receipts as apercentage of GDP declined from 21.6 in 1970/71 to 21.3 in 1972, 20.7 in1973, and about 20.7 in 1974.
3.28 Finally, the rationalization of the economic regime will requirean overhaul of the tax administration system. Income tax rates in Egypt aresteeply progressive, but it is widely believed that considerable evasion oftaxes takes place, especially at higher incomes. Moreover, the basic thrustof the liberalization measures will involve a reform of the price system,including the removal of price controls and the moderation of subsidization.This means that the income distribution problem will have to be handled througha system of taxes and transfers, which would put an additional burden on equit-ably administering the essential subsidies (both direct and indirect).
Public Sector Enterprises
3.29 The public economic sector is the other major contributor to thebudget. Public sector enterprises are required by law to transfer to thebudget 65 percent of the surplus available for distribution. These mandatorytransfers increased in 1974 by LE 88 million (about 65 percent); the rise wasdue principally to an increase of LE 80 million from the General Organizationfor Cotton, and resulted largely from higher international prices for cottonin the first half of 1974, when most of the previous year's crop was sold.The 1975 budget estimates that transfers from public enterprises will be 24percent above the level of the previous year, chiefly because of receiptsfrom the Suez Canal Authority.
3.30 The data available on investments in the public industrial sectorindicate that the rate of return on assets was about 11 percent in 1973, whichis quite low consdering prevailing inflation rates. It does not appear, how-ever, that much higher rates can be realized in Egypt until public enterprisesare permitted greater freedom to raise prices, and given more latitude indecisions regarding employment, output, markets, etc.
3.31 As part of its economic liberalization program, the Governmentissued a decree (No. 111 of 1975, dated September 4, 1975) dissolving theGeneral Organizations that had previously controlled all major investmentand production decisions in industry. The decree permits individual enter-prises to have greater flexibility in many areas, but does not resolve anumber of issues on pricing policy, employment decisions, production sched-uling, export sales, etc. It is understood that other measures to resolvesome of these matters are under consideration.
3.32 The level of domestic savings and the efforts required to increaseit form one important group of policy concerns. Another major issue relatesto the sources of savings. At present the public sector captures -- through
- 30 -
the tax system, the social security, and postal savings schemes -- a substan-tial amount of private incomes, and uses them to finance public sector ex-penditures. As the private sector grows in size with the implementation ofthe open-door policy, its needs for financing will increase. Considerationwill therefore have to be given to what mechanisms can be developed for tapping the available private savings and channelling them to the growingprivate sector, while also providing adequate amounts of resources to thepublic sector. This emphasizes, once again, the importance both of contain-ing private consumption and increasing public sector savings.
Revival of the Private Sector
3.33 A major element in the new economic strategy is the reinvigorationof the private sector, including private foreign capital. This has two broadimplications for policy.
3.34 First, it will require a clarification of the respective rolas ofthe public and private sectors, i.e., what fields will be open to each. More-over, it will also require a clear demonstration by the Government of theapplication of the rule of law in its dealings with the private sector. Inpractical terms, the Government will have to assure private enterprise andforeign investment that nationalization and arbitrary sequestration are mat-ters of the past.
3.35 The second main group of policy issues comprises the system ofincentives for the private sector (including both domestic and foreign in-vestment).
3.36 (a) Foreign investment. To attract external capital and technology,the Government has promulgated Law No. 43 of 1974, which provides an incentivepackage for foreign investment and issues guarantees against nationalization,except under due process of law. The incentives differ between investmentsin free trade zones and those in other areas.
3.37 For investments in free trade zones, the incentives include completeexemption from all taxes and tariff duties for an indefinite period; no res-trictions on repatriation of earnings and capital, and the provision of animplicit subsidy on infrastructural facilities as a result of the prevailingunderpricing of utility rates. Free trade zone projects must export theiroutput and pay a one percent levy (in foreign exchange) on its value irn lieuof taxes. In addition, purchases of all local inputs must be paid for inforeign currency at the official rate of exchange. The increase in nationalincome arising from the employment of local labor, the foreign exchangereceived for the use of local resources, and the one percent levy constitutethe primary benefits that will accrue to the Egyptian economy from investmentsin free trade zones. However, the incentive schemes, as presently conceived,do not include any provision to encourage the development of industries witha high content of domestic value-added, nor the use of processes that wouldutilize domestic raw materials. Thus, it would be necessary for the licensingauthorities to consider these factors in project appraisal when determiningpriorities.

- 31 -
3.38 The incentive measures for foreign investment in areas outside freetrade zones include full exemption from business profit taxes for a periodof five years following the commencement of operations. Beyond this initialtax holiday, annual distribution of profits up to a maximum of 5 percent ofinvested capital to shareholders resident in Egypt are exempted from taxation.Moreover, interest paid on foreign loans will enjoy exemption from taxation.This provision is likely to encourage high debt/equity ratios, and consequentlyresult in low taxable income in Egypt after the lapse of the tax-exemptionperiod for profits. The merit of this incentive element of the foreign invest-ment law may thus need to be reconsidered.
3.39 The repatriation of earnings of foreign investments outside freetrade areas is directly linked to their net export earnings. Thus, there isa built-in mechanism in the Law to encourage foreign investments outside freetrade areas in export-oriented and domestic resource-based industries. How-ever, this provision of the Law could discourage investment in import-substitu-tion industries which might be efficient, and which could generate competitivepressures on existing firms.
3.40 (b) Domestic private investment. For stimulating domestic privateinvestment, the Government has yet to offer incentive measures similar to thosefor foreign investment. To be sure, the Government has accepted an enlargedrole for private sector industry and has indicated that nationalization is athing of the past. Furthermore, the apparent relaxation of the restrictionson industrial licensing, and the liberalization of the import regime for in-dustrial inputs have contributed to the improvement of the investment climate.But however important these actions might be as signals of intent, some moretangible incentives need to be extended to domestic private investment.
3.41 To effectively exploit the potential contribution that the privatesector can make to Egypt's industrial development, it would be advisable toextend the fiscal concessions provided under Law No. 43 (with appropriatemodifications) to domestic private investment as well. Indeed, it could beargued that presently the income tax system not only lacks stimulants, butalso dampens incentives for private investment. For, in addition to abusiness profit tax at the rate of about 40 percent, earnings of individualsin excess of LE 1,000 or more per annum are subject to a progressive surtaxwith rates starting from 9 percent and peaking at 95 percent for incomes ofLE 10,000 or more annually. As part of its tax reform, the Government isstudying the possible disincentive effect of the surtax rate structure oninvestment. A lowering of the surtax rates to more moderate levels, combinedwith effective collection, would appear advisable. The reforms might alsoconsider providing tax incentives for reinvestment of business income, inorder to increase private savings.
3.42 Domestic private investment is also seriously constrained by theavailability of foreign exchange for importation of capital goods. The na-tional foreign exchange budget does not make a provision for imports of capitalequipment for the private sector. The sole source of institutional foreignexchange finance for private sector industry is the Bank of Alexandria, whoseforeign exchange resources consist of an IDA credit of $15 million extended to

- 32 -
Lhe Egyptian Government in 1973 and a second one for $25 million in 1975.Hiowever, it is likely that substantial additional foreign exchange resourceswill be required to meet the private sector's investment requirements. Thus,it would be desirable to make available to the private sector additionalforeign exchange through the parallel market, transferred, if necessary, fromthe national foreign exchange budget. Such a step would be a concrete indica-tion of the Government's intention to strengthen the role of the private sec-tor in industry.
New Methods of Economic Management
3.43 A fundamental change required by the new economic order will be inthe methods of guiding and regulating the economy. Hitherto, the predominantmethods have beern administrative controls and directives of various kinds.The new situation will demand a dismantling of much of this apparatus, and itssubstitution by more indirect and sophisticated measures. In the liberalizedset-up the Government will have to rely chiefly on fiscal, monetary, price andexchange rate policies in order to achieve its aims. Some goals, however, maycontinue to require direct methods; for example, a wage policy could be di-rectly administered.
3.44 The mixed economy that Egypt is aiming at will possess a more 2 om-plex structure than exists at present. In order to move this system towardsthe required goals, the procedures for setting priorities will have to bestrengthened. Planning will become a different task: in place of an econ-omy dominated by public investment, which can easily be directed into desig-nated channels, th1e economy will also include a much larger private sector,whose investment decisions are more amenable to incentives and disincentivesthan to prescriptions. Thus, planning will have to incorporate a new dimen-sion, namely, the setting of indicative targets for the private sector.Moreover, development plans will have to include a more explicit discussionof policies to be followed during the plan period. Much more attention willalso have to be given to ensuring the common consistency of the plans ofdifferent sub-sectors and enterprises in the private sector, and to meshingthese in with public sector operations, so as to avoid the creation ofbottlenecks and imbalances.
Competing Objectives and Policies
3.45 The policy implications of the "open-door" strategv have a potentialfor imposing a cost in terms of other important goals that the country hasset. These ?"tradeoffs" will have to be carefully evaluated. The most importantof such problem areas are identified below.
Private Sector Incentives and Other Goals
3.46 (a) Income distribution: Egypt has followed a policy of restrainingthe growth of income at the top, while raising those at lower levels, throughboth legislation (e.g. on minimum wage rates) and subsidization of items of

- 33 -
mass consumption. Furthermore, Egypt's performance on raising tax revenues isone of the best among countries at comparable levels of per capita income.However, the new economic strategy will impose a different set of pressureson the tax system, and will require a considerable restructuring of it.
3.47 The liberalization of the economy will entail the giving of sub-stantial incentives and concessions to the private sector in order to encourageit to return to the economic scene after an extended period of time. Hany ofthese incentives may take the form of relief from taxation on corporateprofits and dividends, higher depreciation allowances, etc.
3.48 These developments may result in a greater skewing of the incomedistribution and lead to a possible conflict between considerations of equityand the drive towards a more growth-oriented economy. The Government will thushave to simultaneously undertake a reform of the taxation system. This reformwill have to cover a number of areas: (i) At present, the bulk of Egypt's taxrevenues come from indirect taxes, which have a regressive impact. An im-portant aim of the reform should be to redesign the system so that direct taxesbear a much larger share of the total. (ii) The opening up of the economy toexternal influences has been partly responsible for the sudden increase in thevalue of assets; this is particularly evident in the case of real estate. Itwould seem appropriate to introduce a capital gains tax, in order to capturea part of the windfall increase in the value of assets that has taken place.(iii) While income differentials may be important sources of incentives, toogreat differences in visible consumption can cause social friction. A con-siderable part of the expenditure of the richer class in Egypt currentlyappears to be on imported items. This suggests that the proposed tax reformshould pay close attention to a review of import duties, with a view to in-creasing those that impinge upon the commodities consumed by the richerclasses. (iv) In recent years, farmers who grow fruit, vegetables, andberseem have benefitted from the absence of controls on the prices of theirproducts and have greatly increased their incomes. The agricultural tax,however, is based not on income, but on the rentable value of the land, whichis recomputed every ten years. Much of the increase in the incomes of thosefarmers who are not subject to the Government-imposed cropping patternsappears to have escaped the tax net. A reform of the system of agriculturaltaxation should be taken up, or at least arrangements should be made for re-viewing rentable values at more frequent intervals.
3.49 (b) Efficiencv: One of the important incentives whereby to fostera private sector revival is likely to be the system of tariffs and otherprotective devices. While the infant industry argument for extending protec-tion to the new industries may be extensively applicable in the Egyptiancase, the system of protection would have to be carefully constructed so asnot to create distortions and misallocations.
3.50 The available evidence on the pattern of effective protection ofindustry in Egypt in the 1960's points to the existence of substantial inef-ficiencies in the industrial sector. For a sample of ten industries, effectiverates of protection (ERP) ranged from -28 (cement) to +599 (iron and steel)

- 34 -
percent. An important implication of such a wide dispersion of ERP's is thatresource use is much less efficient in highly protected industries than inless protected industries. Thus, economic efficiency would be higher if therewere a shift of resources from the former to the latter. Since in a liberalizedeconomy effective protection will have significant resource-pull impact, futureprotection policy will have to avoid such wide disparities in effective ratesof protection.
Exchange RateAdjustment and Other Goals
3.51 (a) Price stability. Another area of competing aims may arisefrom the need to rationalize the exchange rate and to fix it at a realisticlevel. In the Egyptian circumstances, this would mean a significant depre-ciation of the rate, even if only an implicit one -- through widening thescope of the parallel market. This measure is likely to result in an upwardpressure on prices in the short term.
3.52 (b) Budget: The price effects resulting from a devaluation wouldbe particularly marked on items that are either wholly imported or whichpossess a substantial foreign component. The vitally important "supply com-modities" consist almost entirely of imported items; if their prices to thefinal consumer were to be maintained at the present levels, the subsidy (i.e.the deficit of the General Authority for Supply Commodities) would have to beincreased. Similarly, the domestic resources required for servicing externaldebt would also be raised, 4
3.53 However, the inflows of external capital would be valued higher interms of Egyptian currency; so also would be merchandise imports, which maybe expected to lead to an increase in collections of import duties. Theoverall effect on the budget may, therefore, be positive.
Agricultural Price Incentives and Domestic Resources
3.54 The October Paper lists intensive agricultural production as one ofthe priorities for development. Apart from providing the agricultural sectorwith the necessary inputs, the authorities may have to bring the prices paidfor agricultural commodities into line with those prevailing in the interna-tional market. This will mean a substantial rise in prices of some importantcoDmmdities, which if were to be held down would require an increase in sub-sidies from budgetary resources. In order to minimize this, it would beworthwhile to move first to a set of prices ratios that are in line withthose prevailing in the world market. The equalization of the levels ofdomestic and international prices for agricultural products could takeDlace at a subsequent stage.
Decentralization and Social Goals
3.55 It appears that a considerable decentralization of decision-making,especially in the public sector, will be a sine qua non of the liberalizationprocess. This is likely to create inconsistences with other, centrally deter-mined, policy objectives. For example, if public enterprises are given a

- 35-
free hand in their personnel policies, they may move towards reducing theovermanning that is prevalent in these organizations. This could conflictwith employment goals, particularly in the short run.
3.56 To sum up, the Egyptian economv is moving away from rigid controlstowards a more open and liberal direction. This strategy seems appropriatein view of the changed international environment, and the increased oppor-tunities available to Egypt, including access to external capital. However,the movement will require a considerable change in attitudes, policies, andthe structure and role of economic institutions. It is also possible thatthe movement in one direction may inhibit, retard, or even run counter toaction to attain other, perhaps equally important, goals. A source oftension that may emerge is a worsening of the distribution of income andwealth. This could come about as a result both of the windfall appreciationin the value of assets which followed the opening up of the economy, and ofthe relaxation of price controls. To some extent, the effects of these factorscan already be seen. A meaningful reform of the taxation system, includingtax administration and collection, should therefore form an important andurgent part of the Government's economic management program, so that any po-tential friction arising from distributional considerations is dealt with,and does not impede movement towards the wider economic and social goalsof the country.


STATISTICAL APPENDIX
Table of Contents
Employment
1.1 Employment by Economic Sector
National Accounts
2.1 Gross National Product at Current Prices by Kind of Economic Activity
2.2 Gross Domestic Product at Constant Prices by Kind of Economic Activity
2.3 Sectoral Distribution of Planned Investment, 19752.4 Foreign Exchange Component of Planned Investment, 1975
Balance of Payments and External Trade
3.1 Detailed Balance of Payments, 1970-743.2 Commodity Composition of Exports (Payments basis)3.3 Commodity Composition of Imports (Payments basis)3.4 Payments By/To Bilateral Agreement Countries3.5 Own Exchange Imports3.6 Transactions in the Parallel Market3.7 Imports ,Through the Parallel Market (Payments basis)3.8 Trade in Crude Petroleum and Petroleum Products3.9 Foreign Exchange Receipts and Payments: Oil Sector3.10 Foreign Exchange Budgets
External Lebt
4.1 Summary Statement of External Debt by Main Categories4.2 Outstanding Medium- and Long-Term Loans from Governments, Multilateral
Organizations and Financial Institutions4.3 Outstanding Suppliers' Credits4.4 Outstanding External Bank Credits 1970-754.5 Repayments and New Authorizations for Use of External Bank Credits
(January - September 1975)
Public Sector Finance
5.1 Summary of State Budget5.2 Government Revenue5.3 Commercial Operations of the General Authority for Supply Commodities5.4 Special Fund for Subsidies5.5 Administration Budget Current Expenditures5.6 Egypt; Public Sector Investment Expenditure5.7 Transfers to Treasury from Public Authorities and Public Economic
Organizations5.8 Public Authorities: Current Deficits5.9 Public Economic Organizations: Current Deficits
Money and Banking
6.1 Monetary Survey

STATISTIGAL APPENDIX
Table of Contents--Continued
Industry
7.1 Output of Selected Industrial Products7.2 Public and Private Sectors Manufactured Exports7.3 Private Sector Manufactured Exports7.4 Public Investment by Main Industrial Subsectors (Actuals)7.5 Private Investment in Manufacturing, Approvals by General
Organization for Industrialization7.6 Foreign Investment Projects (Inside the Country) Approved
As of March 19757.7 Foreign Investment Projects Approved for Free Trade Zones
As of March 1975
Other Sectors
8.1 Oil and Gas Production, Official Forecasts, 1975-19808.2 Production of Major Agricultural Crops
Prices and Wages
9.1 Wages and Salaries by Economic Sector9.2 Consumer Price Index for Urban Population

Table 1 .1: Employment by Economic Sector
(In thousands of persons)
Split years ended June 30 1969/70 1970/71 1971/72 1973 1974
Commodity sectors 5375.1 5 505 9 5 582.6 5,613.8 5,715.4Agriculture 41704f.3 43056.9 41094.7 4,163.8 4,212.4Industry and mining 916.1 1,052.8 1,094.3 1,112.4 1,149.5Electricity 22.8 30.4 33.9 35.3 38.3Construction 387.9 365.8 359.7 302.3 315.2
Distribution sectors 1,148.9 1,190.1 1,217.4 1,266.1 1,288.2tIransport, communications
and storage 347.2 374.5 388.5 401.8 405.0Trade and finance 801.7 815.6 828.9 864.3 883.2
Service sectors 1 750 7 1,810.0 1 871.5 1,979.8 2,035.2Housing 136.3 137.0 137.4 138.0 139.1Public utilities 33.7 35.5 37.1 41.5 43.0Other services 1,580.7 1,637.5 1,697.0 1,800.3 1,853.1
Total 8,274.7 8,506.o 8,671.5 8,859.7 9,038.8
Source: Ministry of Planning.

Table 2.1: Gross National Product at Current Prices by Kind of Economic Activit-,1/
(In millions of F.Mtian pounds)
Split years ended June 30 1969/TO 1970/71 1971/72 1972 1973 1974
Commodity-~ sectors~ 1,479.4 1,546.7 1,656.2 1,736.5 1,849.7 2,182.7Agriculture 771.9 77 .l 854.6 932.9 1,062.4 1,244.9Industry and mining 542.0 611.2 636.5 64o.6 635.0 754.9Electricity 41.8 40.0 47.8 45.0 44.8 48.0Construction 123.7 121.14 117.3 118.0 107.5 134.9
Distribution sectors 3599 . 41.9 43o.2 470.0 528.2Transport, communications and storage 130.9 143.6 147.8 151.0 158.6 167.4Trade and finance 229.0 239.5 263.1 279.2 311.4 360.8
Service sectors V T70 7 816.9 835.2 897.2 933.2Housing 118.2 120.2 121.1 122.0 124.0 127.1Public utilities 11.7 13.3 13.8 12.2 13.8 14.2Other services 583.6 637.2 682.0 701.0 759.4 791.9
GDP at factor cost 2,552.8 2,700.5 2,884.0 3,001.9 3,216.9 3 &644. 1
Net indirect taxes 418.5 445.0 452.7 388.0 446.0 312.0GDP at market prices 2,971.3 3,145.5 3.336.7 3.389.9 3,633.9 3,956.1
Net factor income -44.5 -59.2 -62.2 -9.8 -29.0 -7.0GNiP at market prices 2,926.8 3,086.3 3.27T4-.5 380.1 3,663.9 3,949.1
Source: Ministry of Planning.
1/ Calendar year data for some sectors are evidently not on a consistent basis with the earlier fiscalyear data (e.g. , agriculture, industry and mining, electricity and public utilities, as well as netindirect taxes and net factor income).

Table 2.2: Gross Domestic Product at Constant Prices-/(In millions of Egyptian pounds at constant prices)
1969/70 1 970/71 1971/72 1972 1972 1973 1974~Split years ended June 30 (In 1969/70 prices) (In 1972 prices)
Commodity sectors 1 479l.4 1,521.5 1 573.8 1,618.8 11 8.4 1 710.8 1,780.3Agriculture 771.9 71.7 91. -3-9i3 933.1 9319 5 963.0Industry and mining 542.0 600.2 615,9 615,4 589.3 602.6 638.3Electricity 41.8 4h.46 4.0o 46e1 45.8 49.3 56.8Construction, 123.7 115.2 117.3 118.0 121s2 103.4 162.0
Distribution sectors 359.9 38245 4ol.6 415.7 43405 458.5 479.9Transport, communications & storage 130. 9 -10j$, TI. 151.3 161.3 168.9Trade and finance 229.0 237.5 253.1 264.4 280.0 297.2 311.0
Service sectors 713.5 766.6 807.6 821.8 832.6 891.3 918.3Housing U To-.T 1.0 T~ .1116 2. 126.6Public utilities 11.7 13.3 13.8 12.2 13.4 14.0 14.6Other services 583.6 633,2 672.8 688.6 697.6 753.3 777.1
GDP at factor cost 2,552.8 2,670.6 2783.0 2,856.3 2,956.5 3,o60.6 3,178.5
Source: Ministry of Planning.
1/ Calendar year data for some sectors may not be on a consistent basis with the earlier fiscal year data.

Table 2.3: Sectoral Distribution of Fl`anned Irvestrnent, 197$
PercentagePublic Private Total of Private
Sector VuValue % Value % to total
Agriculture 45.1 4h2 5.0 5.1 50.1 4.3 10.0Irrigation and Drainage 42.3 4.0 1.0 1.0 43.3 3.7 2.3Industry and Mining 196.3 18.6 21.1 21.5 217.4 1907 9.7Petroleum 82.3 7.8 - _ 82.3 7.1 -Construction Machinery 27.1 2.6 0.5 0.5 27.6 2.4 1.8Electricity 45.7 4.3 - - 45.7 4.0 -
Total Commodities Sectors 438.9 41.5 37.6 38.3 476.5 41.3 3.9
Transportation and Communication,Storage and Suez Canal 388.2 36.8 4.8 4.9 393.0 34.0 1.2
Trade and Finance 11.7 1.1 1.1 1.0 12.8 1.1 7.9
Total Distribution Sectors 399.9 37.9 5.9 5.9 405.8 35.1 1.4
Housing .109.1 10.3 53.0 54.0 162.1 14.1 32.7Public Utilities 38.6 3,7 - - 38.6 3.3 -
Education Services and ScientificResearch 25,8 2.4 0.4 0.4 26.2 2.3 1.5
Health Services 8.1 0.8 0,1 0.1 8.2 0.7 1.2Other Services 25.8 3.4 1.2 1.3 37.O 3.2 3.2
Total Services Sectors 217.4 20.6 54.7 55.8 272.1 23.6 20.1
TOTAL 1056,2 loO,o 98.2 loO, 1151.4 100.0 8.5
Source: Ministry of Planning.

Table 2.4: Foraign Exchai.-,7 Cornr-ewn-t oV Plareied Thvect:.zezi-, 1597
Foreigr. Exchange PeroEeta.e c,..Componet o£f T r- ITtal
Total of Total ForeignInvest-ient Value Investtmenet Ex.chwnge
Agriculture 50.t 8.1 16.2 1.7Irrigaticu end Drainage 43.3 76o 16.2 1.5Indaustry and MIning 10706 23.0Patrcleuir! 82.4 55.3 67.1 11.8Constructi'on M"chT-er.y 27.6 20.9 75.7 .5Elect rici ____________. 2
Total Comm.odities Sectors 476 .5 223.0 46.f A7.7
f+,^....-.*.%*tji> 4d'W t _s*^+tt^t
Stora-ee anid u ,., >a±i. 393.e - 7 . Llc2T.nq n .. t Finnn... 1Mt : P , 9 C,} n- C
Total DIstijBoution Sectors 405.8 9 s.3 4S 11.7.-
Housing 162.1 22.1 13.6Public Utilities 38.6 11.7 30.3 2.5Efucation Servi.ces and Educa-
tional Research 26.2 2.3 8.8 0.5Health 3rvices 8.2 0.9 11.0 0.2Other se-ces 37.0 . 12.*7 31.3 2 3
Total Services Sectors 272.1 49.7 18.3 10.6
- ~ ~ ~ ~ ~ ~ ~ ~ ~ ~ ~ .
TOurT _e: 1At' 5b. of L 68. O 10
Source: 11-inistry of' Plawninc

Table 3.1: Detailed Balance of Payments, 1970-741!
(In millions of Egyptian pounds)
Prelim.1970 1971 1972 1973 1974
A. Trade balance -162.4 -171.1 -205.5 -259.7Exports, f.o.b. 355.14 369.7 36553.7 31,39.2-Imports, c.i.f. -517.8 -540.8 -559.2 -656.;2/ -1,339.2-,
B, Services (net) 8 _40.0 3.0 2.7 66.2Receipts 76, 79.2 134.1 16 _277.6Shipping (4.2) (5.3) (5.5) (5.7) (7.9)Nonmerchandise insurance (0.2) (0.4) (0.2) (0.3) (0.2)Interest, dividende and other revenues (14.1) (12.6) (46.3) (47.5) (107.9)Travel and other receipts (57.9) (60.9) (82.1) (112.9) (161.6)
Payments -114.7 -119.2 -131.1 -163.7 -211.4Shipping (-8.2) (-8-3) (-7-3) (-6.5) (-9.3JNonmerchandise insurance (-2.4) (-3.4) (-1.6) (-1.5) (-3.5)Interest, dividends and other revenues (-29.14) (-32.5) (-30.4) (-50.5) (-61.1)Travel and maintenance expenses (-9.0) (-8.1) (-18.5) (-24.0) (-41.1)Other commercial payments (-11.7) (-13.8) (-13.9) (-20.0) (-36.1)Government, n.i.e. (-33.4) (-35.7) (-27-3) (-22.7) (-30.3)Other payments (-20.6) (-17.4) (-32.1) (-38.5) (-30.0)
C. Unrequited transfers 134.0 121.3 128.2 287.4 491.6Private 1.7 4.9 2. 5 ---yX / 16.3Government 132.3 116.5 125.7 285 .0g' 475.32/
D. Current balance (A+B+C) -66.7 -89.8 -74.3 30.4 -27.5
E. Capital transactions (net) 2.0 11.3 56.4 -24.2 -67.0Long-term loans 10.7 -11.3 34.4 23.2 -59.9Drawings (79.7) (65.4) (81.6) (79.6) (97-3)Repayments (-69.1) (-76.7) (-47.2) (-56.4) (-157 2)
Suppliers' credits -4.8 26.0 19.2 -46.2 8.4Drawings (61.9) (91.3) (99.8) (63.3) (lo6.8)Repayments (-66.7) (-65.3) (-80.6) (-109.5) (-98.4)
Others (net) -3.8 -3.4 2.8 -1.2 -15.5U.S. Government LE holdings (0.1) (4.3) (5.1) (--) (-9.2)Other official (0.4) (-2.1) (1.9) (1.8) (-2,9)Compensation for mtionalization (-4.7) (-5.9) (-4.4) (-3.0) (-4.4other private (0.4) (0.3) (0.2) (--) (1.0)
F. Errors and omissions (net) -8.6 3.3 -3.2 -3.9 -4.9
G. Allocation of SDRs 10.9 8.7 9.4-- --
H. Overall balance -62.4 -66.5 -11.7 2.3 -i99.4
I, Monetary movements (increase in assets -) 62.4 66.5 11.7 2 122.4Commercial banks (net) 13.9 -15.3 -6.4 .7 136,5
Liabilities (6.6) (-12.7) (9.4) (107-5) (227.9)Assets (7.3) (-2.6) (-15.8) (-18.8) (-91.4)
Payments agreements end credit fncilities(net) 26.3 50.0 34.0 -44.7 -o.6
Central Bank subscription to ArabInternational Bank -- -2.7 -- -- -4.1
Reserves and related items 22.2 34.6 -15.9 _46.3 67.6Use of Fund credit3/ (-0.4) (8.7) (-21.2) (17.9) (14.5)Foreign instititions' deposits (24.3) (21.3) (-0.4) (21.2) (1.0)Monetsr gold2 (3,5) (_ _)(_ _SDRsY(- (-3.0) (1.1) (-12.3) (0.2)Foreign exchange and other claims (-5.2) (7.6) (4.6) (-73.1) (51-9)
Sources: Central Bank of Egypt and International Monetary Fund, Balance Of Payments Yearbook.1/ Except where otherwise noted, data are based on the Central Bank's exchange control records.2/ Includes the market value of petroleum grants (IE 33.7 million in 1973, LE 86.4 million in 1974). Note
that import data do not include own exchange imports.3/ IMF record.

Table 3.1A: Detailea Balance of Payments, 1970-74
(In millions of U.S. dollars)
Prelim.1970 1971 1972 1973 1974
A. Trade balance -373.5 -393.5 -472.7 -657.1 -1 754.4Exports, f.o.b. -- 17-y 05X9.3 8f3.5 77U-2/ 12674 2Imports, c.i .f . -1 ,1 90.9 -1, 2) 3.8 -1, 286.2 -t ,659. 7- -3,428.4-~
B. Services (net) -88.1 -92.0 6.i 6.8 169.5Receipts 175.7 1d2- 3 5 42. 77a.
Shipping (9.6) (12.2) (12-7) (14-4) (20.2)Nornmerchandise insurance (0-5) (0.9) (0-5) (0.8) (0.5)Interest, dividends and other revenues (32.4) (29.0) (106.5) (120.2) (276.2)Travel and other receipts (133.2) (140.1) (188.8) (285.6) (413.8)
Payments -263.8 -274.2 -301.6 -414.2 -541.2Shipping (-18.9) (-19.1) (-16.8) (-16.4) (-23.8)Nonmerchandise insurance (-5.5) (-7.8) (-3.7) (-3.8) (-9.o)Interest, dividends and other revenues (-67.6) (-74-8) (-69.9) (-127.8) (-156.4)Travel and maintenance exoenses (-20.7) (-18.6) (-42.6) (-60.7) (-105.2)Other commercial payments (-26.9) (-31-8) (-32.0) (-50.6) (-92-4)Government, n.i.e. (-76.8) (-82.1) (-62.8) (-57.5) (-77.6)Other payments (-47.4) (-40.0) (-73.8) (-97.4) (-76.8)
C. Unrequited transfers 308.2 279.0 29it.9 727.2 1,258.5Private 3.9 1TT0 l° 5-T.T 1 272Goverrment 304.3 268.0 289.1- 721.1- 1,216.8-
D. Current balance (A+B+C) -153.4 -206.5 -170.9 76.9 -326.4
E. Capital transactions (net) 4.6
26.0 129.? -61.2 -171.5Long-term loans 4.6 26.0 79.1 So 7 -153.3
Drawings (183.3) (150.j0) (167.?) (201.) (249.1)Repayments (-158.9) (-176.4) (-108.6) (-102.7) (-h0.L)
Suppliers: credits -11.0 59.8 44.1 -116.9 21.5Irawings (142.4) (210.0) (229.5) (160.1) (273.4)Repayments (-153.i ) (-150.2) (-185.4) (-277.0) (-251.9)
Others (net) -8. -7.8 6.5 3.0 -39.7U.S. Government LE holdings (0.2) (9.9) (11.7) ( -- ) (-23.6)Other official (0.9) (-4.8) (484) (4.6) (-7.1)Compensation for nationalization (-1 0.8) (-13.6) (-10.1) (-7.6) (-11.3)Other private (0.9) (0.7) tO.5) t -- ) (2.6)
F. Errors and omissions (net) -19.8 7.7 -7.3 -9.9 -12.6
G. Allocation of SDRs 25.1 20.0 21.6 -- --
H. Overall balance -143.5 -153.0 -26.9 5.8 -510.5
1. Kionotary movements (increase in assets -) 143.5 153.0 26.9 -5.8 510.5Cosnmercial banks (net) 32.0 -35.2 -T14-7 2244 3.Liabilities (15-2) (-29.2) (21.6) (272.0) (583-.)Assets (16.8) (-6.o) (-36.3) (-47.6) (-234.0)
Payments agreements and credit facilities (net) 60.5 115.0 78.2 -113.1 -1.5Central Bank subscription to Arab
International Bank -- -6.3 -- -- -10.5Reserves and related items 5i1.0 79.5 -36.6 -117.1 'V3-1
Use of Fund credit 3/ (-0.9) (20.0) (_48-8) (45.3) (37-1)Foreign institations deposits 3! (55.9) (49.0) (-0.g) (53.6) (2.6)Monetary gold (8.0) ( -- ) ( -- ) ( -- ) ( -- )5s] 3/ (-- ) (-6.9) (2-5) (-31.1) (0.5)Foreign excbange and other claims (-12.0) (17.4) (10.6) (-184.9) (132-9)
Surce: Central Bank of Egypt/I.M.F.
1V Xccept where otherwise noted, data are based on the Central Bank's exchange 6ontrol records.T/ Includes the market value of petroleum grants. NIote that import data do not include own exchange imports.
I, M3SF record.

TABLE 3.2: Commodity Composition of Exports (Payments basis)
(in millions of Egyptian pounds)
1973 1974
Fuels 5.9 40.5Crude petroleum 572 33.4Petroleum products 0.7 7.1
Primary products 230.3 344.0Raw cotton 168.4 2-59.0other 61.9 85.0Rice, husked and bleached (21.8) (35-8)Rice, husked
Onions and garlic, fresh (11.8) (11.8)Onions and garlic, dehydrated (0.6) (2.8)Groundnuts (1.3) (2.3)Oranges (8.8) (11.2)Potatoes (5.1) (4.7)
Other vegetables, fruits and pulses (2-9) (2.0)Fish, poultry and animals (0.8) (1.0)Cotton waste, rags and straw (3.6) (3.6)Raw flax (0.8) (1.8)Other (4.4) (8.0)
Semi-finished products 39.5 88.9Cotton yarn 35.7 83.2Other yarn 0.1 --
Other 3.7 5.7
Finished products 120.6 180.5Textiles 19.1 33.0Cement 3.7 1.6Chemicals 7.7 12.6Footwear 4.3 11.5
Other leather goods 3.4 4.0Sugar 1.1 0.5Alcoholic drinks 4.0 8.2Books and periodicals 0.6 1.2Furniture, wood and metal 1.9 2.5
Other1!/ 74.8 105.4
Total 396.3 653.9
Source: Central Bank of Egypt, based on Exchange Controlstatistics.
1/ Including clothes.

Table 3.3: COypJOI)ITY CCOMPOSITION (OF IMPORTS
Payments Basis
(In millions of Egyptian pounds)
1973 1974 1973 1974
Live animals, animal and vegetable products, Wood, cork, paper, textile materialsfood and beveragei industry 196.0 387.2 anid articles 39.9 111.4
Live aninal3 4.8 2.2 Wood andm.ranufactures thereuo 13.9 49.4
Meat, fish and proultry 10.3 12.1 Paper and paperboard and :.anuiactures thereof 9.5 36.3Ve.,etables and fruits 2.3 3.6 Wool and ot:;er animal hzl.X 4.5 9.0Coffee and tea 9.8 10.1 Cotton 1.0 2.1
Cereals and products tbereof 152.3 295.9 Artificial textile fibers (discontinuous) 1.6 2.6Seeds 4.2 11.0 Other vegetable textile materials 2.5 3.7Sugar and confectioner: 1.5. 29.8 Other textile articles 2.5 2.8Tobacco 9.0 17.7 Others 4.4 5.5Others 1.8 4.8
1Base metals anti arcicles thereof 35.2 87.5Fats, grease, oils, fuel, and mineral products 65-2 .114.8 iron and stocl 23.7 56.0
Animal and vegetable fats, grease and oils 37.5 59.9 Copper 1.1 7.2Fuel; 25.4 50.4 Aluminum and articles thereof 3.7 7.6Others 2.3 4.5 Lead and articles thereof 1.5 5.2
Products of cliemical industries, rubber Zinc and articles thereof 1.0 2.9and leather 76.3 228.2 Tin and articles thereof 0.3 3.4
Or,ai.ic and inorganic chemicals 20.2 51.7 Other base metals and articles thereof 1.8 2.5?ha aaceucical product.; 5.5 12.2 Miscellaneou. articles of base metals 2.1 2.7Fertilizers 20.8 96.5Dyestaffs and aanin,, i,.at.rials 5.0 10.0 liachincry, boieles, electrical appliances,
transport equip!rent 117.5 190.8saenitial oils and c.s._ti_s 2.3 4.6 Boilers ai,d mte.hanical applianlces 63.8 105.9
Miscclla:;eous chemical pro.ducts 12.0 28.9 Mlachinery and electrical appliances 22.4 44.7Resir.oids and artificial resi.,s 2.3 9.9 Railway locomotivcs anid coaches 5.2 6.4Rubber 3.8 6.8 Yotor cars and buses and their spare parts 19.5 24.7Raw hides or tanning leather 3.4 5.2
Aircraft 0.8 2.2Others 1.0 2.4 Ships, boats and floating structures 3.4 3.6
Scientific, tech.nical and Dmedical instruments 2.4 3.3
MiscelLaneous nad unclassified articles 92.2 132.9
TOTAL IMPORTS 622.3 1,252.8
1/ Excludes the marktet value of petroleum grants.
Source: Central Bank of Egypt, based on Exchange Control statistics.
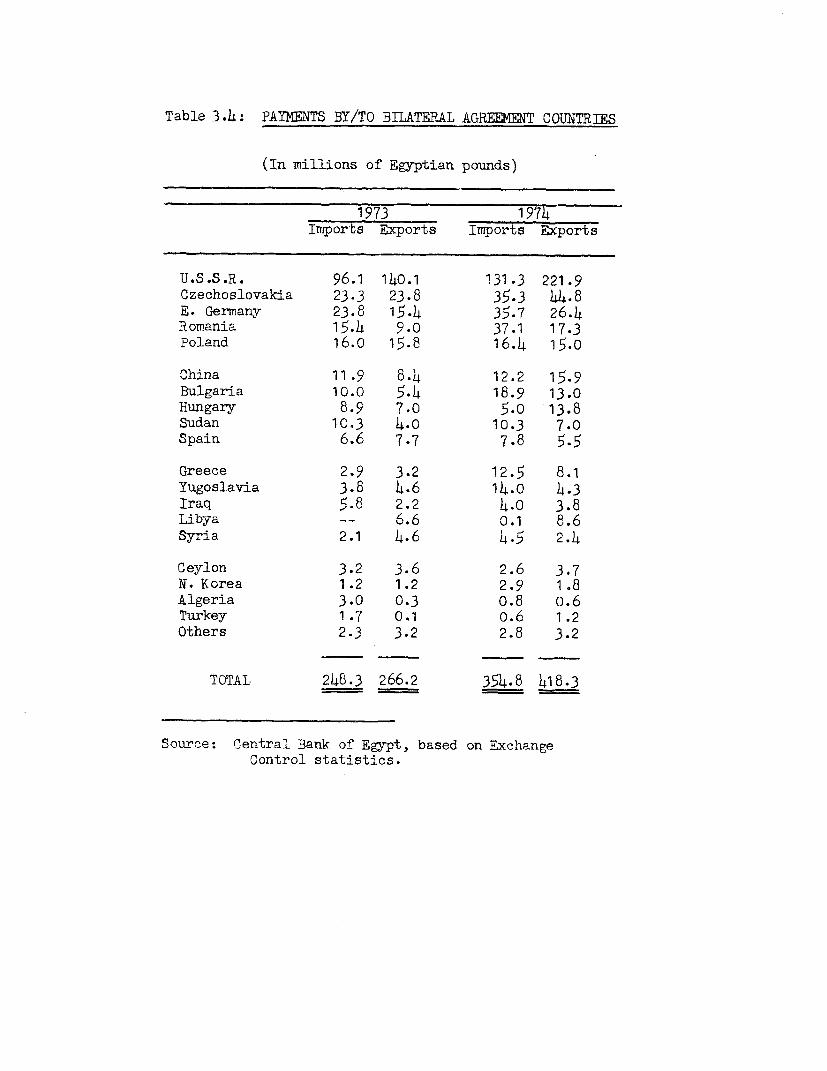
Table 3.h: PAYMENTS BY/TO BILATERAL AGREEMENT COUNTRIES
(In millions of Egyptian pounds)
1973 1974Imports Exports Imports Exports
U.S.S.R. 96.1 140.1 131.3 221.9Czechoslovakia 23.3 23.8 35.3 44.8E. Germany 23.8 15.4 35.7 26.4Romania 15.4 9.0 37.1 17.3Poland 16.0 15.8 16.4 15.0
China 11.9 8.4 12.2 15.9Bulgaria 10.0 5-4 18.9 13.0Hungary 8.9 7.0 5-0 13.8Sudan 10.3 4.0 10.3 7.0Spain 6.6 7.7 7.8 5.5
Greece 2.9 3.2 12.5 8.1Yugoslavia 3.8 4.6 14.0 4.3Iraq 5.8 2.2 4.0 3.8Libya -- 6.6 0.1 8.6Syria 2.1 4.6 4.5 2.4
Ceylon 3.2 3.6 2.6 3.7N. Korea 1.2 1.2 2.9 1.8Algeria 3.0 0.3 0.8 o.6Turkey 1.7 0.1 o.6 1.2Others 2.3 3.2 2.8 3.2
TOTAL 248.3 266.2 354.8 418.3
Source: Central Bank of Egypt, based on ExchangeControl statistics.

Table 3.5: Own Exchange Imports 1/(In thousands of Egyptian pounds)
1974 1975July- Oct.- Jan.- April-Sept. Dec. March June
Imports cleared by customsunder advance approvals 730 2,162 4,975 8,534
Imports cleared by customswithout advance approval 523 2,866 4,355 6,098
TOTAL CLEARANCES 1,253 5,028 9,330 14,632
1/ Under Article V of Ministerial Arrete No. 64 of 1974
Source: Egyptian General Trade Organization/Ministry of Finance

Table 3.6: Transactions in the Parallel Market!'
(In millions of Egyptian Pounds)
1973 1974 1975Sept.- Jan.- April- July- Oct.- Jan.- April-Dec. Mar. June Sept. Dec. Total Mar. June
Receipts during period:
Exports 2.2 4.9 7.3 10.1 9.5 31.8 12.5 10.6Tourism 8.2 7.5 11.8 12.9 10.7 42.9 7.8 8.5Remittances 14.8 13.2 22.9 24.0 23.2 83.3 22.2 24.4Other invisibles 4.6 1.1 1.9 3.2 9.1 15.3 6.9 7.3
Payments during period:
Imports 1.8 7.1 15.1 29.8 48.0 100.0 38.8 26.7Invisibles 5.6 5.4 5.6 9.5 14.5 35.0 14.0 10.1
Balances at end of period:
Amounts under settlement 0.9 -3.0 -1.8 -7.4 -11.3 -5.5 -1.1Commercial bank holding 39.2 52.5 69.0 75.9 56.7 56.7 48.2 49.9Export accounts 5.8 8.0 9.8 9.8 9.4 12.1Tourism accounts 0.6 2.4 0.3 0.3 0.3 0.3 0.3 0.3
1/ Figures include transactions carried out through tourism and export accounts.
Source: Ministry of Finance/Central Bank of Egypt.

Table 3.7: Imports Through the Parallel Market (Payments basis)
(In t'nousands of pEtpt!-n pounds)
1974 1gI7Juvy-Sept. Oct.-Dec. Jan-uarl Feb-ua2y-
Pnir.alls and aninal products 154 37 58 3Vegetable products 2,04,2 62 44 3,326Oil and fats - 50 15 7 103Foodstuffs and beverages 176 1,538 123 108't.ineral Products (salt, etc.) 515 799 526 27,Cneiical products 5,852! 7, 384 3,177 1,552?.ubber industry 1,686 2,471 605 8t7Raw; hides and s'.ins 8893 1,058 166 74W.ood and cork products 195 1,708 393 364PaDer and paper boards
and articles t'hereof 3,683 7, 345 6o1 758¶rextiles and textile articles 1s7j 2,328 127 208A.r4icles of stones. ouf r1 ass
others 234 579 58 72Ig.eatAs end articles thereof
(iron, aluzninuzn, zinc) 3,828 8,537 1,278 2,863.Achinery and cechanical
appliances, electricalequiprent 4,810 - i, 578 2,872 2,178
Vehicles 2,028 1,832 1,034 817Scientific, professionaland nedical aDpliances 174 395 247 126
M*iscellaneous (otherindulstries, books, etc.) 1,723 1,366 2,646 27
Total 29,750 48,032 13,962 -13,,413
Source: Central Bank of 1crypt

Table 3.8: Trade in Crude Petroleum and Petroleum Products
(In thousands of metric tons)
1969/70 1970/T7 1971172 1972 1973 1974
Balance of trade C(1 + 7.673 10,275 8,827 h4,172 1,012 -197
1. Crude oil 10o344 12,260 9 505 4.598 1,202 -132
Exports, of which: 11,288 13,737 10,680 5,986 2,752 2,351Egyptian's share (6,326) (8,263) (4,491) (2,262) (2,082) (1,342)Partners' share (4,962) (5,474) (6,189) (3,724) (670) (1,009)
Imports,-/ of which: -944 -1,477 -1,174 -1,388 -1,543 -2,490Crude oil grants (-) (-) (-) ( -) (-1,112) (2,454)
2. Petroleum Droducts -2,671 -1.985 -6-8 426 19T -58
Exports 156 189 583 739 802 852Imports, of which: -2,827 -2,174 -1,261 -1,165 -605 -910Petroleum product grants (--) (-) (--) (-) (-170) (-234)
Memorandum item:
Purchase of crude oil fromPartner companies 360 561 1,271 1,463 2,171 1,381
Source: Egyptian General Petroleum Corporation/IMF.g/ Excludes purchases from partner companiea which are detailed in the memorandum item.

Table 3.9: Foreign Exchange Receipts
and Payments: Oil Sector
(In thousands of ignptian pounds)
1970 1971 1972 1973 197L
A. Public sector (l - 2 - 3) -12,622 -18.400 -23.387 -46.426 -90.432
1. FExport receipts 31.423 2i.26l 18.02 24,694 73.070Crude petrolexn 29,568 25,994 11,224 9866 33,481Refined products 1,855 3,167 6,803 14,828 39,589
2. Paynents for crude and products 37,903 43.384 3.0 6 4. 467 154.6,1Crude petroleum 9,970 17,748 19,053 5736 118,643?rom partners (3,091) (4,670) (7,942) (13,318) (20,423)Frov. abroad I/ 1 (6,879) (13,078) (11,111) (32,418) (98,220)
Refined products- 27,933 25,636 17,949 18,731 35,978
3. Payments for other goodsand services 6 142 4, 74I2 6,653 8.881Spare parts and chemicals 3,466 2,1)6 1,965 3,176 5,039Transportation of crude oil z,676 2,481 2,447 3,477 3,842
B. Foreipn-owned oil connaries 8,077 4.806 5.649 7.06o 26.7c)5
P'ay.ents to Go3.1-nent 3,481 2,171 1.45T I.T55 18Tax payents27 3,548 2,171 1,1457 1,5177 9Other paysents3/ 178 3,804
Local currency purchases byoil companies-/ 4.596 2.635 4.192 5.3 80616
C. ?et position (A + -135945 -13.,54 17038 -39.366 -63 .63
!Yenorandun item:
1'arket value of crude oil grants - 27,254 78,973''arket value Of petroleur product grants -- 6,399 7,454
Source: Egyptian General Petroleun CorporationWIMF./ Includes market value of oil grants, as shown in memorandum item.
g Does not include the market value of royalty crude.3/ Any other payments in foreign exchange such as signature bonuses on exploration
oreements .B/ Purchases of local currency to settle expenses incurred in Egypt.

Table 3.10t: Foreign Ex_hange Budgets
(in Millions of US Dollars)
1974 (Actuals) 1975 (Planned)Free Bilataral Total Free Bilat3ral Total
1. Currant Receipts 2 162 1.102 3,264 2.075 862 3!7
Own Earnings 1,014 S01 1,915 1,122 1
(Exports) (605) (867) (1,472) (497) (822) (1,319)
(Invisibles) (409) (34) (443) (625) (40) (665)
Arab Subsidy & Other Receipts 1,148 201 1,349 953 -- 953
2. Current Payments for FinancialOblizations Falling Due 1.562 -296 -1 ,858 - -588 _
3. Current Paymants for Invisiblesand Do-wnpaymsnts for Imports -369 -71 -440 -472 -lo6 -578
4. Imports (Excluding Downpamnts) -2,6581/ -748 -3,406'/-4,232 -1,005 -5,237
5. Global Financing Requirsments -2.,427 -13 -2. 0 -5.276 -37 -5,913(1 +2+34Y)
6. S ources of Financing 213 2351 496 9592(Bankagm Faciiities) (1,997) (--9) (1Tg7) (2,267) (--) ( )
(Suppliers Credits) (296) (--) (296) (589) (--) (589)
(Other) (45) (13) (58) (640) (96) (736)
7. Surplus/Deficit -. -89 -1,580 -7141 -2,321
Source: Ministry of Finance Data/IBR interpretation.
1/ 'Excludes oil gifts of $221 million received in 1574.

TABLE 4.1: Summeary Statement of External Debt by Main Categories
(in million& of Egyptian pounds)
Out-standing Ar-and dis- Percent rearsbursed of on Repayments due in:Dec. 31, total Dec. 31, After No fixed1974 (7. 1974 1975 1" 1976 1977 1978 1979 1980 1980 maturity
I. Princlpal
(1) Medium and long term loans 690.7 64.1 5.1 *86.9 92.2 72.7 51.2 41.0 35.9 .156.8 153.8Arab countries -58.1 5.4 .-- 5.5 5.7 4.4 4.9 5.5 5.5 26.6 -
Western countries (including rescheduling agreements) 224.8 20.9 5.0 32.0 26.1 23.2 24.5 16.0 14.5 88.3 -
Eastern countries 315.0 29.2 0.1 35.3 27.9 24.2 20.2 17.5 14.0 22.1 153.8IBRDIIDA 13.7 1.3 - - - - - 0.1 0.1 13.5 -
LMF 63.0 5.8 -- 12.8 30.9 19.3 - - - --
Other multilateral organixationLs (K(uwait Fund, AD Fund, aet.) 16.1 1.5 -- 1.3 1.6 1.6. 1.6 1.9 1.8 6.3 -
(2) Suppliers credits 185.1 17.2 27.8 119.1 27.8 13.2 8.9 5.8 6.1 4.1 -
Arab countries .1.0 -- 0.8 1.0 - - - - - --
Western countriea 138.2 12.9 25.6 104.4 18.2 6.0 3.4 1.7 0.6 3.8 -
Eastern countries 45.9 4.3 1.4 13.7 9.6 7.2 5.5 4.1 5.5 0.3
TOTAL M&L term loans and suppliers credits (a) 875.8 81.3 32.9 206.0 120.0 85.9 60.1 46.8 42.0 160.9 153.8
Memorandum items:
(3) Financial institutions 38.8 3.6 - 7.0 4.7 4.7 4.8 3.7 3.7 10.2 -
(4) Balance due on bilateral accounits (gross liabilities) 163.0 15.1 - -- - 163.0
TOTAL Memorandum items (b) 201.8 18.7 -- 7.0 4 4.7 4.8 3.7 3.7 10.2 163.0
TOTAL Principal, (a) + (b) .7. 100.0 32.9 213.0 124.7 90.6 64.9 50.5 45.7 171.1 316.8
II. Interest on medium and long term loans 2/ 84.1 8.6 30.1 11.2 9.0 8.0 6.8 4.6 14.4 -
Source: Ministry of Economy and Economic Cooperation1/ 1975 Repayments include arrears on Dec. 31, 1974.
2/Interest on suppliers' credits is included under principal.

TABEE 4.2: Outstanding Medium and Long-Term Loans from Governments, Multilateral Organizations and Financial Inatiturtioa'
(in millions of Egyptian pounds)
December 31, 1974Out- Ar- Payments due in:
standing rears Due After No fixedas of on after 1975 1976 1977 1978 1979 1950 1980 maturity
1. Arab countries 58.1 __ 58.1 5.5 5.7 4.4 4.9 5.5. 5.5 26.6- Abu Dhabi 12.7 -- 12.7 -- -- °-4 0.9 1.3 1.3 - T- Kuwait 42.2 -- 42.2 4.0 4.0 4.o .o' 4.2 4.2 17.8 --- Saudi 3.2 -- 3.2 1.5 1.7 -- -- -- -- -- --
2. Western countries 93.2 5.0 88.2 7.4 6.6 6.2 6.2 5.9 5.0 50.7- Germany (Federal Republic) 32.3 1.3 308 3.0 2.9 *.- 2.8 21, 1T 15_- United States 21.5 -- 21.5 0.8 0.8 1.0 1.0 1.0 1.0 15.9- Italy 20.4 3.5 16.9 3.3 1.4 1.2 1.2 1.2 1.2 7.4 --- United Kingdom 3.8 -- 3.8 0.3 0.3 -- -- -- 0.1 2.9 --
- Japan 4.1 __ 4.1 -- -- -- -- -- 0.4 3.7- Spain 7.4 -- 7.4 -- 1.1 1.1 1.1 1.1 1.0 2.0- Denmark 3.7 -- 3.7 -- 0.1 0.1 0.1 0.2 0.2 3.0 --
3. Eastern countries 315.0 0.1 314.9 35.2 27.9 24.2 20.2 17.5 14.0 22.1 153.8- Bulgaria 4 .1 -- 4.Ij1 -Io a.7s o.s *0-* .2 -O *- - - --:o.- Czechoelovakia 26.2 -- 26.2 3.9 3.7 2.7 2.2 1.6 1.2 0.8 10.1- Eastern Germany 27.3 -- 27.3 1.6 1.4 1.4 1i-4 1.4 1.4 3.0 15.7- Hungary 7.7 -- 7.7 1.6 1.4 1.2 o.8 o.6 0.3 -- 1.8
- Mainland China 9.5 -- 9.5 0.5 -- -- -- -- -- -- 9.0Poland 7.7 7.7 0.8 0.7 0.6 s 0.6 0.5 0.3 0.3 3.9
= Romania 9.5 -- 9.5 -- -- -- -- -- -- -- 9.5- 1U.S.S.R. 215.4 -- 215.4 25.1 19.3 17.0 14.3 12.8 10.4 16.8 99.7
Yugoslavia 7.6 0.1 7.5 0.7 o.6 0.5 0.4 0.4 0.4 1.2 3.3
h. IBRD/fIDA 13.7 -- 13.7 _ 0.1 0.1 13 -
5. n.~ 63.0 -- 63.0 12.8 20.9 19.3 -- - _ -- --
6. Other multilateral organizations(Kmuait Fund) 16.1 __ 16.1 1.3 1.6 1.6 1.6 1.9 1.8 6.3 --
7. Rescheduling agreements 131.6 -- 131.6 19.6 19.5 17.0 18.3 10.1 9.5 37.6- GermanY (Federal Republic) 67.0 -- 7T. 6 .5 T5 -6. 6. 5 6.3 --Z -2- United States 34.1 -- 34.1 9.1 9.0 7.2 8.4 -0.2 0.2 -- --- Italy 18.5 18.5 1.6 1.6 1.5 1.5 1.5 1.5 9.3 ---lJnited Kingdom 1.6 -- 1.6 1.0 o.6 -- -- -- -- -- --
- Japan 4.4 -- 4.4 0.8 0.9 0.9 0.9 0.9 -- -- --- Canada 0.3 0.3 0.2 0.1 -- -- -- -- -- --- Mexico 5.7 -- 5.7 o.4 o.8 0.9 1.0 1.0 1.6 -- --
B. Total (loans from government andinternational institutions) 690.7 5.1 685.6 81.8 92.2 72.7 51.2 41.0 35.9 156.8 153.8
9. Financial Institutions 38.8 -- 38.8 7.0 4.7 4.7 4.8, 3.7 3.7 10.2- Lebanon z7 -- 7 2.7 2.7 W27 2.8 1.7 1.7 L7-4- Kuwait 17.0 -- 17.0 3.2 2.0 2.0 2.0 2.0 2.0 3.8- International Arab Bank 1.1 -- 1.1 1.1 -- -- -- -- -- -- --
Source: Ministry of Economy and Economic Cooperation.

TABLE 4.3: Outstanding Suppliers Credits
(ia millions of Egyptian pounds)
December 31, 1974Out- Ar- Payments due in:
standing rears Due Afteras of oni after 1975 1976 1977 1978 1979 1980 1980
1. Western countyr es 138.2 25.6 112.6 78.8 18.2 6.0 3. 1.7 0.6 3.8United States 10.2 3.2T T fl73 T .3 -- -- --Germ^any (Federal Republic) 14.0 7.8 6.2 3.6 1.7 0.5 0.2 0.2 -- --Italy 1.5 0.5 1.0 1.0 -- - -- -- -- --United Kingdom 10.2 4.3 5.9 3.8 0.9 0.6 0.4 0.2 -- --
Denmark 3.0 0.4 2.6 0.7 0.7 0.5 0.4 0.2 0.1Spain 3.8 0.5 3.3 0.9 0.7 0.8 0.7 0.2 -- --France 16.4 3.9 12.5 9.8 1.3 0.9 o.4 0.1Switzerland 3.7 1.9 1.8 1.4 o.4 --Australia 57.6 -- 57.6 48.7 8.9 --
Japan 1.8 0.5 1.3 0.5 0.4 0.2 0.1 0.1 -- --Austria 0.5 0.3 0.2 0.2 -- -- -- .
Sweden 4.8 0.9 3.9 *1.0 1.0 0.8 0.7 0.2 0.2 --Netherlands, 3.2 1.0 2.2 1.6 0.2 0.2 0.1 0.1 --India 6.7 -- 6.7 0.7 0.6 0.5 0.4 0.4 0.3 3.8
Belgium 0.8 0.2 0.6 0.3 O.? 0.1 -- -- -- --
2. Arab courtries 1.0 0.8 0.2 0.2 -- -- -- -- -- --Lebanon 10 -. O - -- -- ' -
3. C.M.F.A. countr-es andmainland Chi- .45.9 1.4 44.5 12.3 9.6 7.2 5.5 4.1 5.5 C.3
Bulgaria 2.o= -- T 0. 7 0.6 0.5 ?0 3 -0-6 --Czechoslovakia 3.9 0.1 3.8 1.5 1.3 0.6 0.3 0.1 --Eastern Germiav 7.9 0.6 7.3 2.9 1.6 1.3 o.8 0.5 0.2 --Hungary 0.2 -- 0.2 0.1 0.1 -- -- -- -- --
Mainland China -- -- -- -- -- -_ __ __ __
Poland 2.1 0.1 2.0 0.8 0.5 0.2 0.2 0.1 0.1 0.1Romnania 6.5 0.2 6.3 2.1 1.4 1.2 0.8 0.4 0.2 0.2U.S.S.R. 22.5 0.4 22.1 4.2 4.1 3.3 2.9 2.6 5.o --
TOTAL 185.1 27.8 157.3 91.3 27.8 13.2 8.9 5.8 6.1 4.1
Source: Ministry of Economy and Economic Cooperation

1/Table 4.4: Outstanding External Bank Credits 1970-7•-
(In Millions of _ttian Pounds)
Including DisbursedUndisbursed-' Only Utilized 2/
(End of period) During Period--
1970 104.8 50.0 122.7
1971 96.1 44.1 98.6
1972 135.5- 55.3 96.5
1973 440.3 194.5 430.7
1974January-March 512.8 241.3 135.4April-June 635.7 307.9 213.2July-September 754.7 319.0 224.3October-December 1,055.2 422.9 337.9
1975January-March 1,004.1 466.7 183.3April-June 997.6 533.4 130.2July 989.1 507.3 59.5August 972.2 521.5 49.2
Position at Aug. 30, 1975 (Outstanding Amounts)
Sight credits 59-6Maturities of 180 days or more 19.6
TOTAL 972.2
Amounts due for repaymentsWithin Six Months from Reporting Date
Tolal amounts Amounts Amounts Amounts Amounts Amounts AmountsdTue within due in due in due in due in due in due in-x months Sept '75 Oct '75 Nov '75 Dec '75 Jan '76 Feb '76
307.853 60.606 57.322 60.679 71.510 32.952 24,784
1/ Correspondent bank credits for financing trade. Excludes Euro-currencyloans.
2/ Includes sight credits.
Source: Central Bank of Egypt

Table 4.5: Repayments and New AuthorizationsFor Use of External Bank Credits
January-September 1975(LE Million)
New
Repayments Letters of Credit Authorized
January 75.0 80.3
February 62.6 46.5
March 45.2 56.5
April 60.7 60.0
May 41.4 35.0
June 68.0 35.2
July 137.1 59.5
August 70.4 49.2
September 76.5 45.6
October 40.1 19.6
TOTAL 677.0 487.4
Source: Central Bank of Egypt

Table 5.1 s y of State Budget
(In millions of Etvptian pounds)
19T4S ~~~~~~~~1970/71 1972 1973 Prelim 1975
Fiscal periods.J Actual Actual Actual Budget Actusl/ Budget
ReceiDts 869 290 1.018 1 6 1 14 5Central government revenue,of which: 625 664 694 799 778 1.060Taxes on income and profits (143) (146) (161) (178) (176) (187)Taxes on goods and services (166) (181) (191) (207) (209) (217)Taxes on international trade (196) (194) (205) (254) (238) (481)
Local governments' revenue 56 58 60 67 48 88Public economic secto 5 188 181 264 330 317 395Transferred profits 4/ (lO7) (81) (137) (252) (225) (278)Investment financing6 187) (100) (127) (78) (92) (117)
Current expenditure F 72 9 ..M 1.213 1 71Central government current expenditure 15 74733 9Local governments' current e enditure 46 42 51 63 50 88Public Authorities' deficit '1' 26 45 165 408 394 86Public Organizations' deficits
115 17 23 20 17 °
Subsidies 1- -- -- 20J 19 648
Current account surplus or deficit (-) 167 111 65 -123 -70 -ITO
Investment expenditure2/ 414 451 520 5i7
Overall deficit () -191 -303 -386 -643 -5 -27
Total financing: 191 6414 § 227
External borrowing (net) -- 18 51 102 79 -10
Domestic borrowing (net) 191 285 5 541 5T4 93Social insurance and pension funds 2 224 25S 251 376Savings certificates 23 32 38 27 39 30Postal savings 3 9 10 8 18 14Public economic Bector1o -102 -47 -120 125 39 392Banking system 79 7T 183 125 227 125
Memorandum items
Emeraency FundExpend4re 245 351 399 465 511 775Granta, 118 126 251 ** ..Jibed bonds' -- 14 13 ... 2
Source: Derived from Ministry of Finanoe datu/J .
/ Fiscal year ended June 30 up to 1970/71; calender year bauis for 1973 and thereafter.Figuree for 1972 are based on actual. for the 18 month period July 1971 - December 1972adjusted to an annual basis.
/ BMacc on actuals for the first 11 months and estimates by Ministry of Finance staff forthe concluding month.
2/ Mandatory transfers under the legal requirement that 65 per cent of net profits after taxand depreciation be transferred to the Treasury.
I Resources generated internally by Public Authorities and Public Economic Organizations tofinance part of their investment. The associated expenditure is included in the item"Investment expenditure". An alternative presentation would exclude this provision from bothreceipts and expenditure, htich would artect the current account but not the overall deficit.
ji P*.4046o 4ti , '..vPt of Pusbic AaOortties aet by govemmet subventions.
§/ Deficits in current operations of Public Economic Organizations met by government sub-ventions.
V Subsidies for essential coemodities paid direetly by the Treasury and not through theGeneral Supply Authority (almost entirely for low-grade textiles).
g In the 1975 budget the provision for subsidies has to a large extent been consolidatedunder one heading,
2/ Includes self-financed investments of the public economic sector but excludes certain -reconstruction expenditure (LE 243 million) to 'e financed from the Emergency Fund in 1975.IO Calculated as a residual; inclues net lending and borrowing from units within the public
economic sector including the affiliated companies and presumably salso the disposal of thesurplus or financing of the deficit of the Enrgency Fund.W Oraests received primarily from other Arab countries and rerdited to the loergency Fund.Au Am ta blUeaoe otf llmsm", i eldiug oil umanta.
: b** 12Y>MMbEJ of te dCs0tioa s2a of JtbC4 bouAs andStet to tihe orgSaq V=A.
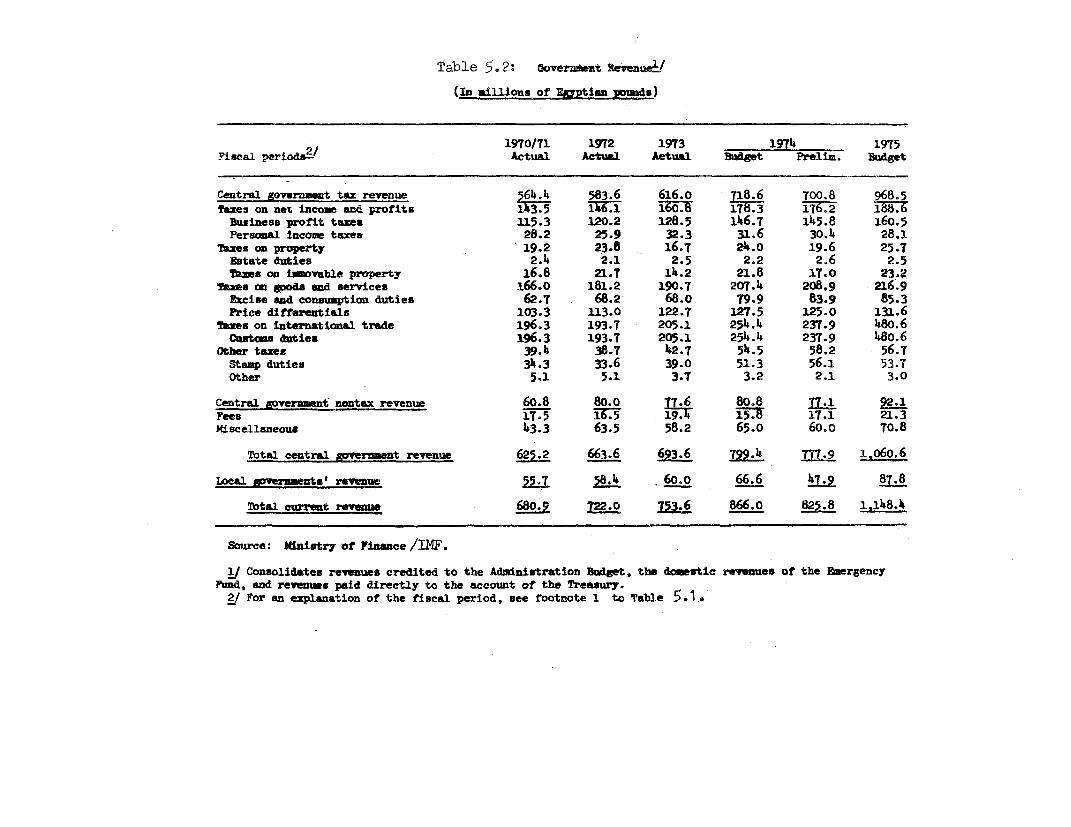
Table 5.2: oovernmat RPevenuea/
(In millions of Ea4tian poud.)
1970/71 1972 1973 1971 1975
iscal period,21 Actual Actual Actual Budget Prelia. Budget
Central g2vernment tax revenue 564.4 583.6 616.0 718.6 700.8 968.5
Taxes on net income and profits 13-5 146.1 160. 178.3 176.2 IR7.
Business profit taxes 115.3 120.2 128.5 146.7 145.8 160.5
Personal income taxes 28.2 25.9 32.3 31.6 30.4 28.1
Taxes on property 19.2 23.8 16.7 24.0 19.6 25.T
Estate duties 2.1 2.1 2.5 2.2 2.6 2.5
Taxes on ifovable property 16.8 21.7 14.2 21.8 17.0 23.2
Taxes on goods nd services 166.0 181.2 190.7 207.4 208.9 216.9
Farise and consumption duties 62.7 68.2 68.o 79.9 83.9 85.3Price differentials 103.3 113.0 122.7 127.5 125.0 131.6
Tazes on international trade 196.3 193.7 205.1 254.4 237.9 480.6
Customs duties 196.3 193.7 205.1 254.4 237.9 48o.6Other taxes 39-. 38.7 42.7 54.5 58.2 56.T
Stamp duties 34.3 33.6 39.0 51.3 56.1 53.7Other 5.1 5.1 3.7 3.2 2.1 3.0
Central government nontax revenue 60.8 80.0 80.8 -l.I 92.1
Fees ~~~~~17.516. 5 3W 17.1 21.3
Miscellaneous 43.3 63.5 58.2 65.0 60.0 70.8
Total central government revenue 625.2 663.6 693.6 799.4 Tfl-t 1,60.6
ocal governmns' rvnue i L. 60.0 66.6
obtal current revenue 8 722.0 753.o 866.4
Source: Ministry of Finance /IN2F.
& Consolidates revenues credited to the Administration Bdget, the domestic revenues of the Emergency
Fmd, snd revenues paid directly to the account of the Treasury.2/ For an explanation of the fiscal period, see footnote 1 to Table 5.1..

Table 5.3: Commercial Operations of the General Authority for Supply Commodities
(In millions of Egyptian pounds)
1970/71 1972 1973 1974 1975Fiscal Periods4/ Actual Actual Actual Budget Prelim. Budget
Subsidies (losses) 41.8 41.9 136.2 375.1 393.2 514.1Wheat and flour 20.9 15.1 79.0 5 1 29.4Maize 0.8 o.4 4.4 11.0 16.5 44.4Edible oil (rationed, 10.4 15.8 16.8 46.8 55.3 76.9Sugar (rationed) 8.0 6.o 19.0 10.0 68.9 25.2Other 1.7 4.6 17.0 25.8 36.1 69.2
Profits 38.6 30.5 47.2 53.5 63.1 20.9Cotton seed 2.0 1. 2.5 2.1 2.0 2.1Edible oil (non-rationed) 4.2 2.7 5.0 6.5 8.0 5.0Tea 12.6 17.9 14.4 10.7 14.0 10.0Coffee 0.9 1.3 __ __ 0.1 __Sugar (non-rationed) 18.0 6.4 22.6 31.5 36.0 --Other 0.9 0.9 2.7 2.7 3.0 3.8
Net profit or loss (-) -3.2 -11.3 -89.0 -321.6 -330.1 -493.2
Source: General 4uthority for Supply Conmiodities /ITF.
1/ For an explanation of the fiscal periods, see footnote 1 to Table 5.1.

Special Fund for Subsidies!
(In millions of Egyptian pounds)
1974 1975Budget Budget
&eneral Authority for Supply Comodities 329.1 49o.9Cairo Authority for Public Transport 4.1 5.6Agricultural Credit Corporation 8.5 5.4Textile Corporation 12.0 23.7Meat Authority 0.5 0.8Fish Authority o.6 o.62Petroleum Organization o.6 25.Agricultural Stabilization Fund -- 88. 9YCooperative Building Authority 0.1 0.3
Total 355.5 642.2
Source: Ministry of Finance/Dix.
1/ The Special Fund was established in the 1975 budget to show thelevel of subsidies more clearly. The 1974 figures are provided forpurposes of comparison and were contained in various sections of the1974 budget.2/ For portugas and kerosene./ For fertilizers and pesticides; in 1974 the subsidization of
fertilizers and pesticides was financed by t1e Agricultural Banksthrough credit extended by the coul2rcial banks.

Table 5.5 Administration Budget Current Expenditures-/(LE millions)
July 1971-December 197212Fiscal periods1' 1970/71 Full 18 Months Annual Basis 1973 1974 1975
Budget Actual Budget Actual Budget Actual Budget Actual Budget Prelim Budget
Central Government:Defense (excl. Emergency Fund) 244.0 238.0 383.3 399.9 255.5 266.6 281.3 282.4 295.5 289.2 309.2Security and justice 55.5 52.2 85.7 83.3 57.1 55.5 67.4 64.2 72.3 53.9 74.5Agriculture 19.4 18.1 30.5 29.6 20.3 19.7 17.7 16.4 19.7 16.8 21.3Irrigation and drainage 22.3 20.4 43.8 25.0 29.2 16.7 19.3 18.4 20.5 19.8 23.0
Education, research and youth 140.6 136.3 221.7 218.9 147.8 145.9 154.3 146.8 172.6 144.5 189.9Health, social and religious 62.5 56.5 89.0 91.0 59.4 60.7 79.4 73.9 85.8 67.5 90.2Transport and communication 6.7 6.7 12.5 11.2 8.3 7.5 9.2 8.6 8.9 7.8 10.1Culture and information 4.7 4.2 7.5 3.7 5.0 2.5 2.9 2.8 4.3 3.7 4.7Other current expenditures3- 90.5 82.9 165.1 168.9 110.1 112.6 122.0 100.2 129.4 119.9 166.1
Total Central Government 646.2 615.3 1,039.1 1,031.5 692.7 687.7 753.5 713.7 809.0 733.1 889.0
Local Government 43.8 46.1 71.0 63.8 47.3 42.5 55.4 51.1 63.5 50.2 87.8
Total Current Expenditures 690.0 661.4 1,110.1 1,095.3 740.0 730.2 808.9 764.8 872.5 783.3 976.8
Source: Ministry of Finance (Central Budget Department).
1/ Some data reflect changes in coverage (mainly reductions) over time due to reorganizations (e.g.,shifting of functions from Ministries to Authorities, whose accounts are in a different budget).
2/ See footnotes 1-3 of Table 5.1.3/ Largely general administration, but including some economic and social services not listed above.

Talle 5.6: Egypt: Public Sector Investment Expenditure(LE millions)
Fiscal periods 1970/71 1972 1973 1974 1975
Actual Actual Actual Budget Prelim Budget
General public services 12.5 10.9 8.0 15.4 16.3 21.0
General administration 0.7 1.7 0.3 1.0 1.5 2.6
Public order and safety 1.9 2.5 1.9 10.1 7.6 4.6
Local administration 9.9 6.7 5.8 4.3 7.2 13.8
Education 8.6 18.9 20.5 14.0 23.0 32.7
Health 4.0 7.1 4.8 6.4 5.9 13.3
Housing 24.2 28.7 33.1 32.0 32.0 57.5
Community and social services 1.4 2.0 1.7 2.0 2.5 4.9
Economic services 277.7 316.0 358.8 432.6 484.0 602.7
Agriculture 51.7 53.1 51.0 87.0 80.9 90.1
Mining, petroleum and manufacturing 155.9 186.1 188.6 206.5 242.3 255.8
Electricity 25.2 22.9 21.5 18.0 26.9 27.5
Transport and communication 34.6 44.0 86.3 110.8 123.1 197.8
Trade and supply 9.6 7.4 6.7 8.2 8.2 22.0
Tourism 0.7 2.5 4.7 2.1 2.6 9.5
Other 2/ 29.9 30.8 24.5 17.6 19.4 25.2
Total 358.3 414.4 451.4 520.0 583.1 757.3
Source: Ministry of Finance1/ Fiscal year ended June 30 for 1970/71 and December 31 froni 1973. Figures for 1972 are based on actuals
for 18-month period July 1971 through December 1972 adjusted to an annual basis.2/ Investment expenditure not allocated through public sector budget but financed from the Treasury Fund.

Table 5.7: Transfers to Treasury from Public Authorities and Public Economic Organizations-L/(LE millions)
Fiscal periods 2/ 1970/71 1972 1973 1974 1975Actual Actual Actual Budget Prelim Budget
Sector
Agriculture and irrigation 14.0 9.3 3.4 4.1 - 2.5
Industry and petroleum 22.5 18.3 19.6 29.6 25.4 57.6of which:
Textile industry (6.5) (6.3) (8.4) (10.2) (11.2)Petroleum industry (4.2) (1.7) (4.1) (3.1) (30.1)
Electricity 5.6 - - - - 4.5
Transportation and communicatiot/ 15.2 12.3 9.0 12.6 14.8 73.8
Finance and economy 28.0 32.1 99.1 192.6 181.2 125.6of which:
Cotton General Organization (14.5) (15.5) (64.8) (123.9) (145.0) (102.7)Central Bank (10.8) (13.8) (16.7) (15.6) (10.8) (18.7)
Supply and internal trade 7.9 3.0 - 4.0 - 6.5
Housing and construction 1.3 0.7 0.9 1.6 1.2 0.5
Health 5.6 3.9 4.3 6.4 2.6 6.2
Insurance 0.7 0.9 0.2 1.1 - 1.1
TOTALS 100.8 80.5 136.5 252.0 225.2 278.3
Source: Ministry of Finance
1/ Mandatory transfers under the legal requirement that 65% of net profits after tax and depreciationbe transferred to the Treasury.
2/ Fiscal year ended June 30 for 1970/71 and December 31 from 1973. Figures for 1972 are based onactuals for 18-month period July 1971 through December 1972 adjusted to an annual basis.
3/ Includes Suez Canal Authority.

Table 5.8: Public Authorities: Current Deficits(LE million)
Fiscal periods-/ 1970-71 1972 1973 1974 1975Actuial Actual Actual Budget Prelim Budget
Sector
Agrictulture and irrigation 6.2 17.5 15.2 14.1 12.0 12.8
Iinlustry and petroleum 1.9 1.5 1.0 1.2 0.9 3.2
Transport and communications 5.3 10.7 13.1 5.2 3.1 1.8
Supply and domestic trade - - 92.8 329.4 329.0 0.1-/
Finance and economy 0.2 0.1 -- 0.2 0.3 0.8
Housing and construction 4.5 5.5 7.2 9.4 7.3 10.6
Health 0.8 0.9 0.8 2.2 1.9 2.2
Education, research and youth 1.1 -- 26.4 36.3 30.8 42.6
Culture and information 6.0 8.7 8.4 6.8 5.5 11.1
Defense, security and justice -- -- -- 3.6 3.1 3.2
26.0 44.9 164.9 408.4 393.9 86.4
Source: Ministry of Finance
1/ Fiscal year ended June 30 for 1970/71 and December 31 from 1973. Figures for 1972 are based on actualsfor 18-month period July 1971 through December 1972 adjusted to an annual basis.
2/ In the 1975 budget subsidies are being provided from a separate provision for which LE642 million hasbeen approved.
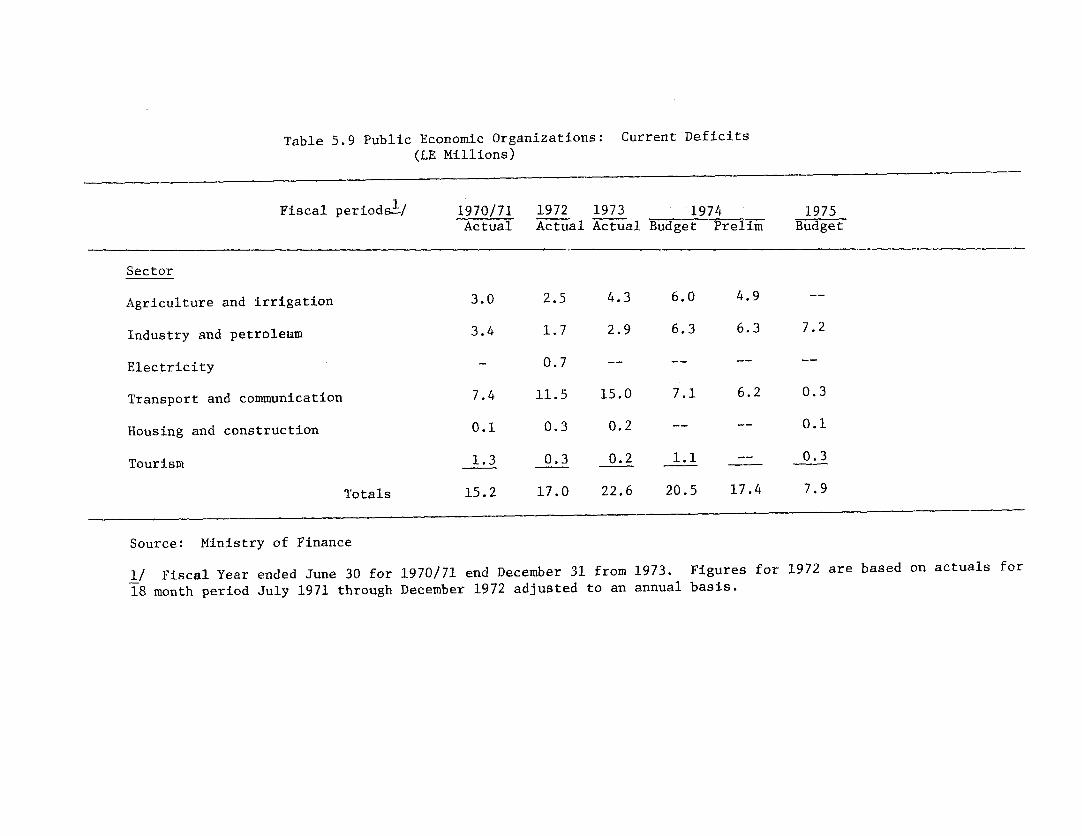
Table 5.9 Public Economic Organizations: Current Deficits(LE Millions)
Fiscal periods!/ 1970/71 1972 1973 1974 1975Actual Actual Actual Budget Prelim Budget
Sector
Agriculture and irrigation 3.0 2.5 4.3 6.0 4.9 --
Industry and petroleum 3.4 1.7 2.9 6.3 6.3 7.2
Electricity - 0.7 -- -- -- --
Transport and communication 7.4 11.5 15.0 7.1 6.2 0.3
Housing and construction 0.1 0.3 0.2 -- -- 0.1
Tourism 1.3 0.3 0.2 1.1 -- 0.3
Totals 15.2 17.0 22.6 20.5 17.4 7.9
Source: Ministry of Finance
1/ Fiscal Year ended June 30 for 1970/71 end December 31 from 1973. Figures for 1972 are based on actuals for18 month period July 1971 through December 1972 adjusted to an annual basis.
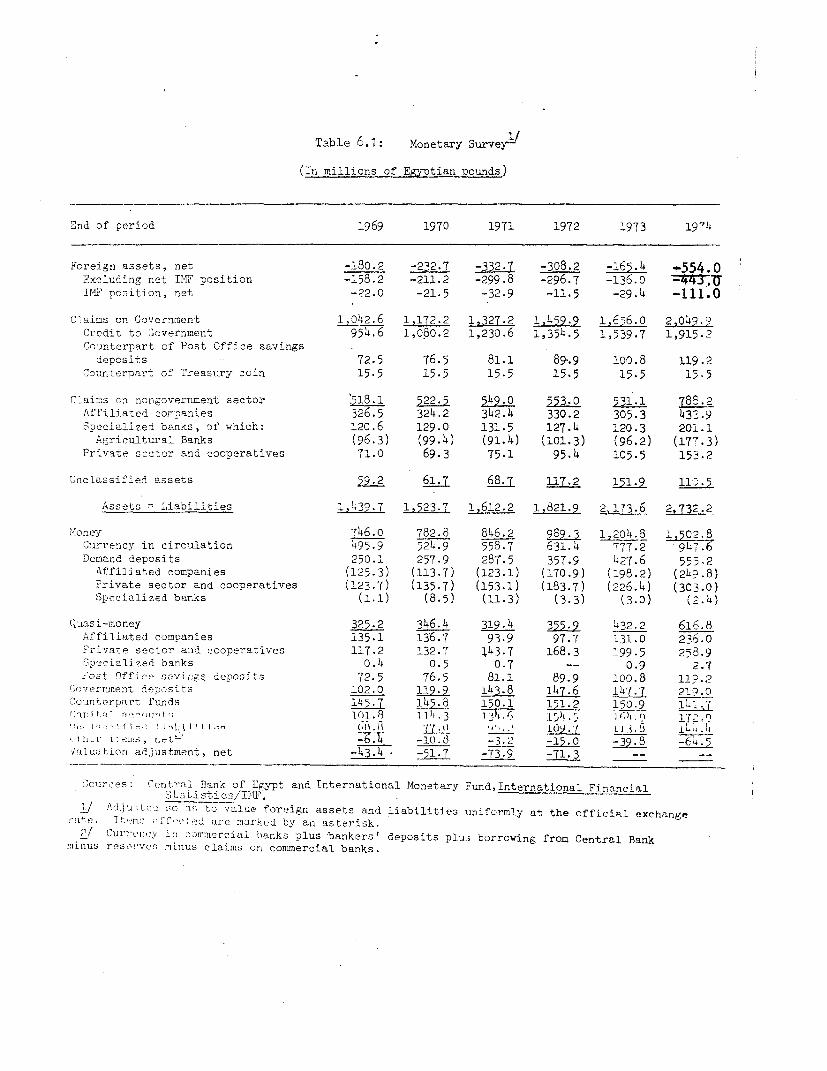
1/~~~~~~~~~~~~~~~~~~~~~~~~~~~~~~~~~~~~~~~~~~~~~~~~~~~~~~~~~~~~~~~~~~~~~~~~~~~~~~~~~~~~~~~~~~~~~~~~,
Table 6.1: Monetary Survey
(In millions of Eg,tian pounds)
End of period 1969 1970 1971 1972 1973 1974
Foreign assets, net -180.2 -232.7 -332.7 -308.2 -165.4 '554.0Excluding net IIT position -158.2 -211.2 -299.8 -296.7 -136.0 -443TUIMF po,ition, net -22.0 -21.5 -32.9 -11.5 -29.4 -111.0
Claiins on Government L 42.6 1,172.2 1,327.2 1,459.9 1,656.0 2,o49 '-Credit to G,overnment 954.6 1,080.2 1,230.6 1,354.5 1,539.7 1,915.2Counterpart of Post Office savingsdeposits 72.5 76-5 81.1 89-.9 100.8 119.2
Cour.terpart of 'reasury coin 15.5 15.5 15.5 15.5 15.5 15.5
CLaims on nongovernment sector 518.L 522.5 549.0 553.0 531.1 788.2Affiliated companies 326.5 324.2 342.4 330.2 305.3 433-9
Specialized banks, of which: 120.6 129.0 131.5 127.4 120.3 201.1
Agricultural Banks (96-3) (99.4) (91.4) (101.3) (96.2) (177-3).rivate sector and cooperatives 71.0 69.3 75-1 95.4 105.5 153.2
Unclassified assets 59.2 61.7 68.7 117.2 151.9 11,.5
Assets Liabilities 1,439.7 1,523.7 1,612.2 1,821.9 2,173.6 2,732.2
Money 746.0 782.8 846.2 989.3 1,204.8 1,502.8Currency in circulation 495.9 524.9 558.7 631.4 777.2 9L7.6
Demand deposits 250.1 257.9 287.5 357.9 427.6 555.2
Affiliated conpanies (125.3) (113.7) (123.1) (170.9) (198.2) (249.8)
Private sector and cooperatives (123.7) (135-7) (153-1) (183.7) (226.4) (3C3.0)Specialized banks (1.1) (8-5) (11-3) (3.3) (3-0) (2.4)
Quasi-money 325.2 346.4 319.4 355-9 432.2 616>.8Affiliated companies 135.1 136-7 93.9 97.7 131.0 236.0
Brivate sector and cooperatives 117.2 132.7 J43.7 168.3 199.5 253.9Specialized banks 0.4 0.5 0.7 -- 0.9 2.7
Post Officto savirigs deposits 72.5 76.5 81.1 89.9 100.38 11.2onvlzerrmnlent deposits 102.0 119.9 143.8 147j 147.7 219.0
ColInterpart funds 145.7 145.8 150.1 151.2 150.9('ar.i it 'q il OIf¶ ll*1.8 1 1.113 12)1 .I L5 I.0 .9 1 72
( ttl,.1' A t .'lI!i, net'' ~; 4 -10.o -3.2 -15.0 -39.8 -64Valuat,ion adjustment, net -43.4 -51-7 -73.9 -71-3 __ __
scurces: Central Bank of Egypt and International Monetary Fund, International FinancialLt ti s-t i c o/IlTE.
1/ AdJurtos .o sno to value foreign assets and liabilities uniformly at the officiial exchnngerate. I I:mi Cr: od are markc(d by an asterisk.C!/ CUoine: irn cormomrcial banks plus bankers' deposits plus borrowing from Central Bank
minus resceven minus claims on commercial banks.

Table 7.1: Output of Selected Industrial Products
(In thousans of metric tona unlese otherwise specified)
1972 1973
Dinning and weaving.Cotton yarn 179 182..Cotton textiles 115 118Wool yarn 12 12Wool textiles -4 4Synthetic yarn 10 10Synthetic textiles 25 23
FoodstuffsSugar 615 633Candies 87 81Pasteurized miLlc 38.4Cheese (white and processed) 135 135Vegetables and fruits 25 24
Cottonseed oil 145 160Oilseed cake 601 600Soft drink (millions of bottles) 660 600Beer (millions of liters) 30 32Cigarettes 32 23
Builing MaterialsiCeents 3,868 3,617Building bricks PiC) 797Gypsum and plaster 205 320
Chemical products a
Sulphiric acid 28 32Paper 149 1146Fertilizers
Superphosphate 518 419Amnxnium Nitrate 784 420
Tires (thousands) 927 860
Engineering ProductsCars (units) ~ - 6,130 5,590Trucks (units) 1,709 1,516Tractors (units) 1,247 1,243Buses (units) - 373 413Refrigerators (thousands) 55 39
Televisions (thousands) 76 51Radios (thousands) 146Bicycles (thousands) 32
Metallurgical ProductsReinforcing iron 239 226Steel billets 9 4Steel section 81 87Steel sheets 179 167Cast iron products 46 53
MineralsPhosphate 563 592Manganese 3 3Iron ore 427 n.a.Salt n.a. o04
Source: Ministry of Industry and Mining
1/ Preliminary.

Table 7. 2 Public and Privtat SEtor8 Manufactured Er -orts
Sub-sctor Actual acports 1973 ACtUual Exports 1974 Target Exports 1975
S:lb-sector _.Free Clearing Total Free Clearing Total Free Clearing Toaai
Sninning and *:eZving 23,557 .49,704 73,261 23,855 81,802 105,657 25,840 64,819 90. ;5):] (=>extile )..
Food 9,875 11,572 21,447 120,115 12,918 33,033 7,250 10,250 17,500
Chemicals 975 2,208 3,183 1,469 3,978 5,447 7,918 4,538 7,452
Er.gineering 4,590 4,293 8,883 7,953 6,432 14,385 7,110 5,640 12,75C|
Met.allurgical 597 4,615 5,212 3,704 6,095 9,799 4,057 5,628 9,25
3u1ildir.n, g, 4,703 1,384 6,087 2,865 643 3,508 420 1,334 1,754; 6
Aluminium Complex 3 - . _ 3,500 8,750 12,250 f
Total Dublic sector 44,297 73,776- 118,073 59,961 ill,868 171,829 51,095 100,959 152,054
ITotal private sector 2,585 27,617 30,202 4,866 49,445 54,311 3,185 29,015 *32,20!
Touol industrial Sector 46,882 101,393 148,27'5 64,827 161,313 226,140 54,280 129,97B 184,254
WoUrce: Ministry of Industry and Mining.

Table 7.3: PRIVATE EtC TCh l1 UP,,ACi'W -PRS1
(iE million)
1571, _Ac i.la T7xcor-tS 1975 Tare t
-- AiJree Agrec-Subsector Free ments Total Free metn Total
Leather goods D.1 21.6 21.7 01 12.0 12.1To-tiles 0-7 11.8 12.5 0.0) 4,0ChemicaLs 2.3 8.6 10.9 0.6 6. 6.6Owood 01i" 5.0 5.4 0.7 3.0 3.7
r sna-ci-Cr'n :fts (I1aa El-KhalilL) 0.Lt 2.4 2.8 0.8 16 2. 4
He~½lifIL:r.icaLl s 0.4t 01 0.5 0 0.01 04Baildini-, Elaterials 0. 0.3 0.1 - 0.1Food 0.1 0.2 0. 0.5
rTOTMhI, Lg.7 49.5 54.2 3.2 29.0 32.2
Source: Ministry of Industry and Mining, Indastrial Control Authority.

Table 7.4: Public Investment by Main Industrial Subsectcrs (Actuals)--
(In tE million)
S,lbsector 1978/69 1969/70 1970/71 1971/72 .1973 1974 1977(1i months) (Plan)
Hood 10.5 7.4 6.3 10.8 5.4 11.8 t7 7
Tcxtiles 5.9 10.6 7.7 14.7 12.0 21.5 12.5
Chemicals .18.5 8.5 10.4 a 12.1 8.5 17.0 29.0
.D i d,ding IM'terials 6.3 6.3 5.4 6.5 3.0 5.0 13.6
i.etallurgical - 0.5 2.4 7.5 6.55.3 6.5
~m£irneering . 6.8 5.0 6.1 6.o 7.0
S'2c-total 48.0 58.3.6 37.4 68.8 68.3
Steel Complex 19.4 29.0 40.0 67.8 32.4 58.0 4.1.0
','otal 67.4 -76.3 . 8 :5 1 69.8 126.8 127.3
1/ The figures do not include investment for replacement and renewals.7/ ZE 79 million on a 12-month basis.
Source: General Organization for Industrial:Lzation.
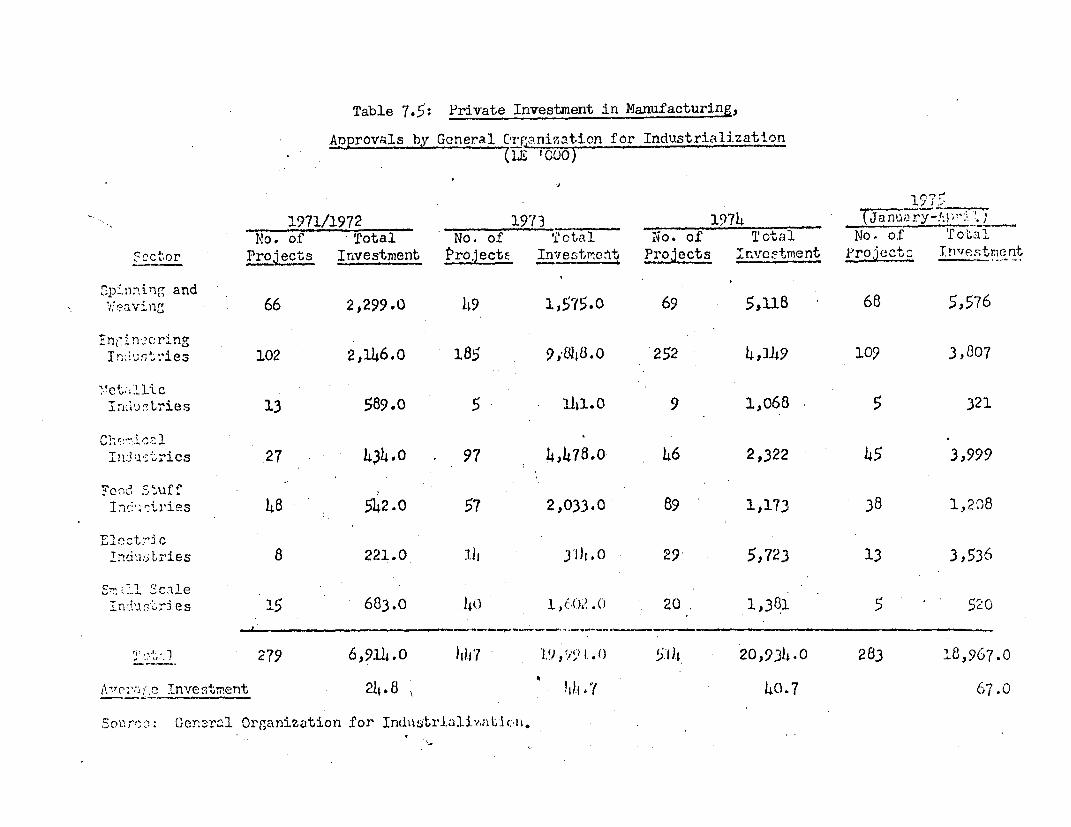
Table 7.5: Private Investment in Manufacturing$
A22rovals by General Ca,r ization for Industrialization.~ ~~~(1 100
1'971/1972 1973 1974 _J a nuA;r.No. of f Total oo. of Total No. of To'tal
c ctor Pro ects Irvestment ProjectE Investmrent Projects TAnvcEtpent Projects Tnvestment
S:pi,,i7ing andweavi>tng and 66 2,299.0 49 1,575.0 69 5,118 68 5,576
In, t', n ie s 102 2,146.0 185 9Mila.0 252 4,149 109 3,807
>'et;- :'l.icIuLur iies 13 589.0 5 -14l.0 9 1,068 5 321
Ini :3 2criCs 27 -,34.0 97 4,478.0 46 2,322 45 3,999
o-> S , u f f TFoi ^1;u ies ;48 542.0 57 2,033.0 89 1,173 38 1,208
U'cs. crTn6 6utbries 8 221.0 1), 3i1l,O 29 5,723 13 3,536
In AJ rtries 15 683.0 4) I.0.).0 20 ].,351 5 520
279 6,914.0 )ilb7 J,;9,"I..() 514 20,934.0 2B3 18,967.0
AlSTri,-,) investment 241 .8 IJr. 7 40.7 67.0
Sonrr~c>: Genr.:l Organization for Ind1zA1;lizalc:.

tacwc 7,: FOREIGN INVEE',TMENT PROJECTS(INSIDE THE COUNTRY) APPROVED AS OF MARCH 1975
(In millions of Egyptian pounds)
Number Proposed Investmentof Local Foreign
Area of Activity Projects Currency Exchange Total
Petrochemicals 46 5.1 11.9 17.0Metallurgical andEngineering Industries 22 7.9 7.6 15.5
Food Industries 11 2.5 5.7 8.2Building Materials Industries 16 3.3 3.7 7.0Textile Industries 26 1.0 4.8 5.8
Housing and Real Estate 13 36.6 36.0 72.6Tourism 3 13.8 44.2 58.0Livestock and Fisheries 8 1.0 3.8 4.8Mining Industries 2 0.02 0.3 0.3
TOTAL 178 71.2 118.0 189.2
Source: Ministry of Economy and Economic Cooperation, GeneralAuthority for Arab and Foreign Investment and Free Zones.

Table 7.7: FOREIGN INVEST1NT PROJECTS APPROVED FOR FREE TRADE ZONESAS OF MARCH 1975
(In millions of Egyptian pounds)
Number Proposed Investmentof Local Foreign
Area of Activity Projects Currency Exchange Total
Petroleum 2 -- 540.0 540.0Building Materialsand Refractories 2 6.0 86.0 92.0
Textile Indastries 1 0.3 54.8 55.1Engineering Industries 2 -- 28.0 28.0Food Industries 4 0.1 7.2 7.3
Chemical Industries 8 0.2 2.3 2.5Metallurgical Industries 1 0.05 0.1 0.2Services 5 o.6 6.8 7.4Finance, Tradeand Warehouses 6 0.1 2.7 2.8
Livestocks 1 _- 0.03 0.03
TOTAL 32 7.35 727.9 735.3
Source: Ministry of Economy and Economic Cooperation, GeneralAuthority for Arab and Foreign Investment and Free Zones.
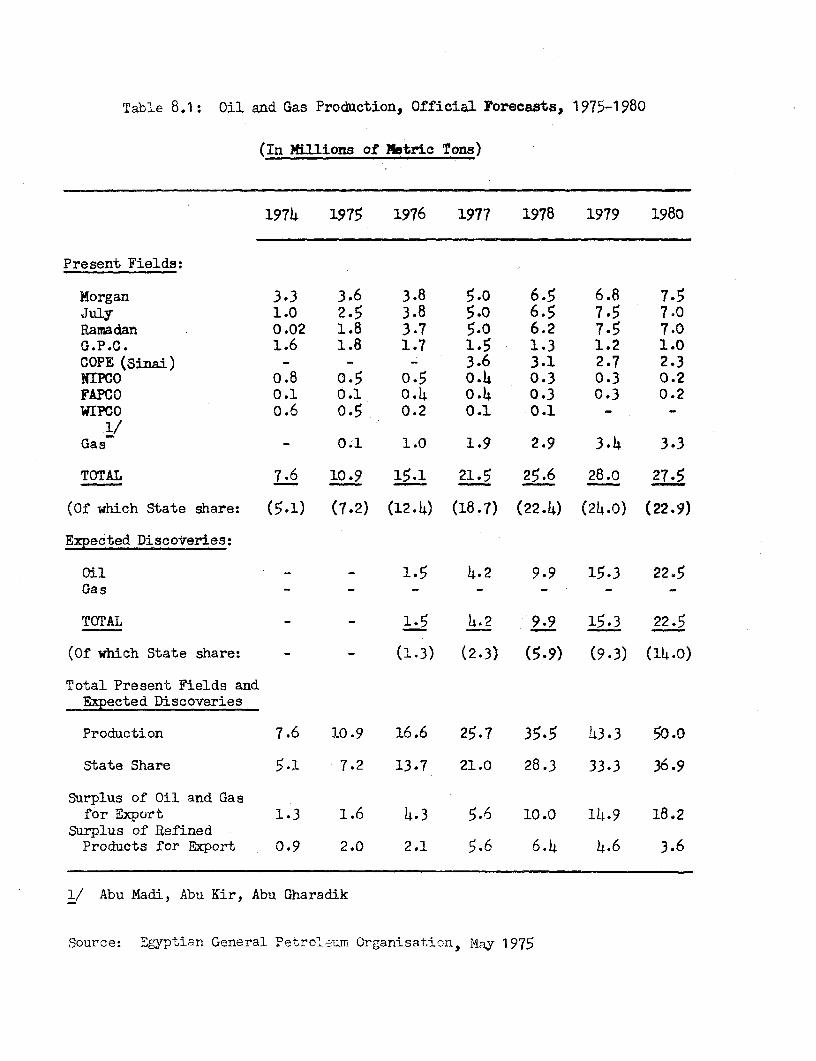
Table 8.1: Oil and Gas Production, Official Forecaats, 1975-1980
(In MIllions of Metric Tons)
1974 1975 1976 1977 1978 1979 1980
Present Fields:
Morgan 3.3 3.6 3.8 5.0 6.5 6.8 7.5July 1.0 2.5 3.8 5.0 6.5 7.5 7.0Ramadan 0.02 1.8 3.7 5.0 6.2 7.5 7.0G.P.C. 1.6 1.8 1.7 1.5 1.3 1.2 1.0COPE (Sinai) - - - 3.6 3.1 2.7 2.3NIPCO 0.8 0.5 0.5 0.4 0.3 0.3 0.2FAPCO 0.1 0.1 0.4 0.4 0.3 0.3 0.2WIPCO o.6 0.5 0.2 0.1 0.1 - -
Gas - 0.1 1.0 1.9 2.9 3.4 3.3
TOTAL 7.6 10.9 15.1 21.5 25.6 28.0 27.5
(Of which State share: (5.1) (7.2) (12.4) (18.7) (22.4) (24.0) (22.9)
Expected Discoireries:
Oil - - 1.5 4.2 9.9 15.3 22.5Gas - - - - -
TOTAL - - 1.5 4.2 9.9 15.3 22.5
(Of which State share: - - (1-3) (2-3) (5.9) (9.3) (14-0)
Total Present Fields andExpected Discoveries
Production 7.6 10.9 16.6 25.7 35.5 43.3 50.0
State Share 5.1 7.2 13.7 21.0 28.3 33.3 36.9
Surplus of Oil and Gasfor Export 1.3 1.6 4.3 5.6 10.0 14.9 18.2
Surplus of RefinedProducts for Export 0.9 2.0 2.1 5.6 6.4 4.6 3.6
1/ Abu Madi, Abu Kir, Abu Gharadik
Source: "gyptian General Petroleum Organisation, Miay 1975

Table 8. 2: Prodtuction of Major Agricultural Crops
(Production in thousands of metric tons; acreage in thousands
of feddas; yil d in metric tons per redf an)
Agricul.tural ye 1974/75_-ended Dctober 31-/ 1969/70 1970/71 1971/72 1972/73 1973/74 Target Productio.
W inter crOOS
Production 1,516 1,729 1,616 1,837 1,884 2,0Z6Acreege 1,304 1,349 1,239 1,248 1,370 1,390 1,3c9Yield 1.16 1.28 1.0 1.47 1.38 146
Horse beansProducti on 277 256 361 273 234 2-4AcreaFe 302 261 336 270 244 300 246Yield 0.92 0.98 1.07 1.01 0.96 . 0.95
OnionsProduction 227 283 267 230 359 203Acreage 33 37 32 21 39 35 21Yield 6.8 7.6 8.3 8.5 9,17 9.59
Sur=er and aut-n croDs
CottonProduction (unginned) 1,40o4 1,418 1,422 1,368 1,20A
lint 509 510 514 490 441Cottonseed 884 899 895 862 753
Acreage 1,627 1,525 1,552 1,6oo 1,433 2,350 1,347Yield (lint) 0.313 0.334 0.331 0.306 0.303
Rice (r^-ddy)Production 2,605 2,534 2,507 2,274 2,242_cre_ e 1l 1,18 1,137 i1i46 997 1 053 1.100 1,050Yield 2.28 2.23 2.19 2.28 .L13
paize
Production 2,393 2,342 2,417 2,507 2,640Ycrel e 1,504 1,521 1,531 1,654 1,755 1,615 1,650Yield . 1.59 1.54 1.58 1.52 1.35
Millet (sorghum)Production 874 854 831 853 824-Acreage 501 494 483 487 499 5°° 5Yield 1.74 1.73 1.72 1.75 1.65
SUZIg .caneProduction 6,945 7,498 7,713 7,349 7,018Acreage 186 193 202 198 208 225 220Yirld 37.3 38.8 38.2 37.1 33- 7
GroundnutsProduction 38.2 33.2 29.6 25.8 25.2AcreaFe 43 36 34 29 29 40 35Yield 0.89 0.87 0.87 o.8o 0.87
Fruits _nd veRetables0rag S-s
Production 567 707 683 767 819Acreage 118 119 121 122 130
Other frultsProductiou 523 617 632 671 7Acre:Sc 126 130 132 136 13
PotatoesProduction 548 451 595 796 709Acre_ge 77 66 84 106 95Yield 7.1 6.8 T.1 7.5 7.5
Other vegetables
Production 4,676 4i827 ,87 4,70Z 5,297Acreege 636 653 665 7°7 725
Source: Mir._stry of Agriculture
1/ Fiscal year national accounts data t-ough 1971/72 reflect s-er and autumn crotsof ore agrlctll t'.-L- =-~ -'inter c-ops of the cext, e,g.. 1971/72 ccvers 1971 cottonand 1972 w-eat,
/ Preli tcary est!--t^s, exce^t *cr cotton and vinter crops.
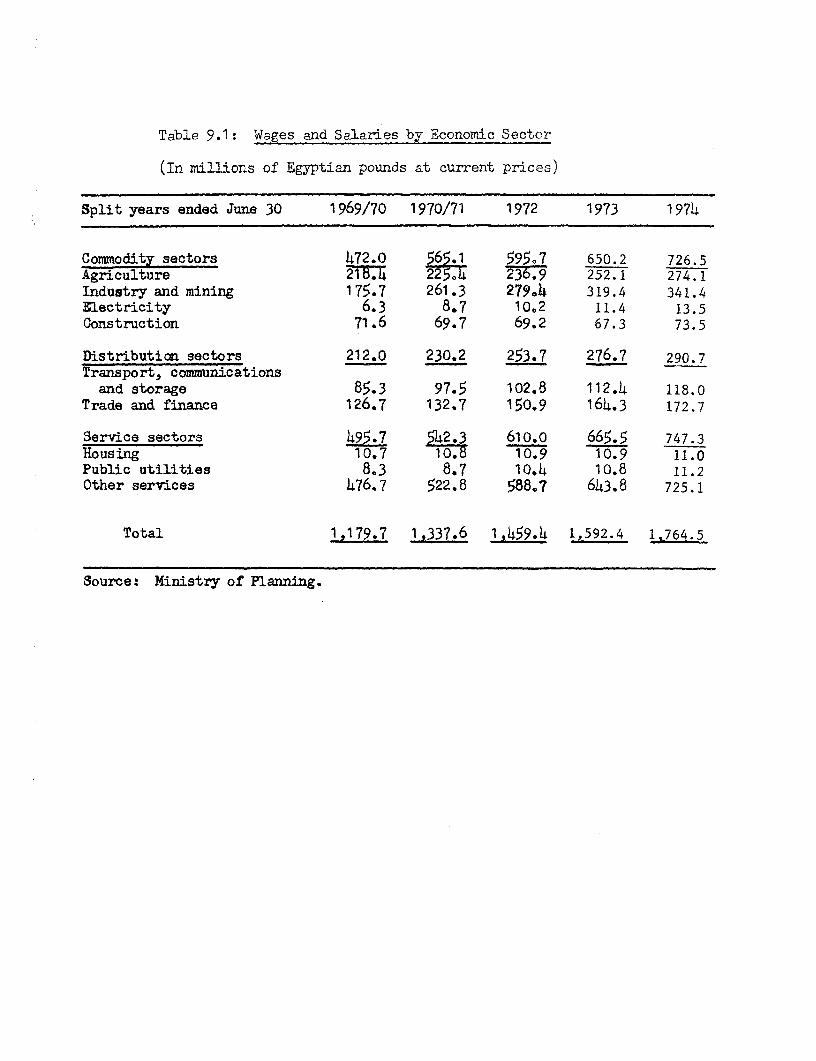
Table 9.1: Wages and Salaries by Economic Sector-
(In millions of Egyptian pounds at current prices)
Split years ended June 30 1969/70 1970/71 1972 1973 1974
Commodity sectors 472.0 565.1 59507 650.2 726.5Agriculture 215T. 2236.9 252.1 274.1Industry and mining 175.7 261.3 279.4 319.4 341.4Electricity 6.3 8.7 10,2 11.4 13.5Construction 71.6 69.7 69.2 67.3 73.5
Distribution sectors 212.0 230.2 253.7 276.7 290.7Transport, communications
and storage 85.3 97.5 102.8 112.4 118.0Trade and finance 126.7 132.7 150.9 164.3 172.7
Service sectors 495.7 542.3 610.0 665.5 747.3Housing 10.7 10.8 10.9 10.9 11.0Public utilities 8.3 8.7 10.4 10.8 11.2Other services 476.7 522.8 588.? 643.8 725.1
Total 1,179.7 1,337.6 1,459. 1,592.4 1,764.5
Source: Ministry of Planning.

Table 9.2: Consumer Price Index for Urban Population
(1966/67T 100)
End of period 1969 1970 1971 1972 1973 1974
Food and beverages (52.5)1109.9 115.-T 120.2 126.0 139.9 161.3Cereals (11.2) 98.8 98.3 98.9 99.1 120.6 120.9Pulses (6.6) 110.5 136.9 161.3 121.5 127.1 186.1Meat, fish and eggs
(13.1) 114.5 129.1 131.2 147.7 163.6 190-3Dairy products (5.9) 117.6 115.1 118.4 128.1 151.0 1'(3.3Vegetables (3.8) 110.8 101.5 113.8 174.9 163.6 210.L4Fruits (2.9) 109.3 111.5 12.1 126.1 144.9 154.,2
Housing (15.7') 109.1 108.5 108.5 105.7 106.2 106.5Furniture and other
durables (1.3) 96.0 96.7 97-0 97.4 98.5 109.0Clothing (8.4) 102.5 101.7 103.77 107.7 117.8 129.9Transport and communica-
tions (4.L,) 1U9.8 119.8 U9.8 121.4 123.1 123.1ServicC2 9.°) 1o8.6 113.8 11T.O 119.7 121.8 127.3Pcrzorial expenccs (7.8) "b.J 3 114.4 114.6 ii4.8 116.0 120.4
All items (100.0) N09.6 112.8 115.9 119.1 127.7 141.0
Source: Central Agency for Public Mobilization and Statistics.
1/ The numbers in parentheses are indicative commodity weights based on thecoimodity weights employed in five regional subindices and population weights forthese regions (including the Ccnal Zone, for which no observations are now taken).The original weights were derived from a family budget survey of 1964/65 and thesample population census of 1966. The subindex for food and beverages includesalso oils and fats (2.2), sugar and sweets (2.5) and beverages (4.3).