ar budgetrev 2003
TRANSCRIPT

2003
Board of Governors of the Federal Reserve System

Board of Governors of the Federal Reserve System
2003

March 2003
This publication is available from Publications Services, Board of Governors of the Federal Reserve System, Washington, DC 25001. It is also available on the Board’s World Wide Web site, at HTTP://www.federalreserve.gov/

Contents
Introduction 1 Summary of 2002 income and expenditures1 Budget processes2 Operational areas
The Budgets
Chapter 1 7 FEDERAL RESERVE SYSTEM8 2003 System budget initiatives8 Risks in the 2003 budget9 Trends in expenses and employment
10 2003 capital budgets
Chapter 2 11 BOARD OF GOVERNORS11 Planning issues11 Major initiatives12 Ramifications of the September 11 terrorist attacks12 Operations budget by operational area15 Capital budget15 Positions15 2000–2001 budget performance16 Trends in expenses and employment18 Survey expenses18 Office of Inspector General
Chapter 3 19 FEDERAL RESERVE BANKS 20 2002 budget performance 21 The 2003 budget 25 2003 capital budget
Appendixes
Appendix A 29 FEDERAL RESERVE BUDGET PROCESSES29 Board of Governors30 Federal Reserve Banks
Appendix B 31 PRICED SERVICES 31 Annual pricing process
Appendix C 33 CURRENCY BUDGET 33 Printing of Federal Reserve notes 34 Currency transportation 34 Counterfeit-deterrence research 34 Treasury’s Office of Currency Standards
Appendix D 35 EXPENSES AND EMPLOYMENT AT THE BOARD OF GOVERNORS
Appendix E 39 EXPENSES AND EMPLOYMENT AT THE FEDERAL RESERVE BANKS
46 MAPS OF THE FEDERAL RESERVE SYSTEM

1
Introduction
The Federal Reserve System consists of the Board of Governors in Washington, D.C., the twelve Federal Reserve Banks with their twenty-five Branches distributed throughout the nation, the Federal Open Market Committee (FOMC), and three advisory groups—the Federal Advisory Council, the Consumer Advisory Council, and the Thrift Institutions Advisory Council. The System was created in 1913 by the Congress to establish a safe and flexible monetary and banking system. Over the years, the Congress has given the Federal Reserve more authority and responsibility for achieving broad national economic and financial objectives.
As the nation’s central bank, the Federal Reserve has many, varied responsibilities. It acts to ensure that the nation’s economy grows at a pace consistent with price stability; it serves as the nation’s lender of last resort, with responsibility for forestalling national liquidity crises; and it is involved in bank supervision and regulation, with responsibilities for bank holding companies, financial holding companies (created under the Gramm-Leach-Bliley Act, enacted in November 1999), state-chartered banks that are members of the Federal Reserve System, the foreign activities of U.S. banks, and the U.S. activities of foreign banks. The Federal Reserve also administers the nation’s financial consumer protection laws.
The Federal Reserve System plays a major role in the nation’s payment mechanism. The Reserve Banks distribute currency and coin; process Fedwire, auto-mated clearinghouse, and securities transfers; and process checks. In addition, the Federal Reserve Banks serve as the fiscal agents of the United States and pro-
vide a variety of financial services for the Treasury and other government agencies. For a fuller discussion of the Federal Reserve’s responsibilities, see the Board publication The Federal Reserve System: Purposes and Functions.
Summary of 2002 Income and Expenditures
In carrying out its responsibilities in 2002, the Federal Reserve System incurred an estimated $1.6 billion in net operating expenses. Total spending of an estimated $2.9 billion was offset by an estimated $1.3 billion in revenue from priced services, claims for reimbursement, and other income.
The major source of Federal Reserve income is earnings from the portfolio of U.S. government securities in the System Open Market Account, estimated at $25.5 billion in 2002. Earnings in excess of expenses, dividends, and surplus are transferred to the U.S. Treasury—an estimated $24.5 billion in 2002. (These earnings are treated as receipts in the U.S. budget accounting system and as anticipated earnings projected by the Office of Management and Budget in the U.S. budget.)
Budget Processes
Beginning with the 1998–99 budget, the Board of Governors has operated on a two-year budget cycle and a four-year planning cycle. This multiyear process allows the Board to define and implement long-term strategies across functional areas. Given their current business needs, the Federal Reserve Banks maintain an

2 Annual Report: Budget Review, 2003
annual budget cycle. For more information on the budget processes, see appendix A.
Operational Areas
In 2002, the Federal Reserve System accounted for costs using the following categories—monetary and economic policy, supervision and regulation of financial institutions, services to financial institutions and the public, services to the U.S. Treasury and other government agencies, and System policy direction and oversight.
Monetary and Economic Policy
The monetary and economic policy operational area encompasses Federal Reserve actions to influence the availability and cost of money and credit in the nation’s economy. In 2002, the FOMC held eight regularly scheduled meetings and adjusted the federal funds rate once.
A vast amount of banking and financial data flows through the Reserve Banks to the Board, where it is compiled and made available to the public. The research staffs at the Board and the Reserve Banks use these data, along with information collected by other public and private institutions, to assess the state of the economy and the relationships between the financial markets and economic activity. Staff members provide back-ground information for the Board of Governors and for each meeting of the FOMC by preparing detailed economic and financial analyses and projections for the domestic economy and international markets. The Board and the FOMC use these analyses and projections in setting reserve requirements, setting the discount rate (which affects the cost of borrowing), and conducting open market operations. Staff members also conduct longer-run
economic studies on regional, national, and international issues.
Supervision and Regulation
The Federal Reserve System plays a major role in the supervision and regulation of banks and bank holding companies. The Board of Governors adopts regulations to carry out statutory directives and establishes System supervisory and regulatory policies; the Reserve Banks conduct on-site examinations and inspections of state member banks and bank holding companies, review applications for mergers, acquisitions, and changes in control from banks and bank holding companies, and take formal supervisory actions. In 2002, the Federal Reserve conducted 550 examinations of state member banks (some of them jointly with state agencies) and 580 inspections and 3,683 risk assessments of bank holding companies; it acted on 1,885 international and domestic applications.
The Board also enforces state member banks’ and certain foreign banking organizations’ compliance with the federal laws protecting consumers in their use of credit and deposit products. In 2002, the System conducted 358 compliance examinations, including 301 covering state member banks and 57 covering foreign banking organizations. Procedures related to the Community Reinvestment Act were included in 265 of the compliance examinations.
The Board’s supervisory responsibilities also extend to the foreign operations of U.S. banks and, under the International Banking Act, to the U.S. operations of foreign banks. Beyond these activities, the Federal Reserve maintains continuous oversight of the banking industry to ensure the overall safety and soundness of the financial system. This broader responsibility is reflected in the System’s presence in financial markets, through open market operations, and in the Fed-

Introduction 3
eral Reserve’s role as lender of last resort.
Services to Financial Institutions and the Public
The Federal Reserve System plays a central role in the nation’s payment mechanism, which is composed of many independent systems that move funds among financial institutions across the country. The Reserve Banks obtain currency and coin from the Bureau of Engraving and Printing and from the Mint and distribute them to the public through depository institutions; they receive deposits of currency and coin from depository institutions; and they identify counterfeits and destroy currency that is unfit for circulation. In 2002, the Reserve Banks received $574.7 billion in currency and $4.6 billion in coin from depository institutions, distributed an estimated $617.4 billion in currency and $5.9 billion in coin, and destroyed $92.5 billion in unfit currency.
The Reserve Banks (along with their Branches and regional centers) also process checks for collection. In 2002, the Reserve Banks processed approximately 16.6 billion commercial checks for collection, with a total value of about $15 trillion.
The Federal Reserve also plays a central role in the nation’s payments mechanism through its Fedwire Funds Service. Through this service, depository institutions can draw on their reserve or clearing balances at the Reserve Banks and transfer funds to other institutions that maintain accounts at the Reserve Banks. In 2002, Fedwire funds participants originated approximately 115 million Fedwire funds transfers, valued at about $406 trillion.
The Federal Reserve allows participants in private clearing arrangements to exchange and settle transactions through reserve or clearing account balances. The
Reserve Banks’ National Settlement Service provides settlement services to approximately 70 local and national private arrangements, primarily check clearinghouse associations but also other types of arrangements. In 2002, the Reserve Banks processed over 415,000 settlement entries for these arrangements.
The Federal Reserve’s ACH service allows depository institutions to send or receive payments electronically instead of by check. Institutions use the ACH service for credit and debit transactions. In 2002, the Reserve Banks processed approximately 5.9 billion ACH transactions, valued at about $15.8 trillion. Approximately 15 percent of the transactions were for the federal government; the rest were for commercial establishments.
Reserve Banks provide securities services for the handling of book-entry (computer-based) securities and the collection of physical interest coupons and miscellaneous items. The Fedwire Securities Service allows participants to electronically transfer to other participants securities issued by the Treasury, federal government agencies, and other approved entities. In 2002, Fedwire securities participants originated approximately 17 mil-lion transfers, valued at about $229 trillion. The noncash collection service, through which maturing or called municipal coupons and bonds are presented for collection, processed about 305,000 trans-actions in 2002.
Services to the U.S. Treasury and Other Government Agencies
The Reserve Banks provide fiscal agency and depository services to the U. S. government. Through deposit accounts at Reserve Banks, the government issues checks, makes payments, and collects receipts. The Reserve Banks also process Fedwire funds transfers and automated clearinghouse payments and provide the Treasury with daily statements of account

4 Annual Report: Budget Review, 2003
activity. Reserve Banks provide claims for reimbursement of approximately $300 million to the Treasury and other government agencies for the full cost of providing these services; reimbursement was received or is expected for all of the expenses incurred.
As fiscal agents, Reserve Banks pro-vide the Department of the Treasury with services related to the federal debt. For example, Reserve Banks issue, service, and redeem marketable Treasury securities and savings bonds; they also process secondary-market Fedwire securities transfers initiated by depository institutions. In 2002, the Reserve Banks processed over 166,000 competitive and noncompetitive bids for Treasury securities and printed and mailed 37.2 million savings bonds. The Reserve Banks operate two book-entry (computer-based) securities systems for the custody of Treasury securities—the Fedwire book-entry securities system and TreasuryDirect. Almost all book-entry Treasury securities are maintained on Fedwire, which is also the nation’s principal securities transfer mechanism; the remainder are maintained on TreasuryDirect, which is used by individuals.
As fiscal agents of the United States, the Reserve Banks also invest excess Treasury balances with approximately 1,200 depository institutions, which pay interest to Treasury for the use of the funds. In 2002, the Reserve Banks invested $504 billion of Treasury balances through the program. While most funds are callable on demand, the Reserve Banks recently piloted a program to auction investments with depository institutions for a set term.
As depositories, Reserve Banks collect and disburse funds on behalf of the federal government. The Reserve Banks
maintain the Treasury’s funds account, accept deposits of federal taxes and fees, pay checks drawn on the Treasury’s account, and make Fedwire and auto-mated clearinghouse payments on behalf of the Treasury. In 2002, the Reserve Banks processed over 883 million ACH transactions and 289 million paper checks for the Treasury. In 2002, the Reserve Banks also assisted Treasury in its efforts to increase the use of electronic payment vehicles by assuming additional responsibilities for the Pay.gov Internet portal, which permits the public to pay Treasury and agencies via the Internet.
The Reserve Banks also provide fiscal agency and depository services to other domestic and international government agencies. Depending on the authority under which the services are provided, the Reserve Banks may maintain book-entry accounts of government agency securities; provide custody for the stock of unissued, definitive (physical) securities; maintain and update balances of outstanding book-entry and definitive securities for issuers; maintain funds accounts for government agencies; and provide various payment services, including the processing and destroying of redeemed food coupons for the U.S. Department of Agriculture.
System Policy Direction and Oversight
This operational area encompasses the Board’s activities in supervising Board and Reserve Bank programs. At the System level, the expenses for these activities are considered overhead and are therefore allocated across the other operational areas. At the Board level, these expenses are not treated as overhead or allocated to other operational areas. ■

The Budgets

7
Chapter 1
Federal Reserve System
For 2003, total operating expenses are budgeted at $2,884 million, an increase of 3.1 percent from estimated 2002 expenses. Of this total, $2,629.9 million is for the Reserve Banks, and $254.1 mil-lion is for the Board of Governors (tables 1.1 and 1.2).1 Revenue from priced services provided to depository institutions is expected to total $925.8 million, or 32.1 percent of total budgeted operating expenses. This revenue, combined with claims for reimbursement and other income, results in projected net operating expenses of $1,628.5 million.2
The System expects to recover 43.5 percent of its budgeted 2003 operating expenses through revenue from priced
1. The Board of Governors now budgets on a two-year cycle; in this chapter, 2003 values shown for the System and the Board reflect the approximate second-year effect of the Board’s 2002–03 budget.
2. Claims for reimbursement refers to costs of fiscal agency and depository services provided to the U.S. Treasury and other government agencies that are billed to these agencies. Other income
Table 1.1
services, other income, and claims for reimbursement. When these items are deducted from budgeted 2003 operating expenses, the net expenses of the System show an increase of 3.7 percent from estimated 2002 net operating expenses (table 1.1).
Not included in the budget for operations is the cost of currency, budgeted at $510.3 million for 2003, an increase of 18.5 percent from the 2002 estimated cost of $430.5 million.3 The distribution of expenses is similar to that in previous years, with the Reserve Banks’
comes from services provided on behalf of the U.S. Treasury that are paid for by the depository institutions using the services, which include the transfer of funds between depository institutions and the Treasury.
3. The Federal Reserve pays for the printing of new currency at the Bureau of Engraving and Printing. Because this cost is determined largely by public demand for new currency, it is not included in the Federal Reserve operating expenses. For more information, see appendix C, “Currency Budget.”
Operating Expenses of the Federal Reserve System, Net of Receipts and Claims for Reimbursement, 2001–03 Millions of dollars except as noted
Total System operating expenses ................. 2,657.8 2,796.6 2,884.0 5.2 3.1
LESS
Revenue from priced services .................. 960.4 909.6 925.8 –5.3 1.8 Other income ............................................ 1.1 1.0 0.8 –9.1 –20.0 Claims for reimbursements ...................... 285.6 316.3 328.9 10.8 4.0
EQUALS
Net System operating expenses ............ 1,410.7 1,569.7 1,628.5 11.3 3.7
Percent change
2002–032001–02
2003 (budgeted)
2002 (estimated)Item 2001
(actuals)
NOTE. Components may not sum to totals and may not Operating expenses reflect all redistributions for sup-yield percentages shown because of rounding. port and overhead, and they exclude capital outlays.

8 Annual Report: Budget Review, 2003
Table 1.2
Expenses of the Federal Reserve System for Operations and Currency, 2001–03 Millions of dollars except as noted
Reserve Banks1 ............................................ 2,451.2 2,575.4 2,629.9 5.1 2.1 Personnel .................................................. 1,573.1 1,630.6 1,662.2 3.7 1.9 Nonpersonnel ........................................... 878.1 944.9 967.7 7.6 2.4
Board of Governors2 .................................... 206.6 221.2 254.1 7.1 14.9 Personnel .................................................. 149.4 163.0 185.5 9.1 13.8 Nonpersonnel ........................................... 57.1 58.2 68.6 1.8 17.8
Total System operating expenses ............. 2,657.8 2,796.6 2,884.0 5.2 3.1 Personnel ................................................. 1,722.6 1,793.6 1,847.7 4.1 3.0 Nonpersonnel .......................................... 935.2 1,003.0 1,036.3 7.2 3.3
Currency3 ..................................................... 350.0 430.5 510.3 23.0 18.5
Percent change
2002–032001–02
2003 (budgeted)
2002 (estimated)
2001 (actuals)Item
NOTE. Components may not sum to totals and may not yield percentages shown because of rounding.
Operating expenses exclude capital outlays. 1. For detailed information on Reserve Bank expenses,
see chapter 3.
expenses accounting for 77.5 percent of the total (chart 1.1).
System employment is budgeted at 24,149 for 2003, a decrease of 743 from the estimated 2002 level.
2003 System Budget Initiatives
In 2003, several major initiatives will continue to affect System budgets. As discussed in more detail in chapter 3, cost-reduction and efficiency initiatives in the
Chart 1.1 Distribution of Expenses of the Federal Reserve System, 2003
Board of Governors, 7.5%
Currency, 15.0%
Reserve Banks, 77.5%
2. Includes extraordinary items and expenses of the Office of Inspector General. See also chapter 2.
3. See appendix C.
check service, information technology, support, and other areas have helped Reserve Banks to address cost-recovery pressures in the check service as well as to continue to fund high-priority objectives, such as check modernization and projects on behalf of the Treasury.
Risks in the 2003 Budget
The Board and Reserve Banks have identified several risks that would require significant resources beyond the budget. The primary risks to the Board budget include significant changes in or shocks to the economy or the financial system, and additional security and contingency requirements.
Areas that present the most imminent risks to Reserve Banks in the 2003 bud-get are extremely challenging conditions in the check service and related Bankwide cost-reduction strategies. The impact of the recently announced check infrastructure changes are not reflected in the 2003 budgets because decisions were made after the budgets were finalized. In addi-

Federal Reserve System 9
tion, most Banks have submitted budgets for their supervision and regulation functions that are based on the current condition of the banking industry. Changes from the current assumptions could affect staffing levels. Finally, although Reserve Banks are fully reimbursed for services they perform on behalf of the Treasury, there is a continuing risk that throughout the year the Treasury will request additional work from the Banks that was not contemplated when the bud-gets were developed.
Trends in Expenses and Employment
From actual 1994 levels to budgeted 2003 amounts, the operating expenses of the Federal Reserve System have increased an average of 4.1 percent per year (2.2 percent per year when adjusted for inflation) (chart 1.2). Over the same period, nondefense discretionary spending by the federal government has increased an annual average of 5.2 percent (chart 1.3). Over the 1994–2003 period, Federal Reserve System employment has decreased 1,595 (chart 1.4).
Throughout most of the 1990s, spending on bank supervision expanded to meet the increase in the number and complex-
Chart 1.2 Operating Expenses of theFederal Reserve System, 1994–2003
1
NOTE. For 2002, estimated; for 2003, budgeted. 1. Calculated with the GDP price deflator.
Chart 1.3 Cumulative Change in Federal Reserve System Expenses and Federal Government Expenses, 1994–2003
NOTE. Federal government expenses are discretionary spending less expenditures on defense.
For 2002, estimated; for 2003, budgeted.
ity of examinations, the enhanced super-vision of foreign institutions, the greater attention to problem institutions, and the requirements of the Financial Institutions Reform, Recovery, and Enforcement Act of 1989 and the Federal Deposit Insurance Corporation Improvement Act of 1991. The System partially offset these increases through increased efficiencies in other operational areas, mainly services to the U.S. Treasury and services to financial institutions and the public. In the most recent years, the budget has grown at a slower rate, reflecting cost-reduction and efficiency initiatives.
Chart 1.4 Employment in theFederal Reserve System, 1994–2003
NOTE. For 2002, estimated; for 2003, budgeted.

10 Annual Report: Budget Review, 2003
Continued emphasis on efficiencies is also reducing staffing levels. Employment for 2003 is projected to decrease by 743 ANP, largely because of planned staff reductions by the Reserve Banks, primarily in the check, information technology, and support areas.
2003 Capital Budgets
The capital budget for both the Reserve Banks and the Board totals $521.3 mil-lion. The Board’s 2002–03 capital bud-get is $29.9 million. Approximately two-thirds of this total supports continued improvements in office automation and major upgrades to the information infrastructure. Funds are also provided for the maintenance and upkeep of the Board’s two main buildings. In addition, this bud-
get includes $3.3 million for projects resulting from increased security. A more detailed discussion of the Board capital budget is included in chapter 2.
The 2003 capital budget for Reserve Banks and FRIT totals $491.4 million, a $160.6 million increase from the 2002 estimated levels. The budget includes $430.5 million for the Banks and $60.9 million for FRIT. As in previous years, the 2003 capital budgets include funding for projects that support the strategic direction outlined in the Banks’ plans. These strategic goals include improving operational efficiency and effectiveness, improving services to Bank customers, and providing a safe, quality work environment. A more detailed discussion of Reserve Bank capital budgets is included in chapter 3. ■

11
Chapter 2
Board of Governors
Biennially, the Board of Governors and its senior staff undertake a planning process that results in a strategic plan for the next four years and a budget for the next two years. The revised 2002–03 budget for the Board consists of $466.0 million for operations, $1.5 million for extraordinary items (projects of a unique nature), and $7.8 million for the Office of Inspector General. The Board has authorized 1,884 staff positions for operational areas and 29 positions for the Office of Inspector General; no positions are required for the extraordinary items.
Planning Issues
In developing the 2002–03 plan, the Board identified the following issues.
• Management and staffing. Emphasis will be placed on recruitment, retention, management-succession planning, and organizational structure.
• Board organization. Acomprehensive review of Reserve Bank oversight activities, including a reexamination of the legal requirements for oversight, could result in a more efficient, effective, and consistent approach.
• Information technology. Areexamination of information technology items allowed spending in that area to be held at current levels.
• Physical plant. The 2001 purchase of a new building will significantly lower costs for office space.
• External and internal factors. The Board and its staff stand ready to ad-just priorities as necessary to deal with economic events and their effects on monetary, supervisory, and regulatory policymaking.
Major Initiatives
To address these major planning issues, the budget includes the following major initiatives and projects for the 2002–03 period.
• Attraction and retention of staff. Initiatives to improve the Board’s ability to attract and retain staff include the variable-pay program for economists, attorneys, and officers; an increase in the employee cash award program; a 4.6 percent merit increase for 2002; and a 4.0 percent merit increase for 2003.
• Employee benefits. A major increase in health insurance rates is being funded, as are initiatives to increase the transportation subsidy, increase the Board match for deferred compensation, and fund costs associated with the revised leave policy.
• Workload. New positions and a reduction in the number of vacant positions in specific divisions in response to increased workloads, new security concerns, and implementation of the compensation initiatives will all affect salary liability.
• Information technology. Central IT support was funded at the current level, except for increases to enhance disaster recovery.
• Physical plant. In line with the Board’s earlier strategic plan, a building purchased in 2001 has significantly reduced the net operating cost for office space in this budget. Capital investments are planned for the Board’s facilities as discussed below, in the section on the capital budget. Noncapital improvements are also planned for the facilities.

12 Annual Report: Budget Review, 2003
Ramifications of the September 11 Terrorist Attacks
After the terrorist attacks on September 11, but before the approval of the 2002– 03 budget, the projects and initiatives listed below, totaling $13.8 million, were funded in the 2002–03 budget.
• Enhanced capacity Boardwide for disaster recovery, including reducing the time to resume normal operations at remote sites and increasing the amount of information and the number of systems supported at those sites
• Initiatives to enhance physical security, including adding security staff; using bomb-sniffing dogs for greater perimeter security; using contractual support for off-site mail processing; and other, less visible, measures
• Additional staff in the Division of Reserve Bank Operations and Payment Systems to focus on system security issues in response to new terrorism-related legislation, and a new section (including new staff) to focus on private-sector clearance and settlement systems to increase the Board’s understanding and competence in this area
• Two positions in Banking Supervision and Regulation, in response to new terrorism-related legislation, to focus on money laundering and financial transactions associated with terrorist activity
• Four positions in the Office of the Staff Director for Management to improve the planning and coordination of contingency operations and to act as a liaison with the new Office of Home-land Security
After further review, in July of 2002, $11.0 million was added to the budget for the following:
• A restructuring and enhancement of the Board’s uniformed security force, which involved the addition of 98
positions, to strengthen the security provided to Board staff and premises and to implement changes according to the newly approved federal law enforcement authority of Board security officers
• Developing a contractual arrangement with private vendors for an off-site mail-processing operation to screen all mail and packages before delivery to Board premises in order to lessen the chances for the introduction of chemical, biological, radiological, or explosive materials into Board buildings
Operations Budget by Operational Area
The Board’s operations budget supports four broadly defined operational areas: monetary and economic policy, supervision and regulation, services to financial institutions and the public, and System policy direction and oversight (tables 2.1 and 2.2).
The largest increase in expenses is in the security portions (both information and physical) of overhead, which is spread, in proportion to direct expenses, among the four operational areas. This increase does not directly enhance the efficiency or effectiveness of current Board operations, but it is necessary given the threats that the nation and the Board are now facing.
Monetary and Economic Policy
The 2002–03 revised budget for monetary and economic policy is $186.9 million, an increase of $23.4 million, or an aver-age of 6.9 percent per year, from the 2000–01 actuals. Activities in this operational area include the Board’s monitoring and analysis of developments in the money and credit markets, the setting of reserve requirements, the approval of changes in the discount rate, and other activities related to managing the nation’s monetary policy.

Board of Governors 13
Table 2.1
Expenses of the Board of Governors for Operational Areas, Extraordinary Items, andOffice of Inspector General, 2000–01 and 2002–03Thousands of dollars except as noted
Monetary and economic policy . 161,863 163,521 186,886 0.5 6.9 Supervision and regulation ........ 156,664 154,157 191,225 –0.8 11.4 Services to financial institutions
and the public ......................... 8,892 8,500 9,233 –2.2 4.2 System policy direction and
oversight ................................. 63,780 61,482 78,644 –1.8 13.1
Total, Board operations ........... 391,199 387,660 465,988 –0.5 9.6
Extraordinary items .................... 7,847 8,392 1,500 3.4 –57.7
2000–01 (budgeted)
2000–01 (actuals)
2002–03 (revised budget)
2000–01 actuals
compared with 2000–01 budgeted
2002–03 revised budget compared with
2000–01 actuals
Operational area, extraordinary items, or
Office of Inspector General
Average annual percent change
Office of Inspector General ....... 6,617 6,322 7,757 –2.3 10.8
NOTE. Operating expenses reflect all redistributions for support and allocations for overhead, and they exclude
Besides the additional funding for compensation initiatives, programmatic increases in this area will cover the acquisition of additional data to assist staff in their responsibilities. These data relate to capital risk, retail banking fees and services, global financial markets, and consumer credit.
Supervision and Regulation
The 2002–03 revised budget for super-vision and regulation is $191.2 million, an increase of $37.1 million, or an aver-age of 11.4 percent per year, from the 2000–01 actuals. Activities in this area include working with other federal and state financial authorities to ensure safety and soundness in the operation of financial institutions, stability in the financial markets, and fair and equitable treatment of consumers in their financial transactions. The 2002–03 budgetary increases will enhance supervisory activities such as monitoring, inspecting, and examining banking organizations to assess their condition and their compliance with relevant
capital outlays. Components may not sum to totals and may not yield percentages shown because of rounding.
laws and regulations. Program increases include funding for seven positions added in late 2000, greater focus on money-laundering activities, international training and assistance to foreign governments, and a review of regulations and policies related to consumer protection. As risks to the financial sector grow, the staff will need to spend more time on bank examinations and monitoring under the risk-based supervision model implemented over the past few years.
Services to Financial Institutions and the Public
The 2002–03 revised budget for oversight of Reserve Bank services to financial institutions and the public is $9.2 million, an increase of $0.7 million, or an aver-age of 4.2 percent per year, over the 2000–01 actuals. This operational area provides support to and oversight of the Federal Reserve Banks, including evaluation of service strategies, pricing, performance, risks, and service and product design of the check-collection, automated

14 Annual Report: Budget Review, 2003
Table 2.2
Positions Authorized at the Board of Governors for Operational Areas, Support and Overhead, and Office of Inspector General, 2000–03 Thousands of dollars except as noted
Monetary and economic policy .. 433 433 430 0.0 –0.3 Supervision and regulation ......... 381 372 377 –1.2 0.7 Services to financial institutions
and the public .......................... 22 24 24 4.4 0.0 System policy direction and
oversight .................................. 163 157 168 –1.9 3.4
Support and overhead1 ................ 691 734 858 3.1 8.1
Subtotal ............................... 1,690 1,720 1,857 0.9 3.9
Reimbursable IT support2 ........... 25 25 27 0.0 3.9
Total, Board operations ............ 1,715 1,745 1,884 0.9 3.9
Extraordinary items ..................... . . . . . . . . . . . . . . . Office of Inspector General ........ 29 29 29 0.0 0.0
2000–01 (budgeted)
2000–01 (actuals)
2002–03 (revised budget)
2000–01 actuals
compared with 2000–01 budgeted
2002–03 revised budget compared with
2000–01 actuals
Operational area, extraordinary items, or
Office of Inspector General
Average annual percent change
1. Includes positions for seventeen youths, ten worker trainees, and four summer interns.
2. Positions in the Division of Information Technology that provide support to the Federal Financial Institu
clearinghouse, net settlement, currency and coin, and funds and securities transfer activities of the Reserve Banks; over-sight of the electronic payments mechanism; and annual evaluation of the Federal Reserve System’s currency, coin, and food-coupon operations. Costs associated with these programs will decline slightly during the next biennium because of the realization of savings from previous initiatives.
System Policy Direction and Oversight
The 2002–03 revised budget for System policy direction and oversight is $78.6 million, an increase of $17.2 million, or an average of 13.1 percent per year, from the 2000–01 actuals. This operational
tions Examination Council for processing data collected under the Home Mortgage Disclosure Act and the Community Reinvestment Act.
area covers oversight and direction of Board and Reserve Bank programs, with the exception of those mentioned under “Services to Financial Institutions and the Public,” above. The area includes pro-grams that directly support Board members in carrying out functions such as communicating with the Congress and the public, and oversight of significant sup-port activities at the Reserve Banks, such as finance, human resources, audit, and information technology.
Major program changes in this area include greater focus on security and contingency planning Systemwide and a new section to provide staff expertise on private-sector clearance and settlement systems. Fewer vacancies and an enhanced communication program are also responsible for the substantial increase.

Board of Governors 15
Capital Budget
The Board’s 2002–03 capital budget is $29.9 million. This is $12.7 million over the 2000–01 capital expenses of $17.2 million, most of which was spent on the Eccles Building Infrastructure Enhancement Project (EBIEP). Of the 2002–03 total, $19.8 million supports continued improvements in office automation and major upgrades to the information infrastructure. Funds are also provided for the maintenance and upkeep of the Eccles and Martin Buildings. Major facility projects include the purchase of an emergency generator, replacement of the Eccles Building roof, upgrades to security at building entrances, and a design and feasibility study for a major renovation of the Martin Building.
An additional $3.3 million has been budgeted for projects resulting from the September 11 terrorist attacks, including substantial improvements to information disaster recovery systems and expansion of the scope of the building entrance security upgrade project already scheduled.
The EBIEP will be completed during the 2002–03 budget period. Because of the phased nature of the project, which began in July 1999, the amount budgeted, $3.5 million, is $8.3 million less than the amount provided during the 2000–01 budget period.
The remaining $3.3 million of the capital budget is for projects associated with the improvements of the newly acquired building.
Positions
For the 2002–03 biennium, a net of 139 positions were added to the Board’s number of authorized positions, bringing the total to 1,884 (see appendix D, table D.2). A net increase of four positions was authorized for the Division of Consumer and Community Affairs to eliminate four
long-term dual occupancies. Nine positions were added to the Division of Reserve Bank Operations and Payment Systems and two positions to the Management Division in response to increased workload. Small, offsetting position adjustments were made in many divisions where efficiencies and workload factors made such changes possible.
In response to September 11, 120 positions were added. These positions are necessary to increase the Board’s physical security, provide additional resources for antiterrorism and anti-money-laundering activities, and increase the Board’s expertise in private-sector clearing and settlement systems.
2000–01 Budget Performance
Board operating expenses increased by $42.4 million (12.3 percent) from 1998–99 to 2000–01. Personnel-related expenses increased by $27.5 million (10.7 percent), while expenses for goods and services increased by $15.6 million (14.9 percent). Income increased by $0.7 million (4.2 percent). Final expenses for Board operations were $387.7 million, or $3.5 million (0.9 percent) less than budgeted.
The increase in personnel-related expenses (salaries, retirement, and insurance) is attributable to the merit pay increases (3.5 percent in 1999, 4.9 per-cent in 2000, and 4.7 percent in 2001), the new variable-pay program and increased cash award programs, and significant increases in retirement and insurance costs. Health insurance costs increased by $3.8 million (32.0 percent), and retirement costs increased by $1.8 million (17.5 percent).
Average employment during the 2000– 01 biennium was 1,610—18 employees (1.1 percent) lower than the 1998–99 average of 1,628. At biennium-end, the Board had 1,650 employees, the highest level of the biennium. The increase in

16 Annual Report: Budget Review, 2003
employment toward period-end was concentrated in the oversight area (aggressive hiring in the Division of Reserve Bank Operations and Payment Systems) and support area (security and facility operations). In the 2000–01 timeframe, there is little change in employment pat-terns in the three research divisions, where the variable-pay program for economists was implemented to increase recruiting and retention.
The largest contributing factor in the increase in the goods and services areas was a shifting of information technology resources from the Century Date Change (CDC) Project, which took place during the 1998–99 cycle, to backlogged projects in the divisions, which were worked on during the 2000–01 cycle. Because the charges for IT resources used by the CDC are in the extraordinary-items budget, the Board’s operating costs increased as those resources shifted to the divisions.
Increases in the contractual professional services area are the second-largest factor in the overall increase in the goods and services area over the pervious period. This growth primarily resulted from additional security requirements following September 11. Additional increases were the result of more use of outside computer services by the Division of Banking Supervision and Regulation, growth in the amount of and cost of data acquired from third parties, and additional contractor support in the Human Resources Function of the Management Division. Partially offsetting decreases in the contractual professional services area resulted from elimination of charges associated with the Resource Shared Applications and reduced use of contractor support by the Division of Information Technology.
Trends in Expenses and Employment
The rate of increase within the 2002–03 budget is 9.6 percent per year. Largely
Chart 2.1 Operating Expenses of the Board of Governors, 1992–2003
1992 ..................... 122.8 122.8 1993 ..................... 136.3 132.8 1994 ..................... 140.7 133.9 1995 ..................... 151.2 140.4 1996 ..................... 162.7 148.2 1997 ..................... 163.3 146.1 1998 ..................... 171.7 151.7 1999 ..................... 173.5 151.4 2000 ..................... 182.5 156.1 2001 ..................... 210.9 176.6 2002 ..................... 216.9 177.9 2003 ..................... 238.1 191.2
Millions of dollars Year
Current dollars 1992 dollars1
1
NOTE. For 2001, actuals; for 2002–03, budgeted. Excludes the Office of Inspector General and extraordinary items. The annual values for 1998–2003 are the approximate calendar-year figures contained within the respective two-year budgets.
1. Calculated with the GDP price deflator.
because of security enhancements and merit pay initiatives, this is higher than the projected 6.2 percent average annual rate of increase from the 1992–93 period to the 2002–03 period (charts 2.1 through 2.4). The increase over this ten-year period is mainly attributable to the increasing complexity of Board work. This increased complexity required a net increase in positions and higher average grades, higher salary and benefit costs, and increasingly sophisticated automation systems to manage sharply increasing volumes of data. Merit pay, new compensation initiatives, promotions and reclassifications, higher benefit costs, a lower projected number of vacancies in certain

Board of Governors 17
Chart 2.2 Expenses for Personnel Services at the Board of Governors, 1992–2003
Note. See notes to chart 2.1.
divisions, and increased use of contractual support for continuity of operations increased the budget.
Approximately three-fourths of the Board’s operating expenses are for personnel; consequently, analysis of trends is heavily tied to staffing levels. From 1992 to 2003, the number of authorized positions for Board operations rose from 1,639 to 1,853, a net increase of 185, or 11.3 percent. A large part of this increase in positions is for new security precautions. Reflecting the growing complexity of the Board’s work, the average grade for professional staff rose from 25 to 26.
During the 10-year period, changes in banking, frequently associated with automation enhancements, increased the
Chart 2.3 Expenses for Goods and Services of the Board of Governors, 1992–2003
Note. See notes to chart 2.1.
Chart 2.4 Employment and Authorized Positions at the Board of Governors, 1992–2003
Year Employment Authorized Positions
1992 ................... 1,563 1,639 1993 ................... 1,636 1,664 1994 ................... 1,635 1,664 1995 ................... 1,664 1,665 1996 ................... 1,686 1,712 1997 ................... 1,638 1,713 1998 ................... 1,629 1,694 1999 ................... 1,600 1,680 2000 ................... 1,593 1,692 2001 ................... 1,639 1,714 2002 ................... 1,687 1,853 2003 ................... 1,687 1,853
NOTE. Year-end data. Excludes summer intern, worker trainee, and youth positions as well as positions for the Office of Inspector General. These positions number 60 for 2002 and 2003. Includes positions that provide sup-port to the Federal Financial Institutions Examination Council for processing data collected under the Home Mortgage Disclosure Act and the Community Reinvestment Act.
complexity of safety-and-soundness supervisory activities. To adequately per-form these activities, and to increase attention to consumer issues, including collection and analysis of data collected under the Home Mortgage Disclosure Act and Community Reinvestment Act, a net of thirty-four positions were added. (Many positions associated with lower-priority work were eliminated to offset the cost of the new work.) The increasing complexity of monetary policy issues resulted in an increase of twenty-five positions. Substantial change has occurred in the overall Reserve Bank environment, including numerous operational consolidations and related changes

18 Annual Report: Budget Review, 2003
to the governance process. As a result of these changes, as well as increased interest in private-sector companies important to the nation’s financial infrastructure, nineteen positions were added. Finally, a net decrease of five administrative and support positions resulted from the Board’s efforts to outsource where feasible; without these efforts, the number of administrative and support positions would have increased because of enhanced security and the acquisition of new office space.
While the number of positions at the Board has fluctuated during the 1992– 2003 period, the salary budget (not including retirement and insurance benefits) has remained relatively stable at roughly 64 percent of operating expenses. The portion of operating expenses devoted to retirement and insurance has increased approximately 1 percentage point over the period as a result of administrative actions to enhance health insurance and other benefits.
The Board experienced an average annual percentage increase in expenses for goods and services of 6.4 percent over the 1992–2003 period. The largest contributor to this increase was a 12.9 per-cent annual increase in the contractual professional services account resulting from outsourcing tasks such as security, IT services, and facilities support. Increases in the complexity of the Board’s work resulted in additional data purchases and training requests. Partially offsetting the overall increase was a significant decrease in rental costs because of the year-end 2001 acquisition of a building previously rented by the Board.
Survey Expenses
The Board’s extraordinary-items budget for 2002–03 provides funds of $1.5 mil-lion for the Survey of Small Business Finances ($0.8 million) and the Survey of Consumer Finances ($0.7 million). These surveys will improve the quality of economic data produced by the Board by gathering information on the economic behavior of U.S. households and the financial health of U.S. firms. A summary article on the survey of consumer finances is scheduled to be published in the January 2003 Federal Reserve Bulletin, and a version of the survey data will be released to the public shortly there-after. Preparations for the 2004 Survey of Consumer Finances are expected to be underway the first quarter of 2003.
During the course of 2003, Small Business Finances survey staff will make a recommendation to the Board, issue a request for proposal, and award a con-tract. Field work will not begin until about April 2004.
Office of Inspector General
The 2002–03 budget of $7.8 million for the Office of Inspector General (OIG) is separate from the Board’s. The OIG’s budget is prepared in a manner that is administratively consistent with the preparation of the Board’s operating bud-get. In conformance with the statutory independence of the office, the OIG presents its budget directly to the Chairman of the Board of Governors for consideration by the Board. ■

19
Chapter 3
Federal Reserve Banks
The 2003 operating budgets of the twelve Reserve Banks total $2,629.9 million.1
The 2003 total is $54.5 million, or 2.1 percent, above estimated 2002 expenses (table 3.1).2 Reserve Banks developed their 2003 budgets by incorporating spending guidance provided by System business leaders. In large part because of poor cost recovery in the check service, business leaders have set aggressive spending targets for most functions. The
1. These expenses include those budgeted by Federal Reserve Information Technology (FRIT) and the Office of Employee Benefits (OEB). Expenses from these entities have been charged to the Reserve Banks, as appropriate, and included in their budgets.
2. Unless otherwise noted, expenses also include costs associated with the check-standardization special project. Special projects are major efforts having Systemwide significance that are outside the budgets of the individual Reserve Banks.
Table 3.1
Monetary Control Act provides that “the Board shall require reductions in the operating budgets of the Federal Reserve banks commensurate with any actual or projected decline in the volume of services to be provided by such banks.” The Banks’ 2002 estimate and 2003 budget plans reflect, in part, the spending restraint necessary to improve cost /revenue performance in the check service.
Because of Reserve Banks’ adherence to specific targets for direct costs in the check service and to guidance from business leaders concerning most of the related support and overhead functions, the 2003 budget reflects lower check-service costs. Targets established for the 2003 budget, however, were not limited to areas affecting the check service. The supervision and regulation and cash functions also established budget targets.
Approximately 48 percent of Reserve Bank expenses in the 2003 budget are
Expenses of the Federal Reserve Banks, Net of Receipts and Claims for Reimbursement, 2002 and 2003 Millions of dollars except as noted
Operations ........................................................................... 2,575.4 2,629.9 54.5 2.1
LESS
Revenue from priced services ......................................... 909.6 925.8 16.2 1.8 Other income ................................................................... 1.0 0.8 –0.2 –20.0 Claims for reimbursement1 ............................................. 316.3 328.9 12.6 4.0
EQUALS
Net expenses .................................................................. 1,348.5 1,374.4 25.9 1.9
Change
PercentAmount
2003 (budgeted)
2002 (estimated)Item
NOTE. Excludes capital outlays. Includes expenses bud- Operating expenses reflect all redistributions for supgeted by Federal Reserve Information Technology (FRIT) port and allocations for overhead. and the System’s Office of Employee Benefits (OEB). 1. Costs of fiscal agency and depository services pro-Expenses from these entities have been charged to the vided ot the U.S. Treasury and other government agencies Reserve Banks, as appropriate, and included in their bud- that are billed to these agencies. gets. Componenets may not sum to totals and may not yield percentages shown because of rounding.

20 Annual Report: Budget Review, 2003
offset by priced-service revenues (35 per-cent) and reimbursable claims for services provided to the U.S. Treasury and other agencies (13 percent). Although budgeted 2003 revenue is up slightly from estimated 2002 levels, it is still significantly below the 2002 budgeted level, reflecting declines in check volume. Reimbursable claims are expected to increase 4.0 percent, reflecting higher costs for Treasury-requested projects partially off-set by efficiency measures and lower allocated costs from support and over-head functions.
The Reserve Banks’ 2003 budgeted net operating expenses are $1,374.4 million, 1.9 percent higher than the 2002 estimate. The moderate increase reflects efforts by all Banks to reduce costs, to improve priced-services performance, and to meet System targets established by national business leaders. Banks have been able to limit overall cost increases through plans to self-fund many new initiatives, implement productivity and efficiency measures, and continue consolidating functions at a regional or national level.
The average number of personnel (ANP) projected to be employed at the Reserve Banks, Federal Reserve Information Technology (FRIT), and the Office of Employee Benefits (OEB) during 2003 is 22,422, a decrease of 743 ANP, or 3.2 percent, from 2002 estimated staff levels
Table 3.2
(table 3.2).3 Although all Districts are planning to reduce staffing in 2003, three Banks—New York, Atlanta, and San Francisco—account for slightly more than half of the overall reductions. As a result of declining volumes and efforts to improve productivity, all Banks are reducing staff in the check service. Several Banks will also reduce check staff after making the transition to the standardized check-processing platform. The remainder of the reduction is the net effect of several System and District efforts to meet System cost-reduction initiatives and improve operational efficiencies. For more detail on expenses and ANP by District and operational area, see appendix E, tables E.1 through E.4.
2002 Budget Performance
The Reserve Banks estimate 2002 expenses have been $2,575.4 million, a decrease of $4.8 million, or 0.2 percent, from the approved 2002 budget of $2,580.2. The 2002 estimate is $116.1
3. The term average number of personnel describes levels and changes in employment at the Reserve Banks. ANP is the average number of employees in terms of full-time positions for the period. For instance, a full-time employee who starts work on July 1 counts as 0.5 ANP for that calendar year; two half-time employees who start on January 1 count as 1 ANP.
Employment at the Federal Reserve Banks, FRIT, and OEB, 2002 and 2003 Average number of personnel except as noted
Reserve Banks ..................................................................... 22,359 21,607 –752 –3.4 Federal Reserve Information Technology ........................... 774 779 5 0.6 Office of Employee Benefits ............................................... 32 36 4 12.5
Total .................................................................................... 23,165 22,422 –743 –3.2
Change
PercentAmount
2003 (budgeted)
2002 (estimated)Item
NOTE. Components may not sum to totals and may not yield percentages shown because of rounding. See text note 3 for definition of average number of personnel.

Federal Reserve Banks 21
Table 3.3
Budget Performance of the Federal Reserve Banks, Operating Expenses and Employment, 2002
Operating Expenses (millions of dollars) ..................................................... 2,580.2 2,575.4 –4.8 –0.2
Employment (average number of personnel) ................................... 23,550 23,165 –385 –1.6
Change
PercentAmount
2002 (estimated)
2002 (budgeted)Item
NOTE. Excludes capital outlays. Includes expenses budgeted by Federal Reserve Information Technology (FRIT) and the System’s Office of Employee Benefits (OEB). Expenses from these entities have been charged to the Reserve Banks, as appropriate, and included in their budgets. Componenets may not sum to totals and may not yield percentages shown because of rounding.
million above the 2001 actual expense of $2,459.3 million. The Banks estimate ANP at 23,165, a decrease of 385 ANP, or 1.6 percent, from approved 2002 bud-get levels and 54 ANP below 2001 actual levels.
Most Bank estimates include targeted staff reductions and realignment of resources due to volume declines in the check service. Check expenses and staffing are declining at nine Banks as resources are aligned to the lower volume projections, resulting in an underrun of $10.0 million and 241 ANP from the 2002 budget. Support and overhead costs, primarily in Information Technology (IT), are declining by a total of $9.3 million, largely as a result of staff reductions and lower depreciation expense. The 2002 estimate also reflects reductions in cash operations totaling $6.5 million from the 2002 budget, resulting primarily from lower staffing-related costs due to less-than-anticipated volume growth in several Districts, productivity improvements, and delayed implementation of equipment upgrades.
Offsetting some of the decreases are increasing expenses in other areas, including two large, one-time expenses. The Customer Relations and Support Office in Chicago incurred an $8.6 million
Operating expenses reflect all redistributions for sup-port and allocations for overhead.
See text note 3 for definition of average number of personnel.
expense as a result of canceling the FedLine for Windows project. Also, estimated 2002 severance payments are $16.9 million, $13.7 million higher than budgeted. Excluding these expenses, the 2002 estimate would be approximately $27 million lower than the approved 2002 budget.4 In addition to these one-time expenses, the estimate includes slightly-higher-than-anticipated costs in several Districts for check-standardization implementation and fully reimbursable Treasury projects.5
The 2003 Budget
Efforts to reduce spending in 2002 have positioned the Banks to develop 2003 budgets consistent with guidance provided by the System business leaders during the budget outlook process. This guidance has not only assisted Reserve Banks in developing their 2003 budgets
4. Excluding these one-time costs, the 2003 budget would reflect an increase of about $77 million, or 3.0 percent, from the adjusted 2002 estimate.
5. Although projected to be over budget in 2002, overall costs for the check-standardization project are still expected to be under budget for the life of the project.

22 Annual Report: Budget Review, 2003
and multiyear business plans but has also provided them with a management tool to better monitor direct-spending plans. Overall, Reserve Banks have met or exceeded the aggressive-business-leader guidance established earlier this year. Adherence to the guidance, in conjunction with other cost-reduction initiatives, helps the System address the cost-recovery pressures in the check service while enabling the Banks to fund other high-priority initiatives.
Initiatives Affecting the 2003 Budget
The 2003 budget provides funding for several System and Reserve Bank initiatives. The budgetary requirements for these initiatives are described below.
Check Modernization
Perhaps the single biggest factor influencing 2003 expense and staffing levels is the Banks’ effort to address the short-falls in check-cost recovery while managing the completion of the check-modernization projects. Check modernization encompasses four projects: check standardization, enterprisewide adjustments (EWA), FedImage, and check electronic access and delivery. Check standardization involves standardizing Reserve Bank item processing on a single platform and software suite, and centralized application software support. EWA provides a common, standard platform for check-adjustments processing throughout the System, which in the long term will improve efficiency and eliminate duplicate support. FedImage (formerly know as Image Services System) integrates cur-rent image production from nonstandard hardware and software platforms into a consistent production environment for the capture and archiving of check images. Check electronic access and delivery
migrates the check service to the new web-based platform for accessing check products.
In the 2003 budgets, these projects account for a $16.6 million increase over estimated 2002 expenses. According to the transition schedule, all Banks should be using the standard check-processing platform by year-end 2003. This standardization will allow Banks to gain efficiencies and reduce expenses associated with additional staff retained through con-versions to ensure a smooth transition. These savings alone, however, are not enough to address the challenges presented by lower volume projections, changes in deposit mix, and corresponding revenue shortfalls.
The Banks are taking steps to address these cost and revenue challenges. Banks that have completed the transition to check standardization and EWA have begun to capitalize on the efficiencies gained in the forward and adjustment processing environments. These savings are reflected in the check-service costs, which are $17.2 million, or 2.2 percent, less than 2002 estimated expenses. In the 2003 budget, staffing for check service is 568 ANP below 2001 actual levels.
The overall reduction in check costs is the result of Reserve Banks’ efforts to reduce direct costs and restrain support and overhead spending. Because charges from support and overhead account for about 30 percent of check-service costs, cost reductions in these areas are a necessary, though alone not sufficient, factor in achieving check spending targets. Much as the accounting area was provided with cost-reduction guidance over the last five years, each of the major sup-port and overhead areas was given specific spending guidance for 2003. In aggregate, these areas have reduced expenses by $18.5 million and 504 ANP. For most support services, expense growth is projected to be 2 percent or less, with the majority achieving budgeted

Federal Reserve Banks 23
expenses below the estimated 2002 levels.
Information Technology
The most significant cost reductions are in the area of information technology (IT). These reductions reflect the multi-year targeted-reduction initiative established by the Reserve Banks to reduce local IT costs from the 2001 bud-get by $65 million.6 Several efficiency initiatives are underway, including the e-mail server administration and management centralization project, standardization of desktop PC software application and hardware configurations, and implementation of Active Directory.7 FRIT also has efforts underway to use its resources more effectively, for example, by improving the efficiency of its mainframe processing environment. Budgeted IT costs for 2003 are $30.1 million below the 2001 budgeted levels.
The IT cost-reduction target was designed to be an ambitious goal supporting the reengineering of Reserve Banks’ provision of IT services. Reserve Banks recently have recognized that it is unlikely that the multiyear target will be achieved, in part because of delays in the desktop-standardization initiative and further study of a server-management initiative. They do believe, however, that the target has fostered opportunities to streamline and consolidate operations. In the 2003 budget, local IT staffing has decreased 154 ANP from the 2002 estimate. About half of the local IT staff reductions have been redirected to support initiatives in several of the nationally provided support services.
6. The IT multiyear target excludes support for Treasury initiatives, check-modernization projects, and economic research.
7. The Active Directory project is a centralized and standardized system that automates net-work management of user data, security, and distributed resources, enabling interoperability with other directories.
Electronic Access Customer Support
The Customer Relations and Support Office plans to consolidate the electronic access customer support function at two offices. Although project costs are expected to total $8.6 million in the 2003 budget, these costs are expected to be more than offset by savings at the other ten Banks over the next three years.
Treasury-Related Functions
The growth of 5.6 percent in Treasury-related functions is due to higher FRIT costs for Treasury Web Applications Infrastructure (TWAI) and Treasury Account Management Information (TAMI) system ($15.8 million). TWAI involves developing a network to support the Treasury applications that will connect customers and other businesses through the web. TAMI will also use web-based technology to improve reporting and reconcilement of Treasury account in-formation. This increase is partially off-set by reduced costs from the support and overhead areas, along with the savings that have been achieved through efficiency measures, such as the consolidation of Treasury check processing sites, from eight to four during 2002.
Supervision and Regulation
Total expenses for the supervision and regulation function increase $31.8 mil-lion, or 6.7 percent, in the 2003 budget, primarily because of the growth in the number and asset size of state member banks and an increased need to closely monitor large regional institutions in several Districts. The Reserve Banks have achieved efficiencies through increased use of risk-focused examinations and resource sharing among Reserve Banks, and have reduced travel costs through greater use of video conferencing. Systemwide, staffing levels remain flat, with a shift of personnel from foreign and

24 Annual Report: Budget Review, 2003
community bank work to multistate banking organizations. As with Treasury costs, growth in the supervision and regulation function would have been higher if not for the reductions in support and over-head costs.
Cash Services
The Cash Product Office also established budget guidance for the cash function as part of the budget process. Most Banks have budgeted to meet the guidance primarily by increasing efficiencies and adjusting staffing levels to meet volume projections, which appear to be more stable after several years of substantial growth.
Research
During the budget guidance-setting process, growth in the research area was estimated to be 4.7 percent based on a trend forecast. The research functions have budgeted an aggregate increase of 4.7 percent, with staffing expected to be seven ANP higher than the 2002 estimate.
2003 Salary Administration
The budgets for the Reserve Banks, FRIT, and OEB include $117.1 million to fund salary administration programs for officers and employees (appendix E, table E.5).8 The largest component of the salary programs is merit.9 The average merit increase is budgeted at 3.6 percent for officers and 3.5 percent for employees, totaling $43.2 million, or 41 percent of
8. Salary administration represents the budgeted funds that are available to increase compensation to officers and employees in the coming year. It does not include adjustments for changes in staffing levels, turnover and lags in hiring, and overtime.
9. Salary program costs described in this section include program expenses budgeted at the Reserve Banks, FRIT, and OEB.
the total salary administration budget. The other programs that affect base salaries— promotions, reclassifications, and market adjustments—total $13.5 million.
Officer and employee cash awards and incentive payments represent about $36.6 million, or 34 percent, of salary program costs. Cash award and incentive payment programs are increasing $3.2 million compared with 2002 estimated spending. Retention and severance payments (pro-grams designed to deliver one-time payments most often associated with reengineering and efficiency initiatives) total $2.1 million and $10.3 million, respectively. The 2003 budget reflects a decrease in funding from the 2002 estimate for retention payments ($0.6 mil-lion) and for severance payments ($6.7 million).
Officer incentive payments and cash awards total $11.3 million, or 7.1 percent of officer salary liability. Although the officer variable-pay threshold was set at 8.0 percent of salary liability for 2003, half of the Banks and FRIT did not fully fund officer incentive payments and cash awards. In 2003, ten Banks, FRIT, and OEB targeted more than half the officer variable-pay pool toward incentives. Employee incentive payments and cash awards total $25.3 million, or 2.3 percent of employee salary liability. The mix between incentive and cash awards in the employee category continues to be weighted toward cash awards (cash awards represent 1.3 percent of salary liability; incentives represent 1.0 percent).
Officer turnover, including retirements, is projected to decrease from an estimated 5.3 percent in 2002 to 3.9 percent in 2003.10 Reserve Banks estimate, however, that approximately one-third of all officers will be eligible to retire by second quarter 2004. Average employee turnover is projected to remain flat at 11 percent. Reserve Banks believe that continuing
10. Turnover rates include voluntary and involuntary departures.

Federal Reserve Banks 25
market pressures for critical skill sets will increase the risk of losing key employees. The Banks therefore plan to use variable pay, retention incentives, and other monetary and nonmonetary rewards for key officers and employees.
Retirement and other benefit expenses, which account for 14 percent of Reserve Bank budgets, are anticipated to increase by $21.8 million, or 6.1 percent, in 2003. The primary factors driving the high costs include increases in salary-related benefits, such as Social Security and Thrift Plan contributions, which are directly related to an increase in salaries, and higher health care costs. The increases in employer contributions for health benefits average 19 percent for non-HMO plans, 8.9 percent for HMOs, and 11 percent for dental plans. The Reserve Banks’ new consolidated health care program has helped to moderate the increase in employer contributions.
2003 Capital Budget
The 2003 capital budget submitted by the Reserve Banks and FRIT totals $491.4 million, a $160.6 million increase over the 2002 estimated levels. The budget includes $430.5 million for the Banks and $60.9 million for FRIT. The increase in 2003 outlays from the 2002 estimate is due largely to planned new building pro-grams and various other building-renovation projects. Tables E.6 and E.7 in appendix E detail capital expenditures by District and by category.
As in previous years, the 2003 capital budgets include funding for projects that support the strategic direction outlined in the Banks’ plans. These strategic goals include improving operational efficiency and effectiveness, improving services to Bank customers, and providing a safe, quality work environment. In support of these strategies, the 2003 budget identifies four major categories of capital out-lays: building projects, payment system
improvements, information technology initiatives, and security enhancements.
Building Projects
The proposed capital budget includes an estimated $268.7 million for building projects. Of this total, 58 percent, or $156.8 million, is related to the planned new building projects in Detroit, Houston, Kansas City, and Seattle. The remaining outlays in this category will fund various other major building renovations, as well as miscellaneous facility-improvement and energy-efficiency projects and acquisitions of contingency equipment.
Payment System Projects
The proposed capital budget includes $109.0 million for initiatives related to payment system improvement. Over 40 percent of these funds ($45.4 million) support reimbursable initiatives, including the Treasury Web Applications Infrastructure, Pay.gov, and Savings Bond Architecture projects. Outlays for the cash services area account for about one-third of the outlays. The 2003 budgets include funds for upgraded currency-processing equipment sensors ($19.0 million), cash inventory management systems, and Standard Cash Automation initiatives. Other outlays are associated with equipment and software needed in Districts migrating to the standard check-processing software platform in 2003 ($15.9 million) and for FRIT’s Web Applications Infrastructure initiative ($3.3 million), which includes outlays for the Secure IP (Internet Protocol) project.
Information Technology Projects
The proposed capital budget includes $55.0 million in funding for major information technology initiatives. These initiatives do not include the automation components of building or payment sys-

26 Annual Report: Budget Review, 2003
tems initiatives that are discussed separately. The strategic objectives outlined in the individual Bank budgets are directed toward achieving the System’s goal to increase the business value of System IT investments and to reduce technology costs. Of the total automation-related outlays, FRIT projects and acquisitions account for over half, or $30.9 million. The FRIT budget includes capital for the distributed processing, network, and mainframe environments, including a CPU replacement project and various software and hardware upgrades and enhancements. Aside from FRIT, the Districts have budgeted to begin replacing
aging servers in compliance with the System’s server-management initiative ($6.9 million). Bank budgets also include outlays for various other local initiatives and for systems operated or developed on behalf of the System.
Security Enhancements
The proposed capital budget includes $49.2 million in funding for security enhancements. Almost all Districts have included capital spending for security measures necessary to enhance security at Reserve Bank facilities. ■

Appendixes
29
Appendix A
Federal Reserve Budget Processes
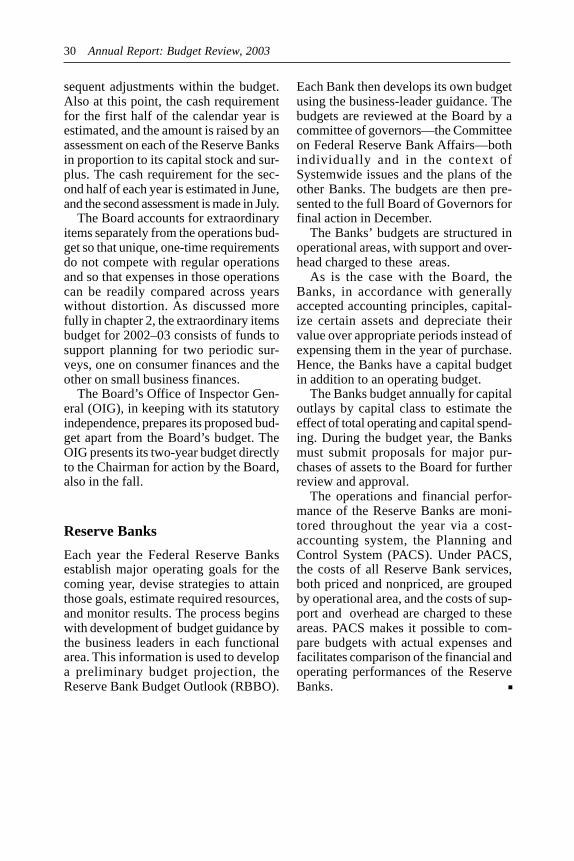
This appendix gives an overview of the separate budgets and budgeting processes followed by the Board of Governors and the Reserve Banks. The Federal Reserve System’s intent in the development and publication of this information is to pro-vide the reader with the assumptions and initiatives considered when the Federal Reserve System budgets were developed and approved by the Board of Governors.
Board of Governors
The Board’s budget covers a two-year period. The first year of the budget cycle—the even-numbered year—is used to update the strategic plan for the next four years, and the second year is used to develop the budget for the next two years. The two-year cycle begins in the fall (thus, for the 2004–05 budget, the fall of 2002). At that time, the Board’s divisions examine their operating environments and look for any adjustments to their priorities, activities, and resources that might improve the efficiency and effectiveness of the Board’s operations.
The management of each division discusses with the appropriate Board over-sight committee the issues that result from its review. After any adjustment, the results are given to the Staff Planning Group, a small group of senior managers with a Boardwide perspective, for use in their analysis of the Board’s budget options.
After consulting with the Board-level Committee on Board Affairs for final guidance, the Staff Planning Group updates the strategic plan, which is used to prepare a preliminary budget objective that identifies the level and allocation of resources needed to support the plan. As part of this process, individual division budget objectives are prepared on the
basis of Boardwide priorities and planning assumptions. The Committee on Board Affairs reviews the plan and preliminary budget objective, clarifies out-standing planning issues with the Staff Planning Group and division directors, and at the end of summer of odd-numbered years submits the budget objective to the Board for its consideration.
The divisions use the budget objective approved by the Board to complete their budgeting under the approved plan. The Board’s Committee on Board Affairs, under authority delegated by the Chair-man, oversees the process until the bud-get is submitted to the Board for action in the fall of the odd-numbered year.
The Board of Governors budgets its resources by division and accounts for its activities by division and across operational areas. Direct costs, such as those for salary, retirement, insurance, and travel, are billed to the operational areas. Costs for data processing are also charged as a direct expense to each of the areas according to service-level agreements (at prices derived from the cost of resources needed to provide the services and agreed upon before the budget year starts). Expenses for other elements of support and overhead are distributed among the operational areas in proportion to the share of direct costs attributable to each area.
The Board, in accordance with generally accepted accounting principles, capitalizes certain assets and depreciates their value over appropriate periods instead of expensing them in their year of purchase. Hence, the Board has both an operations budget and a capital budget.
After the budget is approved by the Board, it is converted to an operating plan that allocates funding by month; the operating plan is also the vehicle for sub-
30 Annual Report: Budget Review, 2003
sequent adjustments within the budget. Also at this point, the cash requirement for the first half of the calendar year is estimated, and the amount is raised by an assessment on each of the Reserve Banks in proportion to its capital stock and surplus. The cash requirement for the second half of each year is estimated in June, and the second assessment is made in July.
The Board accounts for extraordinary items separately from the operations bud-get so that unique, one-time requirements do not compete with regular operations and so that expenses in those operations can be readily compared across years without distortion. As discussed more fully in chapter 2, the extraordinary items budget for 2002–03 consists of funds to support planning for two periodic surveys, one on consumer finances and the other on small business finances.
The Board’s Office of Inspector General (OIG), in keeping with its statutory independence, prepares its proposed bud-get apart from the Board’s budget. The OIG presents its two-year budget directly to the Chairman for action by the Board, also in the fall.
Reserve Banks
Each year the Federal Reserve Banks establish major operating goals for the coming year, devise strategies to attain those goals, estimate required resources, and monitor results. The process begins with development of budget guidance by the business leaders in each functional area. This information is used to develop a preliminary budget projection, the Reserve Bank Budget Outlook (RBBO).
Each Bank then develops its own budget using the business-leader guidance. The budgets are reviewed at the Board by a committee of governors—the Committee on Federal Reserve Bank Affairs—both individually and in the context of Systemwide issues and the plans of the other Banks. The budgets are then presented to the full Board of Governors for final action in December.
The Banks’ budgets are structured in operational areas, with support and over-head charged to these areas.
As is the case with the Board, the Banks, in accordance with generally accepted accounting principles, capitalize certain assets and depreciate their value over appropriate periods instead of expensing them in the year of purchase. Hence, the Banks have a capital budget in addition to an operating budget.
The Banks budget annually for capital outlays by capital class to estimate the effect of total operating and capital spending. During the budget year, the Banks must submit proposals for major purchases of assets to the Board for further review and approval.
The operations and financial performance of the Reserve Banks are monitored throughout the year via a cost-accounting system, the Planning and Control System (PACS). Under PACS, the costs of all Reserve Bank services, both priced and nonpriced, are grouped by operational area, and the costs of sup-port and overhead are charged to these areas. PACS makes it possible to compare budgets with actual expenses and facilitates comparison of the financial and operating performances of the Reserve Banks. ■

31
Appendix B
Priced Services
The Monetary Control Act of 1980 requires the Federal Reserve to charge depository institutions for certain services that the Federal Reserve had previously provided without explicit charge and only to member banks. As the act requires, the fees charged for providing these priced services are fees set to recover, over the long run, all direct and indirect costs of providing the services plus imputed costs, including the interest on items credited before actual collection (float), and the private-sector adjustment factor (PSAF). The intent of the PSAF calculation is to impute the costs that would have been incurred, such as taxes that would have been paid; and the profits that would have been earned, such as the return on capital, had the Federal Reserve Banks’ priced services been provided by a private firm. Table B.1 provides details on projected revenue from priced services.
Annual Pricing Process
To meet the requirement for the full recovery of costs, the Federal Reserve has
Table B.1
Revenue from Priced Services, 2001–2003 Millions of dollars
Funds transfers and net settlement ............. 63.8 56.0 51.9
Automated clearinghouse ... 79.4 70.8 69.9 Commercial checks ............ 793.2 757.9 781.0 Book-entry securities
transfers ...................... 19.7 22.0 20.6 Noncash collection ............. 2.0 1.6 1.9 Special cash services .......... 2.3 1.4 0.4
Total ................................... 960.4 909.6 925.8
2003 (budgeted)
2002 (esti-
mated) 2001 Service
developed an annual pricing process involving projections of Reserve Bank expenses, volumes, and revenues, as well as the PSAF and net income on clearing balances, for each major service category.
Fees for Federal Reserve services must be approved by the product director for the respective service, by the Financial Services Policy Committee, and ultimately by the Board of Governors.1
The cost of float is estimated by applying the current federal funds rate to the level of float expected to be generated in the coming year. Estimates of income taxes and the return on capital are based on tax and financing rates derived using a model of the fifty largest U.S. bank holding companies. These rates are applied to the assets the Federal Reserve expects to use in providing priced services in the coming year.2 The other components of the PSAF are derived from the budgets of the Reserve Banks and the Board: the imputed sales tax (based on budgeted outlays for materials, supplies, and capital assets); the imputed assessment for insurance by the Federal Deposit
1. The product directors are the first vice presidents at selected Reserve Banks with responsibility for day-to-day policy guidance over specific services. The Financial Services Policy Commit-tee (FSPC) is responsible for the overall direction of financial services and related support functions for the Federal Reserve Banks.
2. Beginning in 2002, a portion of depository institution clearing balances held with the Federal Reserve for processing transactions will be used as a funding source for priced-service assets. Equity will be imputed at 5 percent of total assets to meet the FDIC definition of a well-capitalized institution in its classification for assessing insurance premiums. The equity financing rate, or pretax return on equity, will be based on the aver-age of the return-on-equity results of three economic models using data from the bank holding company model.

32 Annual Report: Budget Review, 2003
Insurance Corporation (FDIC) (based on expected clearing balances and amounts deferred to depository institutions for items deposited for collection with the Reserve Banks); and the portion of the expenses of the Board of Governors directly related to providing priced services. ■

33
Appendix C
Currency Budget
Federal Reserve Banks circulate new and fit currency through depository institutions and destroy currency already in circulation as it becomes unfit or when a new design is issued. Each year, under authority delegated by the Board, the director of the Division of Reserve Bank Operations and Payment Systems orders new currency from the U.S. Department of Treasury’s Bureau of Engraving and Printing (BEP). Upon reviewing the order, the BEP sets billing rates for new currency, which Board staff uses to pre-pare the annual budget for new currency. Once the Board approves the new currency budget, it assesses each Federal Reserve Bank through an accounting procedure similar to that used in assessing the Banks for the Board’s operating expenses.
Estimated currency expenditures for 2002 totaled $430.5 million, which is $17.0 million, or 4.1 percent, more than budgeted (table C.1). The overrun resulted primarily from an increase in the print order and increased currency transportation costs. Budgeted currency expenditures for 2003 total $510.3 million, or 18.5 percent more than estimated 2002 expenses (chart C.1). The increase is primarily the result of a significant increase in the billing rate for the new $20 note
Table C.1
Chart C.1 Federal Reserve Budget for New Currency, 1994–2003
NOTE. For 2002, estimated; for 2003, budgeted
design and an increase in the cost of trans-porting new currency from the BEP to Reserve Bank offices.
Printing of Federal Reserve Notes
The Board ordered 8.2 billion new notes for the calendar year 2003 budget. The budget for printing the Board’s order is $490.9 million, or 96.2 percent of the total 2003 new currency budget. For January through September 2003 (the portion of the federal government’s 2003 fiscal year that falls within the 2003 calendar year), the BEP will produce
Federal Reserve Budget for New Currency, 2002 and 2003 Thousands of dollars except as noted
Printing of new Federal Resereve notes ...................................................... 411,391 490,891 19.3 Currency transportation ............................................................................... 12,902 13,740 6.5 Counterfeit-deterrence research ................................................................... 2,662 2,862 7.5 Reimbursement to the U.S. Treasury’s Office of Currency Standards ....... 3,506 2,790 -20.4
Total cost of currency ................................................................................ 430,461 510,283 18.5
Percentage change
2003 (budgeted)
2002 (estimated)
Item

34 Annual Report: Budget Review, 2003
Table C.2
Projected Federal Reserve Costs of Printing New Notes, by Type of Note, 2003
Unthreaded ($1s) ..................................... 3,975.0 48.4 39.98 158,921
New Currency Design ($5S) ..................................................... 521.9 6.3 57.00 29,748 ($10s, $20s, $50s, $100s) .................... 2,160.2 26.3 68.75 148,516
Series-2004 ($20) .................................... 1,560.5 19.0 98.50 153,706 Average cost ............................................. 58.25
Total ......................................................... 8,217.6 100 490,891
Total cost (thousands of
dollars)
Cost per thousand notes
(dollars)
Percentage of total notesType of currency Number of
notes (millions)
6.3 billion notes; for October through December 2003 (the remainder of the 2003 calendar year), it will produce another 1.9 billion notes.
The 2003 billing rates reflect four types of currency: unthreaded ($1s), New Currency Design (NCD) without color-shifting ink ($5s), NCD with color-shifting ink1 ($10s, $20s, $50s, and $100s), and Series-2004 with new and enhanced security features ($20s) (table C.2). During 2003, 33 percent of the notes produced will be NCD notes, 19 percent will be Series-2004 ($20s), and the remaining 48 percent will be unthreaded ($1s). The average price that the Board will pay the BEP for producing notes in 2003 is $58.25 per thousand.
Currency Transportation
The currency transportation budget consists of funds for shipping new currency from the BEP and among the Reserve Banks. The 2003 currency transportation budget is $13.7 million, which is $838 thousand, or 6.5 percent, more than the Board estimated for 2002. The 2003 bud-get for new currency shipments from the BEP is $8.4 million, or 11.1 percent,
1. The color of the color-shifting ink shifts from green to black as the viewing angle of the note changes.
greater than estimated 2002 expenses because of a projected increase in the cost of air shipment. The 2003 budget for currency shipments among Reserve Banks is $5.3 million, which is unchanged from estimated 2002 expenses. These shipments move currency from Reserve Bank offices with excess fit currency to offices that would otherwise require new currency from the BEP.
Counterfeit-Deterrence Research
The 2003 budget for the counterfeit-deterrence program is $2.9 million. The funds will support the Federal Reserve System’s participation in the Central Bank Counterfeit Deterrence Group (formerly known as the SSG-2), which operates under the auspices of the G-10 governors to combat digital counterfeiting.
Treasury’sOffice of Currency Standards
The 2003 budget is $2.8 million to reimburse the Treasury for Office of Currency Standards (OCS) expenses. The OCS develops standards for the cancellation, destruction, and accountability of unfit currency and processes claims for the redemption of damaged or mutilated currency. ■

35
Appendix D
Expenses and Employment at the Board of Governors
Table D.1
Operating Expenses of the Board of Governors, by Division, Office or Special Account,2000–03Thousands of dollars, except as noted
Board Members ............................................ 9,002 8,300 11,813 -4.0 19.3 Secretary ....................................................... 9,376 8,983 11,256 -2.1 11.9 Research and Statistics ................................ 63,080 62,640 67,382 -0.3 3.7 International Finance .................................... 23,308 22,055 24,873 -2.7 6.2 Monetary Affairs .......................................... 19,238 18,819 19,666 -1.1 2.2 Banking Supervision and Regulation ........... 63,511 60,951 73,859 -2.0 10.1 Consumer and Community Affairs .............. 18,099 17,759 20,671 -0.9 7.9 Legal ............................................................. 18,045 18,079 20,754 0.1 7.1 Reserve Bank Operations
and Payment Systems .......................... 31,988 29,801 35,548 -3.5 9.2 Staff Director for Management .................... 4,060 3,920 7,097 -1.7 34.5 Management ................................................. 22,755 21,581 25,248 -2.6 8.2 Support Services .......................................... 58,371 59,692 74,684 1.1 11.9 Information Technology ............................... 72,906 71,883 81,855 -0.7 6.7 Publications Committee ............................... 3,497 3,205 3,687 -4.3 7.3 Special projects ............................................ 11,442 17,481 29,073 23.6 29.0 IRM income account1 ................................... (37,483) (37,489) (41,477) 0.0 5.2
Total, Board operations ............................. 391,198 387,660 465,988 -0.5 9.6
Extraordinary items ...................................... 7,847 8,392 1,500 3.4 -57.7 Office of the Inspector General ................... 6,617 6,322 7,757 -2.3 10.8
2000–01 (budgeted)
2000–01 (actuals)
2002–03 (revised budget)
2000–01 actuals
compared with 2000–01
budgeted
2002–03 revised budget
compared with 2000–01
actuals
Division, office or special account
Average annual percent change
1. Income from various Board divisions for use of central information resources management (IRM) resources.

36 Annual Report: Budget Review, 2003
Table D.2
Positions Authorized at the Board of Governors, by Division, Office, or Special Account, 2000–03
Board Members ........................................................ 54 49 –5 Secretary ................................................................... 56 55 –1 Staff Director for Management ................................ 25 37 12 Research and Statistics ............................................ 279 278 –1 International Finance ................................................ 119 120 1 Monetary Affairs ...................................................... 62 69 7 Banking Supervision and Regulation ....................... 227 229 2 Consumer and Community Affairs .......................... 78 82 4 Legal ......................................................................... 82 82 . . . Reserve Bank Operations
and Payment Systems ...................................... 129 138 9 Management ............................................................. 88 90 2
Concern1 .............................................................. 31 31 . . . Support Services ...................................................... 204 312 108 Information Technology2 .......................................... 284 283 –1 Special projects ........................................................ 2 2 . . .
Subtotal ................................................................... 1,720 1,857 137
Reimbursable IT support2 ........................................ 25 27 2
Total, Board operations ......................................... 1,745 1,884 139
Office of Inspector General ..................................... 29 29 . . .
2000–01 (authorized)
2002–03 (revised budget) ChangeDivision, office, or special account
1. Summer intern and youth positions handled by the tions Examination Council for processing data collected Management Division. under the Home Mortgage Disclosure Act and the Com-
2. Positions in the Division of Information Technol- munity Reinvestment Act. ogy that provide support to the Federal Financial Institu . . . Not applicable.

Expenses and Employment 37
Table D.3
Operating Expenses of the Board of Governors, by Account Classification,2000–01 to 2002–03Thousands of dollars except as noted
Personnel services Salaries ......................................................... 246,502 242,516 292,902 –0.8 9.9 Retirement .................................................... 21,533 22,408 27,808 2.0 11. Insurance ...................................................... 19,559 19,004 24,001 –1.4 12.4
Subtotal .................................................... 287,595 283,928 344,711 –0.6 10.2
Goods and services Travel ............................................................ 11,537 10,627 13,606 –4.0 13.2 Postage and shipping ................................... 1,659 1,726 1,607 2.0 –3.5 Telecommunications ..................................... 6,599 7,293 7,798 5.1 3.4 Printing and binding ..................................... 2,549 2,338 2,543 –4.2 4.3 Publications .................................................. 2,297 1,805 2,066 –11.4 7.0 Stationery and supplies ................................ 1,936 2,429 2,546 12.0 2.4 Software ....................................................... 9,967 9,547 11,223 –2.1 8.4 Furniture and equipment .............................. 8,125 7,463 7,128 –4.2 –2.3 Rentals .......................................................... 10,296 8,869 857 –7.2 –68.9 Books and subscriptions .............................. 2,088 1,951 2,120 –3.4 4.3 Utilities ......................................................... 4,457 4,564 5,555 1.2 10.3 Building repairs and alterations ................... 3,578 3,673 3,688 1.3 0.2 Furniture reapirs and maintenance ............... 4,263 3,860 7,124 –4.8 35.9 Contingency Processing Center ................... . . . 457 400 . . . –6.4 Contractual professional services ................ 28,347 26,875 35,984 –2.6 15.7 Tuition, registration, and membership fees . 3,270 2,805 3,741 –7.4 15.5 Subsidies and contributions ......................... 1,809 1,688 1,897 –3.4 6.0 Depreciation ................................................. 18,842 18,855 25,482 0.0 16.3 Other ............................................................. (18,015) (13,093) (14,089) –14.7 3.7
Subtotal .................................................... 103,603 103,732 121,277 0.1 8.1
Total, Board operations ............................. 391,198 387,660 465,988 –0.5 9.6
Extraordinary items ...................................... 7,847 8,392 1,500 3.4 –57.7 Office of the Inspector General ................... 6,617 6,322 7,757 –2.3 10.8
2000–01 (budgeted)
2000–01 (actuals)
2002–03 (revised budget)
2000–01 actuals
compared with 2000–01
budgeted
2002–03 revised budget
compared with 2000–01
actuals
Division, office or special account
Average annual percent change
Note. Components may not sum to totals and may not . . . Not applicable. yield percentages shown because of rounding.

39
Appendix E
Expenses and Employment at the Federal Reserve Banks
Table E.1
Operating Expenses of the Federal Reserve Banks, by District, 2002 and 2003 Thousands of dollars except as noted
Boston ........................... 155,701 159,186 167,228 2.2 5.1 New York ...................... 508,994 498,229 497,362 –2.1 –0.2 Philadelphia ................... 125,751 123,265 127,758 –2.0 3.6 Cleveland ....................... 138,766 137,568 146,181 –0.9 6.3 Richmond ...................... 198,829 205,410 205,593 3.3 0.1 Atlanta ........................... 298,857 292,010 297,992 –2.3 2.0 Chicago .......................... 244,842 253,911 247,443 3.7 –2.5 St. Louis ........................ 139,348 139,415 154,319 0.0 10.7 Minneapolis ................... 145,083 141,852 147,318 –2.2 3.9 Kansas City ................... 170,040 169,611 174,960 –0.3 3.2 Dallas ............................. 151,614 152,658 162,630 0.7 6.5 San Francisco ................ 290,009 287,383 286,523 –0.9 –0.3
Total, all Districts ....... 2,567,834 2,560,498 2,615,309 –0.3 2.1
Special project Check standardization ... 12,387 14,890 14,627 20.2 –1.8
Total .............................. 2,580,220 2,575,388 2,629,936 –0.2 2.1
2002 (budgeted)
2002 (estimated)
2003 (budgeted) 2002 estimated
compared with 2002 budgeted
2003 budgeted compared with 2002 estimated
District
Percent change
NOTE. Excludes capital outlays. Includes expenses Components may not sum to totals and may not yield budgeted by Federal Reserve Information Technology percentages shown because of rounding.
(FRIT) and the System’s Office of Employee Benefits Operating expenses reflect all redistributions for sup(OEB). port and allocations for overhead.

40 Annual Report: Budget Review, 2003
Table E.2
Employment at the Federal Reserve Banks, by District, and at FRIT and OEB, 2002 and 2003 Average number of personnel except as noted
Boston ........................................ 1,341 1,327 1,270 –14 –57 New York ................................... 3,383 3,351 3,185 –32 –167 Philadelphia ................................ 1,298 1,265 1,241 –33 –24 Cleveland .................................... 1,402 1,354 1,348 –48 –5 Richmond ................................... 2,173 2,126 2,085 –47 –41 Atlanta ........................................ 2,463 2,430 2,317 –33 –113 Chicago ....................................... 2,160 2,122 2,053 –38 –69 St. Louis ..................................... 1,355 1,323 1,310 –32 –13 Minneapolis ................................ 1,306 1,291 1,323 –15 32 Kansas City ................................ 1,769 1,749 1,701 –21 –48 Dallas .......................................... 1,531 1,526 1,446 –5 –80 San Francisco ............................. 2,572 2,495 2,328 –77 –167
Total, all Districts .................... 22,753 22,359 21,607 –394 –752
Federal Reserve Information Technology ......................... 763 774 779 11 5
Office of Employee Benefits ...... 34 32 36 –2
Total ........................................... 23,550 23,165 22,422 –385 –743
2002 (budgeted)
2002 (estimated)
2003 (budgeted) 2002 estimated
compared with 2002 budgeted
2003 budgeted compared with 2002 estimated
District
Amount change
4
NOTE. See note to table E.1. The term average number of personnel (ANP)
describes levels and changes in employment at the Reserve Banks. ANP is the average number of employees
in terms of full-time positions for the period. For instance, a full-time employee who starts work on July 1 counts as 0.5 ANP for that calendar year; two half-time employees who start on January 1 count as 1 ANP.
Table E.3
Operating Expenses of the Federal Reserve Banks, by Operational Area, 2002 and 2003 Thousands of dollars except as noted
Monetary and economic policy ........ 242,938 246,002 257,610 1.3 4.7 Services to U.S. Treasury and
other government agencies ....... 284,116 292,711 309,026 3.0 5.6 Services to financial institutions
and the public ............................ 626,783 618,738 648,554 –1.3 4.8 Supervision and regulation ............... 474,993 471,858 503,665 –0.7 6.7 Fee-based services to financial
institutions ................................. 939,004 931,189 896,453 –0.8 –3.7
Total .................................................. 2,567,834 2,560,498 2,615,309 –0.3 2.1
2002 (budgeted)
2002 (estimated)
2003 (budgeted) 2002 estimated
compared with 2002 budgeted
2003 budgeted compared with 2002 estimated
Operational area
Percent change
NOTE. Operational expenses include FRIT and OEB and exclude special-project costs.

Expenses and Employment 41
Table E.4
Employment at the Federal Reserve Banks, by Operational Area, 2002 and 2003 Average number of personnel except as noted
Monetary and economic policy ........ 850 858 865 8 7 Services to U.S. Treasury and
other government agencies ....... 1,334 1,313 1,273 –21 –40 Services to financial institutions
and the public ............................ 2,916 2,888 2,858 –27 –31 Supervision and regulation ............... 2,607 2,597 2,588 –10 –9 Fee-based services to financial
institutions ................................. 5,402 5,165 4,782 –237 –383 Support and overhead ....................... 9,644 9,537 9,241 –107 –296
Total .................................................. 22,753 22,359 21,607 –394 –752
2002 (budgeted)
2002 (estimated)
2003 (budgeted) 2002 estimated
compared with 2002 budgeted
2003 budgeted compared with 2002 estimated
Operational area
Amount change
NOTE. Operational area employment excludes FRIT, OEB, and special-project average number of personnel.

42 Annual Report: Budget Review, 2003
Table E.5
Salary Administration Expenses of the Federal Resereve Banks, by District, and of FRIT and OEB, for Officers and Employees, 2003 Thousands of dollars except as noted
Boston ....................... 2,640 552 488 4.5 –74 –272 –0.4 3,334 4.1 New York .................. 9,136 1,845 1,095 4.7 –175 1,102 0.4 13,003 5.0 Philadelphia ............... 2,140 338 192 3.9 20 352 0.5 3,042 4.5 Cleveland ................... 2,379 448 544 4.8 90 170 0.4 3,631 5.1 Richmond .................. 3,362 1,170 283 4.2 318 104 0.4 5,237 4.6 Atlanta ....................... 4,148 1,513 340 4.8 392 250 0.5 6,642 5.3 Chicago ...................... 4,415 750 135 4.2 –353 373 0.0 5,319 4.2 St. Louis .................... 2,225 544 15 4.1 –111 388 0.4 3,061 4.5 Minneapolis ............... 2,379 366 0 3.9 225 59 0.4 3,028 4.3 Kansas City ............... 3,209 1,679 192 5.5 147 313 0.5 5,540 6.0 Dallas ......................... 2,158 246 23 3.3 300 70 0.5 2,797 3.8 San Francisco ............ 3,109 264 113 2.4 –560 – 319 –0.6 2,607 1.8
Total, all Districts .... 41,299 9,713 3,419 4.2 219 2,589 0.2 57,240 4.4
Federal Reserve Information Technology ........ 1,704 329 0 3.2 19 383 0.6 2,435 3.8
Office of Employee Benefits ............. 187 0 18 5.6 7 5 0.3 216 5.9
Total .......................... 43,189 10,042 3,438 4.2 245 2,977 0.2 59,891 4.4
Merit Market adjustments
Cash awards
Total Percent (total)
District
Variable pay
Promotions and reclassifi
cations
Percent (subtotal)
Incentive payments
Percent (subtotal)
(2002 estimated minus 2003 budgeted)
Salary base
Salary administration: Represents the budgeted funds that are available to increase compensation to officers and employees in the coming year. It does not include adjustments for changes in staffing levels, turnover and lags in hiring, and overtime.
Merit: The amount of budgeted salary expense that reflects the cumulative effect of planned salary increases based on performance.
Promotions and reclassifications: The amount of budgeted salary expense that reflects the cumulative effect of salary increases for individuals as a result of grade promotions and reclassifications resulting from a job evaluation.
Market adjustments: The amount of budgeted salary expense to bring individual salaries to the minimum of a grade range or to better align salaries with the market.
Cash awards: The change in the amount of payments for awards in recognition of exceptional achievements.
Incentive payments: The change in the amount of other personnel expense that represents payments for the achievement of predetermined goals.
Percent: The total of the stated payments as a percent-age of total salary and other personnel expense.

Expenses and Employment 43
Table E.6
Capital Outlays of the Federal Resereve Banks, by District, and of FRIT and OEB, 2002 and 2003 Thousands of dollars except as noted
Boston ............................................... 19,282 13,088 24,909 –32.1 90.3 New York .......................................... 66,718 49,964 56,454 –25.1 13.0 Philadelphia ....................................... 19,513 18,587 15,804 –4.8 –15.0 Cleveland ........................................... 22,781 25,842 21,609 13.4 –16.4 Richmond .......................................... 27,284 20,610 17,522 –24.5 –15.0 Atlanta ............................................... 26,877 18,866 20,809 –29.8 10.3 Chicago .............................................. 54,634 45,698 89,437 –16.4 95.7 St. Louis ............................................ 19,312 10,542 36,709 –45.4 248.2 Minneapolis ....................................... 7,374 13,195 6,330 79.0 –52.0 Kansas City ....................................... 19,264 12,338 39,251 –36.0 218.1 Dallas ................................................. 18,579 17,188 56,271 –7.5 227.4 San Francisco .................................... 36,673 27,414 45,383 –25.2 65.5
Total, all Districts ........................... 338,291 273,331 430,489 –19.2 57.5
Federal Reserve Information Technology ................................ 33,511 54,021 60,870 61.2 12.7
Office of Employee Benefits ............. . . . 3,439 . . . . . . . . .
Total .................................................. 371,802 330,791 491,358 –11.0 48.5
2002 (budgeted)
2002 (estimated)
2003 (budgeted) 2002 estimated
compared with 2002 budgeted
2003 budgeted compared with 2002 estimated
District
Percent change
. . . Not applicable.
Table E.7
Capital Outlays of the Federal Resereve Banks, by Category, 2002 and 2003 Thousands of dollars except as noted
Building projects ............................... . . . 98,219 268,678 . . . 173.5 Security enhancements ...................... . . . 46,562 49,213 . . . 5.7 Information technology projects ....... . . . 63,510 55,003 . . . –13.4 Payment system projects ................... . . . 100,379 109,020 . . . 8.6 Miscellaneous2 .................................. . . . 22,121 9,444 . . . –57.3
Total .................................................. . . . 330,791 491,358 . . . 48.5
2002 (budgeted)1
2002 (estimated)
2003 (budgeted) 2002 estimated
compared with 2002 budgeted
2003 budgeted compared with 2002 estimated
Category
Percent change
NOTE. Includes outlays from FRIT and OEB. 2. Includes other equipment purchases. 1. Capital information by category was not collected
in the 2002 budget.

Maps of the
Federal Reserve System

46 Annual Report: Budget Review, 2003
The Federal Reserve System
LEGEND
Both pages Facing page
Federal Reserve Bank city • Federal Reserve Branch city
Board of Governors of the Federal — Branch boundary Reserve System, Washington, DC
NOTE
The Federal Reserve officially identifies Bank serves the Commonwealth of Puerto Districts by number and Reserve Bank Rico and the U.S. Virgin Islands; the San city (shown on both pages) and by letter Francisco Bank serves American Samoa, (shown on the facing page). Guam, and the Commonwealth of the
In the 12th District, the Seattle Branch Northern Mariana Islands. The maps serves Alaska and the San Francisco Bank show the boundaries within the System serves Hawaii. as of year-end 2002.
The System serves commonwealths and territories as follows: The New York

Maps of the Federal Reserve System 47

FRB1/1–800–0302–C