ar budgetrev 1987-88
TRANSCRIPT
Board of Governors of the Federal Reserve System
1987-88
Digitized for FRASER http://fraser.stlouisfed.org/ Federal Reserve Bank of St. Louis

Contents
1 INTRODUCTION
Part I The 1988 Budgets
Chapter 1 5 FEDERAL RESERVE SYSTEM 6 Net Expense 7 Trends in Expenses and Employment 7 Operational Areas 8 1988 Budget Initiatives
Chapter 2 11 BOARD OF GOVERNORS 11 An Overview of the Board's 1988 Budget 12 The Budget by Operational Area 15 Trends in Board Expenses and Positions
Chapter 3 21 FEDERAL RESERVE BANKS 21 An Overview of the 1988 Budget 24 Operational Areas 28 Objects of Expense 30 Capital Outlays 31 Trends in Expenses and Employment 32 Volumes and Unit Costs
Part II Special A nalysis
Chapter 4 35 REVIEW OF FISCAL AGENCY SERVICES 35 Historical Background 38 Fiscal Agency Services 42 Reimbursement for Fiscal Services
Digitized for FRASER http://fraser.stlouisfed.org/ Federal Reserve Bank of St. Louis

Appendixes
Appendix A 45 MISSION A N D OPERATIONAL AREAS
OF THE FEDERAL RESERVE SYSTEM 45 Monetary and Economic Policy 45 Supervision and Regulation 46 Services to Financial Institutions and the Public 48 Services to the U.S. Treasury and Other Government Agencies
Appendix B 49 BUDGET PROCESSES 49 The Budget and Control Process of the Board of Governors 50 The Budget and Control Process of the Federal Reserve Banks
Appendix C 53 SPECIAL CATEGORIES OF SYSTEM EXPENSE 53 Priced Services 56 Capital Outlays 57 Currency
Appendix D 59 SOURCES A N D USES OF FUNDS
Appendix E 61 FEDERAL RESERVE SYSTEM AUDITS
Appendix F 65 EXPENSES A N D EMPLOYMENT
A T THE FEDERAL RESERVE BANKS
75 M A P OF THE FEDERAL RESERVE SYSTEM
Digitized for FRASER http://fraser.stlouisfed.org/ Federal Reserve Bank of St. Louis
1
Introduction
This report describes the budgeted expenses of the Federal Reserve System for 1988 and compares them with expenses for 1986 and 1987. It also contains a special analysis of fiscal services provided to the U.S. Treasury and other government agencies.
The Federal Reserve System consists of the Board of Governors in Washing-ton, D.C., the 12 Federal Reserve Banks with their 25 Branches, the Federal Open Market Committee, and three advisory groups—the Federal Advisory Council, the Consumer Ad-visory Council, and the Thrift Institu-tions Advisory Council.
The System was created by the Fed-eral Reserve Act, passed by the Con-gress in 1913 to establish a safer and more flexible monetary and banking system. After the inception of the Federal Reserve System, it became clear that these original purposes were part of broader national economic and financial objectives. Stability and growth of the economy, stability in the purchasing power of the dollar, and reasonable balance in transactions with foreign countries have come to be recognized as primary objectives of governmental economic policy. Over the years, such objectives have been articulated by the Congress in legisla-tion giving the Federal Reserve more authority and responsibility.
As the nation's central bank, the Federal Reserve, through its ability to influence financial conditions, at-tempts to ensure growth of the econ-omy consistent with price stability. As the nation's lender of last resort, the Federal Reserve also is responsible for averting national liquidity crises.
Because a sound financial structure is essential to an effective monetary policy and a growing and prosperous economy, the Congress has entrusted the Federal Reserve with a variety of bank supervisory and regulatory func-tions. Among other things, the Federal Reserve administers the laws that reg-ulate all bank holding companies; it supervises state-chartered banks that are members of the Federal Reserve System; it regulates the foreign activi-ties of U.S. banks and the U.S. activi-ties of foreign banks; and it establishes rules to ensure that consumers are informed adequately and treated fairly in credit transactions.
The Federal Reserve System also plays a major role in the nation's payments mechanism. Federal Reserve Banks distribute currency and coin, process 35 percent of all domestic checks, and provide both wire and automated clearinghouse transfers of funds and securities amounting to about $625 billion daily. In addition, the Federal Reserve System serves as the fiscal agent for the U.S. Treasury and provides a variety of financial services for the Treasury and other government agencies.
To carry out these responsibilities, the Federal Reserve System spent an estimated $1,281 million in 1987 and has budgeted expenses for 1988 of $1,336 million. These are the gross expenses for the Board of Governors and the Federal Reserve Banks and their Branches. Offsetting them in 1987 were an estimated $645 million in revenue from priced services, $106 million in claims for reimbursement, and $10 million in other income, all of
Digitized for FRASER http://fraser.stlouisfed.org/ Federal Reserve Bank of St. Louis
2 Introduction
which brought 1987 net operating expenses to $519 million. Net spending for 1988 is expected to total $555 million.
The major source of Federal Reserve income, estimated at $16.4 billion in 1987, is earnings on the portfolio of U.S. government securities in the Sys-tem Open Market Account. The Sys-tem uses purchases and sales from this portfolio to implement monetary pol-icy. Gains on foreign exchange trans-actions approximated $1.8 billion.
Each year the Federal Reserve re-turns to the U.S. Treasury its earnings in excess of expenses, dividends, and surplus—in 1987, an estimated $17.7 billion. These earnings are treated as receipts in the U.S. budget accounting system; projections of these earnings by the Office of Management and
Budget appear in the U.S. budget. Part I of this report discusses Federal
Reserve budgeted expenses for 1988 for the System as a whole and for the Board of Governors and the Reserve Banks taken separately. Part I I con-tains a chapter on services the System provides to the U.S. Treasury and other government agencies. Appen-dixes give additional information on System operations, budget processes, special categories of System expense, sources and uses of funds, Federal Reserve System audits, and Bank ex-penses and employment.
This report, a complete discussion of the System's budget, is a companion to the Board's 74th Annual Report 1987. That document covers all activi-ties and initiatives of the Federal Re-serve System during the year.
Digitized for FRASER http://fraser.stlouisfed.org/ Federal Reserve Bank of St. Louis

Parti The 1988 Budgets
Digitized for FRASER http://fraser.stlouisfed.org/ Federal Reserve Bank of St. Louis

5
Chapter 1
Federal Reserve System
For 1988, the Federal Reserve System has budgeted operating expenses of $1,336 million, an increase of 4.3 percent over estimated 1987 expenses. System operating expenses comprise the budget for the Reserve Banks, $1,245 million, and for the Board of Governors, $91 million (table 1.1). The budget for the cost of currency is an additional $162 million for 1988, a decrease of 5.0 percent from the esti-mated 1987 cost.1 When the cost of currency is added to operating ex-penses, the Reserve Banks account for 83.1 percent of the total; the Board, 6.0 percent; and currency, 10.8 percent (chart 1.1). Chapter 2 discusses the
1. Public demand for new currency and the cost of printing at the Bureau of Engraving and Printing largely determine currency costs of the Federal Reserve; thus, they are not included in the analyses of System operating expenses. For a further discussion of currency costs, see chap. 2 and appendix C .
Table 1.1 Operating Expenses of the Federal Reserve System and Cost of Currency, 1986-881
Mill ions of dollars, except as noted
Entity and 1986 1987 1988 Percent change type of expense actual estimate budget 1986-87 1987-88
Reserve Banks2 1,161.3 1,194.3 1,245.1 2.8 4.3 Personnel 729.5 741.7 775.8 1.7 4.6 Nonpersonnel 431.8 452.5 469.3 4.8 3.7
Board of Governors3 84.0 86.5 90.6 3.0 4.7 Personnel 59.4 60.2 63.4 1.3 5.4 Nonpersonnel 24.6 26.4 27.3 7.1 3.5
System operating expenses 1,245.3 1,280.8 1,335.7 2.9 4.3 Personnel 788.9 801.9 839.2 1.6 4.7 Nonpersonnel 456.4 478.9 496.6 4.9 3.7
Currency4 181.2 170.7 162.2 - 5 . 8 - 5 . 0
1. In this and subsequent tables in this volume, 3. For detailed information see chap. 2. details may not add to totals because of rounding. 4. See text note 1 and appendix C.
2. For detailed information see chap. 3.
budget for the Board; chapter 3 covers the Reserve Banks. The operational areas of the System are listed later in this chapter and described in more detail in appendix A; appendix B describes the System's budget process.
Chart 1.1 Distribution of Operating Expenses of the Federal Reserve System and Cost of Currency, 19881
1. See text note 1.
Digitized for FRASER http://fraser.stlouisfed.org/ Federal Reserve Bank of St. Louis
6 Federal Reserve System Audits
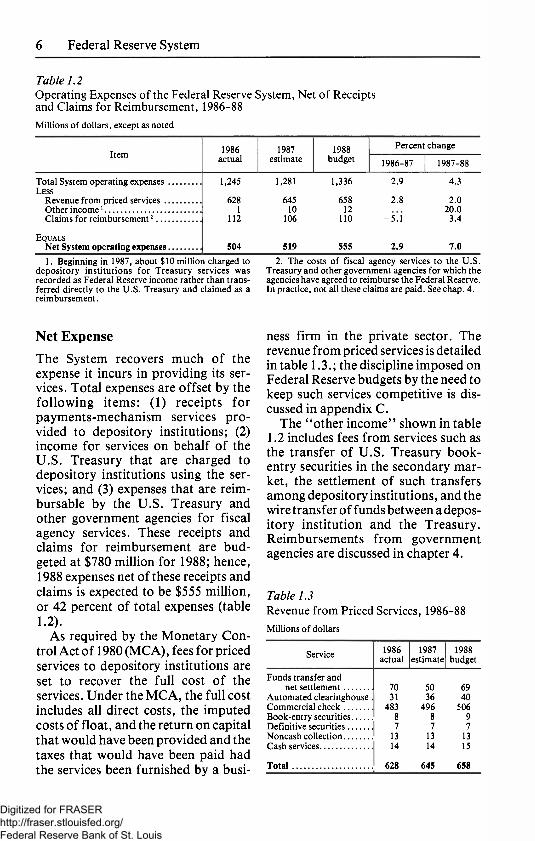
Table 1.2 Operating Expenses of the Federal Reserve System, Net of Receipts and Claims for Reimbursement, 1986-88
Mi l l i ons o f dol lars, except as noted
I tem
To ta l System operat ing expenses LESS
Revenue f r o m priced services . Other income 1
Claims fo r re imbursemen t 2 . . .
1986 actual
1,245
628 1
112
1987 estimate
1,281
645 10
106
1988 budget
1,336
658 12
110
Percent change
1986-87
2.9
2.8
- 5 T
1987-8
4.3
2.0 20.0
3.4
504 519 555 2.9 7.0 EQUALS
Net System operating expenses
1. Beginning in 1987, about $10 m i l l i on charged to depos i tory ins t i tu t ions fo r Treasury services was recorded as Federal Reserve income rather than trans-ferred direct ly to the U.S. Treasury and claimed as a reimbursement.
2. The costs o f f iscal agency services to the U.S. Treasury and other government agencies for which the agencies have agreed to reimburse the Federal Reserve. I n practice, not al l these claims are paid. See chap. 4.
Net Expense
The System recovers much of the expense it incurs in providing its ser-vices. Total expenses are offset by the fol lowing items: (1) receipts for payments-mechanism services pro-vided to depository institutions; (2) income for services on behalf of the U.S. Treasury that are charged to depository institutions using the ser-vices; and (3) expenses that are reim-bursable by the U.S. Treasury and other government agencies for fiscal agency services. These receipts and claims for reimbursement are bud-geted at $780 million for 1988; hence, 1988 expenses net of these receipts and claims is expected to be $555 million, or 42 percent of total expenses (table 1.2).
As required by the Monetary Con-trol Act of 1980 (MCA), fees for priced services to depository institutions are set to recover the full cost of the services. Under the MCA, the ful l cost includes all direct costs, the imputed costs of float, and the return on capital that would have been provided and the taxes that would have been paid had the services been furnished by a busi-
ness f irm in the private sector. The revenue from priced services is detailed in table 1.3.; the discipline imposed on Federal Reserve budgets by the need to keep such services competitive is dis-cussed in appendix C.
The "other income" shown in table 1.2 includes fees from services such as the transfer of U.S. Treasury book-entry securities in the secondary mar-ket, the settlement of such transfers among depository institutions, and the wire transfer of funds between a depos-itory institution and the Treasury. Reimbursements from government agencies are discussed in chapter 4.
Table 1.3 Revenue from Priced Services, 1986-88 Mi l l i ons o f dollars
Service 1986 actual
1987 estimate
1988 budget
Funds transfer and net settlement 70 50 69
Au tomated clearinghouse 31 36 40 Commerc ia l check 483 496 506 Book-entry securities 8 8 9 Def in i t ive securities 7 7 7 Noncash col lect ion 13 13 13 Cash services 14 14 15
Total 628 645 658
Digitized for FRASER http://fraser.stlouisfed.org/ Federal Reserve Bank of St. Louis
7 Federal Reserve System Audits
Al l sources and uses of funds are presented in appendix D; the audits of the System are discussed in appen-dix E.
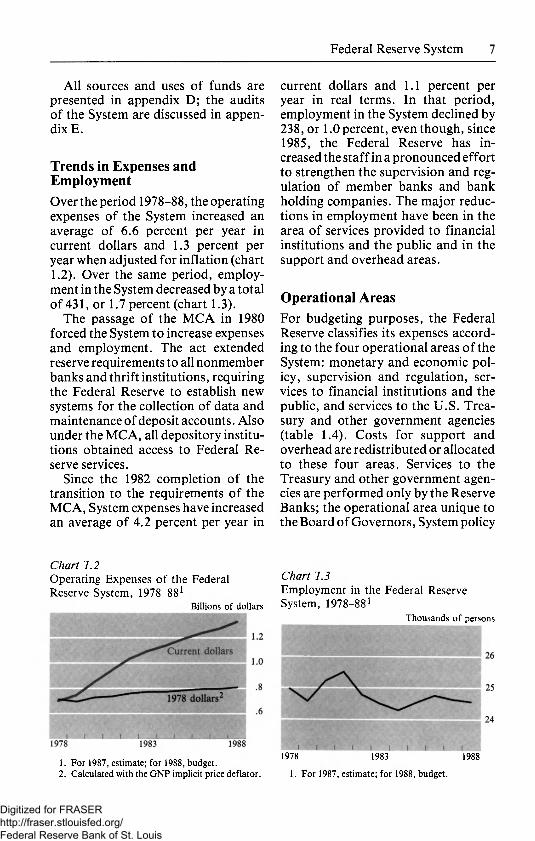
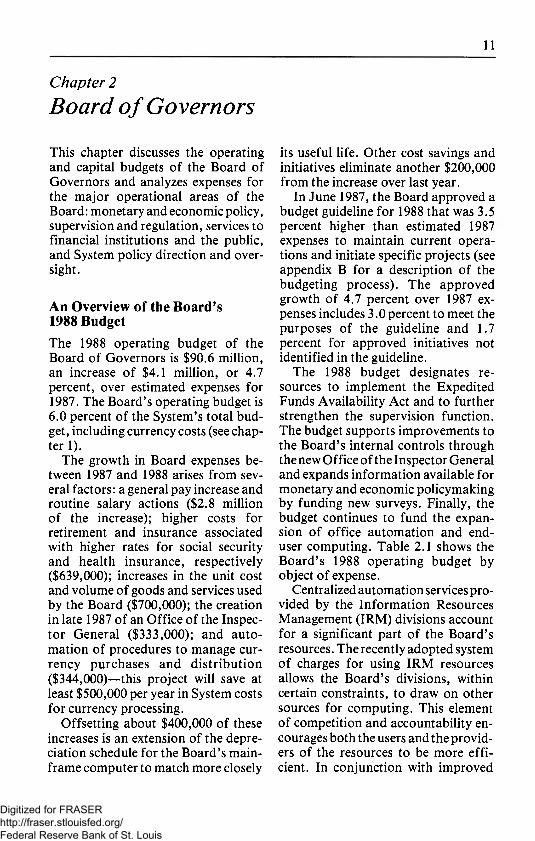
Trends in Expenses and Employment Over the period 1978-88, the operating expenses of the System increased an average of 6.6 percent per year in current dollars and 1.3 percent per year when adjusted for inflation (chart 1.2). Over the same period, employ-ment in the System decreased by a total of 431, or 1.7 percent (chart 1.3).
The passage of the MCA in 1980 forced the System to increase expenses and employment. The act extended reserve requirements to all nonmember banks and thrift institutions, requiring the Federal Reserve to establish new systems for the collection of data and maintenance of deposit accounts. Also under the MCA, all depository institu-tions obtained access to Federal Re-serve services.
Since the 1982 completion of the transition to the requirements of the MCA, System expenses have increased an average of 4.2 percent per year in
current dollars and 1.1 percent per year in real terms. In that period, employment in the System declined by 238, or 1.0 percent, even though, since 1985, the Federal Reserve has in-creased the staff in a pronounced effort to strengthen the supervision and reg-ulation of member banks and bank holding companies. The major reduc-tions in employment have been in the area of services provided to financial institutions and the public and in the support and overhead areas.
Operational Areas For budgeting purposes, the Federal Reserve classifies its expenses accord-ing to the four operational areas of the System: monetary and economic pol-icy, supervision and regulation, ser-vices to financial institutions and the public, and services to the U.S. Trea-sury and other government agencies (table 1.4). Costs for support and overhead are redistributed or allocated to these four areas. Services to the Treasury and other government agen-cies are performed only by the Reserve Banks; the operational area unique to the Board of Governors, System policy
Chart 1.2 Operating Expenses of the Federal Reserve System, 1978-881
Billions of dollars
Chart 1.3 Employment in the Federal Reserve System, 1978-881
Thousands of persons
1978 1983 1988
1. For 1987, estimate; for 1988, budget. 1. For 1987, estimate; for 1988, budget. 2. Calculated wi th the GNP implicit price deflator.
Digitized for FRASER http://fraser.stlouisfed.org/ Federal Reserve Bank of St. Louis

8 Federal Reserve System Audits
Table 1.4 Operating Expenses of the Federal Reserve System, by Operational Area, 1986-S Mil l ions of dollars, except as noted
Operational area and entity
1986 actual
1987 estimate
1988 budget
Percent change Operational area and entity
1986 actual
1987 estimate
1988 budget 1986-87 1987-88
Monetary and economic policy 144.8 146.4 152.0 1.1 3.8 Reserve Banks 90.6 88.4 91.7 2.3 3.7 Board of Governors 54.3 57.9 60.2 6.8 3.9
Supervision and regulation 190.8 196.2 210.9 2.8 7.5 Reserve Banks 163.9 170.1 183.4 3.8 7.8 Board of Governors 26.9 26.1 27.5 2.7 5.0
Services to financial institutions and the public 772.9 802.3 830.4 3.8 3.5
Reserve Banks 770.0 799.9 827.5 3.9 3.4 Board of governors 2.9 2.4 2.9 - 14.4 20.3
Services to the U.S. Treasury and other government agencies2 136.8 135.9 142.5 - 0 . 7 4.9
Total 1,245.3 1,280.8 1,335.7 2.9 4.3 Reserve Banks 1,161.3 1,194.3 1.245.1 2.8 4.3 Board of Governors 84.0 86.5 90.6 3.0 4.7
1. Operating expenses reflect all allocations for support and overhead and exclude capital outlays. The operational area unique to the Board of Governors, system policy direction and oversight, which is shown separately in chap. 2, has been allocated across the
operational areas shown above. As a result, the numbers in chap. 2 for the operational areas are not the same as the ones listed in this table.
2. Reserve Banks only. The Board of Governors does not operate in this area.
direction and oversight, is an overhead expense of the System.
1988 Budget Initiatives Two major initiatives are planned for 1988. Implementation of the Expe-dited Funds Availability Act (title V I of Public Law 100-86, the Competitive Equality Banking Act of 1987) is ex-pected to cost $15 mill ion; and a research and development project to explore digitized image processing of checks is budgeted at $6 million.
The Expedited Funds Availability Act of 1987, which becomes effective on September 1, 1988, requires the Federal Reserve to devise and issue regulations to ensure prompt availabil-ity of funds and to expedite the return of checks. The law was enacted too late in the budget process for the Federal Reserve Banks to include related ex-penses on the effort in their 1988 budgets.
The Board decided to develop digi-tized image processing of checks after work over the past two years demon-strated the likelihood that this technol-ogy will improve the payments mecha-nism. Because the project is relatively costly, but not lengthy, the Board established a separate budget for it that is not included in the base of operating expenses.
The Federal Reserve continues to emphasize the area of supervision and regulation. Under deregulation, bank holding companies have developed new services and product lines, which in turn require more applications and more examinations of banks and hold-ing companies.
Also affecting the 1988 budget are projects on behalf of the U.S. Trea-sury. In 1988, the System will recognize the full-year effect of operating Trea-sury Direct, a system begun in 1987 to handle in book-entry (electronic) form all Treasury securities bought and sold
Digitized for FRASER http://fraser.stlouisfed.org/ Federal Reserve Bank of St. Louis

9 Federal Reserve System Audits
by individuals. Other initiatives under-taken for the Treasury include devel-opment of the Public Debt Accounting and Reporting System (PARS), the centralization of bond inscription by issuing agents, and the high-speed processing of redeemed bonds. These projects add costs in 1988; but they are also expected to cut expenses for the Federal Reserve and the U.S. govern-ment in the future.
Automation also affects the System-wide 1988 budget. The Board and several Reserve Banks are expanding office automation systems, and some locations are establishing additional capabilities for contingency processing
for critical operations, such as funds and securities transfers.
Finally, like the 1987 budget, the 1988 budget gave no consideration to the effects on expenses of the imple-mentation of Financial Accounting Standards Board statement number 87, Employers' Accounting for Pen-sions. The System implemented this standard in 1987; in accordance with its terms, the System recognized a credit to overall 1987 expenses and will likely record a credit to expenses in 1988. This credit, however, is not reflected as a reduction in the 1987 estimated expenses or 1988 budgeted expenses for the System.
Digitized for FRASER http://fraser.stlouisfed.org/ Federal Reserve Bank of St. Louis
11
Chapter 2
Board of Governors
This chapter discusses the operating and capital budgets of the Board of Governors and analyzes expenses for the major operational areas of the Board: monetary and economic policy, supervision and regulation, services to financial institutions and the public, and System policy direction and over-sight.
An Overview of the Board's 1988 Budget The 1988 operating budget of the Board of Governors is $90.6 million, an increase of $4.1 million, or 4.7 percent, over estimated expenses for 1987. The Board's operating budget is 6.0 percent of the System's total bud-get, including currency costs (see chap-ter 1).
The growth in Board expenses be-tween 1987 and 1988 arises from sev-eral factors: a general pay increase and routine salary actions ($2.8 million of the increase); higher costs for retirement and insurance associated with higher rates for social security and health insurance, respectively ($639,000); increases in the unit cost and volume of goods and services used by the Board ($700,000); the creation in late 1987 of an Office of the Inspec-tor General ($333,000); and auto-mation of procedures to manage cur-rency purchases and distribution ($344,000)—this project will save at least $500,000 per year in System costs for currency processing.
Offsetting about $400,000 of these increases is an extension of the depre-ciation schedule for the Board's main-frame computer to match more closely
its useful life. Other cost savings and initiatives eliminate another $200,000 from the increase over last year.
In June 1987, the Board approved a budget guideline for 1988 that was 3.5 percent higher than estimated 1987 expenses to maintain current opera-tions and initiate specific projects (see appendix B for a description of the budgeting process). The approved growth of 4.7 percent over 1987 ex-penses includes 3.0 percent to meet the purposes of the guideline and 1.7 percent for approved initiatives not identified in the guideline.
The 1988 budget designates re-sources to implement the Expedited Funds Availability Act and to further strengthen the supervision function. The budget supports improvements to the Board's internal controls through the new Office of the Inspector General and expands information available for monetary and economic policymaking by funding new surveys. Finally, the budget continues to fund the expan-sion of office automation and end-user computing. Table 2.1 shows the Board's 1988 operating budget by object of expense.
Centralized automation services pro-vided by the Information Resources Management (IRM) divisions account for a significant part of the Board's resources. The recently adopted system of charges for using IRM resources allows the Board's divisions, within certain constraints, to draw on other sources for computing. This element of competition and accountability en-courages both the users and the provid-ers of the resources to be more effi-cient. In conjunction with improved
Digitized for FRASER http://fraser.stlouisfed.org/ Federal Reserve Bank of St. Louis

12 Board of Governors
Table 2.1 Operating Expenses of the Board of Governors, by Object, 1986-88
Thousands of dollars, except as noted
Object 1986 actual
1987 estimate
1988 budget
Percent change Object 1986
actual 1987
estimate 1988
budget 1986-87 1987-88
Personnel Salaries 53,907 53,936 56,977 0.1 5.6 Retirement1 2,670 2,935 3,242 9.9 10.5 Insurance2 2,793 3,287 3,642 17.7 10.8
Total 59,370 60,159 63,863 1.3 6.2
Nonpersonnel Travel 2,541 2,825 3,005 11.2 6.4 Postage 1,011 812 925 -19 .7 13.9 Telephone and telegraph 1,481 1,387 1,494 - 6 . 4 7.8 Printing and binding 919 967 954 5.2 - 1 . 3 Publications committee 10 42 26 327.4 - 3 7 . 1 Stationery and supplies 1,162 1,009 910 - 1 3 . 2 - 9 . 8 Software and supplies 2,090 2,601 2,585 24.5 - 0 . 6 Cafeteria 500 525 569 5.0 8.4 Furniture and equipment 804 802 605 - 0 . 4 -24 .5 Rentals 2,358 1,474 774 -37 .5 -47 .5 Books and subscriptions 438 445 525 1.6 18.1 Utilities 1,490 1,580 1,638 6.1 3.7 Repairs and alterations 892 1,094 1,082 22.7 - 1.1 Maintenance 1,208 1,872 2,432 54.9 29.9 Contractual professional services 2,162 2,314 2,900 - 8 . 8 25.3 Interest 44 10 * - 7 7 . 2 - 9 6 . 0 Education and membership fees 591 746 744 26.1 - 0 . 2 Subsidies and contributions 703 655 668 - 6 . 8 2.0 Depreciation 5,793 7,540 7,704 30.2 2.2 Other 313 427 542 36.5 26.9 Contingency income - 1,544 -1 ,686 -1 ,853 9.2 9.9 Cafeteria sales - 7 0 1 - 7 4 0 - 7 6 3 5.6 3.1 Loss (gain) f rom disposition of assets 358 0 0
Total 24,626 26,699 27,468 6.8 2.9
Savings target - 7 0 0 Adjustment to estimated expenses - 3 2 8
Total 83,996 86,531 90,631 3.0 4.7
1. Increases largely attributable to higher rates for 2. Increases attributable to higher rates for health social security. insurance.
•Less than $500.
productivity and quality in the IRM divisions, these efficiencies have re-duced the percentage of the Board's budget devoted to centrally provided IRM resources in 1988.
The Budget by Operational Area
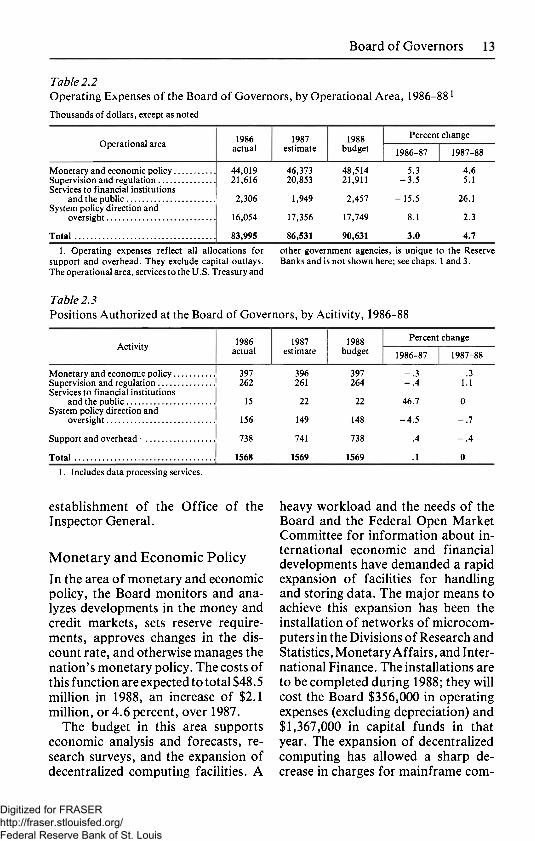
Tables 2.2 and 2.3 show respectively the operating expenses and the number of authorized positions in each of the Board's four operational areas for the years 1986-88. The expenses exclude capital outlays and include an alloca-tion for support and overhead. Spend-
ing within operational areas responded primarily to Boardwide factors, such as the general pay increase, and to elements unique to each area: in mon-etary and economic policy, higher costs for automation and an expanded program of surveys; in supervision and regulation, additional staffing and automation initiatives; in services to financial institutions and the public, the effort to implement the Expedited Funds Availability Act and to auto-mate management of currency pur-chases and transportation; and in Sys-tem policy direction and oversight, the
Digitized for FRASER http://fraser.stlouisfed.org/ Federal Reserve Bank of St. Louis
13 Board of Governors
Table 2.2 Operating Expenses of the Board of Governors, by Operational Area, 1986-881
Thousands of dollars, except as noted
Operational area 1986 actual
1987 estimate
1988 budget
Percent
1986-87
change
1987-88
Monetary and economic policy Supervision and regulation Services to financial institutions
and the public System policy direction and
oversight
Total
44,019 46,373 48,514 5.3 4.6 21,616 20,853 21,911 -3 .5 5.1
2,306 1,949 2,457 - 15.5 26.1
16,054 17,356 17,749 8.1 2.3
83,995 86,531 90,631 3.0 4.7 1. Operating expenses reflect all allocations for other government agencies, is unique to the Reserve
support and overhead. They exclude capital outlays. Banks and is not shown here; see chaps. 1 and 3. The operational area, services to the U.S. Treasury and
Table 2.3 Positions Authorized at the Board of Governors, by Acit ivity, 1986-88
Activity 1986 actual
1987 estimate
1988 budget
Percent change Activity 1986
actual 1987
estimate 1988
budget 1986-87 1987-88
Monetary and economic policy 397 396 397 - . 3 .3 Supervision and regulation 262 261 264 - . 4 1.1 Services to financial institutions
and the public 15 22 22 46.7 0 System policy direction and
oversight 156 149 148 - 4 . 5 - . 7
Support and overhead1 738 741 738 .4 - . 4
Total 1568 1569 1569 .1 0
1. Includes data processing services.
establishment of the Office of the Inspector General.
Monetary and Economic Policy
In the area of monetary and economic policy, the Board monitors and ana-lyzes developments in the money and credit markets, sets reserve require-ments, approves changes in the dis-count rate, and otherwise manages the nation's monetary policy. The costs of this function are expected to total $48.5 million in 1988, an increase of $2.1 million, or 4.6 percent, over 1987.
The budget in this area supports economic analysis and forecasts, re-search surveys, and the expansion of decentralized computing facilities. A
heavy workload and the needs of the Board and the Federal Open Market Committee for information about in-ternational economic and financial developments have demanded a rapid expansion of facilities for handling and storing data. The major means to achieve this expansion has been the installation of networks of microcom-puters in the Divisions of Research and Statistics, Monetary Affairs, and Inter-national Finance. The installations are to be completed during 1988; they will cost the Board $356,000 in operating expenses (excluding depreciation) and $1,367,000 in capital funds in that year. The expansion of decentralized computing has allowed a sharp de-crease in charges for mainframe com-
Digitized for FRASER http://fraser.stlouisfed.org/ Federal Reserve Bank of St. Louis
14 Board of Governors
puting that, in turn, has checked the rise in spending in this area.
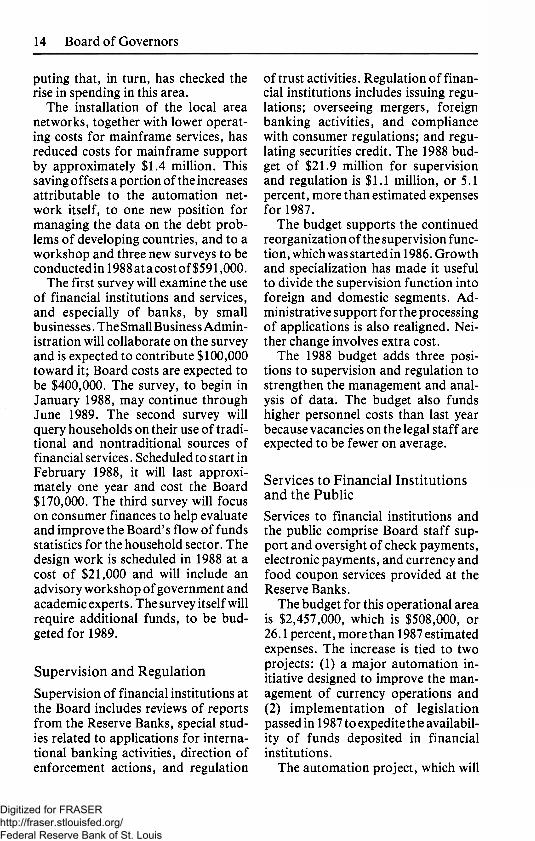
The installation of the local area networks, together with lower operat-ing costs for mainframe services, has reduced costs for mainframe support by approximately $1.4 million. This saving offsets a portion of the increases attributable to the automation net-work itself, to one new position for managing the data on the debt prob-lems of developing countries, and to a workshop and three new surveys to be conducted in 1988 at a cost of $591,000.
The first survey will examine the use of financial institutions and services, and especially of banks, by small businesses. The Small Business Admin-istration will collaborate on the survey and is expected to contribute $100,000 toward it; Board costs are expected to be $400,000. The survey, to begin in January 1988, may continue through June 1989. The second survey will query households on their use of tradi-tional and nontraditional sources of financial services. Scheduled to start in February 1988, it will last approxi-mately one year and cost the Board $170,000. The third survey will focus on consumer finances to help evaluate and improve the Board's flow of funds statistics for the household sector. The design work is scheduled in 1988 at a cost of $21,000 and will include an advisory workshop of government and academic experts. The survey itself will require additional funds, to be bud-geted for 1989.
Supervision and Regulation Supervision of financial institutions at the Board includes reviews of reports from the Reserve Banks, special stud-ies related to applications for interna-tional banking activities, direction of enforcement actions, and regulation
of trust activities. Regulation of finan-cial institutions includes issuing regu-lations; overseeing mergers, foreign banking activities, and compliance with consumer regulations; and regu-lating securities credit. The 1988 bud-get of $21.9 million for supervision and regulation is $1.1 million, or 5.1 percent, more than estimated expenses for 1987.
The budget supports the continued reorganization of the supervision func-tion, which was started in 1986. Growth and specialization has made it useful to divide the supervision function into foreign and domestic segments. Ad-ministrative support for the processing of applications is also realigned. Nei-ther change involves extra cost.
The 1988 budget adds three posi-tions to supervision and regulation to strengthen the management and anal-ysis of data. The budget also funds higher personnel costs than last year because vacancies on the legal staff are expected to be fewer on average.
Services to Financial Institutions and the Public Services to financial institutions and the public comprise Board staff sup-port and oversight of check payments, electronic payments, and currency and food coupon services provided at the Reserve Banks.
The budget for this operational area is $2,457,000, which is $508,000, or 26.1 percent, more than 1987 estimated expenses. The increase is tied to two projects: (1) a major automation in-itiative designed to improve the man-agement of currency operations and (2) implementation of legislation passed in 1987 to expedite the availabil-ity of funds deposited in financial institutions.
The automation project, which will
Digitized for FRASER http://fraser.stlouisfed.org/ Federal Reserve Bank of St. Louis

15 Board of Governors
have a direct cost of $344,000, will allow estimated annual savings of at least $500,000 in the System's currency budget by reducing the number of shipments and the volume of currency ordered.
The Expedited Funds Availability Act, passed by the Congress in August 1987, requires the Board to publish rules that improve the responsiveness of the check clearing system and shorten the time required to make funds available to the depositor. Two positions were added in this opera-tional area in late 1987 to meet the deadlines in the legislation. The full-year costs of these positions and related support account for a portion of the incremental expenses in this opera-tional area. The 1988 budget adds no positions to the year-end 1987 number.
System Policy Direction and Oversight System policy direction and oversight covers the supervision of System and Board programs. The budget for this operational area, $17,749,000, is $393,000, or 2.3 percent, more than estimated 1987 expenses. The increase
Chart 2.1 Annual Rate of Change in Operating Expenses of the Board of Governors, 1978-881
Percent
1978 1983 1988
1. For 1987, estimate; for 1988, budget
arises from two factors. First, the establishment of the Office of the Inspector General in late 1987 added $333,000 to expenses. Second, the number and length of position vacan-cies was high in 1987; the 1988 budget assumes that filling vacancies will take less time. These increases are largely offset by a decrease in the development costs of a major automation project that provides support for administra-tive tasks at the Board such as person-nel and payroll.
Trends in Board Expenses and Positions Expenses budgeted for 1988 are 4.7 percent greater than expenses esti-mated for 1987. As chart 2.1 shows, this rate of increase is higher than those for 1986 and 1987 but lower than that for seven of the last ten years. In that period, the highest rate of increase was for 1980, when inflation, coupled with the passage of the Monetary Control Act, worked to increase the Board's operating expenses by 12.4 percent. The low (3.3 percent) increase in 1981 was attributable to the Board's program to cut spending and reduce the number of positions as well as to a dramatic reduction in payments to the Board retirement system to fund the cost-of-living adjustments (COLAs) for retirees. In 1982, without that reduction, the rate of growth began to rise again at a relatively stable pace until 1985. A decrease in the rate of growth for personnel expenses in 1986 and 1987 resulted from another pro-gram of position reductions.
Chart 2.2 compares the Board's operating expenses in current and constant dollars over the same 10-year period. In current dollars, Board ex-penses increased an annual average of 6.4 percent between 1978 and 1988; in
Digitized for FRASER http://fraser.stlouisfed.org/ Federal Reserve Bank of St. Louis

16 Board of Governors
Chart 2.2 Operating Expenses of the Board of Governors, 1978-881
Millions of dollars
80
60
1. For 1987, estimate; for 1988 budget. 2. Calculated with the GNP implicit price deflator.
constant dollars, or real terms, ex-penses rose only 0.9 percent per year on average, despite major additions to the Board's responsibilities mandated by the Congress over the period. Fu-ture additions to the Board's mission or responsibilities may dictate corre-sponding budget increases.
In the early years of the period, real expenses declined as salaries, a large element in the Board's expenses, rose less than prices. Real expenses began to rise again in 1982, when expenses to fund COLAs for retirees rose signifi-cantly and when the staff grew to meet the phased-in requirements of legisla-tion passed in 1979 and 1980. The rate
of increase ranged from 2.5 percent to 3.5 percent from 1982 through 1985 as the costs of centralized automation, primarily for programming staff, rose to meet the requirements of the legislation.
To stem the growth in expenses, the Board in 1984 established the Program Improvement Project (PIP) to raise productivity, delete lower-priority work, and reduce costs. PIP reduced the number of positions at the Board by 8.5 percent. Although in real terms the 1988 budget is slightly higher than the estimated expenses for 1987, it is lower than the expenses for 1986.
Five-Year Trend Spending in current dollars will rise in 1988 at about the same rate as it did on average in the 1983-88 period (table 2.4). Many factors raised the costs of all four operational areas over the last five years: general pay increases; the addition of medicare payments for federal employees and significant in-creases in rates for health insurance; changes in federal retirement programs and increased social security rates. These cost increases were partially offset by the savings stemming from PIP. This section will focus on other
1978 1983 1988
Table 2.4 Operating Expenses of the Board of Governors, by Operational Area, 1983-88 Thousands of dollars, except as noted
Operational area 1983 1984 1985 1986 1987 estimate
1988 budget
Percent change
1983-88' 1987-88
Monetary and economic policy Supervision and regulation Services to financial institutions
and the public System policy direction and
oversight
Total
38,574 41,916 45,136 44,019 46,373 48,514 4.7 4.6 18,721 18,034 19,259 21,616 20,853 21,911 3.2 5.1
1,948 2,493 2,589 2,306 1,949 2,457 4.8 26.1
12,382 14,032 15,051 16,054 17,356 17,749 7.5 2.3
71,625 76,475 82,035 83,995 86,531 90,631 4.8 4.7 1. Annual average.
Digitized for FRASER http://fraser.stlouisfed.org/ Federal Reserve Bank of St. Louis

17 Board of Governors
factors, those that were unique to each operational area.
Monetary and Economic Policy Expenses for the monetary and eco-nomic policy operational area are rising in 1988 at about the same rate as that for Board expenses as a whole; the 1988 rate for this area is also about the same as the 1983-88 average for the area and for the Board.
From 1983 through 1985, expenses in this area rose 8.2 percent per year on average, responding to the tremendous increase in the volume of data associ-ated with the Monetary Control Act. The drop to a 1.4 percent annual rate of growth from 1985 through 1987 reflects PIP-related declines in ex-penses for staffing.
The number of positions in this operational area has fallen sharply over the five years. No functions have been eliminated; rather, staff produc-tivity has increased through automa-tion and reorganizations that stream-lined operations. The primary effect of the reduction in staff has been a reduction of long-term research.
Supervision and Regulation The budgeted increment in expense for supervision and regulation for 1988, 5.1 percent, exceeds the five-year trend for this area and for the Board as a whole. The increase reflects the strengthening of the supervision effort at the Board in recent years and the addition of three positions in the 1988 budget.
Over the years from 1983 to 1987, expenses first increased to support the Neighborhood Reinvestment Corpora-tion and to fund an increase in the volume of data processing supporting application processing, examinations, and surveillance. Expenses then fell in 1984 as parts of these projects were
completed and as activity in the con-sumer regulation area declined.
Over the two years 1985 through 1987, expenses rose 8.3 percent to fund the major automation initiative in 1985 and the new positions autho-rized in 1986 to enhance the super-vision function. The automation initia-tive was essential to handle the growing volume of applications processed dur-ing the period. It also allowed more timely analyses of troubled financial institutions.
Services to Financial Institutions and the Public Expenses for services to financial insti-tutions and the public in 1987 were almost identical to those in 1983. However, expenses will rise 26.1 per-cent in 1988, largely to develop an automated program to improve the management of currency distribution and thereby to reduce costs to the System. Incremental costs of the Expe-dited Funds Availability Act of 1987 also affect expenses for 1987 and 1988 in this area.
A project to limit risk from daylight overdrafts in the electronic payments mechanism raised expenses in 1984 and 1985. The drop in 1986 reflected the elimination of the service pricing pro-gram and the completion of part of the daylight overdraft project. Expenses fell further in 1987 as the remaining portions of the daylight overdraft project were transferred to the mone-tary and economic policy operational area.
System Policy Direction and Oversight The 1988 rate of increase in spending for System policy direction and over-sight is considerably below the five-year average annual pace for this area and for all Board activities.
Digitized for FRASER http://fraser.stlouisfed.org/ Federal Reserve Bank of St. Louis

18 Board of Governors
The relatively high rate of growth in expenses for this area during those five years was tied to development costs for improving office automation and ad-ministrative data management as well as for procedures and resources to enhance oversight of key Reserve Bank operations. These costs have now started to decline. In the meantime, the investment in this area has begun to bear fruit in the improvement of effi-ciency within the other operational areas.
10-Year Trend
This section covers expenses for both personnel and nonpersonnel services during the 1978-88 period.
Personnel Services From 1978 to 1988, expenses for per-sonnel services grew at 5.4 percent per year on average in current dollars and fell slightly in constant dollars (chart 2.3). Until 1984, much of the growth in this area related to increases in the number of staff members, general pay increases (GPIs) for Board staff, and COLAs for retirees. The rate of in-crease leveled of f in 1985, when the
Chart 2.3 Expenses for Personnel Services at the Board of Governors, 1978-881
Millions of dollars
1. For 1987, estimate; for 1988, budget. 2. Calculated with the GNP implicit price deflator.
GPI was only 4.0 percent, and then declined in 1986 as a result of the decrease in the number of positions.
Employment and Positions On balance, from 1978 to 1988, the number of budgeted positions declined slightly, as chart 2.4 shows. A 1979 program to reduce positions elimi-nated 36 in that year. In the following year, 67 positions were added, most of them to handle the workload generated by the Monetary Control Act. Thirty-two positions were eliminated in 1981, but increases in the workload forced the addition of 110 more from 1981 through 1984, mostly in data process-ing (50 positions), in the new Contin-gency Processing Center (17), in the oversight portion of the System policy direction and oversight operational area (15), and in the supervision and regulation operational area (6).
PIP was responsible for abolishing 143 positions during 1985 and 1986. During 1986, 22 other positions were abolished in data processing as a result of improvements in productivity and the tightening of accountability for these resources. But, to meet new responsibilities and general increases
Chart 2.4 Employment and Positions at the Board of Governors, 1978-881
Number, in thousands
i i I i I t i i I f 1978 1983 1988
1. Year-end data. For 1987, estimate; for 1988, budget.
I ! i I I I I I I | 1978 1983 1988
Digitized for FRASER http://fraser.stlouisfed.org/ Federal Reserve Bank of St. Louis
19 Board of Governors
in workload, 20 positions were added in the supervision and regulation oper-ational area and 19 positions in other areas.
Employment and positions are ex-pected to remain constant from year-end 1986 through 1988, with increases in some key areas offset by reductions in less critical areas. Six new positions added to the budget in 1988 support the operational areas of supervision and regulation and monetary and eco-nomic policy. Reductions occur mostly in centralized data processing, by vir-tue of a decline in user requirements and of gains in productivity.
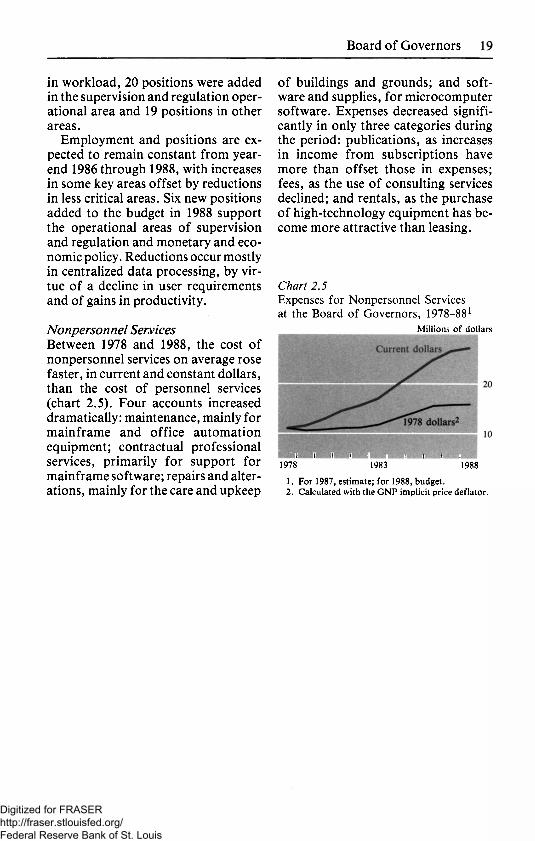
Nonpersonnel Services Between 1978 and 1988, the cost of nonpersonnel services on average rose faster, in current and constant dollars, than the cost of personnel services (chart 2.5). Four accounts increased dramatically: maintenance, mainly for mainframe and office automation equipment; contractual professional services, primarily for support for mainframe software; repairs and alter-ations, mainly for the care and upkeep
of buildings and grounds; and soft-ware and supplies, for microcomputer software. Expenses decreased signifi-cantly in only three categories during the period: publications, as increases in income from subscriptions have more than offset those in expenses; fees, as the use of consulting services declined; and rentals, as the purchase of high-technology equipment has be-come more attractive than leasing.
Chart 2.5 Expenses for Nonpersonnel Services at the Board of Governors, 1978-881
Millions of dollars
•HHUHt * t' i f i i i i i 1978 1983 1988
1. For 1987, estimate; for 1988, budget. 2. Calculated with the GNP implicit price deflator.
Digitized for FRASER http://fraser.stlouisfed.org/ Federal Reserve Bank of St. Louis
21
Chapter 3
Federal Reserve Banks
This chapter presents the expenses and budgets of the Federal Reserve Banks. An overview of all the Districts for 1988 presents the aggregate budgets for personnel and nonpersonnel ex-penses, major initiatives, and the bud-get objective. Subsequent sections pro-vide details for the four operational areas, objects of expense, capital out-lays, and long-term trends.
Appendix F gives further data, in-cluding a summary of the budget performance of the Reserve Banks in 1987 and trends in expenses by opera-tional area.
An Overview of the 1988 Budget For 1988, the Board of Governors has approved an operating budget of $1,245.1 million for the Federal Re-serve Banks. This is an increase of $51.9 million, or 4.3 percent, over estimated expenses in 1987 after exclud-ing $1.1 million counted in 1987 oper-ating expenses for development of digitized image processing of checks (table 3.1).1 The Reserve Banks have not included in their budgets the $6.2 million cost in 1988 for research and development of check image process-ing, a project described later in this chapter. Also excluded are an esti-mated $15 million of expenses to im-plement the Expedited Funds Avail-ability Act. These costs bring the 1988 operating budget for the Reserve Banks to $1,266.3 million, an increase of $72 million, or 6.0 percent, over 1987 expenses. Implementation of the expe-
1. Appendix B describes the budget process for the Reserve Banks.
dited funds legislation will also require $15 million of capital expenditures; when added to the capital budget, these costs will bring 1988 capital spending to $240.9 million.
Personnel expenses comprise sala-ries and benefits and account for 62 percent of the Banks' expenses in 1988; at $775.8 million, they are $34.1 mil-lion, or 4.6 percent, higher than esti-mated for 1987. This increase is par-tially offset by a reduction of 74, or 0.3 percent, in the average number of personnel, to 23,031.2 This reduction includes the effect of early retirement programs, which the Board of Gover-nors has approved at seven Reserve Banks. Employment will be lower in overhead services, services to the U.S. Treasury, and priced and nonpriced services to financial institutions; it will be higher in supervision and regulation and in monetary and economic policy.
Nonpersonnel expenses are bud-geted at $469.3 million, an increase of $16.7 million, or 3.7 percent. These expenses are influenced primarily by automation and building projects, which result in higher expenses for the following major items: depreciation and maintenance of equipment, rent, property depreciation, and real estate taxes.
2. The term "average number of personnel" describes levels and changes in employment at the Reserve Banks. ANP measures the number of employees in terms of full-time positions for the time period. For instance, a full-time em-ployee who starts work July 1 counts as 0.5 ANP for that year; two half-time employees who start January 1 count as one ANP. The ANP for any given year is the average of the number of full-time employees (measured in this way) in the months of that year.
Digitized for FRASER http://fraser.stlouisfed.org/ Federal Reserve Bank of St. Louis
22 Federal Reserve System Audits
Table 3.1 Operating Expenses of the Federal Reserve Banks, 1986-881
Thousands of dollars, except as noted
Item 1986 1987 1988 Percent change Item actual estimate budget 1986-87 1987-88
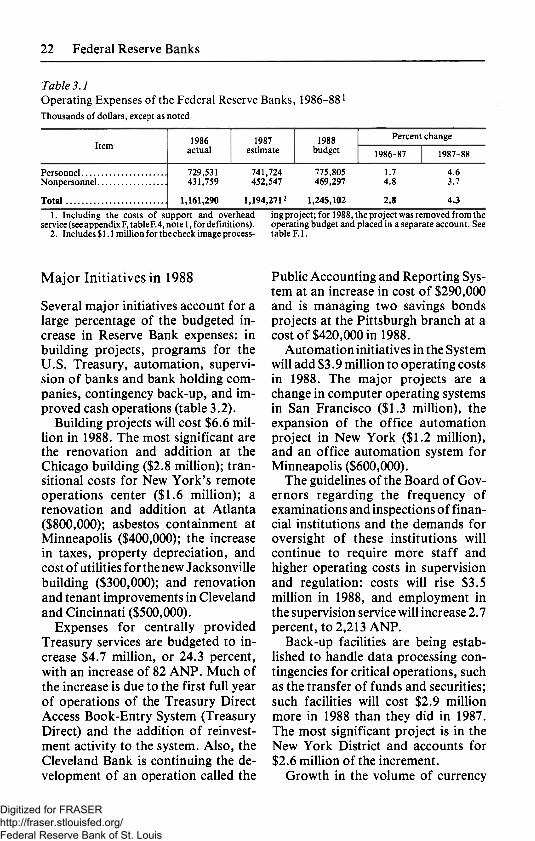
Personnel 729,531 741,724 775,805 1.7 4.6 Nonpersonnel 431,759 452,547 469,297 4.8 3.7
Total 1,161,290 1,194,271: 1,245,102 2.8 4.3 1. Including the costs of support and overhead ing project; for 1988, the project was removed from the
service (see appendix F, table F.4, note 1, for definitions). operating budget and placed in a separate account. See 2. Includes $1.1 million for the check image process- table F. 1.
Major Initiatives in 1988
Several major initiatives account for a large percentage of the budgeted in-crease in Reserve Bank expenses: in building projects, programs for the U.S. Treasury, automation, supervi-sion of banks and bank holding com-panies, contingency back-up, and im-proved cash operations (table 3.2).
Building projects will cost $6.6 mil-lion in 1988. The most significant are the renovation and addition at the Chicago building ($2.8 million); tran-sitional costs for New York's remote operations center ($1.6 mill ion); a renovation and addition at Atlanta ($800,000); asbestos containment at Minneapolis ($400,000); the increase in taxes, property depreciation, and cost of utilities for the new Jacksonville building ($300,000); and renovation and tenant improvements in Cleveland and Cincinnati ($500,000).
Expenses for centrally provided Treasury services are budgeted to in-crease $4.7 million, or 24.3 percent, with an increase of 82 ANP. Much of the increase is due to the first ful l year of operations of the Treasury Direct Access Book-Entry System (Treasury Direct) and the addition of reinvest-ment activity to the system. Also, the Cleveland Bank is continuing the de-velopment of an operation called the
Public Accounting and Reporting Sys-tem at an increase in cost of $290,000 and is managing two savings bonds projects at the Pittsburgh branch at a cost of $420,000 in 1988.
Automation initiatives in the System will add $3.9 million to operating costs in 1988. The major projects are a change in computer operating systems in San Francisco ($1.3 million), the expansion of the office automation project in New York ($1.2 million), and an office automation system for Minneapolis ($600,000).
The guidelines of the Board of Gov-ernors regarding the frequency of examinations and inspections of finan-cial institutions and the demands for oversight of these institutions wil l continue to require more staff and higher operating costs in supervision and regulation: costs wil l rise $3.5 million in 1988, and employment in the supervision service wil l increase 2.7 percent, to 2,213 ANP.
Back-up facilities are being estab-lished to handle data processing con-tingencies for critical operations, such as the transfer of funds and securities; such facilities will cost $2.9 million more in 1988 than they did in 1987. The most significant project is in the New York District and accounts for $2.6 million of the increment.
Growth in the volume of currency
Digitized for FRASER http://fraser.stlouisfed.org/ Federal Reserve Bank of St. Louis

Federal Reserve System Audits 23
handled by the Banks requires an increase of $2.0 million and 59 ANP. The Federal Reserve Banks of Boston, Philadelphia, Richmond, Minneapo-lis, and San Francisco plan to add shifts. The San Francisco District will also add two high-speed sorting ma-chines in its Los Angeles Branch.
Beyond the major initiatives, 0.4 percentage point of the 4.3 percent rise in operating expense is due to increases of $2.8 million in rent at the New York office, of $1.4 million in the System's maintenance contract for currency processing equipment, and of nearly $1.0 million in real estate taxes in Boston.
Table 3.2 shows that budgeted 1988 expenses for operations continuing from 1987 will rise 2.4 percent over estimated 1987 expenses and that the initiatives just summarized will add
Table 3.2 Effect of Major Initiatives on the 1988 Budget of the Reserve Banks Thousands of dollars, except as noted
Item
Operating expenses 1987 estimate 1988 budget
Increase, 1987 to 1988 Thousands of dollars . Percent
LESS Major 1988 initiatives: Facilities Programs for the U.S. Treasury Automation Increased supervision of banks
and bank holding companies... Contingency back-up Improved cash operations
Total
EQUALS Increase excluding major
1988 initiatives Thousands of dollars Percent
Amount
1,193,171' 1,245,102
51,931 4.4
6,563 4,748 3,918
3,460 2,916 1,961
23,566
28,365 2.4
1.9 percent for an overall growth of 4.3 percent.
Check Image Processing In addition to the initiatives discussed above, the Board of Governors has authorized further research and devel-opment of digitized image processing of checks. The technology captures check images electronically for com-puter storage and retrieval; it offers the promise of replacing microfilm, which the Federal Reserve uses to store images of truncated checks, including Treasury checks, and of speeding the transmittal of returned checks by sub-stituting an electronic image for the physical check.3
Research authorized by the Federal Reserve in 1985 and conducted on its behalf has demonstrated the feasibility of making a computerized image of one side of a check at high speed under laboratory conditions. The technical demonstration was completed in 1987 at a cost for that year of approximately $1.1 million, distributed across the operating budgets of all the Districts.
The next phases, for which $6.2 million has been allocated in a special-project account separate from the System's operating budgets, will test the high-speed capture of both sides of checks plus the ability to store and retrieve the image data. These phases will be first conducted under labora-tory conditions with a limited volume of checks and then at a Reserve Bank under production conditions.
The Federal Reserve will share the results of this research with the finan-cial community, where it might also
1. Excluding $1.1 mil l ion for the check image processing project.
3. Truncated checks are those that are not routinely sent to the account holder when cleared.
Digitized for FRASER http://fraser.stlouisfed.org/ Federal Reserve Bank of St. Louis
24 Federal Reserve System Audits
offer widespread benefits in the stor-age and exchange of check images.
Budget Objective for 1988 The 1988 objective for the Banks, approved by the Board of Governors in the spring of 1987, provided for the increase in general Bank expenses (those excluding expenses unique to one District) to equal 4.3 percent of total estimated 1987 operating ex-penses. In addition, the objective pro-vided a 0.6 percent rise over 1987 to cover expenses unique to one District and a 0.5 percent increase for work on check image processing, for an overall expansion of 5.4 percent (table 3.3). The Expedited Funds Availability Act was passed too late in the Federal Reserve budget process (August 1987) to include its associated expenses in the budget objective.
The approved operating budget for general Bank expenses is 4.0 percent higher than estimated 1987 expenses, compared to the objective of 4.3 per-cent. The total budget, 4.8 percent higher than 1987 estimated expenses, is lower than the overall objective by 0.6 percentage point, or $7.2 million.
Table 3.3 Comparison of 1988 Budget of the Reserve Banks with 1988 Budget Objective
Percent increase from 1987 estimated expenses
Item 1988 budget
1988 budget
objective
District expenses less those unique to one District 4.0 4.3
Expenses unique to one District .3 .6
Check image processing .5 project .5 .5
Total 4.8 5.4
Operational Areas
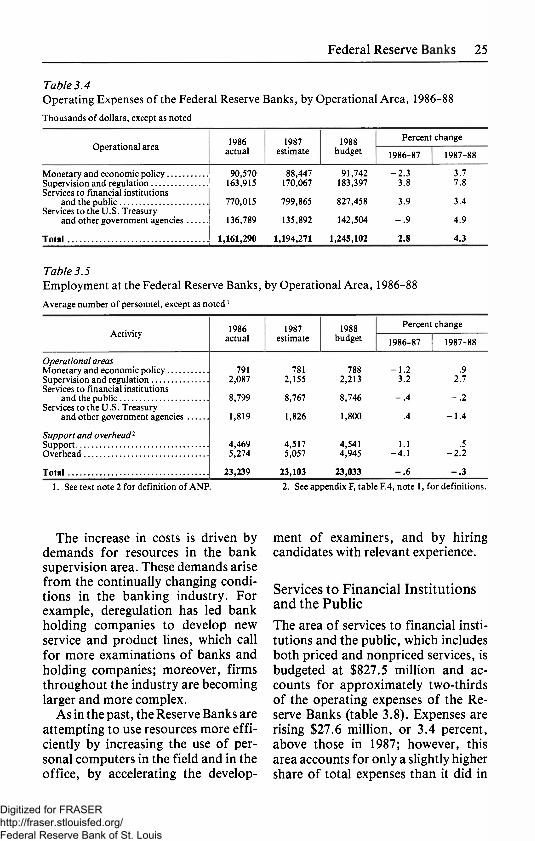
The following discussion presents Re-serve Bank expenses and employment in each of the four operational areas. They are summarized in tables 3.4 and 3.5 and detailed in tables 3.6 through 3.9.
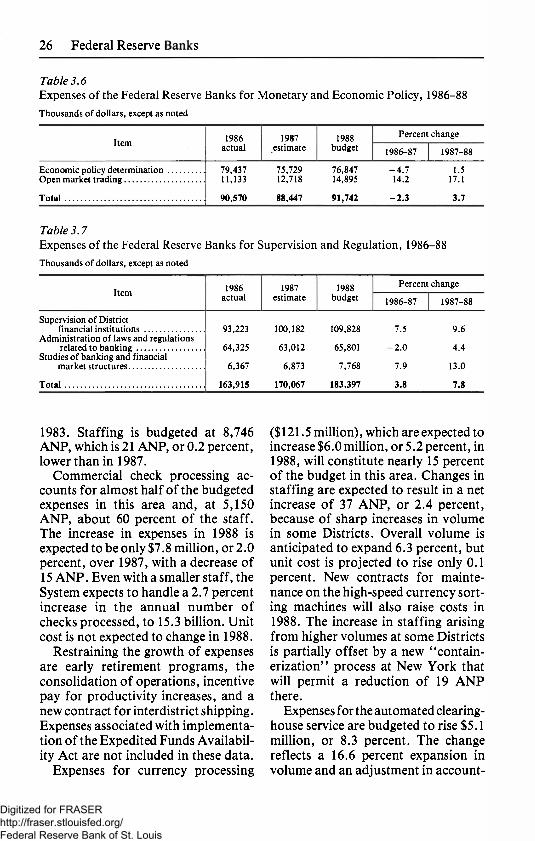
Monetary and Economic Policy Expenses for monetary and economic policy at the Federal Reserve Banks total $91.7 million and account for approximately 7 percent of their 1988 budgets (table 3.6). Expenses are ex-pected to increase $3.3 million, or 3.7 percent, over 1987. Employment will increase 7 ANP, or 0.9 percent, to 788.
The rise in cost reflects the net addition to staff, salary actions, and improvements in office automation. Staff members were added in New York for testing the replacement for an eight-year-old system used for open market trading, intensifying the moni-toring and analysis of debt in less developed countries, and studying the feasibility of receiving data electroni-cally from reporting institutions; in Atlanta for continuing a special effort to improve the quality of economic research; and in Dallas for supporting a Southwestern economic develop-ment program.
Supervision and Regulation Expenses for supervision and regula-tion, which total $183.4 million, are expected to increase $13.3 million, or 7.8 percent, over 1987 (table 3.7). This area now accounts for 14.7 percent of total System expenses, compared with 12.8 percent in 1983. A staff level of 2,213 ANP is budgeted, an increase of 58, or 2.7 percent, over 1987.
Digitized for FRASER http://fraser.stlouisfed.org/ Federal Reserve Bank of St. Louis
Federal Reserve System Audits 25
Table 3.4 Operating Expenses of the Federal Reserve Banks, by Operational Area, 1986-88
Thousands of dollars, except as noted
Operational area 1986 actual
1987 estimate
1988 budget
Percent
1986-87
change
1987-88
Monetary and economic policy Supervision and regulation Services to financial institutions
and the public Services to the U.S. Treasury
and other government agencies
Total
90,570 88,447 91,742 - 2 . 3 3.7 163,915 170,067 183,397 3.8 7.8
770,015 799,865 827,458 3.9 3.4
136,789 135,892 142,504 - . 9 4.9
1,161,290 1,194,271 1,245,102 2.8 4.3
Table 3.5 Employment at the Federal Reserve Banks, by Operational Area, 1986-88
Average number of personnel, except as noted1
Activity 1986 actual
1987 estimate
1988 budget
Percent change Activity 1986
actual 1987
estimate 1988
budget 1986-87 1987-88
Operational areas .9 Monetary and economic policy 791 781 788 - 1 . 2 .9
Supervision and regulation 2,087 2,155 2,213 3.2 2.7 Services to financial institutions
and the public 8,799 8,767 8,746 - . 4 - . 2 Services to the U.S. Treasury
and other government agencies 1,819 1,826 1,800 .4 - 1 . 4
Support and overhead2
Support 4,469 4,517 4,541 1.1 .5 Overhead 5,274 5,057 4,945 - 4 . 1 - 2 . 2
Total 23,239 23,103 23,033 - . 6 - . 3
1. See text note 2 for definition of ANP. 2. See appendix F, table F.4, note 1, for definitions.
The increase in costs is driven by demands for resources in the bank supervision area. These demands arise from the continually changing condi-tions in the banking industry. For example, deregulation has led bank holding companies to develop new service and product lines, which call for more examinations of banks and holding companies; moreover, firms throughout the industry are becoming larger and more complex.
As in the past, the Reserve Banks are attempting to use resources more effi-ciently by increasing the use of per-sonal computers in the field and in the office, by accelerating the develop-
ment of examiners, and by hiring candidates with relevant experience.
Services to Financial Institutions and the Public The area of services to financial insti-tutions and the public, which includes both priced and nonpriced services, is budgeted at $827.5 million and ac-counts for approximately two-thirds of the operating expenses of the Re-serve Banks (table 3.8). Expenses are rising $27.6 million, or 3.4 percent, above those in 1987; however, this area accounts for only a slightly higher share of total expenses than it did in
Digitized for FRASER http://fraser.stlouisfed.org/ Federal Reserve Bank of St. Louis
26 Federal Reserve System Audits
Table 3.6 Expenses of the Federal Reserve Banks for Monetary and Economic Policy, 1986-88 Thousands of dollars, except as noted
Item 1986 actual
1987 estimate
1988 budget
Percent
1986-87
change
1987-88
Economic policy determination Open market trading
Total
79,437 75,729 76,847 - 4 . 7 1.5 11,133 12,718 14,895 14.2 17.1
90,570 88,447 91,742 - 2 . 3 3.7
Table 3.7 Expenses of the Federal Reserve Banks for Supervision and Regulation, 1986-88 Thousands of dollars, except as noted
Item 1986 actual
1987 estimate
1988 budget
Percent
1986-87
change
1987-88
Supervision of District financial institutions
Administration of laws and regulations related to banking
Studies of banking and financial market structures
Total
93,223 100,182 109,828 7.5 9.6
64,325 63,012 65,801 - 2 . 0 4.4
6,367 6,873 7,768 7.9 13.0
163,915 170,067 183,397 3.8 7.8
1983. Staffing is budgeted at 8,746 ANP, which is 21 ANP, or 0.2 percent, lower than in 1987.
Commercial check processing ac-counts for almost half of the budgeted expenses in this area and, at 5,150 ANP, about 60 percent of the staff. The increase in expenses in 1988 is expected to be only $7.8 million, or 2.0 percent, over 1987, with a decrease of 15 ANP. Even with a smaller staff, the System expects to handle a 2.7 percent increase in the annual number of checks processed, to 15.3 billion. Unit cost is not expected to change in 1988.
Restraining the growth of expenses are early retirement programs, the consolidation of operations, incentive pay for productivity increases, and a new contract for interdistrict shipping. Expenses associated with implementa-tion of the Expedited Funds Availabil-ity Act are not included in these data.
Expenses for currency processing
($121.5 million), which are expected to increase $6.0 million, or 5.2 percent, in 1988, will constitute nearly 15 percent of the budget in this area. Changes in staffing are expected to result in a net increase of 37 ANP, or 2.4 percent, because of sharp increases in volume in some Districts. Overall volume is anticipated to expand 6.3 percent, but unit cost is projected to rise only 0.1 percent. New contracts for mainte-nance on the high-speed currency sort-ing machines will also raise costs in 1988. The increase in staffing arising from higher volumes at some Districts is partially offset by a new "contain-erization" process at New York that will permit a reduction of 19 ANP there.
Expenses for the automated clearing-house service are budgeted to rise $5.1 million, or 8.3 percent. The change reflects a 16.6 percent expansion in volume and an adjustment in account-
Digitized for FRASER http://fraser.stlouisfed.org/ Federal Reserve Bank of St. Louis

Federal Reserve System Audits 27
Table 3.8 Expenses of the Federal Reserve Banks for Services to Financial Institutions and the Public, 1986-88 Thousands of dollars, except as noted
Service 1986 actual
1987 estimate
1988 budget
Percent change Service 1986
actual 1987
estimate 1988
budget 1986-87 1987-88
Currency and coin 150,134 153,353 160,163 2.1 4.4 Commercial checks 379,781 397,474 405,307 4.7 2.0 Other checks 18,226 19,169 19,017 5.2 - . 8 Funds transfers 57,951 56,693 58,532 - 2 . 2 3.2 Automated clearinghouse 55,462 61,479 66,601 10.9 8.3 Book-entry securities transfers 19,962 23,108 25,919 15.8 12.2 Definitive securities safekeeping
and noncash collections 19,771 18,337 18,487 - 7 . 3 .8 Loans to members and others 12,812 13,343 13,965 4.1 4.7 Bank and public relations 35,120 36,999 38,610 5.3 4.4 Other 20,797 19,911 20,856 - 4 . 3 4.7
Total 770,016 799,866 827,457 3.9 3.4
Table 3.9 Expenses of the Federal Reserve Banks for Services to the U.S. Treasury and Other Government Agencies, 1986-88 Thousands of dollars, except as noted
Service 1986 actual
1987 estimate
1988 budget
Percent change Service 1986
actual 1987
estimate 1988
budget 1986-87 1987-88
Savings bonds 40,878 39,725 40,424 - 2 . 8 1.8 Other Treasury issues 28,231 21,148 19,573 -25 .1 - 7 . 4 Centrally provided
Treasury agency services 12,972 19,560 24,308 50.8 24.3 Government accounts 20,627 20,328 21,824 - 1 . 4 7.4 Food coupons 12,131 12,261 12,574 1.1 2.5 Other 21,950 22,870 23,801 4.2 4.1
Total 136,789 135,892 142,504 - . 7 4.9
ing to distribute the costs of data processing and data communications (DP/DC) more accurately. A decrease of 2 ANP is budgeted. Unit costs are expected to increase 1.1 percent.
The costs for funds transfer are ex-pected to increase $1.8 million, or 3.2 percent, on balance, reflecting a 6.1 percent rise in volume, an additional 3 ANP, and a decrease due to the DP/DC accounting change. Unit costs are expected to increase only 1.9 percent.
Costs for book-entry securities are expected to increase $2.8 million, or 12.1 percent, because of an 11.7 per-cent increase in volume, initiatives to
reduce risk in the payments system, the DP/DC accounting change, and higher costs for the maintenance of shared software.
The budget for public relations, which shows an increase of $1.6 mil-lion, or 4.4 percent, over 1987 expens-es, pays for conferences, printed and video materials, occupancy, educa-tional exhibits, and postage. The staff level is expected to decrease 6 ANP.
The "other" category will increase $900,000, or 4.7 percent, reflecting automation initiatives at New York for services to other central banks that will permit a decline of 10 ANP.
Digitized for FRASER http://fraser.stlouisfed.org/ Federal Reserve Bank of St. Louis
28 Federal Reserve System Audits
Services to the U.S. Treasury and Other Government Agencies
Expenses for services to the U.S. Trea-sury and other government agencies are budgeted at $142.5 million, an increase of $6.6 million, or 4.9 percent, from 1987 (table 3.9). This area ac-counts for approximately 11 percent of operating costs. Staffing is budgeted to decrease 26 ANP, or 1.4 percent, to 1,800 ANP.
Consolidation of operations and higher levels of automation are two influences on these costs. Several Dis-tricts are consolidating operations at one office. The Banks are seeking greater efficiency through the substitu-tion of electronic ("book-entry") records for paper ("definitive") secu-rities and through the use of high-speed sorting machines to process food coupons and savings bonds.
The most significant initiatives are in centrally provided Treasury servic-es; expenses here are budgeted to increase $4.7 million, or 24.3 percent, and 82 ANP will be added to the staff. Much of this increase ($4 million and 54 ANP) occurs because 1988 is the first full year of operation for the Treasury Direct system and because reinvestment activity has been added to that system. Treasury Direct, which handles all purchases of government securities by individuals in book-entry form, is managed in Philadelphia with local operations in each District. Its expansion permits an offsetting de-crease in the operation that handles definitive securities—"other Treasury issues"—for which staff is decreasing 52 ANP and expenses $1.6 million.
Besides Treasury Direct, the increase in centrally provided Treasury services reflects three programs in the Cleve-land District. First, Cleveland is con-tinuing to develop the Public Account-
ing and Reporting System, which will increase costs $290,000 in 1988 and require an expansion in staff of 13 ANP. Second, the Treasury has desig-nated the Pittsburgh Branch to central-ize the inscription of bonds by issuing agents and to eliminate the need for the consignment of savings bonds. This program will increase costs $213,000 in 1988 and add 9 ANP. Third, the Pittsburgh Branch will explore the use of the Federal Reserve's high-speed check sorting equipment to process savings bonds. This program will re-quire $208,000 and 6 ANP in 1988.
Consolidation of operations in the savings bond service is expected in four Districts and consolidation of definitive safekeeping in one District. These efforts are expected to reduce staff levels. About half of the Districts have budgeted funds for a new tax and loan accounting system that was devel-oped by one Bank for the U.S. Trea-sury under voluntary cost-sharing ar-rangements.
Objects of Expense The expenses of the Federal Reserve Banks are shown by personnel and nonpersonnel objects in table 3.10.
Personnel expenses consist of sala-ries for officers and employees, other expenses to compensate personnel, and retirement and other benefits. Total personnel costs account for 62 percent of total Federal Reserve expenses and are expected to increase $34.1 million, or 4.6 percent, in 1988.
Salaries and other personnel ex-penses account for nearly 52 percent of the Banks' budgeted expenses and are expected to increase $24.4 million, or 3.9 percent, in 1988. Salaries are ex-pected to increase 4.5 percent, while other personnel expenses are expected to decline 20.7 percent. Merit pay
Digitized for FRASER http://fraser.stlouisfed.org/ Federal Reserve Bank of St. Louis

Federal Reserve System Audits 29
Table 3.10 Operating Expenses of the Federal Reserve Banks, by Object, 1986-88 Thousands of dollars, except as noted
Object 1986 actual
1987 estimate
1988 budget
Percent change Object 1986
actual 1987
estimate 1988
budget 1986-87 1987-88
PERSONNEL Officers' salaries 56,168 59,704 62,272 6.3 4.3 Employees' salaries 523,309 547,203 571,833 4.6 4.5 Other personnel 16,693 13,738 10,896 - 17.7 - 2 0 . 7 Retirement and benefits 133,360 121,080 130,804 - 9 . 2 8.0
Total personnel 729,531 741,724 775,805 1.7 4.6
NONPERSONNEL Equipment Purchases 3,096 3,964 2,820 28.0 - 2 8 . 9 Rentals 40,665 34,434 27,416 - 1 5 . 3 - 2 0 . 4 Depreciation 68,000 76,578 82,874 12.6 8.2 Repairs and maintenance 38,998 43,604 49,510 11.8 13.5
Total equipment 150,760 158,579 162,621 5.2 2.5
Buildings Insurance 610 887 917 45.3 3.4 Taxes on Real Estate 22,213 21,871 24,666 - 1 . 5 12.8 Property Depreciation 23,549 26,466 29,525 12.4 11.6 Utilities 22,809 23,047 24,127 1.0 4.7 Rent 14,976 17,461 20,814 16.6 19.2 Other 13,607 18,499 17,948 36.0 - 3 . 0
Total buildings 97,765 108,231 117,997 10.7 9.0
Shipping Postage 13,464 12,337 13,275 - 8 . 4 7.6 Other 68,416 69,845 69,351 2.1 - . 7
Total shipping 81,880 82,181 82,626 .4 .5
Other Supplies 46,005 46,725 47,952 1.6 2.6 Travel 19,775 22,086 22,965 11.7 4.0 Communications 15,255 12,570 12,602 - 17.6 .3 Fees 11,207 11,223 9,577 .2 - 1 4 . 7 Other 9,114 10,951 12,956 20.2 18.3
Total other 101,356 103,555 106,052 2.2 2.4
Total nonpersonnel 431,760 452,547 469,297 4.8 3.7
Total 1,161,290 1,194,271 1,245,102 2.8 4.3
increases of 4.8 percent are partially offset by reductions in overtime ex-penses. Salary increases for promo-tions, adjustments in structure, and reclassifications are offset by an in-crease in turnover (the replacement of a departing employee by one with a lower salary) and by an increase in the time a position remains vacant. The decline in other personnel expenses reflects primarily the decline in the use of computer programmers on con-tract.
Each Federal Reserve office bases its salary structure for staff members
other than officers on annual surveys of compensation offered by major employers in its community. Nation-wide surveys are used to adjust the structure of officers' salaries.
Expenses for retirement and other benefits, which account for 10 percent of the Banks' budgeted expenses, are projected to increase $9.7 million, or 8.0 percent, in 1988. This increase reflects higher costs for hospital, med-ical, and dental insurance, along with the effect of large claims in several Districts; an increase in the tax rate for social security; an increase in benefits,
Digitized for FRASER http://fraser.stlouisfed.org/ Federal Reserve Bank of St. Louis
30 Federal Reserve System Audits
reflecting payments to employees ac-cepting early retirement; and resump-tion of normal group life insurance premiums (the Districts did not have to pay any in 1987).
Nonpersonnel expenses account for 38 percent of the Banks' expenses and are projected to increase 3.7 percent. Equipment accounts for 13 percent of the Banks' expenses and are budgeted to increase 2.5 percent. Developments in priced services are responsible for the rise in equipment costs: initiatives to meet the changing needs and de-mands of check collection; efforts to standardize automation and commu-nication systems in response to the consolidation of financial institutions; progress toward encrypting communi-cation links for various users of priced services; and continued work to ex-pand and upgrade electronic networks that provide information to financial institutions.
Building expenses, which account for 9 percent of total expenses, are expected to increase 9.0 percent in 1988. Building renovations and repairs at Chicago, New York, Cleveland, and Dallas contribute to increases in depre-ciation, taxes on real estate, and utility expenses. Rental expenses are 19.2 percent higher, primarily because of the $2.8 million increase at New York. These increases will be partially offset by a decline in other building costs, which were swollen in 1987 in the majority of Districts by one-time, outside contractual expenses.
Shipping costs, which account for nearly 7 percent of 1988 budgeted expenses, will increase only 0.5 per-cent, as savings from a renegotiated contract for interdistrict transporta-tion will offset an anticipated increase in postal rates.
Other nonpersonnel expenses will rise only 2.4 percent. Increases in expenditures for travel—primarily for
supervision and regulation—and for supplies, will be offset by projected declines in fees.
Capital Outlays
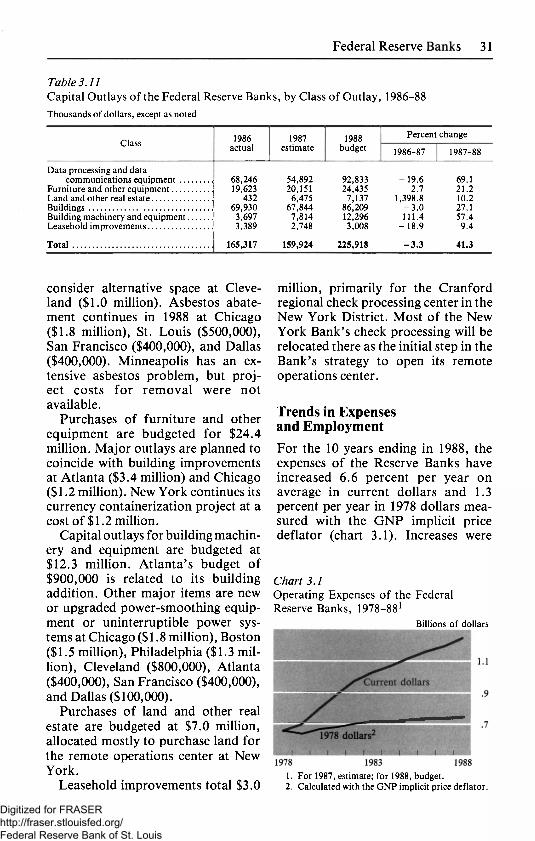
Capital outlays of the Reserve Banks are budgeted at $225.9 million, an increase of $66.0 mil l ion, or 41.3 percent, from the 1987 level (table 3.11). Capital budgets continue to be dominated by outlays for data process-ing and data communications equip-ment and for buildings.
Outlays for data processing and data communication equipment total $92.8 mil l ion in 1988, approximately 41 percent of the total capital budget. This equipment includes new main-frames or upgrades for Dallas ($6.4 million), San Francisco ($4.8 million), the Los Angeles Branch ($4.3 million), Atlanta ($2.8 million), Richmond ($1.8 million), Chicago ($1.4 million), and St. Louis ($1.4 million). New or up-graded check processing equipment is expected at Chicago ($8.2 million), Cleveland ($5.2 million), Atlanta ($2.8 million), and Richmond ($2.5 million). Outlays for computer peripheral equip-ment are planned at New York ($4.1 mill ion), Cleveland ($3.2 mill ion), Chicago ($2.6 million), and Richmond ($2.4 million). Other major outlays result from office automation projects for New York ($3.6 million) and Min-neapolis ($1.3 million).
Building outlays total $86.2 million in 1988, about 38 percent of the total capital budget. The bulk of these outlays are in additions and improve-ments at Chicago ($35.0 million) and Atlanta ($2.6 million). New buildings are budgeted for Charlotte ($18.5 million) and Helena ($500,000). The initial phases of two building projects are budgeted for 1988: a remote oper-ations center in New York ($1.5 million, exclusive of land) and fees to
Digitized for FRASER http://fraser.stlouisfed.org/ Federal Reserve Bank of St. Louis
Federal Reserve System Audits 31
Table 3.11 Capital Outlays of the Federal Reserve Banks, by Class of Outlay, 1986-88 Thousands of dollars, except as noted
Class 1986 1987 1988 Percent change Class actual estimate budget 1986-87 1987-88
Data processing and data communications equipment 68,246 54,892 92,833 -19 .6 69.1
Furniture and other equipment 19,623 20,151 24,435 2.7 21.2 Land and other real estate 432 6,475 7,137 1,398.8 10.2 Buildings 69,930 67,844 86,209 - 3 . 0 27.1 Building machinery and equipment 3,697 7,814 12,296 111.4 57.4 Leasehold improvements 3,389 2,748 3,008 -18 .9 9.4
Total 165,317 159,924 225,918 - 3 . 3 41.3
consider alternative space at Cleve-land ($1.0 million). Asbestos abate-ment continues in 1988 at Chicago ($1.8 million), St. Louis ($500,000), San Francisco ($400,000), and Dallas ($400,000). Minneapolis has an ex-tensive asbestos problem, but proj-ect costs for removal were not available.
Purchases of furniture and other equipment are budgeted for $24.4 million. Major outlays are planned to coincide with building improvements at Atlanta ($3.4 million) and Chicago ($1.2 million). New York continues its currency containerization project at a cost of $1.2 million.
Capital outlays for building machin-ery and equipment are budgeted at $12.3 mill ion. Atlanta's budget of $900,000 is related to its building addition. Other major items are new or upgraded power-smoothing equip-ment or uninterruptible power sys-tems at Chicago ($1.8 million), Boston ($1.5 million), Philadelphia ($1.3 mil-lion), Cleveland ($800,000), Atlanta ($400,000), San Francisco ($400,000), and Dallas ($100,000).
Purchases of land and other real estate are budgeted at $7.0 million, allocated mostly to purchase land for the remote operations center at New York.
Leasehold improvements total $3.0
million, primarily for the Cranford regional check processing center in the New York District. Most of the New York Bank's check processing will be relocated there as the initial step in the Bank's strategy to open its remote operations center.
Trends in Expenses and Employment
For the 10 years ending in 1988, the expenses of the Reserve Banks have increased 6.6 percent per year on average in current dollars and 1.3 percent per year in 1978 dollars mea-sured with the GNP implicit price deflator (chart 3.1). Increases were
Chart 3.1 Operating Expenses of the Federal Reserve Banks, 1978-881
Billions of dollars
1. For 1987, estimate; for 1988, budget. 2. Calculated with the GNP implicit price deflator.
Digitized for FRASER http://fraser.stlouisfed.org/ Federal Reserve Bank of St. Louis

32 Federal Reserve System Audits
Chart 3.2 Employment at the Federal Reserve Banks, 1978-881
ANP, in thousands2
1978 1983 1988
1. For 1987, estimate; for 1988, budget. 2. See text note 2 for definition of ANP.
largest during the early 1980s, when the Banks began implementing the requirements of the Monetary Control Act (MCA) and the high rate of infla-tion drove up wages. From 1980 to 1983, normal expenses increased an average of 9.1 percent per year in current dollars, while the rate of infla-tion averaged 6.6 percent. Since then, a much lower trend has been evident, with nominal expenses rising an aver-age of 3.9 per year, and prices an average of 3.0 percent.
Over the last decade the number of employees at the Reserve Banks has declined 448 ANP, or 1.9 percent (chart 3.2). In 1974, employment at the Reserve Banks peaked at 26,567 ANP; it declined a total of 3,624, or 13.6 percent, over the next five years under a Systemwide program to in-crease productivity. Employment in-creased in 1980 and 1981 because of the MCA; however, over the next three years, employment declined a total of 1,320, or 5.5 percent, reaching 22,669 in 1984, its lowest level in the 1978-88 period. Employment rose again in 1985 and 1986 as bank examiners were added and actions were taken to handle increasing volume. Employment is expected to decline 136 ANP in 1987, in part because of budget restraint in the spirit of the Gramm-Rudman-
Table 3.12 Changes from 1987 to 1988 in Volumes and Unit Costs of Federal Reserve Bank Services Percent
Service Volume Unit cost
Payments 4.5 .5 Commercial checks 2.7 .2 Automated clearinghouse 16.6 1.1 Funds transfers 6.1 1.9 Other 1.7 1.6
Cash 5.0 .7 Currency 6.3 .1 Coin -2 .3 4.8
Fiscal agency - 3 . 1 6.9 Savings bonds - . 7 3.8 Other Treasury issues -27.5 24.7 Other fiscal agency - . 3 4.9 Treasury Direct 33.6 .3
Securities and noncash services 6.0 4.3
Al l 3.7 1.5 3.7 1.5
Hollings legislation. In 1988, employ-ment is budgeted to decline 74 ANP, as measures to control costs, mostly in support and overhead, offset the added staff needed for supervision and regu-lation and the growth in the number of items handled.
Volumes and Unit Costs Total volume for all measured services of the Reserve Banks in 1988 is bud-geted to increase 3.7 percent over 1987, and unit costs are expected to increase 1.5 percent (table 3.12). The rise in unit costs is derived mainly from fiscal agency services, where volumes are declining relative to costs, and from securities services, where expenses are increasing relative to volumes. Unit costs in the two largest operations, check and currency, are expected to rise only slightly. On average, over the five years from 1983 to 1988, total volume increased 4.3 percent per year, while unit costs in current dollars decreased 0.1 percent per year.
Digitized for FRASER http://fraser.stlouisfed.org/ Federal Reserve Bank of St. Louis
Part II Special Analysis
Digitized for FRASER http://fraser.stlouisfed.org/ Federal Reserve Bank of St. Louis

35
Chapter 4
Review of Fiscal Agency Services
As fiscal agents of the United States, the Federal Reserve Banks provide a variety of services to the public and to depository institutions on behalf of federal agencies. The U.S. Treasury, in fact, is the single largest user of Federal Reserve Bank services. In 1987, the Reserve Banks spent an estimated $206 million, or 17 percent of total operating expenses, in provid-ing fiscal services to government agen-cies and the public.1 They expect to spend $217 million in 1988. The Sy-stem's legal mandate for providing these services is different from the mandate in the Monetary Control Act, which guides the provision of Federal Reserve Bank services to depository institutions. This review looks at the mandate for fiscal agency services, the scope of services provided to govern-ment agencies, and the reimbursement to the System for those services.
Historical Background The original Federal Reserve Act, signed into law in 1913, did not give the Federal Reserve Banks a role in provid-ing fiscal services to government agen-
1. The costs the Reserve Banks incur in providing fiscal agency services are divided between two operational areas. The area of services to the U.S. Treasury and other govern-ment agencies accounted for an estimated $136 million in 1987. The remaining $70 million pertains to certain fiscal services, such as govern-ment funds transfers and automated clearing-house payments, Treasury book-entry services, and check processing, that are counted under the area of services to financial institutions and the public. See chap. 3 and appendix A for details about operational areas of the Reserve Banks.
cies. This function was added two years later at the request of Secretary of the Treasury W.G. McAdoo, who on No-vember 24, 1915, appointed the Fed-eral Reserve Banks as "fiscal agents" of the United States.2 Almost immedi-ately, U.S. government funds on de-posit with national banks were trans-ferred to the Treasury's account at each Federal Reserve Bank; these ac-counts established the Reserve Banks as an integral part of the mechanism by which the U.S. Treasury collected and disbursed funds on behalf of the fed-eral government.
Services for the Treasury and other government agencies were added over time. For example, the Banks' securi-ties services—including distribution, redemption, and safekeeping—began in May 1917 with the first Liberty Bond offering to finance the U.S. effort in World War I. After the war, the government's growing need to borrow from the private sector com-pelled the Treasury to seek an alter-native to its limited network of Subtreasuries.3 When the Subtreasu-ries closed in 1921, the functions related to financing the public debt were transferred to the Reserve Banks. The role of Reserve Banks as fiscal agents expanded when Series E savings bonds were introduced in 1941 to help finance World War II. Today, the savings bond operation is the largest of the
2. A fiscal agent is a person or entity autho-rized by another person or entity to act on its behalf in financial matters.
3. The system of Subtreasuries provided access to depository institutions in regional money centers.
Digitized for FRASER http://fraser.stlouisfed.org/ Federal Reserve Bank of St. Louis

36 Review of Fiscal Agency Services
fiscal agency services provided by the Reserve Banks.
When the Reserve Banks began to provide securities services to the Trea-sury in 1917, Secretary McAdoo initi-ated the reimbursement of the Banks for the cost of the services. In a wire to each of the Banks on May 1, 1917, he stated that " i t will be understood that the Federal reserve banks will be reim-bursed for all direct expenditures con-nected with this work and approved by the Treasury Department.'' This direc-tive governed Treasury practice on reimbursement until 1920, when the Federal Reserve Act was amended to lay a more formal legal basis for fiscal
agency. The amendment allowed the secretary of the Treasury to require fiscal services from the Reserve Banks but declared that compensation to the Banks, while possible and legal, was not mandatory.4
4. Authority for reimbursement to fiscal agents is provided by 31 USC 3302(f) as follows: " ( 0 When authorized by the Secretary, an official or agent of the Government having custody or possession of public money, or performing other fiscal agent services, may be allowed necessary expenses to collect, keep, transfer, and pay out public money and to perform those services. However, money appro-priated for those expenses may not be used to employ or pay officers and employees of the Government."
Table 4.1 Expenses and Reimbursements for Fiscal Agency Services Provided to the U.S. Treasury by the Federal Reserve Banks, Calendar Years 1985-88 Millions of dollars, except as noted
Service
Savings bonds Marketable securities Commercial book entry Interest coupons Treasury Direct Accounts processing Funds transfers Automated clearinghouse Collections Check processing Other
Total2
Reimbursement from Treasury... Unreimbursed expenses
Percent unreimbursed
1985 1986 1987 1988 actual actual estimate budget
37.7 40.9 39.7 40.4 31.1 28.2 21.1 19.6 3.5 14.0 16.2 18.1 2.4 2.1 1.8 1.8 7.5 1 13.01 19.6 24.3
20.0 20.6 20.3 21.8 .3 .3 .3 .3
29.2 30.3 31.2 32.7 2.5 2.7 3.2 3.4
15.0 15.6 15.9 16.0 6.2 5.8 5.4 5.3
155.4 173.5 174.7 183.7
52.2 31.3 42.0 43.0 103.2 142.2 132.7 140.7
66.4 82.0 76.0 76.6
1. Comprises mostly development expenses. Trea-sury Direct was developed for the Treasury by the Federal Reserve Bank of Philadelphia, which operates the system. Implemented in July 1986, the system enables the Treasury to eliminate definitive (physical) securities by maintaining book-entry (electronic) ac-counts for individual investors. Over time, the costs of
the marketable securities service should decline as outstanding definitive issues are retired or redeemed and new issues placed on the Treasury Direct system in book-entry form.
2. Not all of these expenses are currently claimed for reimbursement.
Digitized for FRASER http://fraser.stlouisfed.org/ Federal Reserve Bank of St. Louis

37 Review o f Fiscal Agency Services
Table 4.2 Description of Fiscal Agency Services Provided by the Federal Reserve Banks to the U.S. Treasury
BUREAU OF THE PUBLIC DEBT
Marketable securities/special issues Maintain stocks of unissued Treasury securities Provide Treasury securities information Process applications and maintenance transactions
for Treasury bills, notes, and bonds Conduct intermediate exchange transactions Redeem eligible securities Pay interest on book-entry securities Pay matured coupons on obligations as authorized Pay principal and interest on state
and local government securities Account for all Treasury securities
and all public debt receipts and expenditures Process lost or stolen claims for Treasury securities Provide information returns to IRS on matured
Treasury bearer securities and coupons Prepare Treasury investor classification reports Process telegraphic transfers of securities Maintain accounts reflecting securities held
in book-entry form Conduct auctions for marketable securities
Maintain Treasury's general account Verify, account for, and destroy unfi t currency Prepare investor classification reports
and forward them to the Treasury Process telegraphic transfers of securities
(CPD transfers) Maintain accounts reflecting securities held
on book-entry form Process government checks (IRS, Bureau of the Mint) Refund reclamation (IRS) Government deposits (IRS)
OFFICE OF THE ASSISTANT SECRETARY FOR INTERNATIONAL AFFAIRS
Exchange Stabilization Fund Conduct foreign exchange or investment
transactions Maintain foreign currency and investment accounts Invest any dollar proceeds of foreign exchange
transactions Provide information and analysis
Savings bonds Maintain stocks of unissued savings bonds and
notes Instruct issuing and paying agents and advise public Qualify issuing and paying agents Process applications or payments for individual
or payroll bonds Process appropriate claims Reissue savings bonds Redeem savings bonds submitted directly
by individuals or by nonauthorized paying agents
Account for registration stubs for sales and paid bonds and ship
Issue Treasury checks Conf i rm and reconcile agents' on-hand balance
of unissued stock Process adjustments Duplicate and distribute redemption tables on
magnetic tape Process series H and H H (savings bonds) checks
and A C H interest payments for the Parkersburg office
Provide statistical information on sales
FINANCIAL MANAGEMENT SERVICE
Treasury Foreign Currency Reports and Treasury International Capital Reports Receive reports on foreign currency and on claims
and liabilities of foreigners from banks and nonbanks and review for accurracy
Consolidate reports for all Districts Provide data services, including programming
support for computer time-sharing
OFFICE OF THE ASSISTANT SECRETARY FOR ENFORCEMENT AND OPERATIONS—
FOREIGN ASSET CONTROL
Process applications for licenses to conduct business with certain regulated countries or f rom individuals in those countries to conduct business in the United States and forward to Treasury for review
Advise applicants of acceptance or rejection
BUREAU OF ALCOHOL, TOBACCO, AND FIREARMS
Safekeeping of valuables seized in investigations Safekeeping of securities deposited in lieu
of surety bonds Supply currency for investigation
U . S . CUSTOMS SERVICE
Process federal tax deposits Maintain Treasury tax and loan accounts Hold collateral for public funds Process government checks and deposits Process electronic funds transfers Process recurring federal payments Maintain letter of credit Execute securities purchase and sale
at Treasury's request Provide investment functions for government
and trust fund accounts
Safekeeping of securities Certifying foreign exchange rates pursuant
to the Tar i f f Act of 1930 Transit check processing Safekeeping of confiscated items Check deposits Check collection
Digitized for FRASER http://fraser.stlouisfed.org/ Federal Reserve Bank of St. Louis
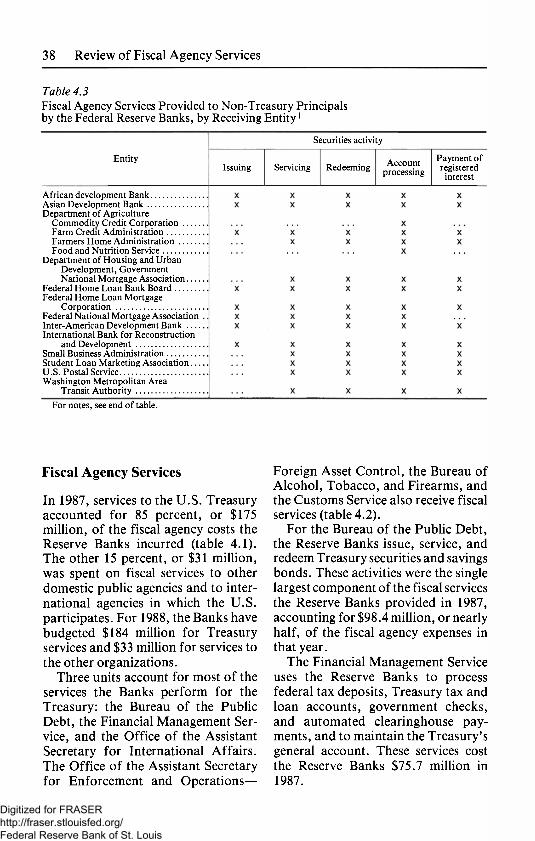
38 Review of Fiscal Agency Services
Table 4.3 Fiscal Agency Services Provided to Non-Treasury Principals by the Federal Reserve Banks, by Receiving Enti ty1
Entity Account processing
Payment of Issuing Servicing Redeeming Account
processing registered interest
Securities activity
African development Bank Asian Development Bank Department of Agriculture
Commodity Credit Corporation Farm Credit Administration Farmers Home Administration Food and Nutrition Service
Department of Housing and Urban Development, Government National Mortgage Association
Federal Home Loan Bank Board Federal Home Loan Mortgage
Corporation Federal National Mortgage Association Inter-American Development Bank International Bank for Reconstruction
and Development Small Business Administration Student Loan Marketing Association.., U.S. Postal Service Washington Metropolitan Area
Transit Authority
For notes, see end of table.
Fiscal Agency Services
In 1987, services to the U.S. Treasury accounted for 85 percent, or $175 million, of the fiscal agency costs the Reserve Banks incurred (table 4.1). The other 15 percent, or $31 million, was spent on fiscal services to other domestic public agencies and to inter-national agencies in which the U.S. participates. For 1988, the Banks have budgeted $184 million for Treasury services and $33 million for services to the other organizations.
Three units account for most of the services the Banks perform for the Treasury: the Bureau of the Public Debt, the Financial Management Ser-vice, and the Office of the Assistant Secretary for International Affairs. The Office of the Assistant Secretary for Enforcement and Operations—
Foreign Asset Control, the Bureau of Alcohol, Tobacco, and Firearms, and the Customs Service also receive fiscal services (table 4.2).
For the Bureau of the Public Debt, the Reserve Banks issue, service, and redeem Treasury securities and savings bonds. These activities were the single largest component of the fiscal services the Reserve Banks provided in 1987, accounting for $98.4 million, or nearly half, of the fiscal agency expenses in that year.
The Financial Management Service uses the Reserve Banks to process federal tax deposits, Treasury tax and loan accounts, government checks, and automated clearinghouse pay-ments, and to maintain the Treasury's general account. These services cost the Reserve Banks $75.7 million in 1987.
Digitized for FRASER http://fraser.stlouisfed.org/ Federal Reserve Bank of St. Louis
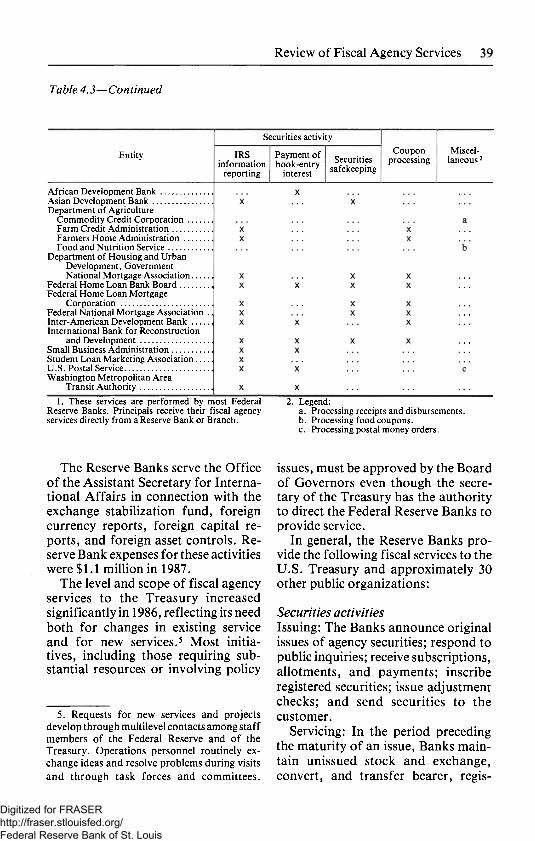
39 Review of Fiscal Agency Services
Table 4.3—Continued
Securities activity
Entity IRS information
reporting
Payment of book-entry
interest Securities
safekeeping
Coupon processing
Miscel-laneous2
African Development Bank Asian Development Bank Department of Agriculture
Commodity Credit Corporation Farm Credit Administration Farmers Home Administration Food and Nutrition Service
Department of Housing and Urban Development, Government National Mortgage Association
Federal Home Loan Bank Board Federal Home Loan Mortgage
Corporation Federal National Mortgage Association . Inter-American Development Bank International Bank for Reconstruction
and Development Small Business Administration Student Loan Marketing Association U.S. Postal Service Washington Metropolitan Area
Transit Authority
1. These services are performed by most Federal Reserve Banks. Principals receive their fiscal agency services directly from a Reserve Bank or Branch.
2. Legend: a. Processing receipts and disbursements. b. Processing food coupons. c. Processing postal money orders.
The Reserve Banks serve the Office of the Assistant Secretary for Interna-tional Affairs in connection with the exchange stabilization fund, foreign currency reports, foreign capital re-ports, and foreign asset controls. Re-serve Bank expenses for these activities were $1.1 million in 1987.
The level and scope of fiscal agency services to the Treasury increased significantly in 1986, reflecting its need both for changes in existing service and for new services.5 Most initia-tives, including those requiring sub-stantial resources or involving policy
5. Requests for new services and projects develop through multilevel contacts among staff members of the Federal Reserve and of the Treasury. Operations personnel routinely ex-change ideas and resolve problems during visits and through task forces and committees.
issues, must be approved by the Board of Governors even though the secre-tary of the Treasury has the authority to direct the Federal Reserve Banks to provide service.
In general, the Reserve Banks pro-vide the following fiscal services to the U.S. Treasury and approximately 30 other public organizations:
Securities activities Issuing: The Banks announce original issues of agency securities; respond to public inquiries; receive subscriptions, allotments, and payments; inscribe registered securities; issue adjustment checks; and send securities to the customer.
Servicing: In the period preceding the maturity of an issue, Banks main-tain unissued stock and exchange, convert, and transfer bearer, regis-
Digitized for FRASER http://fraser.stlouisfed.org/ Federal Reserve Bank of St. Louis

40 Review of Fiscal Agency Services
Table 4.4 Fiscal Agency Services Provided to Nonprincipals by the Federal Reserve Banks, by Receiving Entity and Provider1
Federal Reserve Bank or Branch2
Entity Boston New Phila- Pitts- Rich- Chicago St.
York delphia burgh mond Chicago Louis
Department of Agriculture, Forest Service
Department of Defense Department of Education Department of Health and
Human Services Department of Housing and
Urban Development d Department of Interior
Bureau of Indian Affairs Bureau of Land Management
Department of Justice, Immigration and Naturalization Service
Department of Labor, Workman's Compensation a
Department of Transportation, U.S. Coast Guard
District of Columbia Armory Board d Export-Import Bank d Federal Deposit Insurance Corporation .. e International Finance Corporation United States Courts a,g Urban Mass Transportation
Administration i
e,b
a,c
1. Nonprincipals usually receive their fiscal agency services indirectly from a Reserve Bank or Branch through a depository institution.
2. Legend: a. Securities safekeeping. b. Securities safekeeping for instructions in re-
ceivership; charges billed directly to institu-tions.
c. Processing accounts, including receipt and processing of various forms of payment.
d. Redeeming maturing securities and coupons. e. Processing FDIC receivership drafts. f. Buying and selling securities. g. Maintaining book-entry accounts. h. Cashing large government checks for payrolls. i. Maintaining accounts. j . Redeeming maturing securities.
tered, interim, and book-entry forms of the issue.
Redeeming: The Banks verify the securities presented for redemption in bearer, registered, and book-entry form; calculate and pay the interest; and ship the redeemed definitive secu-rities to the appropriate agency. For some agencies, this service also in-cludes processing semiannual pay-ments of interest on book-entry securi-ties and payment of interest on registered securities.
Processing accounts: The Banks make entries, analyze the accounts, and prepare statements, reports, and transcripts.
Reporting IRS information: The
Banks report to the Internal Revenue Service on form 1099 all interest paid, in conformance with the Tax Equity and Fiscal Responsibility Act of 1982 and the Interest and Dividend Tax Compliance Act of 1983.
Safekeeping: The Banks maintain and update balances for safekeeping accounts of definitive and book-entry securities; prepare and distribute peri-odic statements; make switches, with-drawals, and deliveries; detach matur-ing coupons and withdraw maturing securities for presentment to owners or paying agents; and effect secondary market transfers of book-entry securi-ties . This service also includes handling purchase and sale orders in the second-
Digitized for FRASER http://fraser.stlouisfed.org/ Federal Reserve Bank of St. Louis
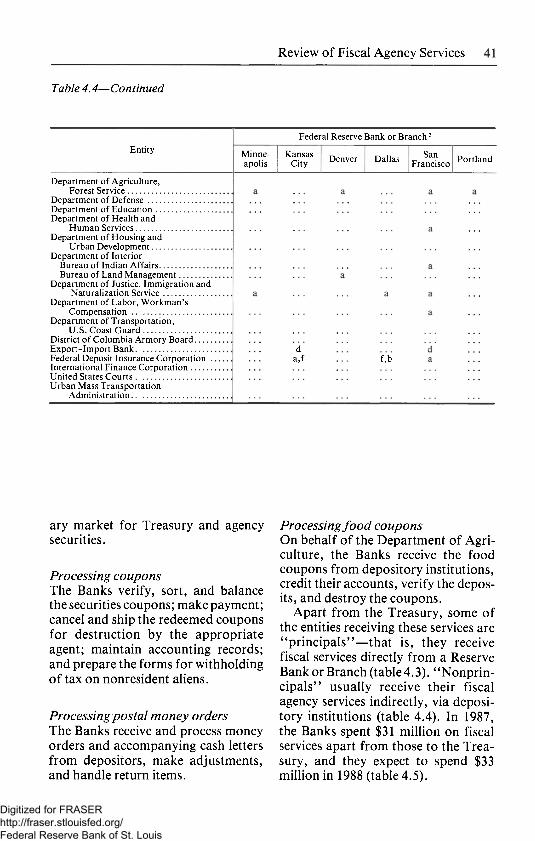
41 Review of Fiscal Agency Services
Table 4.4—Continued
Entity Federal Reserve Bank or Branch2
Minne-apolis
Kansas City Denver 1 Dallas San
Francisco Portland
Department of Agriculture, Forest Service
Department of Defense Department of Education Department of Health and
Human Services Department of Housing and
Urban Development Department of Interior
Bureau of Indian Affairs Bureau of Land Management
Department of Justice, Immigration and Naturalization Service
Department of Labor, Workman's Compensation
Department of Transportation, U.S. Coast Guard
District of Columbia Armory Board Export-Import Bank Federal Deposit Insurance Corporation . International Finance Corporation United States Courts Urban Mass Transportation
Administration
d a,f f,b
ary market for Treasury and agency securities.
Processing coupons The Banks verify, sort, and balance the securities coupons; make payment; cancel and ship the redeemed coupons for destruction by the appropriate agent; maintain accounting records; and prepare the forms for withholding of tax on nonresident aliens.
Processing postal money orders The Banks receive and process money orders and accompanying cash letters from depositors, make adjustments, and handle return items.
Processing food coupons On behalf of the Department of Agri-culture, the Banks receive the food coupons from depository institutions, credit their accounts, verify the depos-its, and destroy the coupons.
Apart from the Treasury, some of the entities receiving these services are "principals"—that is, they receive fiscal services directly from a Reserve Bank or Branch (table 4.3). "Nonprin-cipals" usually receive their fiscal agency services indirectly, via deposi-tory institutions (table 4.4). In 1987, the Banks spent $31 million on fiscal services apart from those to the Trea-sury, and they expect to spend $33 million in 1988 (table 4.5).
Digitized for FRASER http://fraser.stlouisfed.org/ Federal Reserve Bank of St. Louis
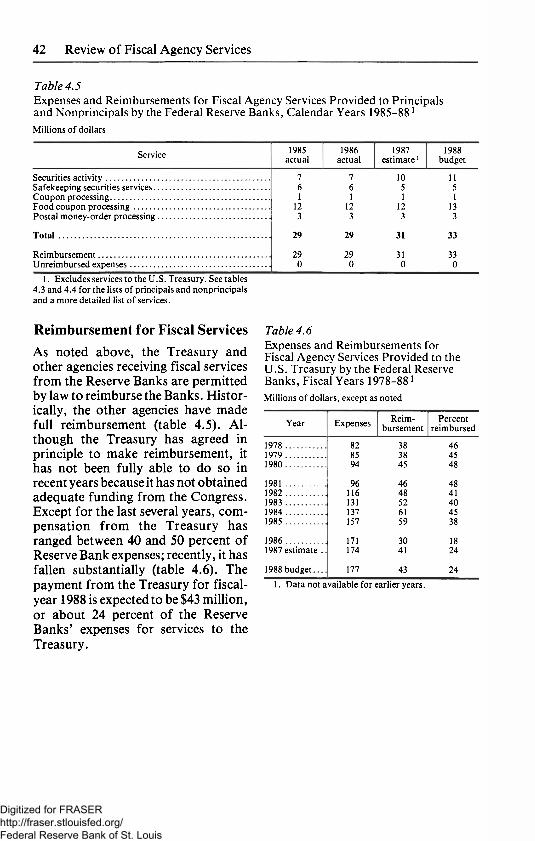
42 Review of Fiscal Agency Services
Table 4.5 Expenses and Reimbursements for Fiscal Agency Services Provided to Principals and Nonprincipals by the Federal Reserve Banks, Calendar Years 1985-881
Millions of dollars
Service 1985 actual
1986 actual
1987 estimate1
1988 budget
Securities activity 7 7 10 11 Safekeeping securities services 6 6 5 5 Coupon processing 1 1 1 1 Food coupon processing 12 12 12 13 Postal money-order processing 3 3 3 3
Total 29 29 31 33
Reimbursement 29 29 31 33 Unreimbursed expenses 0 0 0 0
1. Excludes services to the U.S. Treasury. See tables 4.3 and 4.4 for the lists of principals and nonprincipals and a more detailed list of services.
Reimbursement for Fiscal Services
As noted above, the Treasury and other agencies receiving fiscal services from the Reserve Banks are permitted by law to reimburse the Banks. Histor-ically, the other agencies have made ful l reimbursement (table 4.5). Al-though the Treasury has agreed in principle to make reimbursement, it has not been fully able to do so in recent years because it has not obtained adequate funding from the Congress. Except for the last several years, com-pensation from the Treasury has ranged between 40 and 50 percent of Reserve Bank expenses; recently, it has fallen substantially (table 4.6). The payment from the Treasury for fiscal-year 1988 is expected to be $43 million, or about 24 percent of the Reserve Banks' expenses for services to the Treasury.
Table 4.6 Expenses and Reimbursements for Fiscal Agency Services Provided to the U.S. Treasury by the Federal Reserve Banks, Fiscal Years 1978-881
Millions of dollars, except as noted
Year Expenses Reim-bursement
Percent reimbursed
1978 82 38 46 1979 85 38 45 1980 94 45 48
1981 96 46 48 1982 116 48 41 1983 131 52 40 1984 137 61 45 1985 157 59 38
1986 171 30 18 1987 estimate .. 174 41 24
1988 budget.... 177 43 24
1. Data not available for earlier years.
Digitized for FRASER http://fraser.stlouisfed.org/ Federal Reserve Bank of St. Louis
Appendixes
Digitized for FRASER http://fraser.stlouisfed.org/ Federal Reserve Bank of St. Louis
45
Appendix A
Mission and Operational Areas of the Federal Reserve System
In their budgets the Federal Reserve Banks and the Board of Governors divide their activities into four major operational areas: monetary and eco-nomic policy, supervision and regula-tion of financial institutions, services to financial institutions and the public, and services to the U.S. Treasury and other government agencies.1 This ap-pendix describes each of these areas in detail.
Monetary and Economic Policy The Federal Reserve contributes to the attainment of the nation's economic and financial goals through its ability to influence money and credit in the economy. The System has several tools to affect the availability and cost of the nation's money and credit: setting of reserve requirements; setting of the discount rate; and the primary tool of monetary policy, open market opera-tions.
The seven-member Board of Gover-nors sets reserve requirements, and it acts on requests from the Federal Reserve Banks to adjust the discount rate. The Federal Open Market Com-mittee (FOMC) meets in Washington eight times per year, usually twice each business quarter, to set policies for
1. Services to the U.S. Treasury and other government agencies is an operational area unique to the Federal Reserve Banks. The fourth operational area for the Board of Governors, System policy direction and oversight, provides resources for the supervision of Board and System programs and is discussed in chap. 2.
System open market operations; it comprises the Board, the President of the Federal Reserve Bank of New York, and, on a rotating basis, the presidents of four other Reserve Banks.
A vast amount of banking and financial data flows through the Re-serve Banks to the Board, where it is compiled and made available to the public in weekly and monthly statisti-cal releases on the monetary aggre-gates, interest rates, bank credit, ex-change rates, and so on. The research staffs at the Board and the Reserve Banks use this information, along with data collected by other public and private institutions, to assess the state of the economy and the relationships between the financial markets and economic activity. Staff members pro-vide background for the Board and each meeting of the FOMC by prepar-ing detailed economic and financial analyses and projections for the domes-tic economy and international mar-kets. In addition, they conduct longer-run economic studies of issues at the regional, national, and international levels.
Supervision and Regulation Under the authority of the Federal Reserve Act and the Bank Holding Company Act of 1956 as amended, the Federal Reserve System plays a major role in the supervision and regulation of banks and bank holding companies.
The System conducts its oversight responsibilities through on-site exami-nations and inspections of state mem-
Digitized for FRASER http://fraser.stlouisfed.org/ Federal Reserve Bank of St. Louis
46 Mission and Operational Areas
ber banks and bank holding com-panies; off-site surveillance and monitoring of financial institutions; review of applications for mergers, acquisitions, and changes in control; formal supervisory actions; and adop-tion and enforcement of regulations to carry out statutory directives. Under the Bank Holding Company Act, the Board is also responsible for assuring that all activities of bank holding com-panies are "closely related to banking and a proper incident thereto."
Beyond these activities, the Federal Reserve maintains continuous over-sight of the banking industry to ensure the overall safety and soundness of the financial system. This broader respon-sibility is reflected in the System's presence in financial markets, through open market operations, and in the Federal Reserve's role as lender of last resort. The Monetary Control Act of 1980 expanded that role by extending the privilege of borrowing from the Federal Reserve to all depository insti-tutions whose liabilities are subject to reserve requirements.2
The Board of Governors establishes System supervisory and regulatory policies; the Reserve Banks conduct on-site examinations and inspections, review various types of applications from banks and bank holding compa-nies, and implement other supervisory programs. The System makes available to the public nonidentifying informa-tion it periodically collects on the condition and income of banks and bank holding companies.
Over the past two years, the System has intensified its supervision of state member banks and bank holding com-
2. Depository institutions are commercial banks, savings banks, savings and loan associa-tions, and credit unions.
panies in light of the rising number of failing and problem banks. In 1987, the Board and the Banks conducted 835 examinations of state member banks, an increase of 3.6 percent over 1986, and 2,633 inspections of bank holding companies and their subsidiar-ies, an increase of 12.5 percent over 1986. The System also reviewed 2,404 applications from foreign and domes-tic bank holding companies, an in-crease of 4.3 percent over 1986.
The Board enforces compliance by state member banks with the federal laws protecting consumers in their use of credit. In 1987, the System con-ducted examinations for such compli-ance at about 625 banks.
The Board's supervisory responsibil-ities also extend to foreign operations of U.S. banks and, under the Interna-tional Banking Act, to U.S. operations of foreign banks.
Services to Financial Institutions and the Public The Federal Reserve System plays a central role in the nation's payments mechanism, which consists of many independent systems designed to move funds among financial institutions across the country. The Federal Re-serve distributes currency and coin, processes checks for collection, oper-ates electronic funds transfer net-works, and provides for transfers of securities and for coupon collection.
Ensuring that the supply of currency and coin meets the public's demand for cash is the responsibility of the Federal Reserve. The Reserve Banks obtain currency and coin from the Bureau of Engraving and Printing and the Mint and distribute it to the public through depository institutions. The Banks use highly sophisticated equip-ment to count cash, identify counter-
Digitized for FRASER http://fraser.stlouisfed.org/ Federal Reserve Bank of St. Louis

47 Mission and Operational Areas
feits, and destroy currency that is unfit for circulation. In 1987, the Reserve Banks paid out $233.8 billion in cur-rency and $4.2 billion in coin and destroyed $44.9 billion of unfit cur-rency, an increase of roughly 90 per-cent over 1980 in all three activities.
The Reserve Banks collect and clear checks under the specific authority of the Federal Reserve Act of 1913. The Banks, Branches, and regional check-processing centers currently clear ap-proximately 15 billion checks each year with an average daily value of more than $40 billion. Most checks depos-ited with the Federal Reserve are col-lected on the day they are deposited or on the next business day.
The Federal Reserve also plays a central role in the nation's payments mechanism through its electronic wire transfer system, Fedwire. Depository institutions can draw on their reserves or clearing accounts at the Reserve Banks through Fedwire and transfer funds anywhere in the country within minutes. Approximately 5,800 deposi-tory institutions use Fedwire through direct computer connections with Fed-eral Reserve Banks, and another 5,400 institutions use Fedwire through off-line means such as telephone and telex. During 1987, approximately 53 million transfers valued at about $152 tri l l ion were sent over Fedwire, an average of $2.9 million per transfer and $605 billion per day.
The Federal Reserve allows partici-pants in private clearing arrangements to exchange and settle transactions on a net basis through reserve or clearing-account balances. Users of this net settlement service include local check clearinghouse associations, credit card processors, automated teller machine networks, and national and regional funds transfer networks. In 1987, about 621,000 net settlement entries
were processed by the Reserve Banks. Approximately 22,000 depository
institutions use the automated clearing-house, which makes recurring pay-ments electronically instead of by check. The institutions use the ACH primarily to pay salaries and pensions and to make preauthorized bill pay-ments, such as those for insurance premiums and mortgages. About 3,700 of the institutions using the A C H originate and receive transactions via electronic connections with the Federal Reserve; the others use machine-readable magnetic tapes. In 1987, the Reserve Banks processed about 1.1 billion ACH transactions; about 40 percent were governmental, largely disbursements of social security bene-fits and civilian and military pay.
The securities services provided by the Reserve Banks cover the handling of book-entry securities and definitive securities and the collection of coupons and miscellaneous items. The book-entry service, begun in 1968, enables holders of government agency securi-ties to transfer them to other institu-tions throughout the country. The Re-serve Banks maintained about 37,000 book-entry accounts in 1987 and pro-cessed 9.4 million security transfers.
In the definitive securities service, the Banks store physical securities ineligible for maintenance on the book-entry system. The Federal Reserve held approximately $27 bil l ion of such securities at the end of 1987.
In its noncash collection service, the Federal Reserve processes coupons, bonds, and miscellaneous items such as bankers acceptances and certain checks and drafts. Coupon collection, which accounts for approximately 95 percent of the transactions in this service, amounted to about 4.2 million coupons in 1986 and about 3.7 million in 1987.
Digitized for FRASER http://fraser.stlouisfed.org/ Federal Reserve Bank of St. Louis

48 Mission and Operational Areas
Services to the U.S. Treasury and Other Government Agencies As required by the Federal Reserve Act, the U.S. government uses the Federal Reserve as its bank. Through deposit accounts at the Federal Reserve Banks, the government issues its checks and payments and collects its receipts. The Reserve Banks also process wire transfers of funds and automated clearinghouse payments and give the Treasury daily statements of account activity.
Beyond these typical depository ac-tivities, the Federal Reserve Banks provide several unique services to the government. They monitor the tax
receipts deposited in the 15,600 tax and loan accounts maintained by de-pository institutions designated by the Treasury to perform this function; and they hold the collateral that those institutions pledge to support those deposits and transfer funds to the Treasury's account at its request. The Reserve Banks assist the Treasury in its financing of the public debt by issuing, servicing, and redeeming all market-able Treasury securities as well as all Treasury savings bonds and retirement plan bonds. In another unique fiscal service, the Reserve Banks redeem food coupons for the Department of Agriculture and destroy them.
Digitized for FRASER http://fraser.stlouisfed.org/ Federal Reserve Bank of St. Louis

49
Appendix B
Budget Processes
This appendix describes the budget processes of the Board of Governors and the Reserve Banks and explains PACS, the planning and control sys-tem that the Banks use for accounting.
The Budget and Control Process of the Board of Governors All levels of management at the Board take part in a planning, budget, and control process based on the calendar year. To ensure that all elements are coordinated and objectives are achieved, the Administrative Gover-nor oversees the process under author-ity delegated by the Chairman.
The Board places expenses and em-ployment in four operational areas: economic and monetary policy, super-vision and regulation of financial insti-tutions, services to financial institu-tions and the public, and System policy direction and oversight. Costs for data processing are charged as direct ex-penses to the four major areas accord-ing to usage. Expenses for other ele-ments of support and overhead are allocated to the four areas in propor-tion to the shares of direct costs attrib-utable to each area.
The Budget Schedule
Early each year, the Board's functional oversight committees discuss with the divisions under their purview plans for the following year and beyond. The Board's Controller and Staff Director for Management coordinate the over-sight meetings and the Controller simul-taneously prepares a budget estimate based on the current level of operation,
taking into account anticipated initia-tives discussed at the meetings and other factors such as a general pay increase, changes in costs of employee benefits, and inflation.
Using this projection of expenses, the Controller prepares a proposed guideline for approval of the Board in June. The approved guideline is then used by the divisions for preparation of their budget proposals in the fall.
The objectives and budgets prepared by the divisions are reviewed with the Controller, the Staff Director for Man-agement, and the oversight commit-tees. After appropriate adjustments, the Controller in coordination with the Staff Director for Management pre-pares a consolidated budget for the Administrative Governor to present to the Board for final approval at an open meeting in December.
Treatment of Capital Expenditures In 1985, the Board began capitalizing certain assets and depreciating their value over appropriate time periods instead of expensing them in their year of purchase. Capitalizing, which is in accordance with generally accepted accounting principles, more closely aligns the cost of capital assets with their periods of service and is consis-tent with the accounting practices followed by the Reserve Banks.
The capital budget is developed concurrently with the operating bud-get, following the same procedures. Although the capital budget is not covered by the guideline for the oper-ating budget, depreciation costs asso-
Digitized for FRASER http://fraser.stlouisfed.org/ Federal Reserve Bank of St. Louis
50 Budget Processes
ciated with capital assets fall under the guideline because they are an operating cost.
Financial Monitoring and Control
Each division constructs quarterly operating plans, which managers mon-itor and review throughout the year. The Controller observes performance against budgeted targets and submits quarterly reports to the Board.
After a midyear review of current expenses with each division director, the Controller and the Staff Director for Management estimate expenses for the entire year and submit the estimate to the Board along with any recommen-dations for reallocations. The midyear review helps control current expenses and provides a baseline for analyzing budget requests. At the beginning of the next year, the Controller and the Staff Director for Management report to the Board on the previous year's performance against budget and oper-ating goals.
Assessments
The cash requirement for operations during the first half of the year, which is estimated after the Board adopts its budget, is approved by the Administra-tive Governor in early January. As the Federal Reserve Act provides, the required amount is raised by an assess-ment on each of the Reserve Banks in proportion to its capital stock and surplus. For the second half of the year, the cash requirement is estimated in June, and the second assessment is made in July. Funds are transferred quarterly to minimize cash balances held by the Board.
The Budget and Control Process of the Federal Reserve Banks The Federal Reserve Banks, like the Board, use a calendar-year process to set major goals and strategies, estimate resources needed to achieve the goals, and monitor operating results and financial performance.
The Planning and Control System The Planning and Control System is an accounting and budgeting system that affords a review of expenses, an expense audit trail, and expense ac-countability. Implemented by the Fed-eral Reserve Banks in 1977, the PACS enables the Board of Governors to compare the financial and operating performance of the Reserve Banks.
Al l costs are grouped by major services, which are shown here under the four operational areas previously described and under support and over-head (see the accompanying list). The costs of support and overhead, in turn, are fully allocated to the four opera-tional areas. The PACS offers a de-tailed analysis of all these services and activities, including productivity statis-tics (primarily unit costs and items per employee hour), "environmental" sta-tistics (to clarify the differences among the Bank's operating environments), and "quality" statistics (to measure performance.) In short, the PACS serves as the fundamental cost account-ing system for all the services provided by the Federal Reserve Banks, whether priced or nonpriced, special or routine.
Through periodic on-site reviews, the Board confirms that the Reserve Banks are complying with PACS in-structions and also with System guide-lines set by the Board. In addition, the General Accounting Office and an outside public accounting firm have
Digitized for FRASER http://fraser.stlouisfed.org/ Federal Reserve Bank of St. Louis
51 Budget Processes
determined in independent examina-tions that the PACS is an appropriate and effective accounting mechanism for the Federal Reserve.
The Budget Process
One year before the start of each budget year, staff members at the Board and at the Banks develop guide-lines based on forecasts of changes in workload and productivity at the Banks. These guidelines, which are separate from those for the Board's divisions, are presented for Board action in the spring. The annual budget objective, which follows these guide-lines, is used by the Reserve Banks in developing plans and budgets. To plan for priced services, the Banks also update each year a strategic statement for the next three years. In the spring, the Banks develop their own goals, objectives, and strategies and begin their budget process.
The management of each Bank de-partment uses a zero-base budget pro-cedure whenever possible, especially for travel and training. Senior Bank officials review departmental requests. The President and First Vice President decide which requests to recommend to the Bank's Board of Directors, which acts on the budget. In the fall the Board of Governors acts on fee sched-ules for priced services and on the Reserve Bank budgets.
buildings, automation equipment, fur-nishings, or land—receive a thorough review separate from the planning, budgeting, and control process. The Board of Governors must specifically approve acquisitions of mainframe computers and peripheral equipment costing more than a specified amount.
A l l proposals for capital acquisi-tions are reviewed by technical staff at the Board, who make recommenda-tions to the Director of the Division of Federal Reserve Bank Operations or to the Board of Governors, depending on the level of approval required.
Review at the Board o f Governors
In the fall, Reserve Banks forward their budgets to the Board, where analysts review them and note System-wide issues to be addressed during the budget review. They analyze the exec-utive summary and the statement of objectives in each budget in light of the Bank's own trends, plans at the other Banks, the System budget objective, and the cost-recovery objectives for priced services. The Product Directors and the Pricing Policy Committee also examine the Reserve Bank budgets for priced services.1 The Board's Commit-tee on Federal Reserve Bank Activities evaluates the entire budget of each Reserve Bank in connection with its fall meetings with each Reserve Bank President and First Vice President.
The Capital Budget Process
The Banks manage their capital expen-ditures through the planning, budget-ing, and control process. In accor-dance w i th generally accepted accounting principles, the Banks in-clude depreciation of capital assets in their expenses. A l l plans for large capital expenditures—whether for
1. The Product Directors are the First Vice Presidents at selected Reserve Banks with respon-sibility for day-to-day policy guidance over specific Systemwide priced services. The Pricing Policy Committee comprises one Governor, the Board's Staff Director for Federal Reserve Bank Activities, the Presidents of two Reserve Banks, and the First Vice Presidents of two other Reserve Banks.
Digitized for FRASER http://fraser.stlouisfed.org/ Federal Reserve Bank of St. Louis

52 Budget Processes
Board Approva l
Following review by the Committee on Federal Reserve Bank Activities, all Bank budgets are sent to the Board of Governors for action at an open meet-ing in December.
Federal Reserve Bank Services
OPERATIONAL AREAS
Monetary and economic policy Economic policy determination Open market trading
Supervision and regulation Supervision of District financial institutions Administration of laws and regulations
related to banking Studies of banking and financial market structure
Services to financial institutions and the public Special cash service Currency Coin Transfer of account balances Automated clearinghouse Commercial check Other check Book-entry securities Definitive securities Loans to depository institutions and others Noncash collection Public programs Other
Services to the U.S. Treasury and other government agencies
Savings bonds Other Treasury issues Centrally provided Treasury and agency services Government agency issues Other Treasury and government agency services Treasury and government coupons Food coupons Government accounts
SUPPORT AND OVERHEAD
Support Data processing Centrally provided support Occupancy service Printing and supplies Centralized planning District projects
Overhead Administration System projects and contingency processing center Special projects Mail Legal General books and budget and expense control Files and records storage Personnel Purchasing Protection Motor vehicles Library Telephone Audit
Digitized for FRASER http://fraser.stlouisfed.org/ Federal Reserve Bank of St. Louis

53
Appendix C
Special Categories of System Expense
This appendix discusses System ex-penses for priced services, capital as-sets, and currency.
Priced Services Under the Monetary Control Act of 1980, the Federal Reserve charges depository institutions for their use of certain Federal Reserve services at a price intended to recover the full costs of providing the services. Before 1980, the services the act covers had been offered without explicit charge and only to member banks.
As the act requires, the cost of providing these services includes all direct and indirect costs, the interest on items credited before actual collec-tion (float), and the private sector adjustment factor (PSAF). The PSAF is the return on capital that would have been provided and the taxes that would have been paid had the services been furnished by a firm in the private sector. The market discipline imposed by including these imputed costs in the charges for Federal Reserve services ensures that expenses for priced ser-vices are no higher than necessary.
Most of the recoverable costs of priced services consist of the direct and indirect costs determined by the budget process for the Reserve Banks; hence, the Bank budgets are an integral part of the pricing exercise and have a maj or influence on the fee structure. To assist depository institutions in their plan-ning to provide or use correspondent banking services, the Federal Reserve usually sets each year's prices only once, in the fourth quarter of the preceding year.
Fees for Federal Reserve services must be approved by the Product Director for each service, by the Sys-tem Pricing Policy Committee, and ultimately by the Board of Governors.1
The Board announces the rationale for the price of any service that recovers less than the full level of anticipated costs.2
The cost of float is estimated by applying the current federal funds rate to the level of float expected to be generated in the coming year. To estimate income taxes and the return on capital, tax and financing rates are derived from a model of the 25 largest U.S. bank holding companies; these rates are applied to the assets the Federal Reserve expects to use in oper-ating priced services in the coming year. Imputed sales taxes are based on outlays for materials, supplies, and capital assets budgeted by the Reserve Banks.
The two other components of the PSAF are also derived from Reserve Bank budgets: the expenses of the Board of Governors associated with the provision of priced services and the expected assessment for FDIC insur-ance on clearing balances maintained with the Federal Reserve to settle transactions.
1. See appendix B, note 1, for a description of the position of Product Director and of the System Pricing Policy Committee.
2. An example is the pricing program an-nounced to encourage use of the automated clearinghouse service, under which prices were established to recover an increasing percentage of full costs each year, reaching 100 percent in 1986.
Digitized for FRASER http://fraser.stlouisfed.org/ Federal Reserve Bank of St. Louis
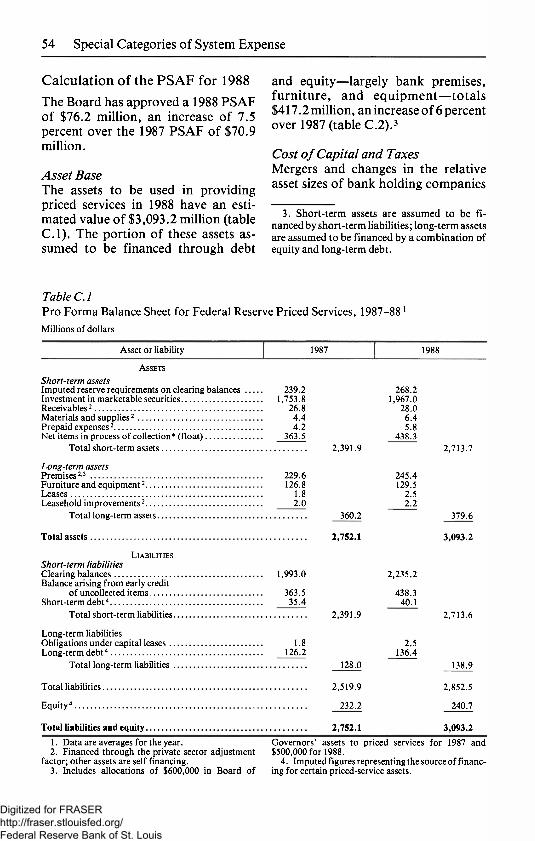
54 Special Categories of System Expense
Calculat ion o f the PSAF for 1988
The Board has approved a 1988 PSAF of $76.2 million, an increase of 7.5 percent over the 1987 PSAF of $70.9 million.
Asset Base The assets to be used in providing priced services in 1988 have an esti-mated value of $3,093.2 million (table C. l ) . The portion of these assets as-sumed to be financed through debt
and equity—largely bank premises, furniture, and equipment—totals $417.2 million, an increase of 6 percent over 1987 (table C.2).3
Cost of Capital and Taxes Mergers and changes in the relative asset sizes of bank holding companies
3. Short-term assets are assumed to be fi-nanced by short-term liabilities; long-term assets are assumed to be financed by a combination of equity and long-term debt.
Table C.l Pro Forma Balance Sheet for Federal Reserve Priced Services, 1987-881
Mill ions of dollars
Asset or liability 1987 1988
ASSETS
Short-term assets Imputed reserve requirements on clearing balances Investment in marketable securities Receivables2
Materials and supplies2
Prepaid expenses2
Net items in process of collection* (float) Total short-term assets
239.2 1,753.8
26.8 4.4 4.2
363.5
Long-term assets Premises2,3
Furniture and equipment2
Leases Leasehold improvements2
Total long-term assets.
Total assets
229.6 126.8
1.8 2.0
LIABILITIES Short-term liabilities Clearing balances Balance arising from early credit
of uncollected items Short-term debt4
1,993.0
363.5 35.4
Total short-term liabilities.
Long-term liabilities Obligations under capital leases .. Long-term debt4
Total long-term liabilities .
1.8 126.2
Total liabilities.
Equity4
2,391.9
360.2
2,752.1
2,391.9
128.0
2,519.9
232.2
268.2 1,967.0
28.0 6.4 5.8
438.3
245.4 129.5
2.5 2.2
2,235.2
438.3 40.1
2.5 136.4
2,713.7
379.6
3,093.2
2,713.6
138.9
2,852.5
240.7
Total liabilities and equity. 2,752.1 3,093.2
1. Data are averages for the year. 2. Financed through the private sector adjustment
factor; other assets are self financing. 3. Includes allocations of $600,000 in Board of
Governors' assets to priced services for 1987 and $500,000 for 1988.
4. Imputed figures representing the source of financ-ing for certain priced-service assets.
Digitized for FRASER http://fraser.stlouisfed.org/ Federal Reserve Bank of St. Louis
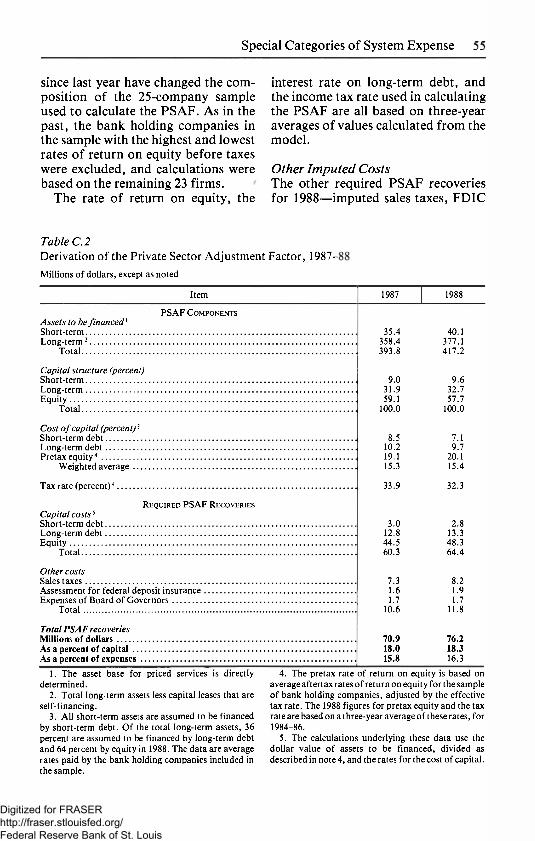
55 Special Categories of System Expense
since last year have changed the com-position of the 25-company sample used to calculate the PSAF. As in the past, the bank holding companies in the sample with the highest and lowest rates of return on equity before taxes were excluded, and calculations were based on the remaining 23 firms.
The rate of return on equity, the
interest rate on long-term debt, and the income tax rate used in calculating the PSAF are all based on three-year averages of values calculated from the model.
Other Imputed Costs The other required PSAF recoveries for 1988—imputed sales taxes, FDIC
Table C.2 Derivation of the Private Sector Adjustment Factor, 1987-Mill ions of dollars, except as noted
Item 1987 1988
Assets to be financed1
Short-term Long-term2
Total
P S A F COMPONENTS
Capital structure (percent) Short-term Long-term Equity
Total
Cost of capital (percent)3
Short-term debt Long-term debt Pretax equity4
Weighted average ..
Tax rate (percent)4
Capital costs5
Short-term debt. Long-term debt. Equity
Total
REQUIRED P S A F RECOVERIES
Other costs Sales taxes Assessment for federal deposit insurance Expenses of Board of Governors
Total
Total PSAF recoveries Millions of dollars As a percent of capital .. As a percent of expenses
35.4 358.4 393.8
9.0 31.9 59.1
100.0
8.5 10.2 19.1 15.3
33.9
3.0 12.8 44.5 60.3
7.3 1.6 1.7
10.6
70.9 18.0 15.8
40.1 377.1 417.2
9.6 32.7 57.7
100.0
7.1 9.7
20.1 15.4
32.3
2.8 13.3 48.3 64.4
8.2 1.9 1.7
11.8
76.2 18.3 16.3
1. The asset base for priced services is directly determined.
2. Total long-term assets less capital leases that are self-financing.
3. A l l short-term assets are assumed to be financed by short-term debt. Of the total long-term assets, 36 percent are assumed to be financed by long-term debt and 64 percent by equity in 1988. The data are average rates paid by the bank holding companies included in the sample.
4. The pretax rate of return on equity is based on average aftertax rates of return on equity for the sample of bank holding companies, adjusted by the effective tax rate. The 1988 figures for pretax equity and the tax rate are based on a three-year average of these rates, for 1984-86.
5. The calculations underlying these data use the dollar value of assets to be financed, divided as described in note 4, and the rates for the cost of capital.
Digitized for FRASER http://fraser.stlouisfed.org/ Federal Reserve Bank of St. Louis
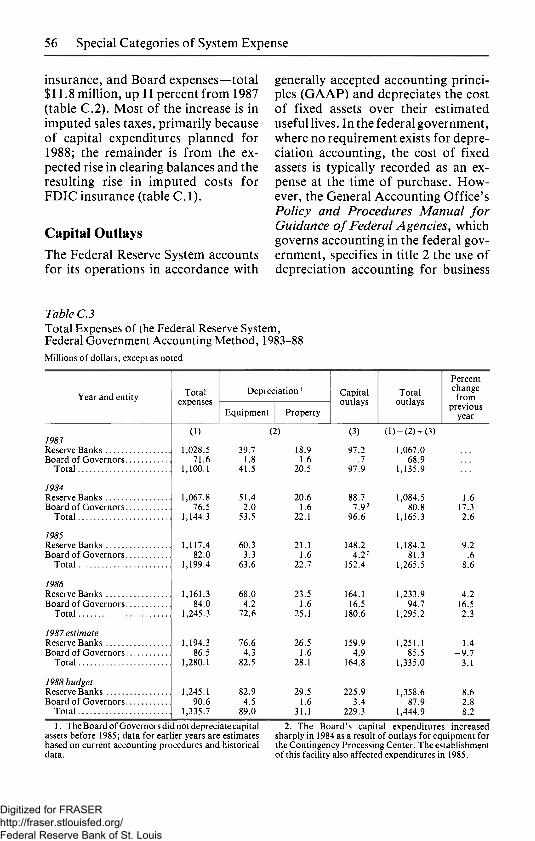
56 Special Categories of System Expense
insurance, and Board expenses—total $11.8 million, up 11 percent from 1987 (table C.2). Most of the increase is in imputed sales taxes, primarily because of capital expenditures planned for 1988; the remainder is from the ex-pected rise in clearing balances and the resulting rise in imputed costs for FDIC insurance (table C. 1).
Capital Outlays
The Federal Reserve System accounts for its operations in accordance with
generally accepted accounting princi-ples (GAAP) and depreciates the cost of fixed assets over their estimated useful lives. In the federal government, where no requirement exists for depre-ciation accounting, the cost of fixed assets is typically recorded as an ex-pense at the time of purchase. How-ever, the General Accounting Office's Policy and Procedures Manual for Guidance of Federal Agencies, which governs accounting in the federal gov-ernment, specifies in title 2 the use of depreciation accounting for business
Table C.3 Total Expenses of the Federal Reserve System, Federal Government Accounting Method, 1983-88 Mill ions of dollars, except as noted
Year and entity Total expenses
Depreciation 1 Capital outlays
Total outlays
Percent change from
previous year
Year and entity Total expenses
Equipment Property
Capital outlays
Total outlays
Percent change from
previous year
(1) (2) (3) ( l ) - ( 2 ) + (3) 1983 Reserve Banks 1,028.5 39.7 18.9 97.2 1,067.0 Board of Governors 71.6 1.8 1.6 .7 68.9
Total 1,100.1 41.5 20.5 97.9 1,135.9
1984 Reserve Banks 1,067.8 51.4 20.6 88.7 1,084.5 1.6 Board of Governors 76.5 2.0 1.6 7.92 80.8 17.3
Total 1,144.3 53.5 22.1 96.6 1,165.3 2.6
1985 Reserve Banks 1,117.4 60.3 21.1 148.2 1,184.2 9.2 Board of Governors 82.0 3.3 1.6 4.22 81.3 .6
Total 1,199.4 63.6 22.7 152.4 1,265.5 8.6
1986 Reserve Banks 1,161.3 68.0 23.5 164.1 1,233.9 4.2 Board of Governors 84.0 4.2 1.6 16.5 94.7 16.5
Total 1,245.3 72.6 25.1 180.6 1,295.2 2.3
1987 estimate Reserve Banks 1,194.3 76.6 26.5 159.9 1,251.1 1.4 Board of Governors 86.5 4.3 1.6 4.9 85.5 - 9 . 7
Total 1,280.1 82.5 28.1 164.8 1,335.0 3.1
1988 budget Reserve Banks 1,245.1 82.9 29.5 225.9 1,358.6 8.6 Board of Governors 90.6 4.5 1.6 3.4 87.9 2.8
Total 1,335.7 89.0 31.1 229.3 1,444.9 8.2
1. The Board of Governors did not depreciate capital 2. The Board's capital expenditures increased assets before 1985; data for earlier years are estimates sharply in 1984 as a result of outlays for equipment for based on current accounting procedures and historical the Contingency Processing Center. The establishment data. of this facility also affected expenditures in 1985.
Digitized for FRASER http://fraser.stlouisfed.org/ Federal Reserve Bank of St. Louis
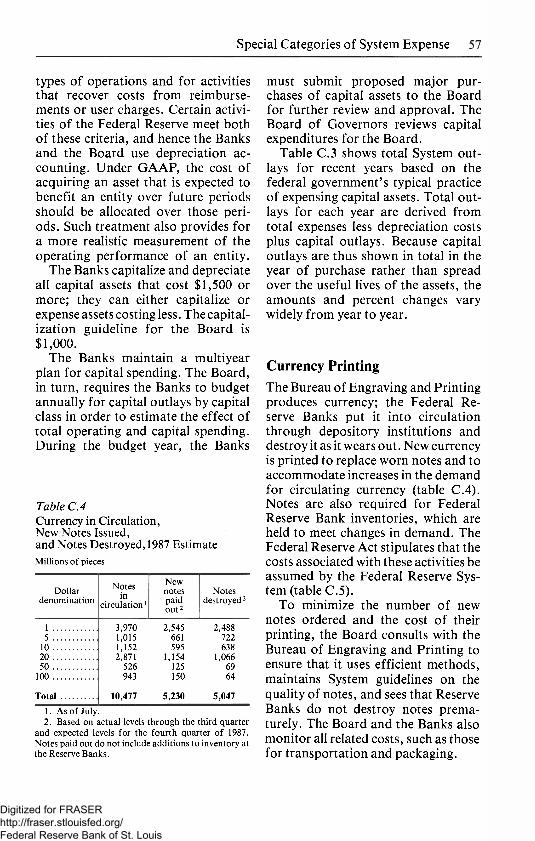
57 Special Categories of System Expense
types of operations and for activities that recover costs from reimburse-ments or user charges. Certain activi-ties of the Federal Reserve meet both of these criteria, and hence the Banks and the Board use depreciation ac-counting. Under GAAP, the cost of acquiring an asset that is expected to benefit an entity over future periods should be allocated over those peri-ods. Such treatment also provides for a more realistic measurement of the operating performance of an entity.
The Banks capitalize and depreciate all capital assets that cost $1,500 or more; they can either capitalize or expense assets costing less. The capital-ization guideline for the Board is $1,000.
The Banks maintain a multiyear plan for capital spending. The Board, in turn, requires the Banks to budget annually for capital outlays by capital class in order to estimate the effect of total operating and capital spending. During the budget year, the Banks
Table C.4 Currency in Circulation, New Notes Issued, and Notes Destroyed, 1987 Estimate Millions of pieces
Dollar denomination
Notes in
circulation1
New notes paid out2
Notes destroyed2
1 3,970 2,545 2,488 5 1,015 661 722
10 1,152 595 638 20 2,871 1,154 1,066 50 526 125 69
100 943 150 64
Total 10,477 5,230 5,047
1. As of July. 2. Based on actual levels through the third quarter
and expected levels for the fourth quarter of 1987. Notes paid out do not include additions to inventory at the Reserve Banks.
must submit proposed major pur-chases of capital assets to the Board for further review and approval. The Board of Governors reviews capital expenditures for the Board.
Table C.3 shows total System out-lays for recent years based on the federal government's typical practice of expensing capital assets. Total out-lays for each year are derived from total expenses less depreciation costs plus capital outlays. Because capital outlays are thus shown in total in the year of purchase rather than spread over the useful lives of the assets, the amounts and percent changes vary widely from year to year.
Currency Printing The Bureau of Engraving and Printing produces currency; the Federal Re-serve Banks put it into circulation through depository institutions and destroy it as it wears out. New currency is printed to replace worn notes and to accommodate increases in the demand for circulating currency (table C.4). Notes are also required for Federal Reserve Bank inventories, which are held to meet changes in demand. The Federal Reserve Act stipulates that the costs associated with these activities be assumed by the Federal Reserve Sys-tem (table C.5).
To minimize the number of new notes ordered and the cost of their printing, the Board consults with the Bureau of Engraving and Printing to ensure that it uses efficient methods, maintains System guidelines on the quality of notes, and sees that Reserve Banks do not destroy notes prema-turely. The Board and the Banks also monitor all related costs, such as those for transportation and packaging.
Digitized for FRASER http://fraser.stlouisfed.org/ Federal Reserve Bank of St. Louis

58 Special Categories of System Expense
Table C. 5 Costs to the Federal Reserve of New Currency, 1986-88 Millions of dollars, except as noted
Item 1986 actual
1987 estimate
1988 budget
Percent change 1987-88
174.8 164.2 156.3 - 4 . 8 4.6 4.9 4.3 -12.2
1.6 1.6 1.6 0 2.2 0 0 0
183.2 170.7 162.2 - 5 . 0
Shipping from Washington2
Reimbursement to the Treasury for issuance and retirement
System-Treasury programs to deter counterfeiting
Total costs of currency
174.8 164.2 156.3 - 4 . 8 4.6 4.9 4.3 -12.2
1.6 1.6 1.6 0 2.2 0 0 0
183.2 170.7 162.2 - 5 . 0
1. Based on 6.5 billion notes in 1986, 6.6 billion 2. Includes purchase of pouches and seals for Bureau notes in 1987, and 6.0 billion notes in 1988. of Engraving and Printing.
Digitized for FRASER http://fraser.stlouisfed.org/ Federal Reserve Bank of St. Louis

59
Appendix D
Sources and Uses of Funds
The Federal Reserve System, in accor-dance with generally accepted account-ing principles, accrues income and expenses and capitalizes acquisitions of assets whose useful lives extend over future years (see appendix C). The System derives its income primarily from U.S. government securities; the Federal Reserve acquires the securities through open market operations, one of the tools of monetary policy. These earnings account for approximately 95 percent of current net income (table D. l ) .
The current expenses of the Reserve Banks consist of their operating ex-penses and the costs of the earnings credits granted to depository institu-tions on clearing balances held with the Reserve Banks (table D.2). The
Table D.l Income of the Federal Reserve System, 1986-87 Millions of dollars
Source 1986 actual
1987 estimate
279.2 224.4 16,141.5 16,371.4
393.6 343.9 627.7 645.2 22.1 48.5
17,464.2 17,633.3
U.S. government securities... Foreign currencies Priced services Other
279.2 224.4 16,141.5 16,371.4
393.6 343.9 627.7 645.2 22.1 48.5
17,464.2 17,633.3 Total
279.2 224.4 16,141.5 16,371.4
393.6 343.9 627.7 645.2 22.1 48.5
17,464.2 17,633.3
279.2 224.4 16,141.5 16,371.4
393.6 343.9 627.7 645.2 22.1 48.5
17,464.2 17,633.3
Reserve Banks record extraordinary gains or deductions from current net income in a profit-and-loss account. The primary entries in the account are for losses on the sale of U.S. govern-ment securities and for gains or losses resulting from the sale or revaluation of assets denominated in foreign cur-rencies.
The Reserve Banks retain a surplus to cushion unexpected losses, much the same as commercial establishments retain earnings. The Board of Gover-nors requires that the surplus account be an amount equal to the paid-in capital of the member banks.
Since the end of 1964, the Board's policy has been to transfer to the Treasury all net income after paying the statutory dividend to member banks and the amount necessary to equate surplus to paid-in capital. The amount transferred is counted as inter-est on Federal Reserve notes. In 1987, current income before expenses, divi-dends, additions to surplus, and pay-ments to the Treasury is an estimated $17.2 billion. Profit-and-loss transac-tions made a net addition of $1.1 billion to current net income. Statutory dividends to member banks in 1987 are an estimated $ 116 million; additions to surplus, $167 million; and payments to the Treasury, $17.7 billion.
Digitized for FRASER http://fraser.stlouisfed.org/ Federal Reserve Bank of St. Louis
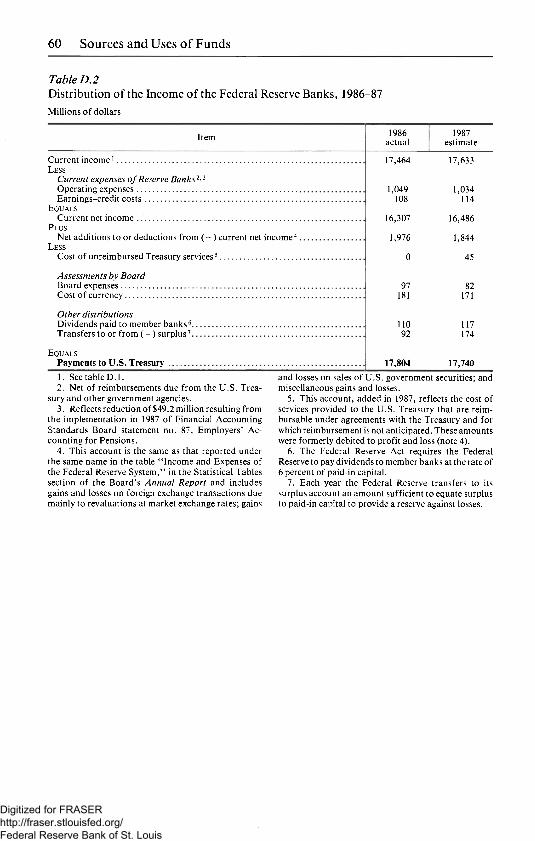
60 Sources and Uses o f Funds
Table D. 2 Distribution of the Income of the Federal Reserve Banks, 1986-87 Mill ions of dollars
Item 1986 actual
1987 estimate
Current income1
LESS Current expenses of Reserve Banks2-3
Operating expenses Earnings-credit costs
EQUALS Current net income
PLUS Net additions to or deductions from ( - ) current net income4
LESS Cost of unreimbursed Treasury services5
Assessments by Board Board expenses Cost of currency
Other distributions Dividends paid to member banks6
Transfers to or f rom ( - ) surplus7
EQUALS Payments to U.S. Treasury
17,464
1,049 108
16,307
1,976
0
97 181
110 92
17,804
17,633
1,034 114
16,486
1,844
45
82 171
117 174
17,740 1. See table D . l . 2. Net of reimbursements due from the U.S. Trea-
sury and other government agencies. 3. Reflects reduction of $49.2 mil l ion resulting from
the implementation in 1987 of Financial Accounting Standards Board statement no. 87, Employers' Ac-counting for Pensions.
4. This account is the same as that reported under the same name in the table "Income and Expenses of the Federal Reserve System," in the Statistical Tables section of the Board's Annual Report and includes gains and losses on foreign exchange transactions due mainly to revaluations at market exchange rates; gains
and losses on sales of U.S. government securities; and miscellaneous gains and losses.
5. This account, added in 1987, reflects the cost of services provided to the U.S. Treasury that are reim-bursable under agreements with the Treasury and for which reimbursement is not anticipated. These amounts were formerly debited to profit and loss (note 4).
6. The Federal Reserve Act requires the Federal Reserve to pay dividends to member banks at the rate of 6 percent of paid-in capital.
7. Each year the Federal Reserve transfers to its surplus account an amount sufficient to equate surplus to paid-in capital to provide a reserve against losses.
Digitized for FRASER http://fraser.stlouisfed.org/ Federal Reserve Bank of St. Louis
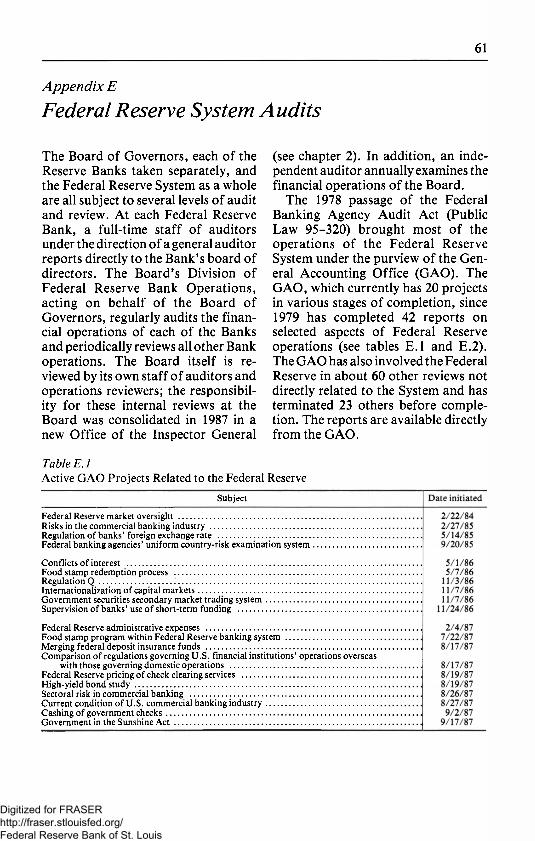
61
Appendix E
Federal Reserve System Audits
The Board of Governors, each of the Reserve Banks taken separately, and the Federal Reserve System as a whole are all subject to several levels of audit and review. A t each Federal Reserve Bank, a full-time staff of auditors under the direction of a general auditor reports directly to the Bank's board of directors. The Board's Division of Federal Reserve Bank Operations, acting on behalf of the Board of Governors, regularly audits the finan-cial operations of each of the Banks and periodically reviews all other Bank operations. The Board itself is re-viewed by its own staff of auditors and operations reviewers; the responsibil-ity for these internal reviews at the Board was consolidated in 1987 in a new Office of the Inspector General
(see chapter 2). In addition, an inde-pendent auditor annually examines the financial operations of the Board.
The 1978 passage of the Federal Banking Agency Audit Act (Public Law 95-320) brought most of the operations of the Federal Reserve System under the purview of the Gen-eral Accounting Office (GAO). The GAO, which currently has 20 projects in various stages of completion, since 1979 has completed 42 reports on selected aspects of Federal Reserve operations (see tables E . l and E.2). The GAO has also involved the Federal Reserve in about 60 other reviews not directly related to the System and has terminated 23 others before comple-tion. The reports are available directly from the GAO.
Table E.l Active GAO Projects Related to the Federal Reserve
Subject
Federal Reserve market oversight Risks in the commercial banking industry Regulation of banks' foreign exchange rate Federal banking agencies' uniform country-risk examination system
Conflicts of interest Food stamp redemption process Regulation Q Internationalization of capital markets Government securities secondary market trading system Supervision of banks' use of short-term funding
Federal Reserve administrative expenses Food stamp program within Federal Reserve banking system Merging federal deposit insurance funds Comparison of regulations governing U.S. financial institutions' operations overseas
with those governing domestic operations Federal Reserve pricing of check clearing services High-yield bond study Sectoral risk in commercial banking Current condition of U.S. commercial banking industry Cashing of government checks Government in the Sunshine Act
Digitized for FRASER http://fraser.stlouisfed.org/ Federal Reserve Bank of St. Louis

62 Federal Reserve System Aud i t s
Table E. 2 Completed GAO Reports Related to the Federal Reserve System
Report
Comparing Policies and Procedures of the Three Bank Regulatory Agencies
Federal Systems Not Designed to Collect Data on Al l Foreign Investments in U.S. Depository Institutions ..
The Federal Reserve Should Assure Compliance with the 1970 Bank Holding Company Act Amendments
Internal Auditing Can Be Strengthened in the Federal Reserve System
Despite Positive Effects, Further Foreign Acquisitions of U.S. Banks Should be Limited until Policy Conflicts are Fully Addressed
Federal Examinations of Financial Institutions: Issues That Need to be Resolved
Examinations of Financial Institutions Do Not Assure Compliance with Consumer Credit Laws
Disappointing Progress in Improving Systems for Resolving Billions in Audit Findings
Federal Reserve Security over Currency Transportation is Adequate
The Federal Structure for Examining Financial Institutions Can be Improved
Response to Questions Bearing on the Feasibility of Closing the Federal Banks
Bank Secrecy Act Reporting Requirements Have Not Yet Met Expectations, Suggesting Need for Amendment
Federal Reserve Could Improve the Efficiency of Bank Holding Company Inspections
Information on Selected Aspects of Federal Reserve System Expenditures
Federal Review of Intrastate Branching Can Be Reduced Despite Improvements , Recent Bank Superv is ion
Could Be More Effective and Less Burdensome Issues to Be Considered while Debating Interstate Bank Branching The Federal Reserve Should Move Faster to Eliminate Subsidy
of Check Clearing Operations Information about Depository Institutions' Ancillary
Activities Is Not Adequate for Policy Purposes Bank Merger Process Should Be Modernized and Simplified
An Analysis of Fiscal and Monetary Policies Bank Examination for Country Risk
and International Lending Credit Insurance Disclosure Provisions
of the Truth-in-Lending Act Consistently Enforced Except When Decisions Appealed
Financial Institutions Regulatory Agencies Can Make Better Use of Consumer Complaint Information
Unauthorized Disclosure of the Federal Reserve's Monetary Policy Decision
Federal Financial Institutions Examination Council Has Made Limited Progress toward Accomplishing Its Mission
Control Improvements Needed in Accounting for Treasury Securities at the Federal Reserve Bank of New York
Statutory Requirements for Examining International Banking Institutions Need Attention
Supervisory Examinations of International Banking Facilities Need to Be Improved
An Examination of Concerns Expressed about the Federal Reserve's Pricing of Check Clearing Activities
Number Date
GGD-79-27
GGD-79-42
GGD-80-21
GGD-80-59
GGD-80-66
GGD-81-12
GGD-81-13
AFMD-81-27
GGD-81-27
GGD-81-21
GGD-81-49
GGD-81-80
GGD-81-79
GGD-82-33 GGD-82-31
GGD-82-21 GGD-82-36
GGD-82-22
GGD-82-57 GGD-82-53
PAD-82-45
ID-82-52
GGD-83-3
GGD-83-13
GGD-84-40
GGD-84-4
AFMD-84-10
GGD-84-39
GGD-84-65
GGD-85-9A
3/29/79
6/19/79
3/12/80
8/8/80
8/26/80
1/6/81
1/21/81
1/23/81
2/23/81
4/24/81
5/21/81
7/23/81
8/18/81
2/12/82 2/24/82
2/26/82 4/9/82
5/7/82
6/1/82 8/16/82
8/31/82
9/2/82
10/25/82
8/25/83
2/3/84
2/3/84
5/2/84
7/11/84
9/30/84
1/14/85
Digitized for FRASER http://fraser.stlouisfed.org/ Federal Reserve Bank of St. Louis

Federal Reserve System Audits 63
Table E.2—Continued
Report Number Date
Information on Independent Public Accountant Audits of Financial Institutions GGD-84-44FS 4/21/86
An Analysis of Two Types of Pooled Investment Funds GGD-86-63 5/12/86 How the Markets Developed and How They Are Regulated GGD-86-26 5/15/86 U.S. Banking Supervision and International
Supervisory Principles NSIAD-86-93 7/25/86 Financial Institution Regulators' Compliance Examination GGD-86-94 8/1/86
The Market's Structure, Risks, and Regulation GGD-86-80BR 8/20/86 Dealer Views on Market Operations and Federal
Reserve Securities Transfer System GGD-86-147FS 9/29/86 Questions About the Federal Reserve's Securities Transfer System GGD-87-15BR 10/20/86 Federal Reserve Board Opposition to Credit Card Interest Rate Limits. GGD-87-38BR 4/7/87 Insulating Banks From the Potential Risk of Expanded Activities GGD-87-35 4/14/87 The Federal Reserve Response Regarding its
Market-Making Standard GGD-87-55FS 4/21/87 Change in Fees and Deposit Account Interest
Rates Since Deregulation GGD-87-70 7/13/87
Digitized for FRASER http://fraser.stlouisfed.org/ Federal Reserve Bank of St. Louis
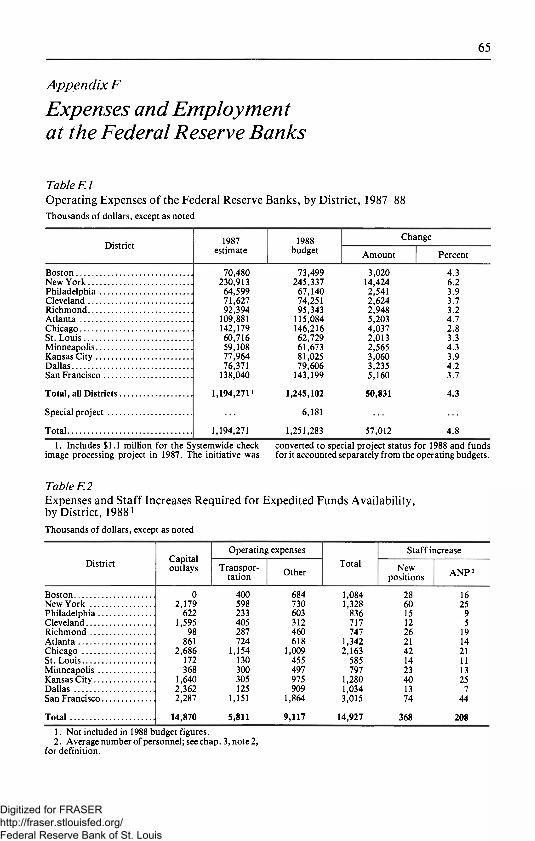
65
Appendix F
Expenses and Employment at the Federal Reserve Banks
Table F.l Operating Expenses of the Federal Reserve Banks, by District, 1987-88 Thousands of dollars, except as noted
District 1987 estimate
1988 budget
Change District 1987
estimate 1988
budget Amount Percent
Boston 70,480 73,499 3,020 4.3 New York 230,913 245,337 14,424 6.2 Philadelphia 64,599 67,140 2,541 3.9 Cleveland 71,627 74,251 2,624 3.7 Richmond 92,394 95,343 2,948 3.2 Atlanta 109,881 115,084 5,203 4.7 Chicago 142,179 146,216 4,037 2.8 St. Louis 60,716 62,729 2,013 3.3 Minneapolis 59,108 61,673 2,565 4.3 Kansas City 77,964 81,025 3,060 3.9 Dallas 76,371 79,606 3,235 4.2 San Francisco 138,040 143,199 5,160 3.7
Total, all Districts 1,194,271' 1,245,102 50,831 4.3
Special project 6,181
Total 1,194,271 1,251,283 57,012 4.8
1. Includes $1.1 million for the Systemwide check converted to special project status for 1988 and funds image processing project in 1987. The initiative was for it accounted separately from the operating budgets.
Table F.2 Expenses and Staff Increases Required for Expedited Funds Availabil i ty, by District, 19881
Thousands of dollars, except as noted
District Capital outlays
Operating expenses Total
Staff increase District Capital
outlays Transpor-tation Other
Total New positions ANP 2
Boston 0 400 684 1,084 28 16 New York 2,179 598 730 1,328 60 25 Philadelphia 622 233 603 836 15 9 Cleveland 1,595 405 312 717 12 5 Richmond 98 287 460 747 26 19 Atlanta 861 724 618 1,342 21 14 Chicago 2,686 1,154 1,009 2,163 42 21 St. Louis 172 130 455 585 14 11 Minneapolis 368 300 497 797 23 13 Kansas City 1,640 305 975 1,280 40 25 Dallas 2,362 125 909 1,034 13 7 San Francisco 2,287 1,151 1,864 3,015 74 44
Total 14,870 5,811 9,117 14,927 368 208 1. Not included in 1988 budget figures. 2. Average number of personnel; see chap. 3, note 2,
for definition.
Digitized for FRASER http://fraser.stlouisfed.org/ Federal Reserve Bank of St. Louis

66 Expenses and Emp loymen t
Table F. 3 Employment at the Federal Reserve Banks, by District, 1987-88 Average number of personnel1
District 1987 1988 Change District estimate budget Amount Percent
Boston 1,490 1,500 10 .7 New York 4,043 3,982 - 6 1 - 1 . 5 Philadelphia 1,228 1,244 16 1.3 Cleveland 1,414 1,398 - 1 6 - 1 . 1 Richmond 1,937 1,940 3 .2 Atlanta 2,188 2,196 8 .4 Chicago 2,768 2,673 - 9 5 - 3 . 4 St. Louis 1,316 1,313 3 - . 2 Minneapolis 1,071 1,076 5 .5 Kansas City 1,640 1,645 5 .3 Dallas 1,555 1,582 27 1.7 San Francisco 2,455 2,482 27 1.1
Total 23,105 23,0322 - 7 3 - . 3 1. See chap. 3, note 2, for definition of ANP. 2. Includes 1 ANP for Systemwide check image
processing project.
Table F. 4 Expenses of the Federal Reserve Banks, by Operational Area, 1987-88 Thousands of dollars, except as noted
Operational area 1987 estimate
1988 budget
Change Operational area 1987
estimate 1988
budget Amount Percent
Monetary and economic policy 88,447 91,742 3,296 3.7 Supervision and regulation 135,892 142,504 6,612 4.9 Services to financial institutions 799,865 827,458 27,593 3.4
and the public Services to the U.S. Treasury and 170,067 183,397 13,330 7.8
other government agencies
Total 1,194,271 1,245,102 50,831 4.3
MEMO 1
Support 380,754 404,796 24,041 6.3 Overhead 349,573 351,583 2,010 .6
1. Costs of support and overhead included in to users according to amount of use. Overhead refers to expenses by operational area. Support refers to activi- activities, such as auditing, whose costs are charged ties, such as data processing, whose costs can be charged according to the users' shares of total costs.
Digitized for FRASER http://fraser.stlouisfed.org/ Federal Reserve Bank of St. Louis

67 Expenses and Emp loymen t
Table F. 5 Expenses of the Federal Reserve Banks for Monetary and Economic Policy, by District, 1987-88 Thousands of dollars, except as noted
District 1987 1988 Change District estimate budget Amount Percent
Boston 4,680 4,539 - 1 4 1 - 3 . 0 New York1 31,900 35,314 3,415 10.7 Philadelphia 4,020 3,890 -130 - 3 . 2 Cleveland 4,878 4,928 50 1.0 Richmond 4,225 4,227 2 .0 Atlanta 5,352 5,737 385 7.2 Chicago 7,257 7,244 - 1 3 - . 2 St. Louis 4,751 4,979 228 4.8 Minneapolis 4,394 3,585 -809 -18 .4 Kansas City 4,419 4,425 6 .1 Dallas 4,558 5,000 442 9.7 San Francisco 8,013 7,874 -139 - 1 . 7
Total 88,447 91,742 3,296 3.7
1. Expenses of open market trading operations, located in the District, are $12.7 million for 1987 and $14.9 million for 1988.
Table F. 6 Expenses of the Federal Reserve Banks for Supervision and Regulation, by District, 1987-88 Thousands of dollars, except as noted
District 1987 1988 Change District estimate budget Amount Percent
Boston 7,304 8,030 726 9.9 New York 34,049 37,362 3,313 9.7 Philadelphia 7,311 7,746 435 6.0 Cleveland 10,052 10,502 450 4.5 Richmond 9,810 10,534 725 7.4 Atlanta 13,917 14,900 983 7.1 Chicago 25,335 27,143 1,808 7.1 St. Louis 7,118 7,654 536 7.5 Minneapolis 7,577 8,718 1,142 15.1 Kansas City 15,404 16,293 889 5.8 Dallas 12,299 14,278 1,979 16.1 San Francisco 19,891 20,237 346 1.7
Total 170,067 183,397 13,330 7.8
Digitized for FRASER http://fraser.stlouisfed.org/ Federal Reserve Bank of St. Louis
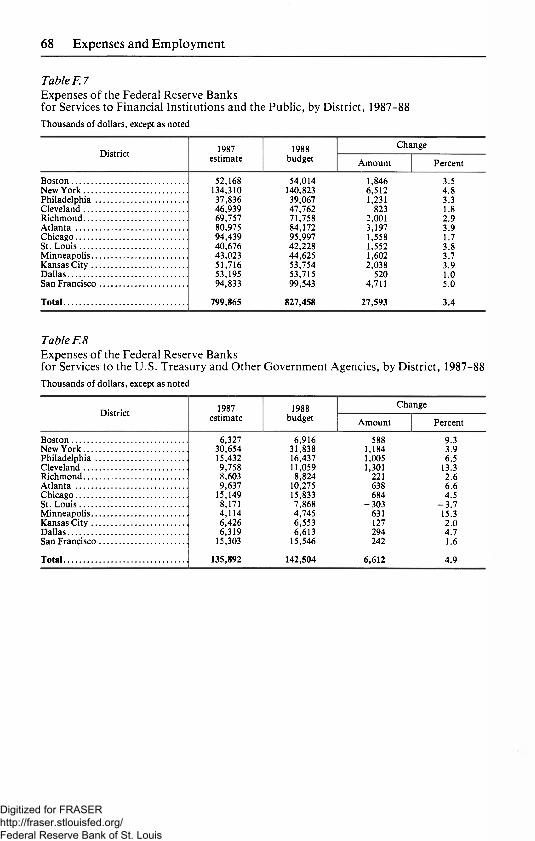
68 Expenses and Employment
Table F.7 Expenses of the Federal Reserve Banks for Services to Financial Institutions and the Public, by District, 1987-88 Thousands of dollars, except as noted
District 1987 1988 Change District estimate budget Amount Percent
Boston 52,168 54,014 1,846 3.5 New York 134,310 140,823 6,512 4.8 Philadelphia 37,836 39,067 1,231 3.3 Cleveland 46,939 47,762 823 1.8 Richmond 69,757 71,758 2,001 2.9 Atlanta 80,975 84,172 3,197 3.9 Chicago 94,439 95,997 1,558 1.7 St. Louis 40,676 42,228 1,552 3.8 Minneapolis 43,023 44,625 1,602 3.7 Kansas City 51,716 53,754 2,038 3.9 Dallas 53,195 53,715 520 1.0 San Francisco 94,833 99,543 4,711 5.0
Total 799,865 827,458 27,593 3.4
Table F. 8 Expenses of the Federal Reserve Banks for Services to the U.S. Treasury and Other Government Agencies, by District, 1987-88 Thousands of dollars, except as noted
District 1987 1988 Change District estimate budget Amount Percent
Boston 6,327 6,916 588 9.3 New York 30,654 31,838 1,184 3.9 Philadelphia 15,432 16,437 1,005 6.5 Cleveland 9,758 11,059 1,301 13.3 Richmond 8,603 8,824 221 2.6 Atlanta 9,637 10,275 638 6.6 Chicago 15,149 15,833 684 4.5 St. Louis 8,171 7,868 -303 - 3 . 7 Minneapolis 4,114 4,745 631 15.3 Kansas City 6,426 6,553 127 2.0 Dallas 6,319 6,613 294 4.7 San Francisco 15,303 15,546 242 1.6
Total 135,892 142,504 6,612 4.9
Digitized for FRASER http://fraser.stlouisfed.org/ Federal Reserve Bank of St. Louis

69 Expenses and Employment
Table F. 9 Expenses of the Federal Reserve Banks for Salaries of Officers and Employees, by District, 1987-88 Thousands of dollars, except as noted
District 1987 1988 Change District estimate budget Amount Percent
Boston 40,265 42,275 2,010 5.0 New York 119,945 125,222 5,277 4.4 Philadelphia 31,604 33,561 1,958 6.2 Cleveland 35,017 36,178 1,160 3.3 Richmond 45,701 47,597 1,896 4.1 Atlanta 52,924 55,275 2,352 4.4 Chicago 72,406 73,169 763 1.1 St. Louis 31,317 33,112 1,795 5.7 Minneapolis 27,445 29,108 1,664 6.1 Kansas City 41,122 43,030 1,908 4.6 Dallas 40,091 42,826 2,735 6.8 San Francisco 69,070 72,752 3,682 5.3
Total 606,907 634,105 27,198 4.5
Table F. 10 Factors in the 1987-88 Change in Salaries of Officers and Employees of the Federal Reserve Banks, by District Percentage points
District Merit
adjust-ment
Structure adjust-ment
Promotion and reclassi-
fication Change in staffing
Turnover and lag1 Overtime Other Total
change
Boston 5.9 .1 1.3 .8 -2 .3 - . 8 .0 5.0 New York 5.2 .0 .8 - . 8 - . 8 - . 2 .3 4.5 Philadelphia 4.8 .5 .7 1.8 - . 6 - 1.0 .0 6.2 Cleveland 4.4 .2 .8 .3 - 2 . 9 .0 .4 3.2 Richmond 5.0 .0 1.4 - . 8 - 1 . 1 - . 5 .1 4.1 Atlanta 4.4 .2 .3 .2 - . 5 - . 2 .0 4.4 Chicago 4.3 .0 1.0 - 2 . 6 - . 7 - . 9 .0 1.1 St. Louis 5.0 .0 .7 - . 1 .0 - . 1 .4 5.9 Minneapolis 4.5 .0 1.0 1.1 - . 3 - . 2 .0 6.1 Kansas City 4.6 .5 .9 1.0 -1 .3 - . 2 - . 9 4.6 Dallas 4.4 .2 .6 2.6 - . 7 - . 4 .2 6.8 San Francisco 5.0 .0 .2 1.2 - . 1 - . 2 .0 6.1
Total 4.8 .1 .8 .1 - . 9 - . 4 .1 4.5 1. Turnover is the replacement of a departing
employee with one having a lower pay grade. Lag is the time during which a position remains vacant.
Digitized for FRASER http://fraser.stlouisfed.org/ Federal Reserve Bank of St. Louis

70 Expenses and Emp loymen t
Table F. 11 Capital Outlays of the Federal Reserve Banks, by District, 1987-88 Thousands of dollars, except as noted
District 1987 1988 Change District estimate budget Amount Percent
Boston 8,738 7,664 -1,075 -12.3 New York 30,110 30,423 313 1.0 Philadelphia 2,991 5,830 2,839 94.9 Cleveland 7,479 14,953 7,474 99.9 Richmond 18,993 28,799 9,807 51.6 Atlanta 15,491 19,178 3,687 23.8 Chicago 40,130 63,556 23,426 58.4 St. Louis 4,755 7,340 2,585 54.4 Minneapolis 4,829 4,687 -147 - 3 . 0 Kansas City 5,659 6,582 924 16.3 Dallas 4,643 15,301 10,658 229.5 San Francisco 16,106 21,609 5,503 34.2
Total 159,924 225,918 65,994 41.3
Digitized for FRASER http://fraser.stlouisfed.org/ Federal Reserve Bank of St. Louis
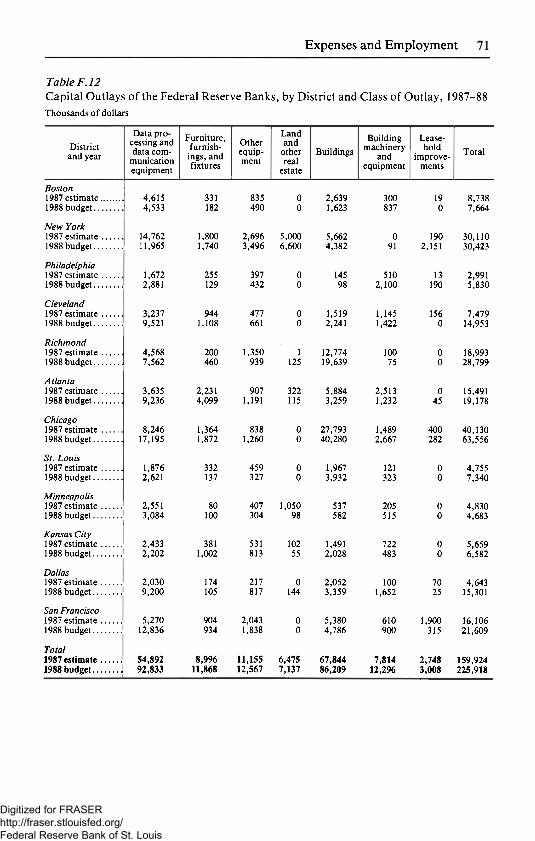
71 Expenses and Emp loymen t
Table F. 12 Capital Outlays of the Federal Reserve Banks, by District and Class of Outlay, 1987-88 Thousands of dollars
District and year
Data pro-cessing and data com-
munication equipment
Furniture, furnish-
ings, and fixtures
Other equip-ment
Land and
other real
estate
Buildings
Building machinery
and equipment
Lease-hold
improve-ments
Total
Boston 1987 estimate 4,615 331 835 0 2,639 300 19 8,738 1988 budget 4,533 182 490 0 1,623 837 0 7,664
New York 1987 estimate 14,762 1,800 2,696 5,000 5,662 0 190 30,110 1988 budget 11,965 1,740 3,496 6,600 4,382 91 2,151 30,423
Philadelphia 1987 estimate 1,672 255 397 0 145 510 13 2,991 1988 budget 2,881 129 432 0 98 2,100 190 5,830
Cleveland 1987 estimate 3,237 944 477 0 1,519 1,145 156 7,479 1988 budget 9,521 1.108 661 0 2,241 1,422 0 14,953
Richmond 1987 estimate 4,568 200 1,350 1 12,774 100 0 18,993 1988 budget 7,562 460 939 125 19,639 75 0 28,799
Atlanta 1987 estimate 3,635 2,231 907 322 5,884 2,513 0 15,491 1988 budget 9,236 4,099 1,191 115 3,259 1,232 45 19,178
Chicago 1987 estimate 8,246 1,364 838 0 27,793 1,489 400 40,130 1988 budget 17,195 1,872 1,260 0 40,280 2,667 282 63,556
St. Louis 1987 estimate 1,876 332 459 0 1,967 121 0 4,755 1988 budget 2,621 137 327 0 3,932 323 0 7,340
Minneapolis 1987 estimate 2,551 80 407 1,050 537 205 0 4,830 1988 budget 3,084 100 304 98 582 515 0 4,683
Kansas City 1987 estimate 2,433 381 531 102 1,491 722 0 5,659 1988 budget 2,202 1,002 813 55 2,028 483 0 6,582
Dallas 1987 estimate 2,030 174 217 0 2,052 100 70 4,643 1988 budget 9,200 105 817 144 3,359 1,652 25 15,301
San Francisco 1987 estimate 5,270 904 2,043 0 5,380 610 1,900 16,106 1988 budget 12,836 934 1,838 0 4,786 900 315 21,609
Total 1987 estimate 54,892 8,996 11,155 6,475 67,844 7,814 2,748 159,924 1988 budget 92,833 11,868 12,567 7,137 86,209 12,296 3,008 225,918
Digitized for FRASER http://fraser.stlouisfed.org/ Federal Reserve Bank of St. Louis

72 Expenses and Emp loyment
Table F. 13 Budget Performance of the Federal Reserve Banks, Operating Expenses, by District, 1987 Thousands of dollars, except as noted
District 1987 1987 Change District budget estimate Amount Percent
Boston 70,480 70,480 0 .0 New York 230,939 230,913 - 2 6 .0 Philadelphia 66,209 64,599 -1,610 - 2 . 4 Cleveland 71,583 71,627 44 .1 Richmond 92,055 92,394 339 .4 Atlanta 109,947 109,881 - 6 6 - . 1 Chicago 142,232 142,179 - 5 3 .0 St. Louis 60,299 60,716 417 .7 Minneapolis 59,128 59,108 - 2 0 .0 Kansas City 78,200 77,964 -235 - . 3 Dallas 76,345 76,371 26 .0 San Francisco 140,397 138,040 -2,358 - 1 . 7
Total 1,197,814 1,194,271 -3,543 - . 3
Table F. 14 Budget Performance of the Federal Reserve Banks, Employment, by District, 1987 Average number of personnel, except as noted1
District 1987 1987 Change District budget estimate Amount Percent
Boston 1,460 1,490 30 2.1 New York 4,047 4,043 - 4 - . 1 Philadelphia 1,256 1,228 - 2 8 - 2 . 2 Cleveland 1,399 1,414 15 1.1 Richmond 1,963 1,937 - 2 6 - 1 . 3 Atlanta 2,196 2,188 - 8 - . 4 Chicago 2,803 2,768 - 3 5 - 1 . 2 St. Louis 1,322 1,316 - 6 - . 5 Minneapolis 1,079 1,071 - 8 - . 7 Kansas City 1,621 1,640 19 1.2 Dallas 1,563 1,555 - 8 - . 5 San Francisco 2,453 2,455 2 .1
Total 23,162 23,105 - 5 7 - . 2
1. See chap. 3, note 2, for definition of ANP.
Digitized for FRASER http://fraser.stlouisfed.org/ Federal Reserve Bank of St. Louis
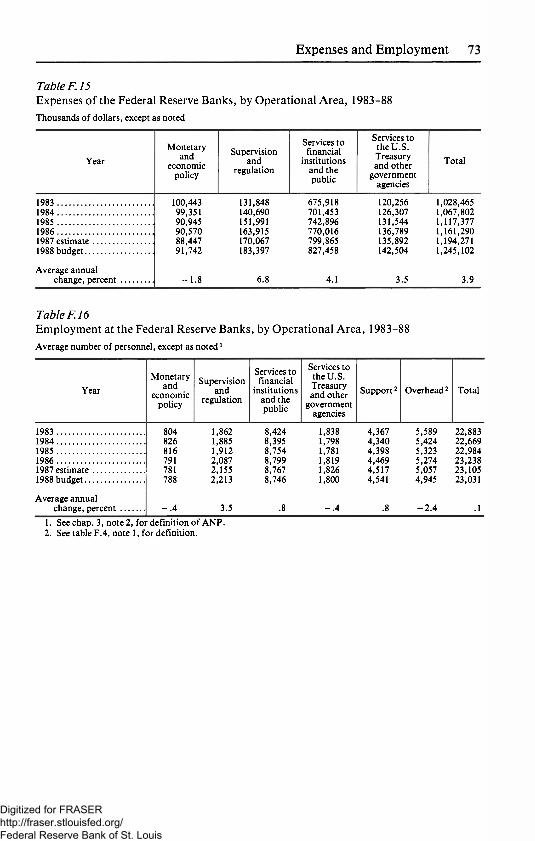
73 Expenses and Emp loymen t
Table F. 15 Expenses of the Federal Reserve Banks, by Operational Area, 1983-88 Thousands of dollars, except as noted
Year Monetary
and economic
policy
Supervision and
regulation
Services to financial
institutions and the public
Services to the U.S. Treasury and other
government agencies
Total
1983 100,443 131,848 675,918 120,256 1,028,465 1984 99,351 140,690 701,453 126,307 1,067,802 1985 90,945 151,991 742,896 131,544 1,117,377 1986 90,570 163,915 770,016 136,789 1,161,290 1987 estimate 88,447 170,067 799,865 135,892 1,194,271 1988 budget 91,742 183,397 827,458 142,504 1,245,102
Average annual change, percent - 1 . 8 6.8 4.1 3.5 3.9
Table F. 16 Employment at the Federal Reserve Banks, by Operational Area, 1983-88 Average number of personnel, except as noted1
Year Monetary
and economic
policy
Supervision and
regulation
Services to financial
institutions and the public
Services to the U.S. Treasury and other
government agencies
Support2 Overhead2 Total
1983 804 1,862 8,424 1,838 4,367 5,589 22,883 1984 826 1,885 8,395 1,798 4,340 5,424 22,669 1985 816 1,912 8,754 1,781 4,398 5,323 22,984 1986 791 2,087 8,799 1,819 4,469 5,274 23,238 1987 estimate 781 2,155 8,767 1,826 4,517 5,057 23,105 1988 budget 788 2,213 8,746 1,800 4,541 4,945 23,031
Average annual change, percent - . 4 3.5 .8 - . 4 .8 - 2 . 4 .1
1. See chap. 3, note 2, for definition of ANP. 2. See table F.4, note 1, for definition.
Digitized for FRASER http://fraser.stlouisfed.org/ Federal Reserve Bank of St. Louis
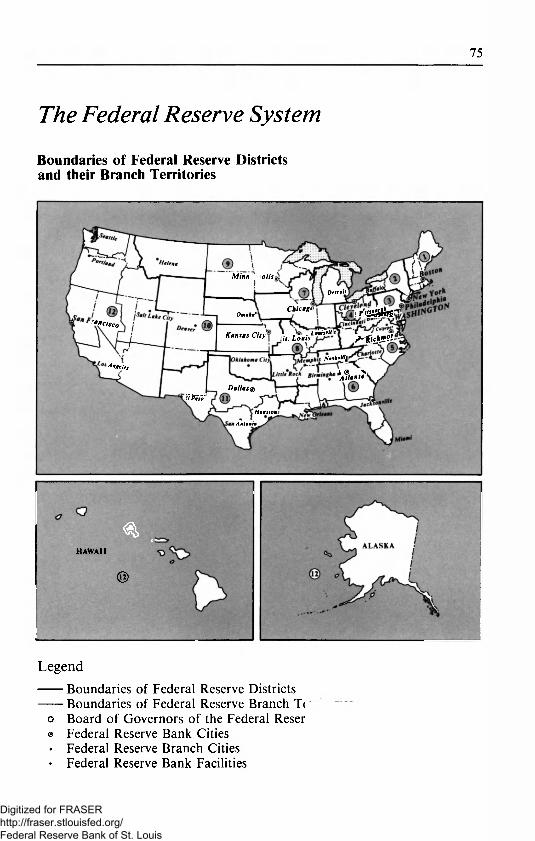
75
The Federal Reserve System
Boundaries of Federal Reserve Districts and their Branch Territories
Minneapolis
Detroit
IP 'Wj&ti i
f-tfichjS?!
Chicagi Omaha*
''"C'SCO Louis' U Kansas City If. Louis
Haskviltj A'leles
* ® > Ail""' Dallas®
fl TOi' HoustonN
Antonio
Q <
HAWAII
©
Legend Boundaries of Federal Reserve Districts Boundaries of Federal Reserve Branch Territories
o Board of Governors of the Federal Reserve System ® Federal Reserve Bank Cities • Federal Reserve Branch Cities • Federal Reserve Bank Facilities
Digitized for FRASER http://fraser.stlouisfed.org/ Federal Reserve Bank of St. Louis

FRB 1-2,000-0288 C
Digitized for FRASER http://fraser.stlouisfed.org/ Federal Reserve Bank of St. Louis