april 30, 2021 t. rowe price rpgex global growth stock
TRANSCRIPT

T. ROWE PRICE
April 30, 2021SEMIANNUAL REPORT
RPGEX Global Growth Stock Fund
PAGLX Global Growth Stock Fund– Advisor Class
RGGIX Global Growth Stock Fund– I Class
For more insights from T. Rowe Price investment professionals, go to troweprice.com.
srgle_0421_P4Proof #

srgle_0421_P4Proof #
Log in to your account at troweprice.com for more information.
* Certain mutual fund accounts that are assessed an annual account service fee can also save money by switching to e-delivery.
It’s fast—receive your statements and confirmations faster than U.S. mail.
It’s convenient—access your important account documents whenever you need them.
It’s secure—we protect your online accounts using “True Identity” to confirm new accounts and make verification faster and more secure.
It can save you money—where applicable, T. Rowe Price passes on the cost savings to fund holders.*
TO ENROLL:If you invest directly with T. Rowe Price, go to troweprice.com/paperless.
If you invest through an investment advisor, a bank, or a brokerage firm, please contact that organization and ask if it can provide electronic documentation.
Go PaperlessSign up for e-delivery of your statements, confirmations, and prospectuses or shareholder reports.
T. ROWE PRICE GlObAl GROWTh STOCk Fund
HIGHLIGHTS
nn The Global Growth Stock Fund returned 27.50% during the period, underperforming its benchmark, the MSCI All Country World Index Net, but outperforming the Lipper peer group average.
nn Relative underperformance was mainly due to stock selection in the information technology sector. Holdings in the consumer discretionary sector, coupled with an overweight position, also weighed on relative returns. On the positive side, an overweight to financials contributed the most to relative results. At the regional level, stock selection in emerging markets detracted the most, while security choices in North America boosted relative performance.
nn We have been focused on maintaining a broadly balanced portfolio and remain largely sector-neutral in our positioning. Our largest overweights at the end of the reporting period were in consumer discretionary and health care, while our largest underweights were in energy and consumer staples. At the regional level, emerging markets still represents our largest overweight given the structural, long-term growth drivers we see in select countries, though we reduced our overweight during the period.
nn We find ourselves in an unusually complex environment in which investors are debating the timing of the end to the pandemic and what the world will look like in the next six to 12 months. This is creating more volatility at the stock-specific level, and with so many unknowns, our most pressing goal is to keep a balanced portfolio of diverse holdings across sectors and regions.

srgle_0421_P4Proof #
1
T. ROWE PRICE GlObAl GROWTh STOCk Fund
CIO Market Commentary
Global stock markets produced very strong returns during the first half of your fund’s fiscal year, the six-month period ended April 30, 2021, while rising yields weighed on returns for bond investors. Although the coronavirus continued to spread in many regions, the beginning of vaccine distributions led investors to look beyond negative headlines in anticipation of a strong economic recovery.
All major global and regional equity benchmarks recorded positive results during the period, and returns in the 20% to 40% range were common across developed and emerging markets. Reports of successful vaccine trials in November increased hopes for a return to normalcy in 2021 and spurred a rotation toward segments that had been beaten down in the initial phase of the pandemic.
After a long period of underperformance, value shares outperformed their growth counterparts during the six-month period, and sector leaders also changed. Energy stocks produced strong gains as oil prices rebounded to their highest level in more than two years, and financials also outperformed as banks benefited from rising longer-term interest rates and improved lending margins. Meanwhile, information technology and consumer discretionary companies, which had been the big winners in the early days of the pandemic, trailed wider benchmarks, although they continued to produce solid gains. A weaker U.S. dollar aided returns for U.S. investors in most regions.
Besides the rollout of vaccines, extraordinary fiscal and monetary support from global governments and central banks remained a key factor in providing a supportive backdrop for markets. In the U.S., President Joe Biden signed the American Rescue Plan Act—a $1.9 trillion program that included direct payments of up to $1,400 to most Americans—into law in March. Central banks kept short-term lending rates near or even below zero, and both the Federal Reserve and the European Central Bank emphasized that the time had not yet arrived for scaling back asset purchases designed to keep downward pressure on long-term interest rates.
Although some regions continued to be impacted by lockdowns, there were signs of a rebound in many economies. The International Monetary Fund increased its forecast for global growth in 2021 to 6%, which would mark the fastest growth rate since 1976, and corporate earnings reports were generally better than expected.

srgle_0421_P4Proof #
2
T. ROWE PRICE GlObAl GROWTh STOCk Fund
While stock investors looked favorably on the continued accommodative policies and positive economic news, bond investors became concerned about rising inflation. As a result, yields of longer-term Treasuries and other high-quality sovereign debt surged during the period, weighing on returns in many fixed income sectors. High yield bonds, which are less sensitive to interest rate changes, produced strong results though, and tax-free municipal bonds recorded positive returns as states received pandemic-related financial assistance from the federal government and state tax revenues held up better than expected.
As we look ahead, the widespread rollout of vaccines, very supportive monetary and fiscal policies, and the release of pent-up consumer demand could provide support for additional market gains. However, we are aware that there are risks in this environment. Valuations are expensive under all but the most optimistic scenarios. In addition, there are signs of speculation in markets, as shown by the rapid rise in cryptocurrencies and capital formation through less conventional vehicles.
During the tumultuous market volatility of February and March 2020, our portfolio managers remained rooted in company fundamentals and focused on the long term—identifying companies with balance sheets that appeared strong enough to get them to the other side of this pandemic was a particular focus. As we hopefully move forward to better days, our investment teams will continue to follow this approach, applying strong fundamental analysis as they seek out the best investments for your portfolio.
Thank you for your continued confidence in T. Rowe Price.
Sincerely,
Robert SharpsGroup Chief Investment Officer

srgle_0421_P4Proof #
3
T. ROWE PRICE GlObAl GROWTh STOCk Fund
Management’s discussion of Fund Performance
INVESTMENT OBJECTIVE
The fund seeks long-term growth of capital through investments primarily in the common stocks of large-cap companies throughout the world, including the U.S.
FUND COMMENTARY
How did the fund perform in the past six months?
The Global Growth Stock Fund returned 27.50% in the six-month period ended April 30, 2021. The fund underperformed the MSCI All Country World Index Net benchmark, which returned 28.29%, but outperformed the Lipper Global Multi-Cap Growth Funds Average, which returned 26.01%.
(Returns for the Advisor and I Class shares varied slightly, reflecting their different fee structures. Past performance cannot guarantee future results.)
What factors influenced the fund’s performance?
From a sector perspective, the fund’s relative underperformance was mainly due to stock selection in the information
technology sector. Stock selection in the consumer discretionary sector, coupled with an overweight position, also hurt relative results. On the positive side, an overweight to financials contributed the most to relative performance. At the regional level, holdings in emerging markets weighed the most on relative performance, while stock selection in North America boosted relative returns.
Within the information technology sector, our position in leading data analytics firm Splunk was the greatest relative detractor. The stock tumbled on a series of disappointing earnings reports, especially for the third quarter, after several late-stage deals fell through, resulting in metrics well below expectations. Shares fell further later in the period after fourth-quarter results were also weaker than expected. Despite the company’s recent challenges, we still have high conviction that Splunk will be able to drive sustained long-term revenue growth given its flexible technology approach to the growing need
Six-Month Period Ended 4/30/21 Total Return
Global Growth Stock Fund 27.50%
Global Growth Stock Fund–Advisor Class 27.29
Global Growth Stock Fund–I Class 27.57
MSCI All Country World Index net 28.29
lipper Global Multi-Cap Growth Funds Average 26.01
PERFORMANCE COMPARISON

srgle_0421_P4Proof #
4
T. ROWE PRICE GlObAl GROWTh STOCk Fund
for business intelligence, a strong management team, consistent competitive leadership, and an improving mix of recurring revenues. (Please refer to the portfolio of investments for a complete list of holdings and the amount each represents in the portfolio.)
Our position in Alibaba Group Holding within the consumer discretionary sector also hurt relative performance. Shares of the Chinese e-commerce giant plunged in late 2020 after the hotly anticipated initial public offering of the firm’s fintech spinoff Ant Financial was postponed amid reported pressure from the Chinese government and came under further pressure as the company faced increased regulatory scrutiny for anti-monopolistic practices. While the Chinese government eventually issued a fine to Alibaba that was larger than expected, we feel the decreased uncertainty and clearer path forward is a positive for the stock. We continue to like the long-term outlook for the company given its dominant e-commerce position and asset-light business model, which we think is scalable, self-enhancing, and highly cash flow generative.
On the positive side, our overweight in the financials sector contributed the most, and our position in Wells Fargo was the largest relative contributor within the sector. The company benefited from rising interest rate expectations and consumer credit resilience over the period and also made meaningful progress in its multiyear quest to satisfy a Federal Reserve order that triggered a costly cap on the bank’s growth. While we are mindful of rising valuations, we continue to believe that Wells Fargo offers significant growth potential, and we think the bank’s relatively new, but seasoned, management team can continue to drive improvements.
Within the communication services sector, our position in Sea aided relative performance. Shares of the greater Southeast Asian internet platform company surged due to an acceleration in gross merchandise volumes on Sea’s e-commerce platform and strong topline growth in its digital entertainment segment fueled by the ongoing success of “Free Fire,” a popular mobile video game that the company developed in-house. The company’s revenue growth accelerated throughout the period as COVID-19 (the disease caused by the coronavirus) drove user adoption and engagement metrics higher across all business segments. The coronavirus pandemic structurally shifted user behavior online to a staggering degree, which has been a boon for Sea. We believe that Sea’s platform is well positioned to gain share in Southeast Asia’s high-margin online gaming market, with additional growth supported by an underappreciated consumer-to-consumer e-commerce marketplace with improving monetization trends.

srgle_0421_P4Proof #
5
T. ROWE PRICE GlObAl GROWTh STOCk Fund
How is the fund positioned?
Our positioning remains largely sector-neutral. We are currently in a complex environment in which investors are debating the timing of the end of the pandemic and what the world will look like in the next six to 12 months. This is creating more volatility at the stock level for us as investors, and with so many unknowns, our most pressing goal is to keep a balanced portfolio of diverse holdings across sectors and regions. As always, we want to own truly innovative companies that can produce solid growth over a two- to three-
year time horizon, and the market’s recent shift away from secular growth winners that were COVID-19 beneficiaries has given us the opportunity to pick up or add to higher-quality growth companies that we believe are trading at attractive prices. However, we are mindful that valuations are stretched in some areas, and we are working hard to control risk within the portfolio.
At the end of April, the fund was overweight the consumer discretionary and health care sectors, though not dramatically so. The overall largest sector shift during the period occurred in financials, where we reduced our exposure to a more modest overweight position.
We added meaningfully to health care and real estate and maintained our underweights to energy and consumer staples, as these are areas in which we are seeing fewer opportunities for durable growth at reasonable prices.
Health care lagged most other sectors during the period as the segment was caught between the shift away from COVID-19 winners and the acknowledgment that the pandemic is not yet over, which is delaying the recovery for some areas of the sector. Many names associated with diagnostics
Percent of net Assets10/31/20 4/30/21
Information Technology 21.1% 21.2%
Consumer discretionary 16.9 17.6
Financials 17.1 15.5
health Care 12.0 13.2
Industrials and business Services 9.9 10.2
Communication Services 8.2 8.9
Consumer Staples 5.5 4.4
Materials 4.0 3.9
Real Estate 1.9 2.7
utilities 2.3 2.0
Energy 0.6 0.4
Other and Reserves 0.5 0.0
Total 100.0% 100.0%
Historical weightings reflect current industry/sector classifications.
SECTOR DIVERSIFICATION

srgle_0421_P4Proof #
6
T. ROWE PRICE GlObAl GROWTh STOCk Fund
and testing, biotechnology, and elective medical procedures were pressured by this collision of opposing sentiment, and we added to our allocation strategically as market fluctuations presented opportunities. Our largest new addition was in Quidel, which produces diagnostic health care products and rapid diagnostic testing products. The stock posted steep declines on softened demand for COVID-19 testing, which offered an attractive entry point. We believe the pandemic has ignited a broader demand for more sophisticated diagnostics testing that will outlast the health crisis and think Quidel is poised to emerge from the pandemic with a higher earnings base. We also maintain a favorable view of the company’s pipeline. Within the sector, we also added new positions in pharmaceutical firm Eli Lilly, antibody treatment therapy developer Genmab, and Alibaba Health Information Technology.
The consumer discretionary sector remains our largest overweight, and our allocation increased over the period. In our view, there are more coronavirus beneficiaries in this sector than anywhere else, but this has led to a dramatic demarcation between winners and losers. COVID-19 has pulled forward years of e-commerce share gains in the span of a few months, and we have an expanded and diverse set of names levered to that trend. We continue to think the market is severely underestimating the profound effect the pandemic has had on the consumer landscape. It is now vital for companies to view their businesses through an omnichannel lens, and it is no longer an option for businesses to ignore the need for an online presence. We added to our positions in Amazon.com, Zalando, and Peloton Interactive and started positions in South Korean e-commerce platform Coupang and DoorDash.
Regionally, we increased our weighting to North America while reducing our exposure to the Pacific ex-Japan region, especially China and the Philippines. Although we continue to be overweight fast-growing emerging market countries that have low debt-to-gross domestic product (GDP) ratios and attractive demographic growth, we have reduced our exposure as we believe the coronavirus pandemic will continue to pressure growth in many developing countries until vaccination programs have more fully progressed. While we are underweight North America, it still makes up the majority of our geographic allocation at approximately 58% of assets.

srgle_0421_P4Proof #
7
T. ROWE PRICE GlObAl GROWTh STOCk Fund
What is portfolio management’s outlook?
The current pushes and pulls in the market are highly complex. From a fundamental perspective, near- to intermediate-term economic and corporate data are going to be exceedingly strong. We are still operating in a very low interest rate world—in an absolute sense, rates remain near historic lows—with a massive amount of central bank liquidity and fiscal stimulus at a time when real GDP growth is picking up and corporate earnings are likely to accelerate this year and next. While equity valuations are still more reasonable when compared with bond yields, they are clearly above average for a normal environment, which causes some concern.
The ongoing health pandemic offers its own pushes and pulls. There has been a marked improvement in vaccine distribution within the U.S., with 2% to 3% of the country’s population being vaccinated each week. However, the vaccine rollouts in parts of Europe and Asia have been rockier and the virus is likely to remain in the world for some time, particularly in some emerging markets countries where we may be more than a year out before many people can obtain the vaccine, which amplifies risks of virus variants.
The Biden administration’s emerging priorities offer positives and negatives for equity investors as well. Widespread fiscal stimulus has supported asset prices, but the increasing likelihood of rising corporate tax rates could put a damper on after-tax corporate earnings. Geopolitically, relations between the U.S. and China remain complex. The arrival of a new U.S. administration increased expectations for less adversarial relations, but it has become clear that underlying tensions between the two superpowers are real, structural, and unlikely to go away.
We have also seen extreme positive sentiment, if not exuberance, in markets. There has been an explosion in special-purpose acquisition companies and initial public offerings as well as risk-seeking retail investor behavior driving price movements. While we think we have entered a new equity bubble with areas of the market looking frothy and irrational, it could be years before we experience a meaningful reversion, which means there could still be room for equities to move higher.

srgle_0421_P4Proof #
8
T. ROWE PRICE GlObAl GROWTh STOCk Fund
Recognizing the challenging pushes and pulls in the market, we are trying to be more balanced with the portfolio, keeping the overall portfolio beta near 1.0—a volatility measure that is comparable to that of the broad market, and thus not overly offensive or defensive—while focusing on picking stocks broadly across sectors and regions. We think that volatility is likely to increase, in part, due to higher dispersion within factors, styles, and sectors, and that such an environment is well suited for active investors like ourselves. While financial and market conditions have changed meaningfully—and will likely continue to do so—our investment philosophy, rooted in stock selection and a thoughtful approach to portfolio construction, has not. It is this consistent process that allows us to successfully navigate more challenging cycles.
The views expressed reflect the opinions of T. Rowe Price as of the date of this report and are subject to change based on changes in market, economic, or other conditions. These views are not intended to be a forecast of future events and are no guarantee of future results.

srgle_0421_P4Proof #
9
T. ROWE PRICE GlObAl GROWTh STOCk Fund
RISKS OF INTERNATIONAL INVESTING
Funds that invest overseas generally carry more risk than funds that invest strictly in U.S. assets. Risks can result from varying stages of economic and political development; differing regulatory environments, trading days, and accounting standards; and higher transaction costs of non-U.S. markets. Non-U.S. investments are also subject to currency risk, or a decline in the value of a foreign currency versus the U.S. dollar, which reduces the dollar value of securities denominated in that currency. The risks of investing outside the U.S. are heightened for any investments in emerging markets, which are susceptible to greater volatility than investments in developed markets.
BENCHMARK INFORMATION
Note: Lipper, a Thomson Reuters Company, is the source for all Lipper content reflected in these materials. Copyright 2021 © Refinitiv. All rights reserved. Any copying, republication or redistribution of Lipper content is expressly prohibited without the prior written consent of Lipper. Lipper shall not be liable for any errors or delays in the content, or for any actions taken in reliance thereon.
Note: MSCI makes no express or implied warranties or representations and shall have no liability whatsoever with respect to any MSCI data contained herein. The MSCI data may not be further redistributed or used as a basis for other indices or any securities or financial products. This report is not approved, reviewed, or produced by MSCI.

srgle_0421_P4Proof #
10
T. ROWE PRICE GlObAl GROWTh STOCk Fund
TWENTY-FIVE LARGEST HOLDINGS
Percent of net Assets
4/30/21
Amazon.com, united States 3.2%Alphabet, united States 2.6Facebook, united States 1.7Evotec, Germany 1.4Alibaba Group holding, China 1.4
Roper Technologies, united States 1.2Apple, united States 1.1Charles Schwab, united States 1.1Wells Fargo, united States 1.1Rivian Automotive, united States 1.1
FedEx, united States 1.0Visa, united States 1.0danaher, united States 1.0Microsoft, united States 1.0nextEra Energy, united States 0.9
Zalando, Germany 0.9Waste Connections, united States 0.9Zoom Video Communications, united States 0.9Goldman Sachs, united States 0.9Tencent holdings, China 0.9
Sea, Singapore 0.8Cigna, united States 0.8Morgan Stanley, united States 0.8kkR, united States 0.8Altimeter Growth, united States 0.8
Total 29.3%
Note: The information shown does not reflect any exchange-traded funds (ETFs), cash reserves, or collateral for securities lending that may be held in the portfolio.
PORTFOLIO HIGHLIGHTS

srgle_0421_P4Proof #
11
T. ROWE PRICE GlObAl GROWTh STOCk Fund
AVERAGE ANNUAL COMPOUND TOTAL RETURN
Periods Ended 4/30/21 1 Year 5 Years 10 YearsSince
Inception Inception
date
Global Growth Stock Fund 62.54% 20.89% 13.27% – –
Global Growth Stock Fund–Advisor Class 62.05 20.69 13.11 – –
Global Growth Stock Fund–I Class 62.74 – – 23.11% 3/6/17
This table shows how the fund would have performed each year if its actual (or cumulative) returns for the periods shown had been earned at a constant rate. Returns do not reflect taxes that the shareholder may pay on fund distributions or the redemption of fund shares. Past performance cannot guarantee future results. Investors should note that the fund’s short-term performance is highly unusual and unlikely to be sustained.
This chart shows the value of a hypothetical $10,000 investment in the fund over the past 10 fiscal year periods or since inception (for funds lacking 10-year records). The result is compared with benchmarks, which include a broad-based market index and may also include a peer group average or index. Market indexes do not include expenses, which are deducted from fund returns as well as mutual fund averages and indexes.
GROWTH OF $10,000
As of 4/30/21
$34,75724,05530,597
Global Growth Stock FundMSCI All Country World Index netlipper Global Multi-Cap Growth Funds Average
4/214/204/194/184/174/164/154/144/134/124/11
10,000
16,000
22,000
28,000
34,000
$40,000
GLOBAL GROWTH STOCK FUND
Note: Performance for the Advisor and I Class shares will vary due to their differing fee structures. See the Average Annual Compound Total Return table.

srgle_0421_P4Proof #
12
T. ROWE PRICE GlObAl GROWTh STOCk Fund
FUND EXPENSE EXAMPLE
As a mutual fund shareholder, you may incur two types of costs: (1) transaction costs, such as redemption fees or sales loads, and (2) ongoing costs, including management fees, distribution and service (12b-1) fees, and other fund expenses. The following example is intended to help you understand your ongoing costs (in dollars) of investing in the fund and to compare these costs with the ongoing costs of investing in other mutual funds. The example is based on an investment of $1,000 invested at the beginning of the most recent six-month period and held for the entire period.
Please note that the fund has three share classes: The original share class (Investor Class) charges no distribution and service (12b-1) fee, the Advisor Class shares are offered only through unaffiliated brokers and other financial intermediaries and charge a 0.25% 12b-1 fee, and I Class shares are available to institutionally oriented clients and impose no 12b-1 or administrative fee payment. Each share class is presented separately in the table.
Actual ExpensesThe first line of the following table (Actual) provides information about actual account values and expenses based on the fund’s actual returns. You may use the information on this line, together with your account balance, to estimate the expenses that you paid over the period. Simply divide your account value by $1,000 (for example, an $8,600 account value divided by $1,000 = 8.6), then multiply the result by the number on the first line under the heading “Expenses Paid During Period” to estimate the expenses you paid on your account during this period.
Hypothetical Example for Comparison PurposesThe information on the second line of the table (Hypothetical) is based on hypothetical account values and expenses derived from the fund’s actual expense ratio and an assumed 5% per year rate of return before expenses (not the fund’s actual return). You may compare the ongoing costs of investing in the fund with other funds by contrasting this 5% hypothetical example and the 5% hypothetical examples that appear in the shareholder reports of the other funds. The hypothetical account values and expenses may not be used to estimate the actual ending account balance or expenses you paid for the period.
EXPENSE RATIO
Global Growth Stock Fund 0.85%
Global Growth Stock Fund–Advisor Class 1.12
Global Growth Stock Fund–I Class 0.69
The expense ratio shown is as of the fund’s most recent prospectus. This number may vary from the expense ratio shown elsewhere in this report because it is based on a different time period and, if applicable, includes acquired fund fees and expenses but does not include fee or expense waivers.

srgle_0421_P4Proof #
13
T. ROWE PRICE GlObAl GROWTh STOCk Fund
FUND EXPENSE EXAMPLE (CONTINUED)
Note: T. Rowe Price charges an annual account service fee of $20, generally for accounts with less than $10,000. The fee is waived for any investor whose T. Rowe Price mutual fund accounts total $50,000 or more; accounts electing to receive electronic delivery of account statements, transaction confirmations, prospectuses, and shareholder reports; or accounts of an investor who is a T. Rowe Price Personal Services or Enhanced Personal Services client (enrollment in these programs generally requires T. Rowe Price assets of at least $250,000). This fee is not included in the accompanying table. If you are subject to the fee, keep it in mind when you are estimating the ongoing expenses of investing in the fund and when comparing the expenses of this fund with other funds.
You should also be aware that the expenses shown in the table highlight only your ongoing costs and do not reflect any transaction costs, such as redemption fees or sales loads. Therefore, the second line of the table is useful in comparing ongoing costs only and will not help you determine the relative total costs of owning different funds. To the extent a fund charges transaction costs, however, the total cost of owning that fund is higher.
beginning Account Value
11/1/20
Ending Account Value
4/30/21
Expenses Paid during Period*
11/1/20 to 4/30/21
Investor ClassActual $1,000.00 $1,275.00 $4.63
hypothetical (assumes 5% return before expenses) 1,000.00 1,020.73 4.11
Advisor ClassActual 1,000.00 1,272.90 6.20
hypothetical (assumes 5% return before expenses) 1,000.00 1,019.34 5.51
I ClassActual 1,000.00 1,275.70 3.84
hypothetical (assumes 5% return before expenses) 1,000.00 1,021.42 3.41
* Expenses are equal to the fund’s annualized expense ratio for the 6-month period, multiplied by the average account value over the period, multiplied by the number of days in the most recent fiscal half year (181), and divided by the days in the year (365) to reflect the half-year period. The annualized expense ratio of the Investor Class was 0.82%, the Advisor Class was 1.10%, and the I Class was 0.68%.
GLOBAL GROWTH STOCK FUND

srgle_0421_P4Proof #
14
T. ROWE PRICE GlObAl GROWTh STOCk Fund
QUARTER-END RETURNS
Periods Ended 3/31/21 1 Year 5 Years 10 YearsSince
Inception Inception
date
Global Growth Stock Fund 78.12% 20.04% 13.04% – –
Global Growth Stock Fund–Advisor Class 77.69 19.85 12.89 – –
Global Growth Stock Fund–I Class 78.40 – – 22.16% 3/6/17
The fund’s performance information represents only past performance and is not necessarily an indication of future results. Current performance may be lower or higher than the perfor-mance data cited. Share price, principal value, and return will vary, and you may have a gain or loss when you sell your shares. For the most recent month-end performance, please visit our website (troweprice.com) or contact a T. Rowe Price representative at 1-800-225-5132 or, for Advisor and I Class shares, 1-800-638-8790.
This table provides returns through the most recent calendar quarter-end rather than through the end of the fund’s fiscal period. It shows how the fund would have performed each year if its actual (or cumulative) returns for the periods shown had been earned at a constant rate. Average annual total return figures include changes in principal value, reinvested dividends, and capital gain distributions. Returns do not reflect taxes that the shareholder may pay on fund distributions or the redemption of fund shares. When assessing performance, investors should consider both short- and long-term returns. Investors should note that the fund’s short-term performance is highly unusual and unlikely to be sustained.

srgle_0421_P4Proof #
15
T. ROWE PRICE GlObAl GROWTh STOCk Fund
unaudited
FINANCIAL HIGHLIGHTS
For a share outstanding throughout each period
Investor Class
6 Months . Ended 4/30/21
. . Year . . Ended 10/31/20 10/31/19 10/31/18 10/31/17 10/31/16
NET ASSET VALUE Beginning of period $ 37.06 $ 28.60 $ 24.74 $ 24.92 $ 19.46 $ 19.94
Investment activities Net investment income (loss) (1)(2) (0.01 ) 0.03 0.10 0.02 0.06 0.08 Net realized and unrealized gain/loss 10.07 8.50 4.15 — (3) 5.53 0.37 Total from investment activities 10.06 8.53 4.25 0.02 5.59 0.45
Distributions Net investment income (0.03 ) (0.07 ) — — (0.09 ) (0.18 ) Net realized gain (1.32 ) — (0.39 ) (0.21 ) (0.04 ) (0.75 ) Total distributions (1.35 ) (0.07 ) (0.39 ) (0.21 ) (0.13 ) (0.93 )
Redemption fees added to paid-in capital (1)(4) — — — (3) 0.01 — (3) — (3)
NET ASSET VALUE End of period $ 45.77 $ 37.06 $ 28.60 $ 24.74 $ 24.92 $ 19.46

srgle_0421_P4Proof #
16
The accompanying notes are an integral part of these financial statements.
T. ROWE PRICE GlObAl GROWTh STOCk Fund
unaudited
FINANCIAL HIGHLIGHTS
For a share outstanding throughout each period
Investor Class
6 Months . Ended 4/30/21
. . Year . . Ended 10/31/20 10/31/19 10/31/18 10/31/17 10/31/16
Ratios/Supplemental Data
Total return (2)(5) 27.50 % 29.88 % 17.53 % 0.10 % 28.93 % 2.40 %
Ratios to average net assets: (2) Gross expenses before waivers/payments by Price Associates 0.82 % (6) 0.85 % 0.93 % 1.00 % 1.10 % 1.19 % Net expenses after waivers/payments by Price Associates 0.82 % (6) 0.85 % 0.93 % 1.00 % 1.01 % 1.00 % Net investment income (loss) (0.04 )% (6) 0.09 % 0.37 % 0.09 % 0.28 % 0.44 %
Portfolio turnover rate 32.3 % 85.4 % 66.3 % 120.0 % 69.7 % 73.3 % Net assets, end of period (in thousands) $711,681 $482,762 $226,633 $172,872 $136,932 $92,748
0 % 0 % 0 % 0 % 0 % 0 %
(1) Per share amounts calculated using average shares outstanding method. (2) See Note 7 for details of expense-related arrangements with Price Associates. (3) Amounts round to less than $0.01 per share. (4) The fund charged redemption fees through March 31, 2019. (5) Total return refl ects the rate that an investor would have earned on an investment in the fund
during each period, assuming reinvestment of all distributions, and payment of no redemption or account fees, if applicable. Total return is not annualized for periods less than one year.
(6) Annualized

srgle_0421_P4Proof #
17
T. ROWE PRICE GlObAl GROWTh STOCk Fund
unaudited
FINANCIAL HIGHLIGHTS
For a share outstanding throughout each period
Advisor Class
6 Months . Ended 4/30/21
. . Year . . Ended 10/31/20 10/31/19 10/31/18 10/31/17 10/31/16
NET ASSET VALUE Beginning of period $ 36.78 $ 28.43 $ 24.58 $ 24.77 $ 19.34 $ 19.81
Investment activities Net investment income (loss) (1)(2) (0.07 ) (0.07 ) 0.06 — (3) 0.04 0.07 Net realized and unrealized gain/loss 9.98 8.48 4.11 — (3) 5.50 0.36 Total from investment activities 9.91 8.41 4.17 — (3) 5.54 0.43
Distributions Net investment income — (0.06 ) — — (0.07 ) (0.15 ) Net realized gain (1.32 ) — (0.32 ) (0.19 ) (0.04 ) (0.75 ) Total distributions (1.32 ) (0.06 ) (0.32 ) (0.19 ) (0.11 ) (0.90 )
NET ASSET VALUE End of period $ 45.37 $ 36.78 $ 28.43 $ 24.58 $ 24.77 $ 19.34

srgle_0421_P4Proof #
18
The accompanying notes are an integral part of these financial statements.
T. ROWE PRICE GlObAl GROWTh STOCk Fund
unaudited
FINANCIAL HIGHLIGHTS
For a share outstanding throughout each period
Advisor Class
6 Months . Ended 4/30/21
. . Year . . Ended 10/31/20 10/31/19 10/31/18 10/31/17 10/31/16
Ratios/Supplemental Data
Total return (2)(4) 27.29 % 29.63 % 17.25 % (0.02 )% 28.82 % 2.31 %
Ratios to average net assets: (2) Gross expenses before waivers/payments by Price Associates 1.10 % (5) 1.12 % 1.21 % 1.18 % 1.38 % 1.45 % Net expenses after waivers/payments by Price Associates 1.10 % (5) 1.10 % 1.10 % 1.10 % 1.11 % 1.10 % Net investment income (loss) (0.31 )% (5) (0.20 )% 0.21 % (0.02 )% 0.17 % 0.36 %
Portfolio turnover rate 32.3 % 85.4 % 66.3 % 120.0 % 69.7 % 73.3 % Net assets, end of period (in thousands) $15,246 $13,668 $3,637 $2,363 $1,960 $1,373
0 % 0 % 0 % 0 % 0 % 0 %
(1) Per share amounts calculated using average shares outstanding method. (2) See Note 7 for details of expense-related arrangements with Price Associates. (3) Amounts round to less than $0.01 per share. (4) Total return refl ects the rate that an investor would have earned on an investment in the fund
during each period, assuming reinvestment of all distributions, and payment of no redemption or account fees, if applicable. Total return is not annualized for periods less than one year.
(5) Annualized

srgle_0421_P4Proof #
19
T. ROWE PRICE GlObAl GROWTh STOCk Fund
unaudited
FINANCIAL HIGHLIGHTS
For a share outstanding throughout each period
I Class (1)
6 Months . Ended 4/ 30/21
. . Year . . Ended
3/6/17 (1) Through 10/31/17 10/31/20 10/31/19 10/31/18
NET ASSET VALUE Beginning of period $ 37.16 $ 28.66 $ 24.81 $ 24.97 $ 20.65
Investment activities Net investment income (2)(3) 0.02 0.09 0.16 0.09 0.02 Net realized and unrealized gain/loss 10.09 8.49 4.15 — (4) 4.30 Total from investment activities 10.11 8.58 4.31 0.09 4.32
Distributions Net investment income (0.07 ) (0.08 ) (0.06 ) (0.03 ) — Net realized gain (1.32 ) — (0.40 ) (0.22 ) — Total distributions (1.39 ) (0.08 ) (0.46 ) (0.25 ) —
NET ASSET VALUE End of period $ 45.88 $ 37.16 $ 28.66 $ 24.81 $ 24.97

srgle_0421_P4Proof #
20
The accompanying notes are an integral part of these financial statements.
T. ROWE PRICE GlObAl GROWTh STOCk Fund
unaudited
FINANCIAL HIGHLIGHTS
For a share outstanding throughout each period
I Class (1)
6 Months . Ended 4/ 30/21
. . Year . . Ended
3/6/17 (1) Through 10/31/17 10/31/20 10/31/19 10/31/18
Ratios/Supplemental Data
Total return (3)(5) 27.57 % 30.00 % 17.78 % 0.33 % 20.92 %
Ratios to average net assets: (3) Gross expenses before waivers/payments by Price Associates 0.68 % (6) 0.69 % 0.72 % 0.74 % 0.89 % (6) Net expenses after waivers/payments by Price Associates 0.68 % (6) 0.69 % 0.69 % 0.68 % 0.70 % (6) Net investment income 0.10 % (6) 0.27 % 0.59 % 0.32 % 0.20 % (6)
Portfolio turnover rate 32.3 % 85.4 % 66.3 % 120.0 % 69.7 % Net assets, end of period (in thousands) $890,099 $659,189 $262,632 $211,811 $34,109
0 % 0 % 0 % 0 % 0 %
(1) Inception date (2) Per share amounts calculated using average shares outstanding method. (3) See Note 7 for details of expense-related arrangements with Price Associates. (4) Amounts round to less than $0.01 per share. (5) Total return refl ects the rate that an investor would have earned on an investment in the fund
during each period, assuming reinvestment of all distributions, and payment of no redemption or account fees, if applicable. Total return is not annualized for periods less than one year.
(6) Annualized

srgle_0421_P4Proof #
21
T. ROWE PRICE GlObAl GROWTh STOCk Fund
April 30, 2021 (unaudited)
PORTFOLIO OF INVESTMENTS‡ Shares
$ Value
( Cost and value in $000s) ‡
ARGENTINA 0.5% Common Stocks 0.5%
MercadoLibre (USD) (1) 4,884 7,673
Total Argentina (Cost $2,630 ) 7,673 BRAZIL 1.6%
Common Stocks 1.6%
Magazine Luiza 1,683,116 6,212 Rede D'Or Sao Luiz 432,801 5,614 StoneCo , Class A (USD) (1) 97,153 6,280 XP, Class A (USD) (1) 188,228 7,454
Total Brazil (Cost $18,930 ) 25,560 CANADA 1.9%
Common Stocks 1.9%
Brookfi eld Asset Management, Class A (USD) 268,636 12,244 Shopify, Class A (USD) (1) 7,435 8,792 Sun Life Financial (USD) 180,153 9,718
Total Canada (Cost $16,980 ) 30,754 CAYMAN ISLANDS 0.4%
Common Stocks 0.2%
ANT International, Class C, Acquisition Date: 6/7/18, Cost $2,115 (USD) (1)(2)(3) 377,026 3,043
3,043 Convertible Preferred Stocks 0.2%
ByteDance , Series E, Acquisition Date: 7/8/19, Cost $1,291 (USD) (1)(2)(3) 26,185 4,131
4,131
Total Cayman Islands (Cost $3,406 ) 7,174 CHINA 6.7%
Common Stocks 5.8%
Alibaba Group Holding, ADR (USD) (1) 97,349 22,483 Alibaba Health Information Technology (HKD) (1) 1,876,000 5,710 China Resources Beer Holdings (HKD) 634,000 5,107

srgle_0421_P4Proof #
22
T. ROWE PRICE GlObAl GROWTh STOCk Fund
Shares
$ Value
( Cost and value in $000s)
China Resources Mixc Lifestyle Services (HKD) (1) 951,000 5,579 GDS Holdings, Class A (HKD) (1) 727,077 7,517 JD Health International (HKD) (1)(4) 280,050 4,324 JD.com, ADR (USD) (1) 85,735 6,632 KE Holdings, ADR (USD) (1) 114,826 5,977 Kuaishou Technology (HKD) (1) 61,900 2,096 MINISO Group Holding, ADR (USD) (1)(4) 194,394 5,229 Tencent Holdings (HKD) 179,200 14,295 Wuxi Biologics Cayman (HKD) (1) 355,000 4,983 Yatsen Holding, ADR (USD) (1)(4) 403,705 4,207
94,139 Common Stocks - China A Shares 0.9%
Gree Electric Appliances of Zhuhai, A Shares (CNH) 817,780 7,542 NARI Technology, A Shares (CNH) 1,327,900 6,534
14,076
Total China (Cost $84,862 ) 108,215 DENMARK 0.5%
Common Stocks 0.5%
Genmab , ADR (USD) (1) 113,075 4,169 Orsted 30,343 4,411
Total Denmark (Cost $9,703 ) 8,580 FRANCE 1.2%
Common Stocks 1.2%
EssilorLuxottica 42,358 7,050 Eurofi ns Scientifi c (1) 118,397 11,726
Total France (Cost $11,570 ) 18,776 GERMANY 6.5%
Common Stocks 6.1%
Delivery Hero (1) 77,783 12,339 Evotec (1) 543,358 22,602 fl atexDEGIRO (1) 50,919 6,521 Infi neon Technologies 253,430 10,163 Shop Apotheke Europe (1)(4) 26,045 5,367 Siemens 57,658 9,619 Symrise 86,861 11,217 TeamViewer (1) 117,969 5,607

srgle_0421_P4Proof #
23
T. ROWE PRICE GlObAl GROWTh STOCk Fund
Shares
$ Value
( Cost and value in $000s)
Zalando (1) 144,422 15,020
98,455 Preferred Stocks 0.4%
Sartorius (5) 13,125 7,406
7,406
Total Germany (Cost $66,234 ) 105,861 HONG KONG 0.7%
Common Stocks 0.7%
AIA Group 535,400 6,796 Galaxy Entertainment Group (1) 550,000 4,828
Total Hong Kong (Cost $8,144 ) 11,624 INDIA 4.4%
Common Stocks 4.0%
Axis Bank (1) 702,696 6,724 Britannia Industries 81,468 3,783 Godrej Consumer Products (1) 329,162 3,068 Havells India 388,132 5,151 HDFC Asset Management 73,463 2,747 HDFC Bank (1) 328,968 6,253 HDFC Bank, ADR (USD) (1) 89,560 6,294 Housing Development Finance 188,142 6,160 Kotak Mahindra Bank (1) 467,381 10,973 One97 Communications, Series G, Acquisition Date: 12/3/19, Cost $1,563 (USD) (1)(2)(3) 6,139 1,565 Pidilite Industries (1) 180,081 4,404 Think & Learn, Acquisition Date: 12/23/20 - 1/15/21, Cost $1,309 (1)(2)(3) 821 2,631 United Spirits (1) 739,304 5,161
64,914 Convertible Preferred Stocks 0.4%
Think & Learn, Series F, Acquisition Date: 12/23/20 - 4/29/21, Cost $6,344 (1)(2)(3) 1,977 6,335
6,335
Total India (Cost $53,643 ) 71,249

srgle_0421_P4Proof #
24
T. ROWE PRICE GlObAl GROWTh STOCk Fund
Shares
$ Value
( Cost and value in $000s)
INDONESIA 1.1% Common Stocks 1.1%
Bank Central Asia 3,310,100 7,328 Kalbe Farma 25,053,800 2,497 Sumber Alfaria Trijaya 76,524,000 5,031 Unilever Indonesia 5,651,100 2,346
Total Indonesia (Cost $13,864 ) 17,202 ITALY 0.3%
Common Stocks 0.3%
DiaSorin 27,470 4,665
Total Italy (Cost $5,375 ) 4,665 JAPAN 1.0%
Common Stocks 1.0%
Daiichi Sankyo 79,100 2,020 Keyence 13,100 6,289 Recruit Holdings 89,100 4,017 Sumitomo Metal Mining 104,200 4,412
Total Japan (Cost $9,667 ) 16,738 NETHERLANDS 1.7%
Common Stocks 1.7%
Adyen (1) 2,512 6,182 Argenx , ADR (USD) (1) 22,502 6,451 ASML Holding (USD) 13,129 8,509 Koninklijke DSM 36,284 6,506
Total Netherlands (Cost $13,520 ) 27,648 NIGERIA 0.1%
Common Stocks 0.1%
Nestle Nigeria 517,381 1,817
Total Nigeria (Cost $1,876 ) 1,817

srgle_0421_P4Proof #
25
T. ROWE PRICE GlObAl GROWTh STOCk Fund
Shares
$ Value
( Cost and value in $000s)
PERU 0.5% Common Stocks 0.5%
Credicorp (USD) 23,055 2,753 InRetail Peru (USD) 161,716 5,724
Total Peru (Cost $6,297 ) 8,477 PHILIPPINES 1.1%
Common Stocks 1.1%
Ayala Land 3,310,400 2,208 BDO Unibank 1,889,823 4,042 SM Investments 291,796 5,823 Universal Robina 2,245,170 6,382
Total Philippines (Cost $17,854 ) 18,455 PORTUGAL 0.2%
Common Stocks 0.2%
Galp Energia 226,363 2,606
Total Portugal (Cost $2,459 ) 2,606 SINGAPORE 0.8%
Common Stocks 0.8%
Sea, ADR (USD) (1) 52,870 13,352
Total Singapore (Cost $595 ) 13,352 SOUTH AFRICA 0.3%
Common Stocks 0.3%
Naspers, N Shares 23,587 5,368
Total South Africa (Cost $4,126 ) 5,368 SOUTH KOREA 0.3%
Common Stocks 0.3%
Coupang (USD) (1)(4) 132,213 5,540
Total South Korea (Cost $6,212 ) 5,540

srgle_0421_P4Proof #
26
T. ROWE PRICE GlObAl GROWTh STOCk Fund
Shares
$ Value
( Cost and value in $000s)
SPAIN 0.4% Common Stocks 0.4%
Cellnex Telecom 107,176 6,062
Total Spain (Cost $5,851 ) 6,062 SWEDEN 0.9%
Common Stocks 0.9%
Assa Abloy , B Shares (4) 275,891 7,866 Hexagon, B Shares (4) 65,214 6,229
Total Sweden (Cost $8,312 ) 14,095 SWITZERLAND 2.0%
Common Stocks 2.0%
Julius Baer Group 82,665 5,203 Lonza Group 18,279 11,620 Partners Group Holding 5,516 7,857 Zurich Insurance Group 17,357 7,121
Total Switzerland (Cost $22,958 ) 31,801 TAIWAN 0.4%
Common Stocks 0.4%
Taiwan Semiconductor Manufacturing, ADR (USD) 53,787 6,279
Total Taiwan (Cost $6,616 ) 6,279 UNITED KINGDOM 7.3%
Common Stocks 7.3%
Ashtead Group 127,601 8,198 ASOS (1) 126,077 9,089 AstraZeneca, ADR (USD) (4) 196,013 10,402 boohoo Group (1) 1,607,119 7,543 Derwent London 114,834 5,282 Experian 312,754 12,057 Farfetch , Class A (USD) (1) 153,053 7,498 Hargreaves Lansdown 103,258 2,452 HomeServe 362,136 5,473 London Stock Exchange Group 102,358 10,458 Mondi 157,352 4,271

srgle_0421_P4Proof #
27
T. ROWE PRICE GlObAl GROWTh STOCk Fund
Shares
$ Value
( Cost and value in $000s)
Next (1) 40,812 4,398 Ocado Group (1) 238,515 6,905 Rentokil Initial 1,086,282 7,508 THG (1) 955,362 8,178 Unilever 137,468 8,052
Total United Kingdom (Cost $90,048 ) 117,764 UNITED STATES 56.2%
Common Stocks 54.3%
Agilent Technologies 43,947 5,873 Albemarle 37,498 6,306 Alnylam Pharmaceuticals (1) 13,681 1,924 Alphabet, Class C (1) 17,620 42,466 Altimeter Growth Corp. SPAC / Grab Holdings PIPE (1)(6) 1,067,832 12,792 Amazon.com (1) 15,141 52,500 American Campus Communities, REIT 97,125 4,391 Amphenol, Class A 91,700 6,175 Apple 141,303 18,576 Atlassian , Class A (1) 34,342 8,158 Avalara (1) 36,360 5,153 AvalonBay Communities, REIT 44,155 8,478 Bill.com Holdings (1) 14,900 2,304 Charles Schwab 255,301 17,973 Chart Industries (1) 25,266 4,058 Chubb 52,992 9,093 Cigna 52,809 13,150 Clorox 21,237 3,876 CoStar Group (1) 5,152 4,402 Coupa Software (1) 29,592 7,961 Crowdstrike Holdings, Class A (1) 25,696 5,358 Danaher 61,805 15,695 Datadog , Class A (1) 55,264 4,740 DocuSign (1) 33,575 7,485 DoorDash , Class A (1)(4) 14,855 2,127 Eli Lilly 49,695 9,083 EOG Resources 55,586 4,093 EPAM Systems (1) 13,616 6,233 Epic Games, Acquisition Date: 6/18/20 - 3/29/21, Cost $4,620 (1)(2)(3) 7,370 6,522 Estee Lauder, Class A 21,025 6,598 Etsy (1) 54,729 10,880 Facebook, Class A (1) 82,168 26,711 FedEx 56,968 16,538 Fiserv (1) 98,741 11,861

srgle_0421_P4Proof #
28
T. ROWE PRICE GlObAl GROWTh STOCk Fund
Shares
$ Value
( Cost and value in $000s)
Fortinet (1) 35,001 7,148 General Electric 910,768 11,949 Global Payments 56,485 12,123 Goldman Sachs Group 41,564 14,483 HCA Healthcare 26,810 5,390 IDEX 29,986 6,723 Incyte (1) 54,834 4,682 International Paper 103,473 6,001 Intuit 29,740 12,258 Intuitive Surgical (1) 9,459 8,182 KKR 227,564 12,876 Linde 40,281 11,514 Live Nation Entertainment (1) 81,600 6,681 Manhattan Associates (1) 29,300 4,021 MarketAxess Holdings 12,247 5,982 Marsh & McLennan 68,065 9,236 Microsoft 61,482 15,505 MongoDB (1) 16,962 5,045 Morgan Stanley 157,096 12,968 Netfl ix (1) 17,413 8,941 NextEra Energy 196,723 15,248 NVIDIA 5,345 3,209 Okta (1) 23,230 6,265 Packaging Corp. of America 50,503 7,457 Paycom Software (1) 11,927 4,585 PayPal Holdings (1) 14,640 3,840 Peloton Interactive, Class A (1) 77,027 7,576 Pinterest, Class A (1) 94,000 6,239 Quidel (1) 53,697 5,627 Roper Technologies 43,189 19,281 salesforce.com (1) 45,910 10,574 Sempra Energy 91,197 12,546 ServiceNow (1) 16,813 8,514 Signature Bank 31,996 8,047 Snap, Class A (1) 177,302 10,961 Snowfl ake, Class A (1) 25,932 6,006 Splunk (1) 34,892 4,411 Stripe, Class B, Acquisition Date: 12/17/19, Cost $296 (1)(2)(3) 18,846 756 Stryker 30,189 7,929 Synopsys (1) 17,700 4,373 Teladoc Health (1) 18,280 3,151 Teledyne Technologies (1) 22,234 9,955 Tesla (1) 6,671 4,733 Thermo Fisher Scientifi c 19,489 9,164 Tradeweb Markets, Class A 99,320 8,073 Trimble (1) 72,267 5,926

srgle_0421_P4Proof #
29
T. ROWE PRICE GlObAl GROWTh STOCk Fund
Shares
$ Value
( Cost and value in $000s)
UiPath , Class A, Acquisition Date: 4/26/19 - 2/2/21, Cost $2,436 (1)(3) 97,478 6,667 UiPath , Class A (1)(4) 30,795 2,217 UnitedHealth Group 22,284 8,887 Veeva Systems, Class A (1) 27,640 7,807 Vertex Pharmaceuticals (1) 32,134 7,012 Visa, Class A 69,745 16,290 Waste Connections 123,959 14,765 Wayfair, Class A (1) 30,885 9,129 Wells Fargo 396,561 17,865 Welltower , REIT 114,743 8,609 Weyerhaeuser, REIT 84,015 3,257 Wix.com (1) 10,605 3,371 Workday, Class A (1) 30,233 7,468 Zendesk (1) 23,931 3,497 Zoom Video Communications, Class A (1) 45,500 14,540
877,068 Convertible Preferred Stocks 1.9%
Aurora Innovation, Series B, Acquisition Date: 3/1/19, Cost $605 (1)(2)(3) 65,500 1,287 Magic Leap, Series D, Acquisition Date: 10/12/17, Cost $1,153 (1)(2)(3) 42,712 115 Rappi , Series E, Acquisition Date: 9/8/20, Cost $4,762 (1)(2)(3) 79,700 4,762 Rivian Automotive, Series E, Acquisition Date: 7/10/20, Cost $5,756 (1)(2)(3) 371,582 13,693 Rivian Automotive, Series F, Acquisition Date: 1/19/21, Cost $3,561 (1)(2)(3) 96,627 3,561 Sila Nano, Series F, Acquisition Date: 1/7/21, Cost $846 (1)(2)(3) 20,496 846 SpaceX , Series K, Acquisition Date: 5/21/19, Cost $2,163 (1)(2)(3) 10,605 4,454 Waymo , Series A-2, Acquisition Date: 5/8/20, Cost $2,587 (1)(2)(3) 30,126 2,587
31,305
Total United States (Cost $594,500 ) 908,373 VIETNAM 0.9%
Common Stocks 0.9%
Masan Group 2,174,975 9,214 Military Commercial Joint Stock Bank (1) 3,943,261 5,300
Total Vietnam (Cost $10,099 ) 14,514

srgle_0421_P4Proof #
30
T. ROWE PRICE GlObAl GROWTh STOCk Fund
Shares
$ Value
( Cost and value in $000s)
SHORT-TERM INVESTMENTS 0.4%
Money Market Funds 0.4%
T. Rowe Price Government Reserve Fund, 0.02% (7)(8) 6,598,629 6,599
Total Short-Term Investments (Cost $6,599) 6,599
SECURITIES LENDING COLLATERAL 2.6%
INVESTMENTS IN A POOLED ACCOUNT THROUGH SECURITIES LENDING PROGRAM WITH JPMORGAN CHASE BANK 2.6%
Short-Term Funds 2.6%
T. Rowe Price Short-Term Fund, 0.09% (7)(8) 4,133,962 41,340
Total Investments in a Pooled Account through Securities Lending Program with JPMorgan Chase Bank 41,340
Total Securities Lending Collateral (Cost $41,340) 41,340
Total Investments in Securities
102.9% of Net Assets (Cost $1,144,270) $ 1,664,161
‡ Country classifi cations are generally based on MSCI categories or another unaffi liated third party data provider; Shares are denominated in the currency of the country presented unless otherwise noted.
(1) Non-income producing (2) See Note 2. Level 3 in fair value hierarchy. (3) Security cannot be off ered for public resale without fi rst being registered under
the Securities Act of 1933 and related rules ("restricted security"). Acquisition date represents the day on which an enforceable right to acquire such security is obtained and is presented along with related cost in the security description. The fund has registration rights for certain restricted securities. Any costs related to such registration are borne by the issuer. The aggregate value of restricted securities (excluding 144A holdings) at period end amounts to $62,955 and represents 3.9% of net assets.
(4) See Note 3. All or a portion of this security is on loan at April 30, 2021. (5) Preferred stocks are shares that carry certain preferential rights. The dividend
rate may not be consistent each pay period and could be zero for a particular year.
(6) A portion of the position represents an unfunded commitment; a liability to fund the commitment has been recognized. The fund's total unfunded commitment at April 30, 2021, was $10,678 and was valued at $12,792 (0.8% of net assets).
(7) Seven-day yield (8) Affi liated Companies

srgle_0421_P4Proof #
31
T. ROWE PRICE GlObAl GROWTh STOCk Fund
ADR American Depositary Receipts CNH Off shore China Renminbi HKD Hong Kong Dollar PIPE Private Investment in Public Equity REIT A domestic Real Estate Investment Trust whose distributions pass-through with
original tax character to the shareholder SPAC Special Purpose Acquisition Company USD U.S. Dollar

srgle_0421_P4Proof #
32
T. ROWE PRICE GlObAl GROWTh STOCk Fund
The accompanying notes are an integral part of these financial statements.
AFFILIATED COMPANIES
($000s) The fund may invest in certain securities that are considered affi liated companies. As defi ned by the 1940 Act, an affi liated company is one in which the fund owns 5% or more of the outstanding voting securities, or a company that is under common ownership or control. The following securities were considered affi liated companies for all or some portion of the six months ended April 30, 2021. Net realized gain (loss), investment income, change in net unrealized gain/loss, and purchase and sales cost refl ect all activity for the period then ended.
Affi liate Net Realized
Gain (Loss)
Change in Net Unrealized Gain/Loss
Investment Income
T. Rowe Price Government Reserve Fund, 0.02% $ — $ — $ 1 T. Rowe Price Short-Term Fund, 0.09% — — — ++
Totals $ — # $ — $ 1 +
Supplementary Investment Schedule
Affi liate Value
10/31/20 Purchase
Cost Sales Cost
Value 04/30/21
T. Rowe Price Government Reserve Fund, 0.02% $ 6,981 ¤ ¤ $ 6,599 T. Rowe Price Short-Term Fund, 0.09% 30,371 ¤ ¤ 41,340
Total $ 47,939 ̂
# Capital gain distributions from mutual funds represented $0 of the net realized gain (loss). ++ Excludes earnings on securities lending collateral, which are subject to rebates and fees as
described in Note 3. + Investment income comprised $1 of dividend income and $0 of interest income. ¤ Purchase and sale information not shown for cash management funds. ̂ The cost basis of investments in affi liated companies was $47,939.

srgle_0421_P4Proof #
33
T. ROWE PRICE GlObAl GROWTh STOCk Fund
April 30, 2021 (unaudited)
STATEMENT OF ASSETS AND LIABILITIES
($000s, except shares and per share amounts)
Assets Investments in securities, at value (cost $1,144,270) $ 1,664,161 Receivable for investment securities sold 6,253 Receivable for shares sold 4,415 Foreign currency (cost $899) 899 Dividends receivable 767 Cash 230 Other assets 613 Total assets 1,677,338
Liabilities Obligation to return securities lending collateral 41,340 Payable for investment securities purchased 16,342 Investment management fees payable 844 Payable for shares redeemed 174 Due to affi liates 59 Other liabilities 1,553 Total liabilities 60,312
NET ASSETS $ 1,617,026

srgle_0421_P4Proof #
34
T. ROWE PRICE GlObAl GROWTh STOCk Fund
April 30, 2021 (unaudited)
The accompanying notes are an integral part of these financial statements.
STATEMENT OF ASSETS AND LIABILITIES
($000s, except shares and per share amounts)
Net Assets Consist of: Total distributable earnings (loss) $ 587,332 Paid-in capital applicable to 35,288,792 shares of $0.01 par value capital stock outstanding; 18,000,000,000 shares of the Corporation authorized 1,029,694
NET ASSETS $ 1,617,026
NET ASSET VALUE PER SHARE
Investor Class ($711,680,911 / 15,550,412 shares outstanding) $ 45.77 Advisor Class ($15,246,316 / 336,043 shares outstanding) $ 45.37 I Class ($890,098,703 / 19,402,337 shares outstanding) $ 45.88

srgle_0421_P4Proof #
35
T. ROWE PRICE GlObAl GROWTh STOCk Fund
unaudited
STATEMENT OF OPERATIONS
($000s)
6 Months Ended
4/30/21 Investment Income (Loss) Income
Dividend (net of foreign taxes of $411) $ 5,692 Securities lending 110 Total income 5,802
Expenses Investment management 4,700 Shareholder servicing
Investor Class $ 478 Advisor Class 12 I Class 2 492
Rule 12b-1 fees Advisor Class 18
Prospectus and shareholder reports Investor Class 5 I Class 2 7
Custody and accounting 121 Registration 78 Legal and audit 45 Directors 2 Miscellaneous 26 Repaid to Price Associates 38 Total expenses 5,527
Net investment income 275
Realized and Unrealized Gain / Loss – Net realized gain (loss)
Securities (net of foreign taxes of $1) 88,295 Foreign currency transactions (18 ) Net realized gain 88,277
srgle_0421_P4Proof #
36
T. ROWE PRICE GlObAl GROWTh STOCk Fund
unaudited
The accompanying notes are an integral part of these financial statements.
STATEMENT OF OPERATIONS
($000s)
6 Months Ended
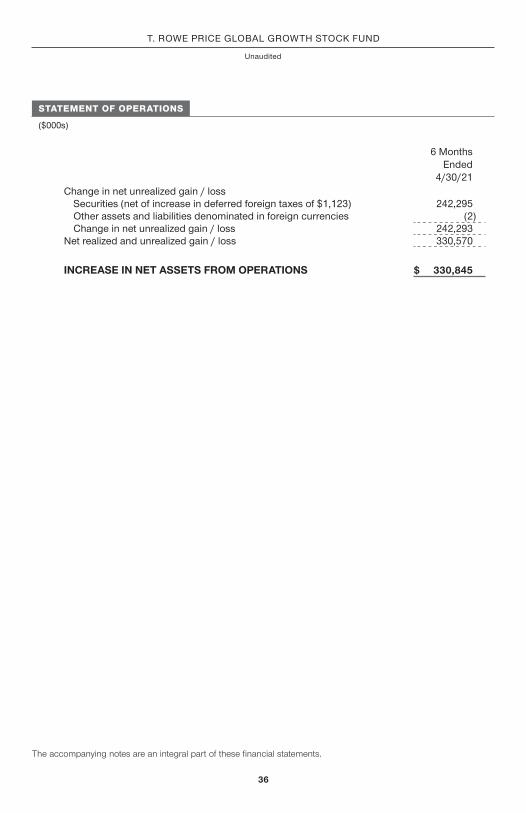
4/30/21 Change in net unrealized gain / loss
Securities (net of increase in deferred foreign taxes of $1,123) 242,295 Other assets and liabilities denominated in foreign currencies (2 ) Change in net unrealized gain / loss 242,293
Net realized and unrealized gain / loss 330,570
INCREASE IN NET ASSETS FROM OPERATIONS $ 330,845

srgle_0421_P4Proof #
37
T. ROWE PRICE GlObAl GROWTh STOCk Fund
unaudited
STATEMENT OF CHANGES IN NET ASSETS
($000s)
6 Months Ended
4/30/21
Year Ended
10/31/20 Increase (Decrease) in Net Assets Operations
Net investment income $ 275 $ 1,689 Net realized gain 88,277 54,778 Change in net unrealized gain / loss 242,293 169,269 Increase in net assets from operations 330,845 225,736
Distributions to shareholders Net earnings
Investor Class (18,755 ) (562 ) Advisor Class (530 ) (7 ) I Class (24,754 ) (1,273 )
Decrease in net assets from distributions (44,039 ) (1,842 )
Capital share transactions * Shares s old
Investor Class 270,337 246,068 Advisor Class 3,529 10,162 I Class 124,428 181,557
Shares issued in connection with fund acquisition - I Class – 151,133 Distributions reinvested
Investor Class 17,489 532 Advisor Class 530 7 I Class 24,748 1,272
Shares redeemed Investor Class (183,769 ) (74,716 ) Advisor Class (5,510 ) (1,901 ) I Class (77,181 ) (75,291 )
Increase in net assets from capital share transactions 174,601 438,823

srgle_0421_P4Proof #
38
T. ROWE PRICE GlObAl GROWTh STOCk Fund
unaudited
The accompanying notes are an integral part of these financial statements.
STATEMENT OF CHANGES IN NET ASSETS
($000s)
6 Months Ended
4/30/21
Year Ended
10/31/20 Net Assets Increase during period 461,407 662,717 Beginning of period 1,155,619 492,902 End of period $ 1,617,026 $ 1,155,619
*Share information Shares sold
Investor Class 6,212 7,448 Advisor Class 82 311 I Class 2,838 5,625
Shares issued in connection with fund acquisition - I Class – 5,163 Distributions reinvested
Investor Class 419 18 Advisor Class 13 – I Class 592 42
Shares redeemed Investor Class (4,106 ) (2,366 ) Advisor Class (131 ) (67 ) I Class (1,767 ) (2,255 )
Increase in shares outstanding 4,152 13,919

srgle_0421_P4Proof #
39
T. ROWE PRICE GlObAl GROWTh STOCk Fund
unaudited
NOTES TO FINANCIAL STATEMENTS
T. Rowe Price International Funds, Inc. (the corporation) is registered under the Investment Company Act of 1940 (the 1940 Act). The Global Growth Stock Fund (the fund) is a diversified , open-end management investment company established by the corporation. The fund seeks long-term growth of capital through investments primarily in the common stocks of large-cap companies throughout the world, including the U.S. The fund has three classes of shares: the Global Growth Stock Fund (Investor Class), the Global Growth Stock Fund–Advisor Class (Advisor Class), and the Global Growth Stock Fund–I Class (I Class). Advisor Class shares are sold only through various brokers and other financial intermediaries. I Class shares require a $1 million initial investment minimum, although the minimum generally is waived for retirement plans, financial intermediaries, and certain other accounts. The Advisor Class operates under a Board-approved Rule 12b-1 plan pursuant to which the class compensates financial intermediaries for distribution, shareholder servicing, and/or certain administrative services; the Investor and I Classes do not pay Rule 12b-1 fees. Each class has exclusive voting rights on matters related solely to that class; separate voting rights on matters that relate to all classes; and, in all other respects, the same rights and obligations as the other classes.
NOTE 1 - SIGNIFICANT ACCOUNTING POLICIES
Basis of Preparation The fund is an investment company and follows accounting and reporting guidance in the Financial Accounting Standards Board (FASB) Accounting Standards Codification Topic 946 (ASC 946). The accompanying financial statements were prepared in accordance with accounting principles generally accepted in the United States of America (GAAP), including, but not limited to, ASC 946. GAAP requires the use of estimates made by management. Management believes that estimates and valuations are appropriate; however, actual results may differ from those estimates, and the valuations reflected in the accompanying financial statements may differ from the value ultimately realized upon sale or maturity.
Investment Transactions, Investment Income, and Distributions Investment transactions are accounted for on the trade date basis. Income and expenses are recorded on the accrual basis. Realized gains and losses are reported on the identified cost basis. Income tax-related interest and penalties, if incurred, are recorded as income tax expense. Dividends received from mutual fund investments are reflected as dividend income; capital gain distributions are reflected as realized gain/loss. Dividend income and capital gain distributions are recorded on the ex-dividend date. Distributions from REITs are initially recorded as dividend income and, to the extent such represent a

srgle_0421_P4Proof #
40
T. ROWE PRICE GlObAl GROWTh STOCk Fund
return of capital or capital gain for tax purposes, are reclassified when such information becomes available. Non-cash dividends, if any, are recorded at the fair market value of the asset received. Distributions to shareholders are recorded on the ex-dividend date. Income distributions, if any, are declared and paid by each class annually. A capital gain distribution may also be declared and paid by the fund annually.
Currency Translation Assets, including investments, and liabilities denominated in foreign currencies are translated into U.S. dollar values each day at the prevailing exchange rate, using the mean of the bid and asked prices of such currencies against U.S. dollars as quoted by a major bank. Purchases and sales of securities, income, and expenses are translated into U.S. dollars at the prevailing exchange rate on the respective date of such transaction. The effect of changes in foreign currency exchange rates on realized and unrealized security gains and losses is not bifurcated from the portion attributable to changes in market prices.
Class Accounting Shareholder servicing, prospectus, and shareholder report expenses incurred by each class are charged directly to the class to which they relate. Expenses common to all classes, investment income, and realized and unrealized gains and losses are allocated to the classes based upon the relative daily net assets of each class. The Advisor Class pays Rule 12b-1 fees, in an amount not exceeding 0.25% of the class’s average daily net assets.
Capital Transactions Each investor’s interest in the net assets of the fund is represented by fund shares. The fund’s net asset value (NAV) per share is computed at the close of the New York Stock Exchange (NYSE), normally 4 p.m. ET, each day the NYSE is open for business. However, the NAV per share may be calculated at a time other than the normal close of the NYSE if trading on the NYSE is restricted, if the NYSE closes earlier, or as may be permitted by the SEC. Purchases and redemptions of fund shares are transacted at the next-computed NAV per share, after receipt of the transaction order by T. Rowe Price Associates, Inc., or its agents.
Indemnification In the normal course of business, the fund may provide indemnification in connection with its officers and directors, service providers, and/or private company investments. The fund’s maximum exposure under these arrangements is unknown; however, the risk of material loss is currently considered to be remote.

srgle_0421_P4Proof #
41
T. ROWE PRICE GlObAl GROWTh STOCk Fund
NOTE 2 - VALUATION
Fair Value The fund’s financial instruments are valued at the close of the NYSE and are reported at fair value, which GAAP defines as the price that would be received to sell an asset or paid to transfer a liability in an orderly transaction between market participants at the measurement date. The T. Rowe Price Valuation Committee (the Valuation Committee) is an internal committee that has been delegated certain responsibilities by the fund’s Board of Directors (the Board) to ensure that financial instruments are appropriately priced at fair value in accordance with GAAP and the 1940 Act. Subject to oversight by the Board, the Valuation Committee develops and oversees pricing-related policies and procedures and approves all fair value determinations. Specifically, the Valuation Committee establishes policies and procedures used in valuing financial instruments, including those which cannot be valued in accordance with normal procedures or using pricing vendors; determines pricing techniques, sources, and persons eligible to effect fair value pricing actions; evaluates the services and performance of the pricing vendors; oversees the pricing process to ensure policies and procedures are being followed; and provides guidance on internal controls and valuation-related matters. The Valuation Committee provides periodic reporting to the Board on valuation matters.
Various valuation techniques and inputs are used to determine the fair value of financial instruments. GAAP establishes the following fair value hierarchy that categorizes the inputs used to measure fair value:
Level 1 – quoted prices (unadjusted) in active markets for identical financial instruments that the fund can access at the reporting date
Level 2 – inputs other than Level 1 quoted prices that are observable, either directly or indirectly (including, but not limited to, quoted prices for similar financial instruments in active markets, quoted prices for identical or similar financial instruments in inactive markets, interest rates and yield curves, implied volatilities, and credit spreads)
Level 3 – unobservable inputs (including the fund's own assumptions in determining fair value)
Observable inputs are developed using market data, such as publicly available information about actual events or transactions, and reflect the assumptions that market participants would use to price the financial instrument. Unobservable inputs are those for which market data are not available and are developed using the best information available about the assumptions that market participants would use to price the financial instrument. GAAP requires valuation techniques to maximize the use of relevant observable inputs and minimize the use of unobservable inputs. When multiple inputs

srgle_0421_P4Proof #
42
T. ROWE PRICE GlObAl GROWTh STOCk Fund
are used to derive fair value, the financial instrument is assigned to the level within the fair value hierarchy based on the lowest-level input that is significant to the fair value of the financial instrument. Input levels are not necessarily an indication of the risk or liquidity associated with financial instruments at that level but rather the degree of judgment used in determining those values.
Valuation Techniques Equity securities, including exchange-traded funds, listed or regularly traded on a securities exchange or in the over-the-counter (OTC) market are valued at the last quoted sale price or, for certain markets, the official closing price at the time the valuations are made. OTC Bulletin Board securities are valued at the mean of the closing bid and asked prices. A security that is listed or traded on more than one exchange is valued at the quotation on the exchange determined to be the primary market for such security. Listed securities not traded on a particular day are valued at the mean of the closing bid and asked prices for domestic securities and the last quoted sale or closing price for international securities.
The last quoted prices of non-U.S. equity securities may be adjusted to reflect the fair value of such securities at the close of the NYSE, if the fund determines that developments between the close of a foreign market and the close of the NYSE will affect the value of some or all of its portfolio securities. Each business day, the fund uses information from outside pricing services to evaluate and, if appropriate, decide whether it is necessary to adjust quoted prices to reflect fair value by reviewing a variety of factors, including developments in foreign markets, the performance of U.S. securities markets, and the performance of instruments trading in U.S. markets that represent foreign securities and baskets of foreign securities. The fund uses outside pricing services to provide it with quoted prices and information to evaluate or adjust those prices. The fund cannot predict how often it will use quoted prices and how often it will determine it necessary to adjust those prices to reflect fair value.
Investments in mutual funds are valued at the mutual fund’s closing NAV per share on the day of valuation. Assets and liabilities other than financial instruments, including short-term receivables and payables, are carried at cost, or estimated realizable value, if less, which approximates fair value.
Investments for which market quotations or market-based valuations are not readily available or deemed unreliable are valued at fair value as determined in good faith by the Valuation Committee, in accordance with fair valuation policies and procedures. The objective of any fair value pricing determination is to arrive at a price that could reasonably be expected from a current sale. Financial instruments fair valued by the Valuation Committee are primarily private placements, restricted securities, warrants, rights, and other securities that are not publicly traded. Factors used in determining fair value vary by type of investment and may include market or investment specific

srgle_0421_P4Proof #
43
T. ROWE PRICE GlObAl GROWTh STOCk Fund
considerations. The Valuation Committee typically will afford greatest weight to actual prices in arm’s length transactions, to the extent they represent orderly transactions between market participants, transaction information can be reliably obtained, and prices are deemed representative of fair value. However, the Valuation Committee may also consider other valuation methods such as market-based valuation multiples; a discount or premium from market value of a similar, freely traded security of the same issuer; discounted cash flows; yield to maturity; or some combination. Fair value determinations are reviewed on a regular basis and updated as information becomes available, including actual purchase and sale transactions of the investment. Because any fair value determination involves a significant amount of judgment, there is a degree of subjectivity inherent in such pricing decisions, and fair value prices determined by the Valuation Committee could differ from those of other market participants.
Valuation Inputs The following table summarizes the fund’s financial instruments, based on the inputs used to determine their fair values on April 30, 2021 (for further detail by category, please refer to the accompanying Portfolio of Investments):
($000s) Level 1 Level 2 Level 3 Total Value
Assets
Common Stocks $ 1,018,267 $ 534,261 $ 14,517 $ 1,567,045
Convertible Preferred Stocks — — 41,771 41,771
Preferred Stocks — 7,406 — 7,406
Short-Term Investments 6,599 — — 6,599
Securities Lending Collateral 41,340 — — 41,340
Total $ 1,066,206 $ 541,667 $ 56,288 $ 1,664,161

srgle_0421_P4Proof #
44
T. ROWE PRICE GlObAl GROWTh STOCk Fund
Following is a reconciliation of the fund’s Level 3 holdings for the six months ended April 30, 2021. Gain (loss) reflects both realized and change in unrealized gain/loss on Level 3 holdings during the period, if any, and is included on the accompanying Statement of Operations. The change in unrealized gain/loss on Level 3 instruments held at April 30, 2021, totaled $15,006,000 for the six months ended April 30, 2021. During the six months, transfers into Level 3 resulted from a lack of observable market data for the security.
($000s) Beginning Balance 11/1/20
Gain (Loss) During Period
Total Purchases Total Sales
Transfer Into
Level 3
Ending Balance 4/30/21
Investment in Securities
Common Stocks $ 5,389 $ 2,836 $ 2,401 $ — $ 3,891 $ 14,517 Convertible Preferred Stocks 20,124 11,803 10,751 (907 ) — 41,771
Total $ 25,513 $ 14,639 $ 13,152 $ (907 ) $ 3,891 $ 56,288

srgle_0421_P4Proof #
45
T. ROWE PRICE GlObAl GROWTh STOCk Fund
In accordance with GAAP, the following table provides quantitative information about significant unobservable inputs used to determine the fair valuations of the fund’s Level 3 assets, by class of financial instrument. Because the Valuation Committee considers a wide variety of factors and inputs, both observable and unobservable, in determining fair values, the unobservable inputs presented do not reflect all inputs significant to the fair value determination.
Investments in Securities
Value (000s)
Valuation Technique(s)+
Signifi cant Unobservable
Input(s)
Value or Range of
Input(s)
Weighted Average of
Input(s)*
Impact to Valuation
from an Increase
in Input**
Common Stock
$ 14,517 Recent comparable transaction
price(s)
—# —# —#
Rate of return 15% 15% Increase
Convertible Preferred Stocks
$ 41,771 Recent comparable transaction
price(s)
—# —# —#
Discount for uncertainty
90% 90% Decrease
Market comparable
Enterprise value to sales
multiple
5.2x – 8.1x
6.7x Increase
Sales growth rate
32% – 38%
35% Increase
Discount for lack of
marketability
10% 10% Decrease
# No quantitative unobservable inputs significant to the valuation technique were created by the fund’s management.
* Unobservable inputs were weighted by the relative fair value of the instruments. ** Represents the directional change in the fair value of the Level 3 investment(s) that would
have resulted from an increase in the corresponding input at period end. A decrease in the unobservable input would have had the opposite effect. Significant increases and decreases in these inputs in isolation could result in significantly higher or lower fair value measurements.
+ Valuation techniques may change in order to reflect management’s judgment of current market participant assumptions.

srgle_0421_P4Proof #
46
T. ROWE PRICE GlObAl GROWTh STOCk Fund
NOTE 3 - OTHER INVESTMENT TRANSACTIONS
Consistent with its investment objective, the fund engages in the following practices to manage exposure to certain risks and/or to enhance performance. The investment objective, policies, program, and risk factors of the fund are described more fully in the fund’s prospectus and Statement of Additional Information.
Emerging and Frontier Markets The fund invests, either directly or through investments in other T. Rowe Price funds, in securities of companies located in, issued by governments of, or denominated in or linked to the currencies of emerging and frontier market countries. Emerging markets, and to a greater extent frontier markets, generally have economic structures that are less diverse and mature, and political systems that are less stable, than developed countries. These markets may be subject to greater political, economic, and social uncertainty and differing regulatory environments that may potentially impact the fund’s ability to buy or sell certain securities or repatriate proceeds to U.S. dollars. Such securities are often subject to greater price volatility, less liquidity, and higher rates of inflation than U.S. securities. Investing in frontier markets is significantly riskier than investing in other countries, including emerging markets.
Restricted Securities The fund invests in securities that are subject to legal or contractual restrictions on resale. Prompt sale of such securities at an acceptable price may be difficult and may involve substantial delays and additional costs.
Contingent Purchases The fund enters into agreements to purchase investments at a future date contingent upon the occurrence of another event (e.g., the consummation of a related transaction or a capital call). These purchase agreements generally commit the issuer to sell, and the fund to purchase, a fixed number of shares, typically of a private investment, at a specific price upon the occurrence of the event. Such purchase agreements are not included in fund assets until the fund has a legally enforceable right to the shares. Until closing of the agreement, the fund maintains liquid assets sufficient to settle its unfunded commitment.
Private Investments Issued by Special Purpose Acquisition Companies Special purpose acquisition companies (SPACs) are shell companies that have no operations but are formed to raise capital with the intention of merging with or acquiring a company with the proceeds of the SPAC’s initial public offering (“IPO”). The fund may enter into a contingent commitment with a SPAC to purchase private investments in public equity (PIPE) if and when the SPAC completes its merger or acquisition. The fund maintains liquid assets sufficient to settle its commitment to purchase the PIPE. However, if the commitment expires, then no shares a re purchased. Purchased PIPE shares will be restricted from trading until the registration statement for the shares is

srgle_0421_P4Proof #
47
T. ROWE PRICE GlObAl GROWTh STOCk Fund
declared effective. Upon registration, the shares can be freely sold; however, in certain circumstances, the issuer may have the right to temporarily suspend trading of the shares in the first year after the merger or acquisition. The securities issued by a SPAC may be considered illiquid, more difficult to value, and/or be subject to restrictions on resale.
Securities Lending The fund may lend its securities to approved borrowers to earn additional income. Its securities lending activities are administered by a lending agent in accordance with a securities lending agreement. Security loans generally do not have stated maturity dates, and the fund may recall a security at any time. The fund receives collateral in the form of cash or U.S. government securities. Collateral is maintained over the life of the loan in an amount not less than the value of loaned securities; any additional collateral required due to changes in security values is delivered to the fund the next business day. Cash collateral is invested in accordance with investment guidelines approved by fund management. Additionally, the lending agent indemnifies the fund against losses resulting from borrower default. Although risk is mitigated by the collateral and indemnification, the fund could experience a delay in recovering its securities and a possible loss of income or value if the borrower fails to return the securities, collateral investments decline in value, and the lending agent fails to perform. Securities lending revenue consists of earnings on invested collateral and borrowing fees, net of any rebates to the borrower, compensation to the lending agent, and other administrative costs. In accordance with GAAP, investments made with cash collateral are reflected in the accompanying financial statements, but collateral received in the form of securities is not. At April 30, 2021, the value of loaned securities was $39,774,000; the value of cash collateral and related investments was $41,340,000.
Other Purchases and sales of portfolio securities other than short-term securities aggregated $606,378,000 and $471,604,000, respectively, for the six months ended April 30, 2021.
NOTE 4 - FEDERAL INCOME TAXES
No provision for federal income taxes is required since the fund intends to continue to qualify as a regulated investment company under Subchapter M of the Internal Revenue Code and distribute to shareholders all of its taxable income and gains. Distributions determined in accordance with federal income tax regulations may differ in amount or character from net investment income and realized gains for financial reporting purposes. Financial reporting records are adjusted for permanent book/tax differences to reflect tax character but are not adjusted for temporary differences.

srgle_0421_P4Proof #
48
T. ROWE PRICE GlObAl GROWTh STOCk Fund
The amount and character of tax-basis distributions and composition of net assets are finalized at fiscal year-end; accordingly, tax-basis balances have not been determined as of the date of this report.
At April 30, 2021, the cost of investments for federal income tax purposes was $1,163,872,000. Net unrealized gain aggregated $498,888,000 at period-end, of which $538,154,000 related to appreciated investments and $39,266,000 related to depreciated investments.
NOTE 5 - FOREIGN TAXES
The fund is subject to foreign income taxes imposed by certain countries in which it invests. Additionally, capital gains realized upon disposition of securities issued in or by certain foreign countries are subject to capital gains tax imposed by those countries. All taxes are computed in accordance with the applicable foreign tax law, and, to the extent permitted, capital losses are used to offset capital gains. Taxes attributable to income are accrued by the fund as a reduction of income. Current and deferred tax expense attributable to capital gains is reflected as a component of realized or change in unrealized gain/loss on securities in the accompanying financial statements. To the extent that the fund has country specific capital loss carryforwards, such carryforwards are applied against net unrealized gains when determining the deferred tax liability. Any deferred tax liability incurred by the fund is included in either Other liabilities or Deferred tax liability on the accompanying Statement of Assets and Liabilities.
NOTE 6 - ACQUISITION
On November 25, 2019, the fund acquired substantially all of the assets of the Institutional Global Growth Equity Fund (the acquired fund), pursuant to the Agreement and Plan of Reorganization dated July 31, 2019. The acquired fund was available only to institutional investors and required an initial investment of $1,000,000; the same as the fund’s I Class investment minimum. The acquired fund shared a nearly identical investment program as the fund and the fund’s I Class offered a lower net expense ratio than that of the acquired fund. Accordingly, it no longer made sense to offer both funds. The Boards of the acquired fund and the fund approved the reorganization and, the Board of the acquired fund approved its liquidation and dissolution. The acquisition was accomplished by a tax-free exchange of 5,163,000 shares of the fund with a value of $151,133,000 for all 6,075,000 shares of the acquired fund then outstanding, with the same value. The exchange was based on values at the close of the NYSE on the immediately preceding business day, November 22, 2019. The net

srgle_0421_P4Proof #
49
T. ROWE PRICE GlObAl GROWTh STOCk Fund
assets of the acquired fund at that date included $39,196,000 of unrealized appreciation. Assets of the acquired fund, including securities of $143,905,000, cash of $6,982,000, and receivables and other assets of $247,000, and payables of $1,000, were combined with those of the fund, resulting in aggregate net assets of $698,135,000 immediately after the acquisition.
Pro forma results of operations of the combined entity for the entire year ended October 31, 2020, as though the acquisition had occurred as of the beginning of the year (rather than on the actual acquisition date), are as follows:
($000s)
Net investment income $ 1,669
Net realized gain (loss) 74,802
Change in net unrealized gain/loss 153,206
Increase (decrease) in net assets from operations $ 229,677
NOTE 7 - RELATED PARTY TRANSACTIONS
The fund is managed by T. Rowe Price Associates, Inc. (Price Associates), a wholly owned subsidiary of T. Rowe Price Group, Inc. (Price Group). Price Associates has entered into a sub-advisory agreement(s) with one or more of its wholly owned subsidiaries, to provide investment advisory services to the fund. The investment management agreement between the fund and Price Associates provides for an annual investment management fee, which is computed daily and paid monthly. The fee consists of an individual fund fee, equal to 0.35% of the fund’s average daily net assets, and a group fee. The group fee rate is calculated based on the combined net assets of certain mutual funds sponsored by Price Associates (the group) applied to a graduated fee schedule, with rates ranging from 0.48% for the first $1 billion of assets to 0.260% for assets in excess of $845 billion. The fund’s group fee is determined by applying the group fee rate to the fund’s average daily net assets. The fee is computed daily and paid monthly. At April 30, 2021, the effective annual group fee rate was 0.28%. Effective November 1, 2019, Price Associates agreed to permanently waive a portion of the fund’s annual investment management fee in order to limit the fund’s management fees to 0.65% of the fund’s average daily net assets. This agreement can only be modified or terminated with approval by the fund’s shareholders. The fund has no obligation to repay fees waived under this arrangement. No management fees were waived under this arrangement for the six months ended April 30, 2021.

srgle_0421_P4Proof #
50
T. ROWE PRICE GlObAl GROWTh STOCk Fund
The Investor Class was subject to a contractual expense limitation through the expense limitation date indicated in the table below. During the limitation period, Price Associates was required to waive its management fee or pay any expenses (excluding interest; expenses related to borrowings, taxes, and brokerage; and other non-recurring expenses permitted by the investment management agreement) that would have otherwise caused the class’s ratio of annualized total expenses to average net assets (net expense ratio) to exceed its expense limitation. The class is required to repay Price Associates for expenses previously waived/paid to the extent the class’s net assets grow or expenses decline sufficiently to allow repayment without causing the class’s net expense ratio (after the repayment is taken into account) to exceed the lesser of: (1) the expense limitation in place at the time such amounts were waived; or (2) the class’s current expense limitation. However, no repayment will be made more than three years after the date of a payment or waiver.
The Advisor Class is subject to a contractual expense limitation through the expense limitation date indicated in the table below. During the limitation period, Price Associates is required to waive its management fee or pay any expenses (excluding interest; expenses related to borrowings, taxes, and brokerage; and other non-recurring expenses permitted by the investment management agreement) that would otherwise cause the class’s ratio of annualized total expenses to average net assets (net expense ratio) to exceed its expense limitation. The class is required to repay Price Associates for expenses previously waived/paid to the extent the class’s net assets grow or expenses decline sufficiently to allow repayment without causing the class’s net expense ratio (after the repayment is taken into account) to exceed the lesser of: (1) the expense limitation in place at the time such amounts were waived; or (2) the class’s current expense limitation. However, no repayment will be made more than three years after the date of a payment or waiver.
The I Class is also subject to an operating expense limitation (I Class Limit) pursuant to which Price Associates is contractually required to pay all operating expenses of the I Class, excluding management fees; interest; expenses related to borrowings, taxes, and brokerage; and other non-recurring expenses permitted by the investment management agreement, to the extent such operating expenses, on an annualized basis, exceed the I Class Limit. This agreement will continue through the expense limitation date indicated in the table below, and may be renewed, revised, or revoked only with approval of the fund’s Board. The I Class is required to repay Price Associates for expenses previously paid to the extent the class’s net assets grow or expenses decline sufficiently to allow repayment without causing the class’s operating expenses (after the repayment is taken into account) to exceed the lesser of: (1) the I Class Limit in place at the time such amounts were paid; or (2) the current I Class Limit. However, no repayment will be made more than three years after the date of a payment or waiver.

srgle_0421_P4Proof #
51
T. ROWE PRICE GlObAl GROWTh STOCk Fund
Pursuant to these agreements, expenses were waived/paid by and/or repaid to Price Associates during the six months ended April 30, 2021 as indicated in the table below. Including these amounts, expenses previously waived/paid by Price Associates in the amount of $3,000 remain subject to repayment by the fund at April 30, 2021. Any repayment of expenses previously waived/paid by Price Associates during the period would be included in the net investment income and expense ratios presented on the accompanying Financial Highlights.
Investor Class Advisor Class I Class
Expense limitation/I Class Limit 1.00% 1.10% 0.05%
Expense limitation date 02/28/21 02/28/23 02/28/23
(Waived)/repaid during the period ($000s) $2 $2 $34
In addition, the fund has entered into service agreements with Price Associates and two wholly owned subsidiaries of Price Associates, each an affiliate of the fund (collectively, Price). Price Associates provides certain accounting and administrative services to the fund. T. Rowe Price Services, Inc. provides shareholder and administrative services in its capacity as the fund’s transfer and dividend-disbursing agent. T. Rowe Price Retirement Plan Services, Inc. provides subaccounting and recordkeeping services for certain retirement accounts invested in the Investor Class and Advisor Class. For the six months ended April 30, 2021, expenses incurred pursuant to these service agreements were $34,000 for Price Associates; $192,000 for T. Rowe Price Services, Inc.; and $6,000 for T. Rowe Price Retirement Plan Services, Inc. All amounts due to and due from Price, exclusive of investment management fees payable, are presented net on the accompanying Statement of Assets and Liabilities.
The fund may invest its cash reserves in certain open-end management investment companies managed by Price Associates and considered affiliates of the fund: the T. Rowe Price Government Reserve Fund or the T. Rowe Price Treasury Reserve Fund, organized as money market funds, or the T. Rowe Price Short-Term Fund, a short-term bond fund (collectively, the Price Reserve Funds). The Price Reserve Funds are offered as short-term investment options to mutual funds, trusts, and other accounts managed by Price Associates or its affiliates and are not available for direct purchase by members of the public. Cash collateral from securities lending is invested in the T. Rowe Price Short-Term Fund. The Price Reserve Funds pay no investment management fees.
As of April 30, 2021, T. Rowe Price Group, Inc., or its wholly owned subsidiaries, owned 391,518 shares of the I Class, representing 2% of the I Class's net assets.

srgle_0421_P4Proof #
52
T. ROWE PRICE GlObAl GROWTh STOCk Fund
The fund may participate in securities purchase and sale transactions with other funds or accounts advised by Price Associates (cross trades), in accordance with procedures adopted by the fund’s Board and Securities and Exchange Commission rules, which require, among other things, that such purchase and sale cross trades be effected at the independent current market price of the security. During the six months ended April 30, 2021, the fund had no purchases or sales cross trades with other funds or accounts advised by Price Associates.
Effective January 1, 2020, Price Associates has voluntarily agreed to reimburse the fund from its own resources on a monthly basis for the cost of investment research embedded in the cost of the fund’s securities trades. This agreement may be rescinded at any time. For the six months ended April 30, 2021, this reimbursement amounted to $13,000, which is included in Net realized gain (loss) on Securities in the Statement of Operations.
NOTE 8 - OTHER MATTERS
Unpredictable events such as environmental or natural disasters, war, terrorism, pandemics, outbreaks of infectious diseases, and similar public health threats may significantly affect the economy and the markets and issuers in which a fund invests. Certain events may cause instability across global markets, including reduced liquidity and disruptions in trading markets, while some events may affect certain geographic regions, countries, sectors, and industries more significantly than others, and exacerbate other pre-existing political, social, and economic risks. During 2020, a novel strain of coronavirus (COVID-19) resulted in disruptions to global business activity and caused significant volatility and declines in global financial markets.
These types of events, such as the global pandemic caused by COVID-19, may also cause widespread fear and uncertainty, and result in, among other things: enhanced health screenings, quarantines, cancellations, and travel restrictions, including border closings; disruptions to business operations and supply chains and customer activity; exchange trading suspensions and closures, and overall reduced liquidity of securities, derivatives, and commodities trading markets; reductions in consumer demand and economic output; and significant challenges in healthcare service preparation and delivery. The fund could be negatively impacted if the value of a portfolio holding were harmed by such political or economic conditions or events. In addition, the operations of the fund, its investment advisers, and the fund’s service providers may be significantly impacted, or even temporarily halted, as a result of any impairment to their information

srgle_0421_P4Proof #
53
T. ROWE PRICE GlObAl GROWTh STOCk Fund
technology and other operation systems, extensive employee illnesses or unavailability, government quarantine measures, and restrictions on travel or meetings and other factors related to public emergencies.
Governmental and quasi-governmental authorities and regulators have in the past responded to major economic disruptions with a variety of significant fiscal and monetary policy changes, including but not limited to, direct capital infusions into companies, new monetary programs, and dramatically lower interest rates. An unexpected or quick reversal of these policies, or the ineffectiveness of these policies, could negatively impact overall investor sentiment and further increase volatility in securities markets.

srgle_0421_P4Proof #
54
T. ROWE PRICE GlObAl GROWTh STOCk Fund
INFORMATION ON PROXY VOTING POLICIES, PROCEDURES, AND RECORDS
A description of the policies and procedures used by T. Rowe Price funds to determine how to vote proxies relating to portfolio securities is available in each fund’s Statement of Additional Information. You may request this document by calling 1-800-225-5132 or by accessing the SEC’s website, sec.gov.
The description of our proxy voting policies and procedures is also available on our corporate website. To access it, please visit the following Web page:
https://www.troweprice.com/corporate/en/utility/policies.html
Scroll down to the section near the bottom of the page that says, “Proxy Voting Policies.” Click on the Proxy Voting Policies link in the shaded box.
Each fund’s most recent annual proxy voting record is available on our website and through the SEC’s website. To access it through T. Rowe Price, visit the website location shown above, and scroll down to the section near the bottom of the page that says, “Proxy Voting Records.” Click on the Proxy Voting Records link in the shaded box.
HOW TO OBTAIN QUARTERLY PORTFOLIO HOLDINGS
The fund files a complete schedule of portfolio holdings with the Securities and Exchange Commission (SEC) for the first and third quarters of each fiscal year as an exhibit to its reports on Form N-PORT. The fund’s reports on Form N-PORT are available electronically on the SEC’s website (sec.gov). In addition, most T. Rowe Price funds disclose their first and third fiscal quarter-end holdings on troweprice.com.

srgle_0421_P4Proof #
55
T. ROWE PRICE GlObAl GROWTh STOCk Fund
APPROVAL OF INVESTMENT MANAGEMENT AGREEMENT AND SUBADVISORY AGREEMENT
Each year, the fund’s Board of Directors (Board) considers the continuation of the investment management agreement (Advisory Contract) between the fund and its investment advisor, T. Rowe Price Associates, Inc. (Advisor), as well as the continuation of the investment subadvisory agreement (Subadvisory Contract) that the Advisor has entered into with T. Rowe Price International Ltd (Subadvisor) on behalf of the fund. In that regard, at a meeting held on March 8–9, 2021 (Meeting), the Board, including all of the fund’s independent directors, approved the continuation of the fund’s Advisory Contract and Subadvisory Contract. At the Meeting, the Board considered the factors and reached the conclusions described below relating to the selection of the Advisor and Subadvisor and the approval of the Advisory Contract and Subadvisory Contract. The independent directors were assisted in their evaluation of the Advisory Contract and Subadvisory Contract by independent legal counsel from whom they received separate legal advice and with whom they met separately.
In providing information to the Board, the Advisor was guided by a detailed set of requests for information submitted by independent legal counsel on behalf of the independent directors. In considering and approving the Advisory Contract and Subadvisory Contract, the Board considered the information it believed was relevant, including, but not limited to, the information discussed below. The Board considered not only the specific information presented in connection with the Meeting but also the knowledge gained over time through interaction with the Advisor and Subadvisor about various topics. The Board meets regularly and, at each of its meetings, covers an extensive agenda of topics and materials and considers factors that are relevant to its annual consideration of the renewal of the T. Rowe Price funds’ advisory contracts, including performance and the services and support provided to the funds and their shareholders.
Services Provided by the Advisor and SubadvisorThe Board considered the nature, quality, and extent of the services provided to the fund by the Advisor and Subadvisor. These services included, but were not limited to, directing the fund’s investments in accordance with its investment program and the overall management of the fund’s portfolio, as well as a variety of related activities such as financial, investment operations, and administrative services; compliance; maintaining the fund’s records and registrations; and shareholder communications. The Board also reviewed the background and experience of the Advisor’s and Subadvisor’s senior management teams and investment personnel involved in the management of the fund, as well as the Advisor’s compliance record. The Board concluded that it was satisfied with the nature, quality, and extent of the services provided by the Advisor and Subadvisor.

srgle_0421_P4Proof #
56
T. ROWE PRICE GlObAl GROWTh STOCk Fund
Investment Performance of the Fund The Board took into account discussions with the Advisor and reports that it receives throughout the year relating to fund performance. In connection with the Meeting, the Board reviewed the fund’s net annualized total returns for the 1-, 2-, 3-, 4-, 5-, and 10-year periods as of September 30, 2020, and compared these returns with the performance of a peer group of funds with similar investment programs and a wide variety of other previously agreed-upon comparable performance measures and market data, including those supplied by Broadridge, which is an independent provider of mutual fund data.
On the basis of this evaluation and the Board’s ongoing review of investment results, and factoring in the relative market conditions during certain of the performance periods, the Board concluded that the fund’s performance was satisfactory.
Costs, Benefits, Profits, and Economies of ScaleThe Board reviewed detailed information regarding the revenues received by the Advisor under the Advisory Contract and other direct and indirect benefits that the Advisor (and its affiliates) may have realized from its relationship with the fund. In considering soft-dollar arrangements pursuant to which research may be received from broker-dealers that execute the fund’s portfolio transactions, the Board noted that the Advisor bears the cost of research services for all client accounts that it advises, including the T. Rowe Price funds. The Board received information on the estimated costs incurred and profits realized by the Advisor from managing the T. Rowe Price funds. The Board also reviewed estimates of the profits realized from managing the fund in particular, and the Board concluded that the Advisor’s profits were reasonable in light of the services provided to the fund.
The Board also considered whether the fund benefits under the fee levels set forth in the Advisory Contract from any economies of scale realized by the Advisor. Under the Advisory Contract, the fund pays a fee to the Advisor for investment management services composed of two components—a group fee rate based on the combined average net assets of most of the T. Rowe Price funds (including the fund) that declines at certain asset levels and an individual fund fee rate based on the fund’s average daily net assets—and the fund pays its own expenses of operations (subject to contractual expense limitations agreed to by the Advisor with respect to the Investor Class, Advisor Class, and I Class). Under the Subadvisory Contract, the Advisor may pay the Subadvisor up to 60% of the advisory fee that the Advisor receives from the fund. The Board concluded that the advisory fee structure for the fund continued to provide for a reasonable sharing of benefits from any economies of scale with the fund’s investors.
APPROVAL OF INVESTMENT MANAGEMENT AGREEMENT AND SUBADVISORY AGREEMENT (CONTINUED)

srgle_0421_P4Proof #
57
T. ROWE PRICE GlObAl GROWTh STOCk Fund
Fees and ExpensesThe Board was provided with information regarding industry trends in management fees and expenses. Among other things, the Board reviewed data for peer groups that were compiled by Broadridge, which compared: (i) contractual management fees, total expenses, actual management fees, and nonmanagement expenses of the Investor Class of the fund with a group of competitor funds selected by Broadridge (Investor Class Expense Group); (ii) total expenses and actual management fees of the Advisor Class of the fund with a group of competitor funds selected by Broadridge (Advisor Class Expense Group); and (iii) total expenses, actual management fees, and nonmanagement expenses of the Investor Class of the fund with a broader set of funds within the Lipper investment classification (Expense Universe). The Board considered the fund’s contractual management fee rate, actual management fee rate (which reflects the management fees actually received from the fund by the Advisor after any applicable waivers, reductions, or reimbursements), operating expenses, and total expenses (which reflect the net total expense ratio of the fund after any waivers, reductions, or reimbursements) in comparison with the information for the Broadridge peer groups. Broadridge generally constructed the peer groups by seeking the most comparable funds based on similar investment classifications and objectives, expense structure, asset size, and operating components and attributes and ranked funds into quintiles, with the first quintile representing the funds with the lowest relative expenses and the fifth quintile representing the funds with the highest relative expenses. The information provided to the Board indicated that the fund’s contractual management fee ranked in the first quintile (Investor Class Expense Group), the fund’s actual management fee rate ranked in the first quintile (Investor Class Expense Group and Advisor Class Expense Group) and second quintile (Expense Universe), and the fund’s total expenses ranked in the first and second quintiles (Investor Class Expense Group and Expense Universe) and first quintile (Advisor Class Expense Group).
The Board also reviewed the fee schedules for other investment portfolios with similar mandates that are advised or subadvised by the Advisor and its affiliates, including separately managed accounts for institutional and individual investors; subadvised funds; and other sponsored investment portfolios, including collective investment trusts and pooled vehicles organized and offered to investors outside the United States. Management provided the Board with information about the Advisor’s responsibilities and services provided to subadvisory and other institutional account clients, including information about how the requirements and economics of the institutional business are fundamentally different from those of the proprietary mutual fund business. The Board considered information showing that the Advisor’s mutual fund business is generally more complex from a business and compliance perspective than its institutional account business and considered various relevant factors, such as the broader scope of operations and oversight, more extensive shareholder communication infrastructure, greater asset flows, heightened business risks, and differences in applicable laws and
APPROVAL OF INVESTMENT MANAGEMENT AGREEMENT AND SUBADVISORY AGREEMENT (CONTINUED)

srgle_0421_P4Proof #
58
T. ROWE PRICE GlObAl GROWTh STOCk Fund
regulations associated with the Advisor’s proprietary mutual fund business. In assessing the reasonableness of the fund’s management fee rate, the Board considered the differences in the nature of the services required for the Advisor to manage its mutual fund business versus managing a discrete pool of assets as a subadvisor to another institution’s mutual fund or for an institutional account, and that the Advisor generally performs significant additional services and assumes greater risk in managing the fund and other T. Rowe Price funds than it does for institutional account clients, including subadvised funds.
On the basis of the information provided and the factors considered, the Board concluded that the fees paid by the fund under the Advisory Contract are reasonable.
Approval of the Advisory Contract and Subadvisory ContractAs noted, the Board approved the continuation of the Advisory Contract and Subadvisory Contract. No single factor was considered in isolation or to be determinative to the decision. Rather, the Board concluded, in light of a weighting and balancing of all factors considered, that it was in the best interests of the fund and its shareholders for the Board to approve the continuation of the Advisory Contract and Subadvisory Contract (including the fees to be charged for services thereunder).
APPROVAL OF INVESTMENT MANAGEMENT AGREEMENT AND SUBADVISORY AGREEMENT (CONTINUED)

srgle_0421_P4Proof #
This page intentionally left blank.

srgle_0421_P4Proof #
This page intentionally left blank.

srgle_0421_P4Proof #
This page intentionally left blank.

srgle_0421_P4Proof #
202106-1608400F174-051 6/21
You have manyinvestment goals.
Explore products and services that can help you achieve them.Whether you want to put away more money for retirement, for a child’s education, or for other priorities, we have solutions for you. See how we can help you accomplish the investment goals that are important to you.
RETIREMENTn IRAs: Traditional, Roth,
Rollover/Transfer, or Brokerage
n Small Business Plans help minimize taxes, maximize savings
n T. Rowe Price® ActivePlus Portfolios1 for online investing powered by experts
GENERAL INVESTINGn Individual or Joint
Tenantn Brokerage2 offers
access to stocks, ETFs, bonds, and more
n Gifts and transfers to a child (UGMA/UTMAs)
n Trustn Transfer on Death
COLLEGE SAVINGSn T. Rowe Price-managed
529 plans offer tax-advantaged solutions for families saving money for college tuition and education-related expenses
Visit troweprice.com/broadrange
Call 1-800-225-5132 to request a prospectus or summary prospectus; each includes investment objectives, risks, fees, expenses, and other information that you should read and consider carefully before investing.
All mutual funds are subject to market risk, including possible loss of principal. Investing internationally involves special risks including economic and political uncertainty and currency fluctuation.
1 The T. Rowe Price® ActivePlus Portfolios is a discretionary investment management program provided by T. Rowe Price Advisory Services, Inc., a registered investment adviser under the Investment Advisers Act of 1940. Brokerage services are provided by T. Rowe Price Investment Services, Inc., member FINRA/SIPC. Brokerage accounts are carried by Pershing LLC, a BNY Mellon Company, member NYSE/FINRA/SIPC. T. Rowe Price Advisory Services, Inc., and T. Rowe Price Investment Services, Inc., are affiliated companies.
2 Brokerage services are provided by T. Rowe Price Investment Services, Inc., member FINRA/SIPC. Brokerage accounts are carried by Pershing LLC, a BNY Mellon Company, member NYSE/FINRA/SIPC.
T. Rowe Price Investment Services, Inc. | 100 East Pratt Street | Baltimore, MD 21202-1009