semiannual report - t. rowe price - corporate home
TRANSCRIPT

srbal_0618_P4Proof #
T. ROWE PRICE
June 30, 2018
RPBAX Balanced Fund
RBAIX Balanced Fund–I Class
SEMIANNUAL REPORT
The fund invests in a diversified blend of stocks and bonds.
For more insights from T. Rowe Price investment professionals, go to troweprice.com.

srbal_0618_P4Proof #
T. Rowe PRICe BalanCed Fund
CIo Market Commentary
T. Rowe PRICe BalanCed Fund
HIGHLIGHTS
n Global equities generated modest gains despite a spike in volatility, while U.S. fixed income markets were hampered by rising interest rates. The Balanced Fund returned 0.91% in the six months ended June 30, 2018. The fund outperformed its combined index portfolio, as well as its Lipper and Morningstar benchmarks.
n Security selection within the underlying allocations contributed to relative performance, led by strong gains in U.S. large-cap growth stocks. Tactical allocation decisions weighed on relative returns, while the inclusion of non-benchmark sectors marginally detracted.
n We remain underweight equities as valuations remain elevated against a backdrop of receding global liquidity, higher interest rates, an aging U.S. economic cycle, and rising trade tensions. Although the expected returns from fixed income markets remain relatively low, bonds may provide diversification and downside protection against equity market declines.
n Fundamentals remain broadly supportive; however, key risks to global markets include potential monetary policy missteps, rising inflation, protectionist trade policies, and the sustainability of commodity prices.
Log in to your account at troweprice.com for more information.
* Certain mutual fund accounts that are assessed an annual account service fee can also save money by switching to e-delivery.
It’s fast—receive your statements and confirmations faster than U.S. mail.
It’s convenient—access your important account documents whenever you need them.
It’s secure—we protect your online accounts using “True Identity” to confirm new accounts and make verification faster and more secure.
It can save you money—where applicable, T. Rowe Price passes on the cost savings to fund holders.*
TO ENROLL:If you invest directly with T. Rowe Price, go to troweprice.com/paperless.
If you invest through an investment advisor, a bank, or a brokerage firm, please contact that organization and ask if it can provide electronic documentation.
Go PaperlessSign up for e-delivery of your statements, confirmations, and prospectuses or shareholder reports.

srbal_0618_P4Proof #
1
T. Rowe PRICe BalanCed Fund
CIo Market Commentary
T. Rowe PRICe BalanCed Fund
dear Shareholder
U.S. stocks recorded decent gains in the first half of 2018, but unlike last year, investors had to absorb some bumps along the way. In February, volatility spiked and the S&P 500 Index briefly tumbled over 10% from its highs, putting it in correction territory. The major U.S. benchmarks recovered their losses in the spring, eventually bringing the technology-focused Nasdaq Composite Index and the smaller-cap indexes to new highs. Volatility stayed somewhat elevated, however, and many investors clearly remained anxious as the first half of your fund’s fiscal year ended.
Solid corporate and economic fundamentals initially seemed to promise that 2017’s strong stock market momentum might carry forward into 2018. Continued global synchronized growth led to strong profits for many multinationals. In the U.S., earnings for the S&P 500 rose by nearly 25% in the first quarter versus a year before, according to FactSet—the best performance since the recovery from the financial crisis. Profit growth also picked up in Europe, Japan, and emerging markets, even as growth in many international economies cooled a bit.
Inflation fears presented the first obstacle to the markets in February, however. Stocks tumbled on news that hourly wages had jumped in January, sparking fears that the Federal Reserve would pick up its pace of interest rate increases in order to head off inflation. Wage growth moderated in the following months, but a series of strong economic reports raised growth expectations and sent long-term interest rates to multiyear peaks by May. Investors also worried that the massive U.S. fiscal stimulus from December’s tax cuts and March’s spending bill might overheat the economy, though interest rates fell back in late May and June as Fed officials stressed their intention to move slowly in tightening monetary policy.
Trade tensions soon emerged as a second impediment for the markets. The Trump administration began implementing a more populist trade stance in March, announcing tariffs on steel and aluminum imports, threatening to withdraw from the North American Free Trade Agreement (NAFTA), and later raising the possibility of taxing auto imports. The administration also announced a steady escalation in possible tariffs on Chinese goods, eventually targeting a list of $200 billion in Chinese imports. China and other U.S. trading partners vowed to retaliate proportionately.

srbal_0618_P4Proof #
2
T. Rowe PRICe BalanCed Fund
Investors initially seemed willing to dismiss the tit-for-tat threats as negotiating tactics, but evidence eventually emerged that even the prospect of tariffs was impacting corporate strategies and profit outlooks. Stocks slumped on June 21, after German automaker Daimler lowered its earnings guidance due to possible tariff increases on SUVs it manufactures in the U.S. and sells in China. A few days later, Harley-Davidson revealed that it was planning to move some of its motorcycle production to Europe to avoid retaliatory tariffs recently announced by the European Union.
Boeing, Caterpillar, and other leading exporters suffered declines as trade tensions worsened, but small-caps, which typically have far less international exposure, fared much better than large-caps in the first half of the year. Growth shares continued to outperform value shares despite the strong performance of energy stocks, which benefited from a rise in oil prices to multiyear highs. Stocks in overseas markets reacted particularly poorly to growing trade fears and fell for the period. A decline in many currencies relative to the dollar also weighed on international bond and stock returns for U.S. investors.
Meanwhile, technology shares continued to dominate, with much of the market’s overall gain to date in 2018 concentrated in a handful of mega-cap companies able to leverage dominant Internet platforms. Data breaches and concerns about the growing power of these firms resulted in calls for government intervention in early 2018. For now, however, the threat of increased regulation seems a longer-term one that appears minor in comparison to the powerful fundamental strength of these companies.
T. Rowe Price’s global team of industry experts is monitoring the possible impact of tariffs and other challenges on a wide range of companies—from the global tech titans to small, domestic firms that get little analyst coverage on Wall Street. While the rest of 2018 may bring further surprises, you can rest assured that your portfolio manager is drawing on a wide range of insights in seeking to provide shareholders with superior returns while minimizing the impact of unforeseen political events or other pitfalls.
Thank you for your continued confidence in T. Rowe Price.
Sincerely,
Robert SharpsGroup Chief Investment Officer

srbal_0618_P4Proof #
3
T. Rowe PRICe BalanCed Fund
Management’s discussion of Fund Performance
INVESTMENT OBJECTIVE
The fund seeks to provide capital growth, current income, and preservation of capital through a portfolio of stocks and fixed income securities.
FUND COMMENTARY
How did the fund perform in the past six months?
The Balanced Fund returned 0.91% in the six months ended June 30, 2018. The fund outperformed its combined index portfolio, which is a custom benchmark comprising multiple indexes that represent the asset classes in which the fund invests, and its Lipper and Morningstar benchmarks. (Returns for I Class shares
varied slightly, reflecting its different fee structure. Past performance cannot guarantee future results.)
What factors influenced the fund’s performance?
Security selection within the underlying allocations contributed the most to relative performance. The U.S. large-cap growth allocation, led predominantly by stocks in the consumer
discretionary and information technology sectors, generated strong gains and significantly outperformed its benchmark. Security selection in U.S. large-cap core and international equities was also supportive.
Tactical allocation decisions to overweight or underweight various asset classes versus the fund’s combined index portfolio benchmark weighed on relative returns. An overweight to international equities relative to U.S. equities hurt performance as international stocks lagged domestic equities for the period. An underweight to equities versus fixed income securities also weighed on returns as equities outpaced bonds. However, the negative impact was partially mitigated by a favorable allocation to cash, which provided a better return than fixed income securities due to rising interest rates.
Six-Month Period ended 6/30/18 Total Return
Balanced Fund 0.91%
Balanced Fund–I Class 0.96
Morningstar Moderate Target Risk Index -0.31
Combined Index Portfolio* 0.24
lipper Balanced Funds Index 0.14
* For a definition of the Combined Index Portfolio, please see the Benchmark Information section.
PERFORMANCE COMPARISON

srbal_0618_P4Proof #
4
T. Rowe PRICe BalanCed Fund
The inclusion of non-benchmark sectors marginally detracted. Exposure to real assets equities hurt returns as real assets trailed global equities. Conversely, despite weak security selection, the allocation to high yield bonds proved beneficial as they outperformed investment-grade issues.
How is the fund positioned?
We are underweight equities as valuations remain elevated against a backdrop of receding global liquidity, higher interest rates, an aging U.S. economic cycle,
and rising trade tensions. Although the expected returns from fixed income markets remain relatively low, bonds may provide diversification and downside protection against equity market declines.
StocksSeveral years of strong performance have left valuations at or above fair value in many asset classes, which has reduced the number of attractive
investment opportunities. However, we continue to find opportunities in select areas where valuations appear more appealing, and we reduce allocations in areas where we see potential risks.
On a regional basis, U.S. earnings growth is very strong but likely peaking, and stock valuations are slightly elevated relative to history. We are neutral between U.S. growth and value stocks. Secular growth stocks should continue to benefit in a low-growth economy, although valuations have become less attractive and leadership has been fueled by a handful of information technology and consumer-related companies.
We trimmed our overweight to international equities amid signs of moderating growth, rising trade tensions, and a resurgence in political risk. Valuations are still more attractive for stocks in developed non-U.S. markets, which are supported by solid economic growth and positive earnings trends; however, moderating growth expectations and increased risks from trade wars as well as weakness in European financials could be problematic.
Based on net assets as of 6/30/18.
SECURITY DIVERSIFICATION
Mortgage-Backed
Securities9%
CorporateBonds
10%
DomesticStocks41%
Other andReserves4%
Asset-BackedSecurities1%
High YieldBonds
3%
InternationalStocks22%
Treasury andAgency Bonds
10%
srbal_0618_P4Proof #
5
T. Rowe PRICe BalanCed Fund
We remain underweight to inflation-sensitive real assets equities given continued concerns over the impact of slowing Chinese growth and long-term structural imbalances in global energy supply and demand. Valuations and fundamentals of real estate investment trusts are relatively attrac-tive but vulnerable to rising interest rates.
BondsWe remain overweight to U.S. investment-grade debt as their yields have become even more attractive since the start of the year, with moderated risk due to limited upside from growth and inflation. We are underweight high yield bonds given limited upside potential at current valuations.
What is portfolio management’s outlook?
Global growth trajectories are beginning to diverge from last year’s synchronized expansion. After expanding above expectations, global growth is likely to stabilize around more reasonable levels in the near term. Global equity valuations appear expensive against a backdrop of increasing risks from escalating trade
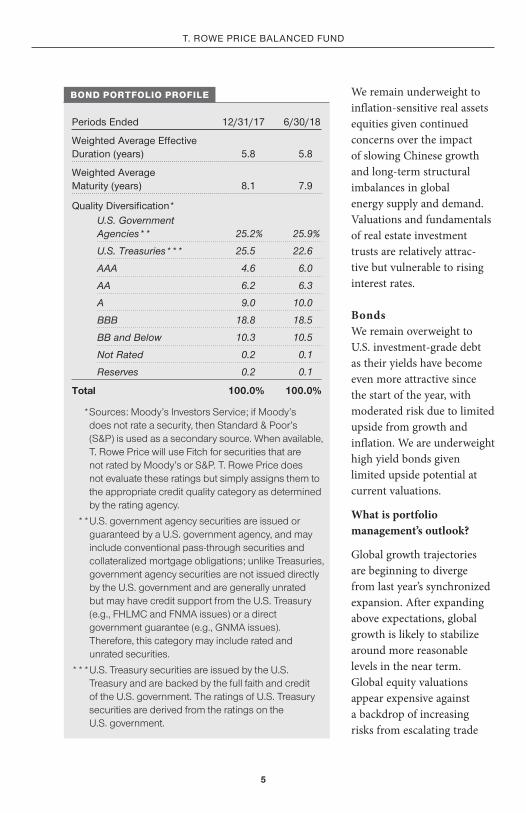
Periods ended 12/31/17 6/30/18
weighted average effective duration (years) 5.8 5.8
weighted average Maturity (years) 8.1 7.9
Quality diversification*U.S. Government Agencies** 25.2% 25.9%
U.S. Treasuries*** 25.5 22.6
AAA 4.6 6.0
AA 6.2 6.3
A 9.0 10.0
BBB 18.8 18.5
BB and Below 10.3 10.5
Not Rated 0.2 0.1
Reserves 0.2 0.1
Total 100.0% 100.0%
* Sources: Moody’s Investors Service; if Moody’s does not rate a security, then Standard & Poor’s (S&P) is used as a secondary source. When available, T. Rowe Price will use Fitch for securities that are not rated by Moody’s or S&P. T. Rowe Price does not evaluate these ratings but simply assigns them to the appropriate credit quality category as determined by the rating agency.
** U.S. government agency securities are issued or guaranteed by a U.S. government agency, and may include conventional pass-through securities and collateralized mortgage obligations; unlike Treasuries, government agency securities are not issued directly by the U.S. government and are generally unrated but may have credit support from the U.S. Treasury (e.g., FHLMC and FNMA issues) or a direct government guarantee (e.g., GNMA issues). Therefore, this category may include rated and unrated securities.
*** U.S. Treasury securities are issued by the U.S. Treasury and are backed by the full faith and credit of the U.S. government. The ratings of U.S. Treasury securities are derived from the ratings on the U.S. government.
BOND PORTFOLIO PROFILE

srbal_0618_P4Proof #
6
T. Rowe PRICe BalanCed Fund
tensions, higher inflation, rising interest rates, and market volatility. Inflation expectations have risen in the U.S. given tightening labor markets and wage growth. We expect U.S. economic activity may continue to benefit in the near term from procyclical policies of tax reform and deregulation, despite being in the later stages of the economic cycle. Growth in Europe, which had been supported by improving global trade, has stabilized just as the European Central Bank moves toward unwinding quantitative easing. Within emerging markets, idiosyncratic and political risks remain elevated and growth has moderated from last year’s relatively high levels; however, the growth differential relative to developed economies should continue to improve.
Global bond yields remain at low levels and are vulnerable to rising interest rates. Monetary policies are diverging further, with several emerging economies facing pressures from rising developed markets interest rates and a stronger U.S. dollar. Global central banks are winding down ultra-accommodative policies, which will lessen liquidity and could put upward pressure on yields. Despite the weak expected returns from fixed income markets, the potential for increased market volatility highlights the important diversification role bonds play in multi-asset portfolios as they may provide downside protection against adverse equity markets.
We have a cautious view on risk taking within our portfolios given the backdrop of elevated global equity market valuations and an extended economic cycle. Fundamentals remain broadly supportive; however, key risks to global markets include negative impacts from potential monetary policy missteps, rising inflation, protectionist trade policies, and the sustainability of commodity prices. Given the many crosscurrents that can influence global financial markets, we believe that the Balanced Fund’s broad diversification across asset classes, investment styles, and geography, combined with strengths in our strategic investing approach, will help us generate attractive risk-adjusted returns in an uncertain market environment.
The views expressed reflect the opinions of T. Rowe Price as of the date of this report and are subject to change based on changes in market, economic, or other conditions. These views are not intended to be a forecast of future events and are no guarantee of future results.

srbal_0618_P4Proof #
7
T. Rowe PRICe BalanCed Fund
RISKS OF INVESTING IN STOCKS
As with all stock mutual funds, the fund’s share price can fall because of weakness in the stock market, a particular industry, or specific holdings. Stock markets can decline for many reasons, including adverse political or economic developments, changes in investor psychology, or heavy institutional selling. The prospects for an industry or company may deteriorate because of a variety of factors, including disappointing earnings or changes in the competitive environment. In addition, the investment manager’s assessment of companies held in a fund may prove incorrect, resulting in losses or poor performance even in rising markets.
RISKS OF INTERNATIONAL INVESTING
Funds that invest overseas generally carry more risk than funds that invest strictly in U.S. assets. Risks can result from varying stages of economic and political development; differing regulatory environments, trading days, and accounting standards; currency fluctuations; and higher transaction costs of non-U.S. markets. Investments outside the United States could be subject to governmental actions, such as capital or currency controls, nationalization of a company or industry, expropriation of assets, or imposition of high taxes.
RISKS OF INVESTING IN BONDS
Funds that invest in bonds are subject to interest rate risk, the decline in bond prices that usually accompanies a rise in interest rates. Longer-maturity bonds typically decline more than those with shorter maturities. Funds that invest in bonds are also subject to credit risk, the chance that any fund holding could have its credit rating downgraded or that a bond issuer will default (fail to make timely payments of interest or principal), potentially reducing the fund’s income level and share price.
srbal_0618_P4Proof #
8
T. Rowe PRICe BalanCed Fund
BENCHMARK INFORMATION
Combined Index Portfolio: An unmanaged portfolio of 45.5% domestic stocks (S&P 500 Index), 35.0% bonds (Bloomberg Barclays U.S. Aggregate Bond Index), and 19.5% international stocks (MSCI EAFE Index).
Note: Bloomberg Index Services Ltd. Copyright © 2018, Bloomberg Index Services Ltd. Used with permission.
Note: MSCI makes no express or implied warranties or representations and shall have no liability whatsoever with respect to any MSCI data contained herein. The MSCI data may not be further redistributed or used as a basis for other indices or any securities or financial products. This report is not approved, reviewed, or produced by MSCI.

srbal_0618_P4Proof #
9
T. Rowe PRICe BalanCed Fund
LARGEST HOLDINGS
Percent of Percent of net assets net assetsStocks 6/30/18 Bonds 6/30/18
amazon.com 2.0%Microsoft 1.8T. Rowe Price Real assets Fund 1.5Facebook 1.3alphabet 1.2Boeing 0.9Booking Holdings 0.8wells Fargo 0.7Visa 0.7unitedHealth Group 0.6
Total 11.5%
u.S. Treasuries 7.6%Federal national Mortgage association – Mortgages 4.9T. Rowe Price Institutional High Yield Fund 3.3Government national Mortgage association 2.9Federal Home loan Mortgage Corporation – Mortgages 1.2T. Rowe Price u.S. Bond enhanced Index Fund 0.4T. Rowe Price Inflation Protected Bond Fund–I Class 0.3JPMorgan Chase 0.3apple 0.2Goldman Sachs 0.2
Total 21.3%
note: The information shown does not reflect any exchange-traded funds (eTFs), cash reserves, or collateral for securities lending that may be held in the portfolio.
PORTFOLIO HIGHLIGHTS

srbal_0618_P4Proof #
10
T. Rowe PRICe BalanCed Fund
This chart shows the value of a hypothetical $10,000 investment in the fund over the past 10 fiscal year periods or since inception (for funds lacking 10-year records). The result is compared with benchmarks, which include a broad-based market index and may also include a peer group average or index. Market indexes do not include expenses, which are deducted from fund returns as well as mutual fund averages and indexes.
GROWTH OF $10,000
As of 6/30/18
$20,306
18,38218,470
Balanced Fund
Morningstar Moderate Target Risk IndexLinked Performance Benchmark*
6/186/176/166/156/146/136/126/116/106/096/08
10,000
13,200
16,400
19,600
22,800
$26,000
BALANCED FUND
Note: Performance for the I Class will vary due to its differing fee structure.* The linked performance benchmark reflects the performance of the Merrill Lynch-Wilshire
Capital Market Index through 6/30/09 and the performance of the Morningstar Moderate Target Risk Index from 7/1/09 through the end of the period.

srbal_0618_P4Proof #
11
T. Rowe PRICe BalanCed Fund
Since InceptionPeriods ended 6/30/18 1 Year 5 Years 10 Years Inception date
Balanced Fund 8.55% 8.70% 7.34% – –
Balanced Fund–I Class 8.69 – – 9.84% 12/17/15
The fund’s performance information represents only past performance and is not necessarily an indication of future results. Current performance may be lower or higher than the performance data cited. Share price, principal value, and return will vary, and you may have a gain or loss when you sell your shares. For the most recent month-end performance, please visit our website (troweprice.com) or contact a T. Rowe Price representative at 1-800-225-5132, or for I Class shares, 1-800-638-8790.This table shows how the fund would have performed each year if its actual (or cumulative) returns for the periods shown had been earned at a constant rate. Average annual total return figures include changes in principal value, reinvested dividends, and capital gain distributions. Returns do not reflect taxes that the shareholder may pay on fund distributions or the redemption of fund shares. When assessing performance, investors should consider both short- and long-term returns.
AVERAGE ANNUAL COMPOUND TOTAL RETURN
Balanced Fund 0.64%
Balanced Fund–I Class 0.49
The expense ratio shown is as of the fund’s fiscal year ended 12/31/17. This number may vary from the expense ratio shown elsewhere in this report because it is based on a different time period and, if applicable, includes acquired fund fees and expenses but does not include fee or expense waivers.
EXPENSE RATIO

srbal_0618_P4Proof #
12
T. Rowe PRICe BalanCed Fund
FUND EXPENSE EXAMPLE
As a mutual fund shareholder, you may incur two types of costs: (1) transaction costs, such as redemption fees or sales loads, and (2) ongoing costs, including management fees, distribution and service (12b-1) fees, and other fund expenses. The following example is intended to help you understand your ongoing costs (in dollars) of investing in the fund and to compare these costs with the ongoing costs of investing in other mutual funds. The example is based on an investment of $1,000 invested at the beginning of the most recent six-month period and held for the entire period.
Please note that the fund has two share classes: The original share class (Investor Class) charges no distribution and service (12b-1) fee, and the I Class shares are also available to institutionally oriented clients and impose no 12b-1 or administrative fee payment. Each share class is presented separately in the table.
Actual ExpensesThe first line of the following table (Actual) provides information about actual account values and expenses based on the fund’s actual returns. You may use the information on this line, together with your account balance, to estimate the expenses that you paid over the period. Simply divide your account value by $1,000 (for example, an $8,600 account value divided by $1,000 = 8.6), then multiply the result by the number on the first line under the heading “Expenses Paid During Period” to estimate the expenses you paid on your account during this period.
Hypothetical Example for Comparison PurposesThe information on the second line of the table (Hypothetical) is based on hypothetical account values and expenses derived from the fund’s actual expense ratio and an assumed 5% per year rate of return before expenses (not the fund’s actual return). You may compare the ongoing costs of investing in the fund with other funds by contrasting this 5% hypothetical example and the 5% hypothetical examples that appear in the shareholder reports of the other funds. The hypothetical account values and expenses may not be used to estimate the actual ending account balance or expenses you paid for the period.
Note: T. Rowe Price charges an annual account service fee of $20, generally for accounts with less than $10,000. The fee is waived for any investor whose T. Rowe Price mutual fund accounts total $50,000 or more; accounts electing to receive electronic delivery of account statements, transaction confirmations, prospectuses, and shareholder reports; or accounts of an investor who is a T. Rowe Price Personal Services or Enhanced Personal Services client (enrollment in these programs generally requires T. Rowe Price assets of at least $250,000). This fee is not included in the accompanying table. If you are subject to the fee, keep it in mind when you are estimating the ongoing expenses of investing in the fund and when comparing the expenses of this fund with other funds.
You should also be aware that the expenses shown in the table highlight only your ongoing costs and do not reflect any transaction costs, such as redemption fees or sales loads. Therefore, the second line of the table is useful in comparing ongoing costs only and will not help you determine the relative total costs of owning different funds. To the extent a fund charges transaction costs, however, the total cost of owning that fund is higher.

srbal_0618_P4Proof #
13
T. Rowe PRICe BalanCed Fund
Beginning ending expenses Paid account Value account Value during Period* 1/1/18 6/30/18 1/1/18 to 6/30/18
Investor Classactual $1,000.00 $1,009.10 $2.74
Hypothetical (assumes 5% return before expenses) 1,000.00 1,022.07 2.76
I Classactual 1,000.00 1,009.60 2.14
Hypothetical (assumes 5% return before expenses) 1,000.00 1,022.66 2.16
* Expenses are equal to the fund’s annualized expense ratio for the 6-month period, multiplied by the average account value over the period, multiplied by the number of days in the most recent fiscal half year (181), and divided by the days in the year (365) to reflect the half-year period. The annualized expense ratio of the Investor Class was 0.55%, and the I Class was 0.43%.
BALANCED FUND
FUND EXPENSE EXAMPLE (CONTINUED)

srbal_0618_P4Proof #
14
FINANCIAL HIGHLIGHTS For a share outstanding throughout each period
T. Rowe PRICe BalanCed Fund
Unaudited
Investor Class
6 Months Ended
6/30/18
Year Ended
12/31/17 12/31/16 12/31/15 12/31/14 12/31/13 NET ASSET VALUE
Beginning of period $ 24.33 $ 21.98 $ 21.46 $ 22.89 $ 23.22 $ 20.64
Investment activities
Net investment income(1) 0.26(2) 0.41(2) 0.43(2) 0.45(2) 0.47(2) 0.39(2)
Net realized and unrealized gain/loss (0.04) 3.52 0.83 (0.31) 0.90 3.52
Total from investment activities 0.22 3.93 1.26 0.14 1.37 3.91
Distributions
Net investment income (0.26) (0.44) (0.44) (0.47) (0.48) (0.41)
Net realized gain – (1.14) (0.30) (1.10) (1.22) (0.92)
Total distributions (0.26) (1.58) (0.74) (1.57) (1.70) (1.33)
NET ASSET VALUE
End of period $ 24.29 $ 24.33 $ 21.98 $ 21.46 $ 22.89 $ 23.22

srbal_0618_P4Proof #
15
FINANCIAL HIGHLIGHTS For a share outstanding throughout each period
The accompanying notes are an integral part of these financial statements.
T. Rowe PRICe BalanCed Fund
Unaudited
6 Months Ended
6/30/18
Year Ended
12/31/17 12/31/16 12/31/15 12/31/14 12/31/13 Ratios/Supplemental Data
Total return(3) 0.91%(2) 18.01%(2) 5.92%(2) 0.65%(2) 5.97%(2) 19.25%(2)
Ratio of total expenses to average net assets 0.55%(2) (4) 0.57%(2) 0.60%(2) 0.60%(2) 0.60%(2) 0.60%(2)
Ratio of net investment income to average net assets 2.13%(2) (4) 1.73%(2) 1.96%(2) 1.95%(2) 1.96%(2) 1.77%(2)
Portfolio turnover rate 36.1% 48.7% 58.4% 65.1% 52.9% 54.1%
Net assets, end of period (in millions) $ 3,682 $ 3,776 $ 3,594 $ 3,938 $ 4,151 $ 3,958
(1) Per share amounts calculated using average shares outstanding method. (2) See Note 6. Excludes expenses permanently waived of 0.03%, 0.03%, 0.04%, 0.04%, 0.04%, and
0.04% of average net assets for the six months ended 6/30/18, the years ended 12/31/17, 12/31/16, 12/31/15, 12/31/14, and12/31/13, respectively, related to investments in T. Rowe Price mutual funds.
(3) Total return reflects the rate that an investor would have earned on an investment in the fund during each period, assuming reinvestment of all distributions. Total return is not annualized for periods less than one year.
(4) Annualized

srbal_0618_P4Proof #
16
FINANCIAL HIGHLIGHTS For a share outstanding throughout each period
T. Rowe PRICe BalanCed Fund
Unaudited
I Class
6 Months Ended
6/30/18
Year Ended
12/31/17 12/31/16
12/17/15(1) Through 12/31/15
NET ASSET VALUE
Beginning of period $ 24.34 $ 21.98 $ 21.46 $ 21.42
Investment activities
Net investment income (loss)(2) 0.29(3) 0.44(3) 0.42(3) (0.01)(3) (4)
Net realized and unrealized gain/loss (0.06) 3.53 0.88 0.05
Total from investment activities 0.23 3.97 1.30 0.04
Distributions
Net investment income (0.28) (0.47) (0.48) –
Net realized gain – (1.14) (0.30) –
Total distributions (0.28) (1.61) (0.78) –
NET ASSET VALUE
End of period $ 24.29 $ 24.34 $ 21.98 $ 21.46

srbal_0618_P4Proof #
17
FINANCIAL HIGHLIGHTS For a share outstanding throughout each period
The accompanying notes are an integral part of these financial statements.
T. Rowe PRICe BalanCed Fund
Unaudited
6 Months Ended
6/30/18
Year Ended
12/31/17 12/31/16
12/17/15(1) Through 12/31/15
Ratios/Supplemental Data
Total return(5) 0.96%(3) 18.20%(3) 6.11%(3) 0.19%(3) (4)
Ratio of total expenses to average net assets 0.43%(3) (6) 0.42%(3) 0.42%(3) 0.45%(3) (4) (6)
Ratio of net investment income (loss) to average net assets 2.34%(3) (6) 1.85%(3) 1.95%(3) (3.10)%(3) (4) (6)
Portfolio turnover rate 36.1% 48.7% 58.4% 65.1%
Net assets, end of period (in thousands) $ 425,227 $ 278,883 $ 168,569 $ 815
(1) Inception date (2) Per share amounts calculated using average shares outstanding method. (3) See Note 6. Excludes expenses permanently waived of 0.03%, 0.03%, 0.04%, and 0.04% of
average net assets for the six months ended 6/30/18, the years ended 12/31/17, 12/31/16, and for the period ended 12/31/15,respectively, related to investments in T. Rowe Price mutual funds.
(4) See Note 6. Excludes expenses in excess of a 0.05% contractual operating expense limitation in effect through April 30, 2020.
(5) Total return reflects the rate that an investor would have earned on an investment in the fund during each period, assuming reinvestment of all distributions. Total return is not annualized for periods less than one year.
(6) Annualized

srbal_0618_P4Proof #
T. Rowe PRICe BalanCed Fund
June 30, 2018 (unaudited)
PORTFOLIO OF INVESTMENTS‡ Shares/Par $ Value
(Cost and value in $000s)
18
COMMON STOCKS 60.2%
CONSUMER DISCRETIONARY 8.5%
Auto Components 0.6%
Aisin Seiki (JPY) 41,400 1,885
Aptiv 31,983 2,931
Autoliv, SDR (SEK) 30,411 3,110
Koito Manufacturing (JPY) 27,200 1,797
Magna International 203,410 11,824
Sumitomo Rubber Industries (JPY) 96,800 1,534
Veoneer, SDR (SEK) (1) 30,411 1,075
24,156
Automobiles 0.7%
Bayerische Motoren Werke (EUR) 38,443 3,475
Ferrari 8,840 1,194
Honda Motor (JPY) 86,400 2,533
Suzuki Motor (JPY) 89,500 4,932
Tesla (1) 15,231 5,223
Toyota Motor (JPY) 167,900 10,858
28,215
Hotels, Restaurants & Leisure 1.0%
Compass Group (GBP) 213,650 4,554
Darden Restaurants 8,500 910
Domino's Pizza 824 233
Hilton Worldwide Holdings 41,124 3,255
Las Vegas Sands 32,289 2,466
Marriott, Class A 52,157 6,603
McDonald's 26,077 4,086
MGM Resorts International 88,149 2,559
Norwegian Cruise Line Holdings (1) 72,327 3,418
Restaurant Brands International 21,664 1,306
Royal Caribbean Cruises 33,468 3,467
Starbucks 16,301 796
Wynn Resorts 15,812 2,646

srbal_0618_P4Proof #
T. Rowe PRICe BalanCed Fund
Shares/Par $ Value
(Cost and value in $000s)
19
Yum! Brands 52,457 4,103
40,402
Household Durables 0.4%
Lennar, B Shares 388 17
Lennar, Class A 26,722 1,403
Mohawk Industries (1) 3,465 742
NVR (1) 92 273
Panasonic (JPY) 409,100 5,517
Persimmon (GBP) 157,771 5,255
Sony (JPY) 64,200 3,288
16,495
Internet & Direct Marketing Retail 3.1%
Amazon.com (1) 47,242 80,302
Booking Holdings (1) 16,453 33,352
Ctrip.com International, ADR (1) 6,180 294
Netflix (1) 35,946 14,070
Zalando (EUR)(1)(2) 27,398 1,527
129,545
Media 1.0%
Charter Communications, Class A (1) 18,364 5,385
Comcast, Class A 294,057 9,648
CyberAgent (JPY) 59,400 3,562
Eutelsat Communications (EUR) 148,405 3,071
Liberty Broadband, Class C (1) 22,602 1,711
Stroeer (EUR) 39,681 2,396
Twenty-First Century Fox, Class A 19,790 983
Twenty-First Century Fox, Class B 122,400 6,031
Walt Disney 22,292 2,337
WPP (GBP) 399,633 6,279
41,403
Multiline Retail 0.2%
Dollar General 52,293 5,156
Lojas Renner (BRL) 213,299 1,593
6,749

srbal_0618_P4Proof #
T. Rowe PRICe BalanCed Fund
Shares/Par $ Value
(Cost and value in $000s)
20
Specialty Retail 0.8%
AutoZone (1) 1,524 1,023
Home Depot 48,059 9,376
Kingfisher (GBP) 1,546,345 6,047
L Brands 14,100 520
Lowe's 5,126 490
O'Reilly Automotive (1) 5,742 1,571
Ross Stores 115,957 9,827
TJX 18,649 1,775
Ulta Beauty (1) 4,996 1,166
31,795
Textiles, Apparel & Luxury Goods 0.7%
Burberry Group (GBP) 207,546 5,899
Hanesbrands 176,672 3,890
Kering (EUR) 10,352 5,831
Moncler (EUR) 118,616 5,382
Nike, Class B 48,267 3,846
Samsonite International (HKD)(2) 739,800 2,627
Tapestry 23,068 1,078
28,553
Total Consumer Discretionary 347,313
CONSUMER STAPLES 3.5%
Beverages 0.5%
Coca-Cola 64,307 2,820
Constellation Brands, Class A 4,687 1,026
Diageo (GBP) 184,596 6,632
Dr Pepper Snapple Group 28,836 3,518
Kirin Holdings (JPY) 95,100 2,549
Monster Beverage (1) 1,441 83
PepsiCo 41,166 4,482
21,110
Food & Staples Retailing 0.3%
Costco Wholesale 12,773 2,669
Seven & i Holdings (JPY) 140,000 6,106

srbal_0618_P4Proof #
T. Rowe PRICe BalanCed Fund
Shares/Par $ Value
(Cost and value in $000s)
21
Wal-Mart 26,731 2,290
11,065
Food Products 1.4%
Bunge 69,958 4,877
Kraft Heinz 30,893 1,941
Mondelez International, Class A 62,797 2,574
Nestle (CHF) 248,477 19,257
Tyson Foods, Class A 358,793 24,703
Wilmar International (SGD) 1,453,900 3,260
56,612
Household Products 0.4%
Church & Dwight 15,117 804
Colgate-Palmolive 5,115 331
Essity, B Shares (SEK) 147,151 3,620
Kimberly-Clark 59,055 6,221
Procter & Gamble 42,155 3,291
14,267
Personal Products 0.6%
L'Oreal (EUR) 29,974 7,390
Pola Orbis Holdings (JPY) 54,500 2,395
Unilever (GBP) 284,902 15,738
25,523
Tobacco 0.3%
Altria Group 46,750 2,655
Philip Morris International 141,484 11,423
14,078
Total Consumer Staples 142,655
ENERGY 2.7%
Energy Equipment & Services 0.1%
Schlumberger 25,395 1,702
WorleyParsons (AUD) 250,409 3,235
4,937

srbal_0618_P4Proof #
T. Rowe PRICe BalanCed Fund
Shares/Par $ Value
(Cost and value in $000s)
22
Oil, Gas & Consumable Fuels 2.6%
Andeavor 19,517 2,560
Apache 23,363 1,092
BP, ADR 132,195 6,036
Canadian Natural Resources 45,500 1,641
Chevron 92,044 11,637
Concho Resources (1) 41,424 5,731
ConocoPhillips 30,904 2,152
Continental Resources (1) 10,500 680
Diamondback Energy 11,237 1,478
EOG Resources 61,920 7,705
Equinor (NOK) 147,441 3,899
Exxon Mobil 120,807 9,994
Hess 23,885 1,598
Marathon Petroleum 13,024 914
Phillips 66 50,800 5,705
Plains GP Holdings, Class A 78,768 1,883
Royal Dutch Shell, Class B, ADR 123,400 8,965
Total (EUR) 222,137 13,490
Total, ADR 125,797 7,618
TransCanada 226,085 9,767
Valero Energy 26,397 2,926
107,471
Total Energy 112,408
FINANCIALS 10.9%
Banks 5.1%
ABN AMRO Group, GDR (EUR)(2) 149,541 3,867
Australia & New Zealand Banking Group (AUD) 352,333 7,374
Bank of America 101,547 2,863
Barclays, ADR 108,517 1,088
BNP Paribas (EUR) 138,586 8,572
Citigroup 197,514 13,218
Commerzbank (EUR)(1) 132,158 1,261
Danske Bank (DKK) 164,869 5,136
DBS Group Holdings (SGD) 358,800 6,978

srbal_0618_P4Proof #
T. Rowe PRICe BalanCed Fund
Shares/Par $ Value
(Cost and value in $000s)
23
DNB (NOK) 445,187 8,669
Erste Group Bank (EUR) 84,923 3,540
Fifth Third Bancorp 198,591 5,700
First Republic Bank 69,569 6,734
ING Groep (EUR) 549,902 7,894
Intesa Sanpaolo (EUR) (1) 1,462,824 4,232
Intesa Sanpaolo, Rights, 7/17/18 (EUR) 1,462,824 —
JPMorgan Chase 252,067 26,265
KeyCorp 61,046 1,193
Lloyds Banking Group (GBP) 7,883,951 6,541
Mitsubishi UFJ Financial (JPY) 1,289,500 7,305
National Bank of Canada (CAD) 127,700 6,131
Nordea Bank (SEK) 770,064 7,387
PNC Financial Services Group 87,993 11,888
Standard Chartered (GBP) 392,904 3,569
Sumitomo Mitsui Trust Holdings (JPY) 101,454 4,003
SVB Financial Group (1) 1,800 520
Svenska Handelsbanken, A Shares (SEK) 551,677 6,110
U.S. Bancorp 198,042 9,906
United Overseas Bank (SGD) 184,200 3,610
Wells Fargo 534,293 29,621
211,175
Capital Markets 2.2%
Ameriprise Financial 606 85
Bank of New York Mellon 132,519 7,147
BlackRock 976 487
Brookfield Asset Management, Class A 7,100 288
Cboe Global Markets 7,300 760
Charles Schwab 231,630 11,836
Close Brothers Group (GBP) 36,977 722
CME Group 4,033 661
Franklin Resources 15,520 497
GAM Holding (CHF) 155,087 2,132
Intercontinental Exchange 192,273 14,142
KKR, Class A 16,252 404
Macquarie Group (AUD) 66,398 6,051

srbal_0618_P4Proof #
T. Rowe PRICe BalanCed Fund
Shares/Par $ Value
(Cost and value in $000s)
24
Morgan Stanley 325,902 15,448
Nasdaq 9,105 831
Northern Trust 3,600 370
Raymond James Financial 15,633 1,397
S&P Global 17,807 3,630
State Street 123,157 11,465
TD Ameritrade Holding 199,685 10,937
89,290
Consumer Finance 0.1%
Ally Financial 21,598 568
Capital One Financial 11,643 1,070
Credit Saison (JPY) 134,800 2,118
Synchrony Financial 34,522 1,152
4,908
Diversified Financial Services 0.4%
AXA Equitable Holdings (1) 49,020 1,010
Berkshire Hathaway, Class B (1) 19,966 3,727
Challenger (AUD) 491,363 4,300
Element Fleet Management (CAD) 598,546 2,814
Mitsubishi UFJ Lease & Finance (JPY) 437,700 2,683
Voya Financial 26,383 1,240
15,774
Insurance 3.1%
AIA Group (HKD) 626,400 5,457
American International Group 212,640 11,274
Aviva (GBP) 641,451 4,256
AXA (EUR) 366,894 8,965
Brighthouse Financial (1) 4,646 186
Chubb 88,865 11,288
CNA Financial 8,113 371
Direct Line Insurance Group (GBP) 965,120 4,355
FNF Group 6,914 260
Loews 15,126 730
Marsh & McLennan 133,412 10,936
MetLife 185,176 8,074

srbal_0618_P4Proof #
T. Rowe PRICe BalanCed Fund
Shares/Par $ Value
(Cost and value in $000s)
25
Munich Re (EUR) 34,574 7,269
Ping An Insurance Group, H Shares (HKD) 482,000 4,414
Progressive 42,981 2,542
Prudential (GBP) 339,633 7,742
RSA Insurance Group (GBP) 495,860 4,435
Storebrand (NOK) 574,909 4,627
Sun Life Financial (CAD) 157,100 6,313
Tokio Marine Holdings (JPY) 143,900 6,732
Willis Towers Watson 65,821 9,978
XL Group 5,567 312
Zurich Insurance Group (CHF) 17,484 5,171
125,687
Total Financials 446,834
HEALTH CARE 8.8%
Biotechnology 1.0%
AbbVie 30,851 2,858
Alexion Pharmaceuticals (1) 62,025 7,700
Amgen 10,695 1,974
Biogen (1) 6,583 1,911
BioMarin Pharmaceutical (1) 3,832 361
Celgene (1) 24,443 1,941
CSL (AUD) 21,020 2,992
Gilead Sciences 46,950 3,326
Incyte (1) 4,111 276
Shire, ADR 33,537 5,661
Vertex Pharmaceuticals (1) 67,991 11,556
40,556
Health Care Equipment & Supplies 2.7%
Abbott Laboratories 37,572 2,291
Align Technology (1) 2,600 889
Becton Dickinson & Company 95,555 22,891
Boston Scientific (1) 45,200 1,478
Cooper Companies 11,654 2,744
Danaher 135,986 13,419
Elekta, B Shares (SEK) 268,012 3,523

srbal_0618_P4Proof #
T. Rowe PRICe BalanCed Fund
Shares/Par $ Value
(Cost and value in $000s)
26
GN Store Nord (DKK) 143,204 6,507
Hologic (1) 73,805 2,934
Intuitive Surgical (1) 26,349 12,607
Koninklijke Philips (EUR) 265,793 11,261
Medtronic 126,387 10,820
Stryker 103,919 17,548
Zimmer Biomet Holdings 7,400 825
109,737
Health Care Providers & Services 2.0%
Aetna 22,255 4,084
AmerisourceBergen 3,694 315
Anthem 50,273 11,966
Centene (1) 24,956 3,075
Cigna 53,141 9,031
CVS Health 140,749 9,057
Envision Healthcare (1) 1,330 59
Express Scripts Holding (1) 22,407 1,730
Fresenius (EUR) 119,770 9,589
HCA Healthcare 11,507 1,181
Humana 11,495 3,421
McKesson 4,065 542
Miraca Holdings (JPY) 56,900 1,693
UnitedHealth Group 107,886 26,469
Universal Health Services, Class B 3,243 361
82,573
Health Care Technology 0.1%
Siemens Healthineers (EUR)(1)(2) 82,235 3,389
3,389
Life Sciences Tools & Services 0.4%
Agilent Technologies 104,009 6,432
Illumina (1) 344 96
Thermo Fisher Scientific 56,189 11,639
18,167
Pharmaceuticals 2.6%
Allergan 12,329 2,056

srbal_0618_P4Proof #
T. Rowe PRICe BalanCed Fund
Shares/Par $ Value
(Cost and value in $000s)
27
Astellas Pharma (JPY) 576,100 8,768
Bayer (EUR) 123,045 13,513
Bristol-Myers Squibb 14,281 790
Eli Lilly 20,736 1,769
GlaxoSmithKline, ADR 164,900 6,647
Johnson & Johnson 58,511 7,100
Merck 211,580 12,843
Novartis (CHF) 185,154 14,026
Novo Nordisk, Series B (DKK) 64,089 2,960
Pfizer 434,829 15,776
Roche Holding (CHF) 57,567 12,772
Sanofi (EUR) 93,153 7,476
Zoetis 17,177 1,463
107,959
Total Health Care 362,381
INDUSTRIALS & BUSINESS SERVICES 5.7%
Aerospace & Defense 1.6%
Boeing 108,635 36,448
Harris 44,975 6,501
L3 Technologies 3,819 735
Meggitt (GBP) 830,797 5,391
Northrop Grumman 43,556 13,402
Textron 41,894 2,761
65,238
Air Freight & Logistics 0.1%
FedEx 9,588 2,177
2,177
Airlines 0.6%
Alaska Air Group 41,900 2,530
American Airlines 330,696 12,553
Delta Air Lines 82,148 4,070
Southwest Airlines 37,100 1,888
United Continental Holdings (1) 34,716 2,421
23,462

srbal_0618_P4Proof #
T. Rowe PRICe BalanCed Fund
Shares/Par $ Value
(Cost and value in $000s)
28
Building Products 0.1%
Fortune Brands Home & Security 13,122 704
Johnson Controls International 163,037 5,454
6,158
Commercial Services & Supplies 0.1%
Cintas 6,116 1,132
Republic Services 4,000 274
Stericycle (1) 27,759 1,812
Waste Connections 29,169 2,196
5,414
Electrical Equipment 0.6%
ABB (CHF) 261,494 5,704
Hubbell 8,686 919
Legrand (EUR) 48,875 3,580
Melrose Industries (GBP) 860,689 2,408
Mitsubishi Electric (JPY) 678,200 8,998
Prysmian (EUR) 111,791 2,774
Sensata Technologies Holding (1) 11,400 543
24,926
Industrial Conglomerates 1.1%
CK Hutchison Holdings (HKD) 588,468 6,230
DCC (GBP) 47,609 4,317
Honeywell International 75,745 10,911
Roper Technologies 33,007 9,107
Sembcorp Industries (SGD) 347,660 700
Siemens (EUR) 102,351 13,485
44,750
Machinery 0.6%
Flowserve 28,628 1,156
Fortive 69,722 5,376
PACCAR 40,956 2,538
Pentair 26,394 1,111
SMC (JPY) 9,600 3,514
Snap-on 5,728 921

srbal_0618_P4Proof #
T. Rowe PRICe BalanCed Fund
Shares/Par $ Value
(Cost and value in $000s)
29
Stanley Black & Decker 45,710 6,071
THK (JPY) 173,900 4,965
Wabtec 7,337 723
26,375
Professional Services 0.2%
CoStar Group (1) 2,899 1,196
Equifax 6,397 800
IHS Markit (1) 1,760 91
Nielsen Holdings 14,900 461
Recruit Holdings (JPY) 153,800 4,248
TransUnion 6,620 474
7,270
Road & Rail 0.3%
Canadian Pacific Railway 5,000 915
Central Japan Railway (JPY) 24,500 5,072
CSX 47,961 3,059
Kansas City Southern 24,500 2,596
Union Pacific 2,100 298
11,940
Trading Companies & Distributors 0.4%
HD Supply Holdings (1) 14,964 642
Mitsubishi (JPY) 175,300 4,861
Sumitomo (JPY) 566,000 9,282
14,785
Total Industrials & Business Services 232,495
INFORMATION TECHNOLOGY 13.4%
Communications Equipment 0.5%
Cisco Systems 425,198 18,296
Juniper Networks 18,800 516
LM Ericsson, B Shares (SEK) 306,304 2,360
Motorola Solutions 8,700 1,012
22,184
Electronic Equipment, Instruments & Components 0.5%
Amphenol, Class A 23,500 2,048

srbal_0618_P4Proof #
T. Rowe PRICe BalanCed Fund
Shares/Par $ Value
(Cost and value in $000s)
30
Corning 114,148 3,140
Hamamatsu Photonics KK (JPY) 49,700 2,134
Keysight Technologies (1) 107,758 6,361
Largan Precision (TWD) 20,000 2,938
Omron (JPY) 76,600 3,568
TE Connectivity 911 82
20,271
Internet Software & Services 3.9%
Alibaba Group Holding, ADR (1) 139,236 25,832
Alphabet, Class A (1) 15,300 17,277
Alphabet, Class C (1) 30,464 33,987
Altaba (1)(3) 28,032 2,052
Baidu, ADR (1) 14,000 3,402
Facebook, Class A (1) 271,097 52,680
Kakaku.com (JPY) 109,800 2,473
NAVER (KRW) 2,051 1,404
Tencent Holdings (HKD) 317,500 15,943
Yahoo Japan (JPY)(4) 628,800 2,083
YY, ADR (1) 37,667 3,784
160,917
IT Services 2.2%
Accenture, Class A 23,589 3,859
Adyen (EUR)(1)(2) 813 448
ANT, Class C, Acquisition Date: 6/7/18, Cost $1,137 (1)(5)(6) 202,596 1,136
Black Knight (1) 12,423 665
Fidelity National Information Services 51,428 5,453
Fiserv (1) 65,578 4,859
FleetCor Technologies (1) 10,100 2,128
Gartner (1) 8,501 1,130
Global Payments 44,500 4,961
Infosys, ADR 235,400 4,574
Mastercard, Class A 112,734 22,154
PayPal Holdings (1) 114,876 9,566
Visa, Class A 202,216 26,783

srbal_0618_P4Proof #
T. Rowe PRICe BalanCed Fund
Shares/Par $ Value
(Cost and value in $000s)
31
Worldpay, Class A (1) 43,319 3,543
91,259
Semiconductors & Semiconductor Equipment 2.1%
Applied Materials 76,580 3,537
ASML Holding 700 139
ASML Holding (EUR) 26,052 5,155
Broadcom 98,250 23,839
Intel 12,800 636
KLA-Tencor 20,982 2,151
Lam Research 13,421 2,320
Marvell Technology Group 100,388 2,152
Maxim Integrated Products 68,772 4,034
Microchip Technology 58,160 5,290
NXP Semiconductors (1) 10,500 1,147
Renesas Electronics (JPY)(1) 212,000 2,072
Taiwan Semiconductor Manufacturing (TWD) 1,353,969 9,615
Texas Instruments 156,333 17,236
Tokyo Electron (JPY) 38,600 6,626
Xilinx 2,400 157
86,106
Software 3.4%
Activision Blizzard 58,174 4,440
CDK Global 7,757 504
Electronic Arts (1) 57,315 8,082
Intuit 49,990 10,213
Microsoft 739,033 72,876
Oracle 66,900 2,948
Red Hat (1) 45,576 6,124
Salesforce.com (1) 108,979 14,865
ServiceNow (1) 52,262 9,014
Symantec 91,130 1,882
Synopsys (1) 57,937 4,958
Take-Two Interactive Software (1) 2,600 308
VMware, Class A (1) 259 38

srbal_0618_P4Proof #
T. Rowe PRICe BalanCed Fund
Shares/Par $ Value
(Cost and value in $000s)
32
Workday (1) 26,900 3,258
139,510
Technology Hardware, Storage & Peripherals 0.8%
Apple 122,700 22,713
Hewlett Packard Enterprise 76,664 1,120
Samsung Electronics (KRW) 179,963 7,539
31,372
Total Information Technology 551,619
MATERIALS 2.3%
Chemicals 1.3%
Air Liquide (EUR) 36,309 4,551
Air Products & Chemicals 11,961 1,863
Asahi Kasei (JPY) 413,800 5,248
BASF (EUR) 60,060 5,734
CF Industries Holdings 64,550 2,866
Covestro (EUR)(2) 34,143 3,035
DowDuPont 206,224 13,594
Johnson Matthey (GBP) 103,365 4,922
PPG Industries 9,478 983
RPM 7,211 420
Sherwin-Williams 7,770 3,167
Tosoh (JPY) 61,000 943
Umicore (EUR) 92,037 5,254
Valvoline 13,665 295
52,875
Construction Materials 0.0%
Martin Marietta Materials 4,300 960
Vulcan Materials 6,999 903
1,863
Containers & Packaging 0.5%
Amcor (AUD) 364,969 3,889
Ball 48,171 1,713
International Paper 236,451 12,314

srbal_0618_P4Proof #
T. Rowe PRICe BalanCed Fund
Shares/Par $ Value
(Cost and value in $000s)
33
Sealed Air 12,400 526
18,442
Metals & Mining 0.4%
Antofagasta (GBP) 197,335 2,564
BHP Billiton (GBP) 207,765 4,663
BHP Billiton (AUD) 54,734 1,370
Independence Group (AUD) 995,032 3,782
Rio Tinto (AUD) 35,290 2,180
South32 (AUD) 930,156 2,484
Southern Copper 8,900 417
17,460
Paper & Forest Products 0.1%
Stora Enso, R Shares (EUR) 244,485 4,763
4,763
Total Materials 95,403
REAL ESTATE 1.0%
Equity Real Estate Investment 0.9%
American Tower, REIT 17,795 2,566
AvalonBay Communities, REIT 4,900 842
Crown Castle International, REIT 100,894 10,878
Equinix, REIT 4,232 1,819
Equity Residential, REIT 13,986 891
GGP, REIT 38,111 779
Great Portland Estates (GBP) 214,280 2,019
JBG SMITH Properties, REIT 6,700 244
Prologis, REIT 29,390 1,931
Public Storage, REIT 3,100 703
Regency Centers, REIT 10,604 658
Scentre Group (AUD) 1,158,827 3,765
Simon Property Group, REIT 1,800 306
SL Green Realty, REIT 24,886 2,502
Unibail-Rodamco-Westfield (EUR) 19,882 4,378
Vornado Realty Trust, REIT 11,995 887
srbal_0618_P4Proof #
T. Rowe PRICe BalanCed Fund
Shares/Par $ Value
(Cost and value in $000s)
34
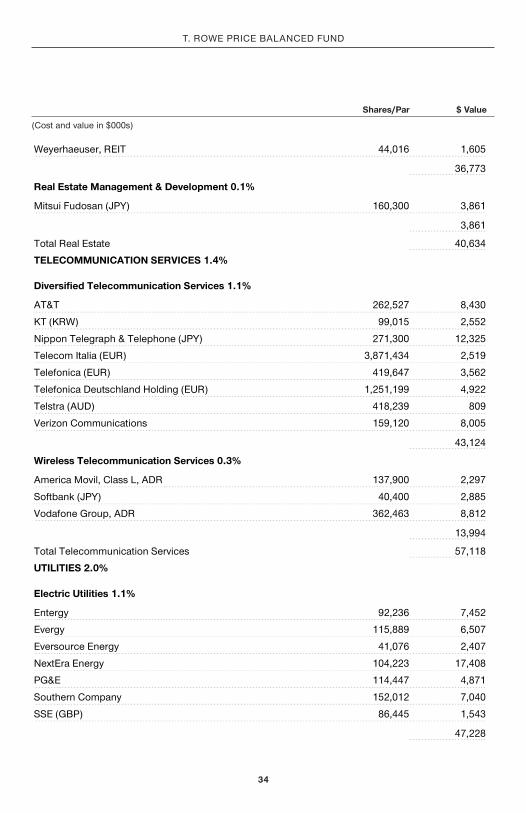
Weyerhaeuser, REIT 44,016 1,605
36,773
Real Estate Management & Development 0.1%
Mitsui Fudosan (JPY) 160,300 3,861
3,861
Total Real Estate 40,634
TELECOMMUNICATION SERVICES 1.4%
Diversified Telecommunication Services 1.1%
AT&T 262,527 8,430
KT (KRW) 99,015 2,552
Nippon Telegraph & Telephone (JPY) 271,300 12,325
Telecom Italia (EUR) 3,871,434 2,519
Telefonica (EUR) 419,647 3,562
Telefonica Deutschland Holding (EUR) 1,251,199 4,922
Telstra (AUD) 418,239 809
Verizon Communications 159,120 8,005
43,124
Wireless Telecommunication Services 0.3%
America Movil, Class L, ADR 137,900 2,297
Softbank (JPY) 40,400 2,885
Vodafone Group, ADR 362,463 8,812
13,994
Total Telecommunication Services 57,118
UTILITIES 2.0%
Electric Utilities 1.1%
Entergy 92,236 7,452
Evergy 115,889 6,507
Eversource Energy 41,076 2,407
NextEra Energy 104,223 17,408
PG&E 114,447 4,871
Southern Company 152,012 7,040
SSE (GBP) 86,445 1,543
47,228

srbal_0618_P4Proof #
T. Rowe PRICe BalanCed Fund
Shares/Par $ Value
(Cost and value in $000s)
35
Gas Utilities 0.0%
Atmos Energy 8,473 764
764
Independent Power & Renewable Electricity Producers 0.1%
Electric Power Development, Class C (JPY) 149,800 3,866
3,866
Multi-Utilities 0.8%
DTE Energy 31,758 3,291
E.ON (EUR) 180,160 1,920
Engie (EUR) 389,722 5,962
National Grid (GBP) 412,025 4,553
NiSource 174,211 4,578
Sempra Energy 90,629 10,523
30,827
Water Utilities 0.0%
American Water Works 18,545 1,583
1,583
Total Utilities 84,268
Total Common Stocks (Cost $1,442,974) 2,473,128
CONVERTIBLE PREFERRED STOCKS 0.1%
HEALTH CARE 0.0%
Health Care Equipment & Supplies 0.0%
Becton Dickinson & Company, Series A, 6.125%, 5/1/20 (1) 18,563 1,149
Total Health Care 1,149
INDUSTRIALS & BUSINESS SERVICES 0.0%
Machinery 0.0%
Fortive, Series A, 5.00%, 7/1/21 (1) 824 830
Total Industrials & Business Services 830
srbal_0618_P4Proof #
T. Rowe PRICe BalanCed Fund
Shares/Par $ Value
(Cost and value in $000s)
36
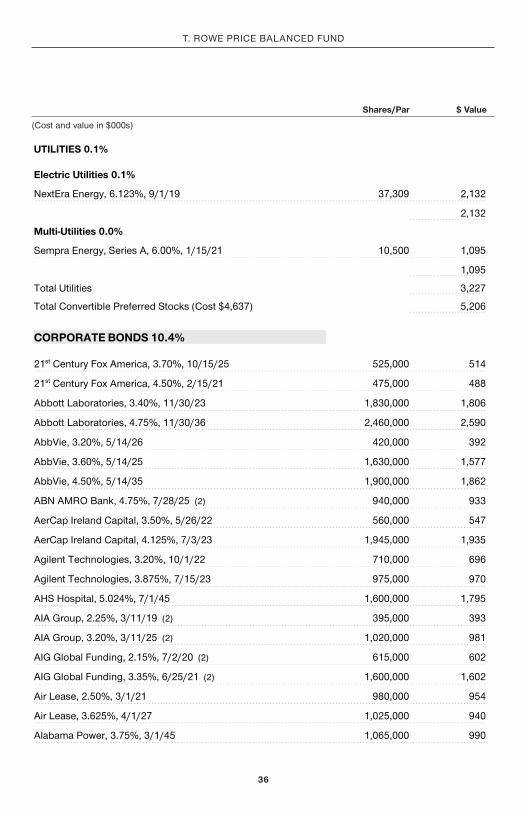
UTILITIES 0.1%
Electric Utilities 0.1%
NextEra Energy, 6.123%, 9/1/19 37,309 2,132
2,132
Multi-Utilities 0.0%
Sempra Energy, Series A, 6.00%, 1/15/21 10,500 1,095
1,095
Total Utilities 3,227
Total Convertible Preferred Stocks (Cost $4,637) 5,206
CORPORATE BONDS 10.4%
21st Century Fox America, 3.70%, 10/15/25 525,000 514
21st Century Fox America, 4.50%, 2/15/21 475,000 488
Abbott Laboratories, 3.40%, 11/30/23 1,830,000 1,806
Abbott Laboratories, 4.75%, 11/30/36 2,460,000 2,590
AbbVie, 3.20%, 5/14/26 420,000 392
AbbVie, 3.60%, 5/14/25 1,630,000 1,577
AbbVie, 4.50%, 5/14/35 1,900,000 1,862
ABN AMRO Bank, 4.75%, 7/28/25 (2) 940,000 933
AerCap Ireland Capital, 3.50%, 5/26/22 560,000 547
AerCap Ireland Capital, 4.125%, 7/3/23 1,945,000 1,935
Agilent Technologies, 3.20%, 10/1/22 710,000 696
Agilent Technologies, 3.875%, 7/15/23 975,000 970
AHS Hospital, 5.024%, 7/1/45 1,600,000 1,795
AIA Group, 2.25%, 3/11/19 (2) 395,000 393
AIA Group, 3.20%, 3/11/25 (2) 1,020,000 981
AIG Global Funding, 2.15%, 7/2/20 (2) 615,000 602
AIG Global Funding, 3.35%, 6/25/21 (2) 1,600,000 1,602
Air Lease, 2.50%, 3/1/21 980,000 954
Air Lease, 3.625%, 4/1/27 1,025,000 940
Alabama Power, 3.75%, 3/1/45 1,065,000 990

srbal_0618_P4Proof #
T. Rowe PRICe BalanCed Fund
Shares/Par $ Value
(Cost and value in $000s)
37
Alexandria Real Estate Equities, 3.95%, 1/15/27 655,000 632
Alfa, 5.25%, 3/25/24 (2) 395,000 400
Alibaba Group Holding, 4.00%, 12/6/37 585,000 544
Allstate, 5.55%, 5/9/35 1,000,000 1,158
Altria Group, 4.75%, 5/5/21 535,000 556
Amazon.com, 2.80%, 8/22/24 1,055,000 1,017
Amazon.com, 3.875%, 8/22/37 1,645,000 1,605
Amazon.com, 5.20%, 12/3/25 1,850,000 2,042
America Movil, 6.375%, 3/1/35 300,000 356
American Airlines PTT, Series 2013-2, Class A, 4.95%, 1/15/23 715,334 735
American Airlines PTT, Series 2014-1, Class A, 3.70%, 10/1/26 1,037,168 1,012
American Airlines PTT, Series 2016-1, Class B, 5.25%, 1/15/24 2,160,424 2,205
American Campus Communities, 3.625%, 11/15/27 1,860,000 1,736
American Campus Communities, 3.35%, 10/1/20 585,000 583
American Express Credit, 2.125%, 7/27/18 1,675,000 1,675
American Express Credit, 2.20%, 3/3/20 1,750,000 1,726
American International Group, 2.30%, 7/16/19 1,080,000 1,071
Amgen, 5.75%, 3/15/40 325,000 369
Analog Devices, 2.85%, 3/12/20 1,465,000 1,458
Anheuser-Busch InBev Finance, 3.65%, 2/1/26 2,305,000 2,256
Anthem, 2.50%, 11/21/20 695,000 683
Anthem, 4.65%, 1/15/43 915,000 882
ANZ New Zealand International, 2.20%, 7/17/20 (2) 930,000 912
ANZ New Zealand International, 2.75%, 1/22/21 (2) 1,965,000 1,930
Aon, 2.80%, 3/15/21 2,085,000 2,048
Appalachian Power, 4.45%, 6/1/45 2,450,000 2,497
Apple, 1.90%, 2/7/20 2,400,000 2,370
Apple, 3.20%, 5/11/27 7,495,000 7,227
APT Pipelines, 4.25%, 7/15/27 (2) 620,000 607
Aptiv, 3.15%, 11/19/20 1,825,000 1,812
Atmos Energy, 4.15%, 1/15/43 1,500,000 1,491

srbal_0618_P4Proof #
T. Rowe PRICe BalanCed Fund
Shares/Par $ Value
(Cost and value in $000s)
38
Ausgrid Finance, 3.85%, 5/1/23 (2) 1,705,000 1,705
AutoZone, 3.125%, 4/21/26 650,000 603
AutoZone, 4.00%, 11/15/20 825,000 837
Avnet, 4.625%, 4/15/26 895,000 882
AXA Equitable Holdings, 3.90%, 4/20/23 (2) 735,000 729
Baidu, 2.75%, 6/9/19 1,240,000 1,235
Baltimore Gas & Electric, 3.35%, 7/1/23 1,750,000 1,730
Banco Santander, 3.125%, 2/23/23 1,000,000 946
Banco Santander, 3.848%, 4/12/23 2,000,000 1,954
Bank of America, 4.20%, 8/26/24 600,000 603
Bank of America, 6.11%, 1/29/37 900,000 1,035
Bank of America, 6.50%, 7/15/18 1,575,000 1,577
Bank of America, 6.75%, 6/1/28 700,000 831
Bank of America, FRN, 3M USD LIBOR + 0.65%, 2.982% 6/25/22 2,575,000 2,572
Bank of Montreal, 2.375%, 1/25/19 1,600,000 1,599
Bank of Montreal, 3.10%, 4/13/21 2,835,000 2,824
Bank of Nova, 3.125%, 4/20/21 3,275,000 3,258
Banque Federale Credit Mutuel, 2.50%, 10/29/18 (2) 2,000,000 1,998
Barclays, 3.25%, 1/12/21 1,800,000 1,774
Barclays Bank, 2.65%, 1/11/21 1,515,000 1,482
BAT Capital, 2.764%, 8/15/22 (2) 2,205,000 2,114
Baxalta, 2.875%, 6/23/20 1,040,000 1,029
Baylor Scott & White Holdings, 3.967%, 11/15/46 1,850,000 1,791
BB&T, 2.25%, 2/1/19 1,200,000 1,197
Becton Dickinson & Company, 3.70%, 6/6/27 3,000,000 2,834
Berkshire Hathaway Energy, 5.15%, 11/15/43 1,350,000 1,500
Biogen, 3.625%, 9/15/22 1,095,000 1,095
BNP Paribas, 2.70%, 8/20/18 1,340,000 1,340
Boardwalk Pipelines, 4.45%, 7/15/27 385,000 374
Boardwalk Pipelines, 4.95%, 12/15/24 780,000 795

srbal_0618_P4Proof #
T. Rowe PRICe BalanCed Fund
Shares/Par $ Value
(Cost and value in $000s)
39
Booking Holdings, 3.60%, 6/1/26 2,020,000 1,965
Booking Holdings, 3.65%, 3/15/25 1,515,000 1,483
Boral Finance, 3.00%, 11/1/22 (2) 220,000 212
Boston Properties, 3.65%, 2/1/26 1,165,000 1,127
Boston Properties, 4.125%, 5/15/21 375,000 382
Boston Properties, REIT, 3.125%, 9/1/23 625,000 609
BP Capital Markets, 1.768%, 9/19/19 680,000 671
BPCE, 3.00%, 5/22/22 (2) 425,000 411
BPCE, 4.50%, 3/15/25 (2) 1,000,000 974
BPCE, 5.70%, 10/22/23 (2) 1,700,000 1,776
Braskem Netherlands Finance, 3.50%, 1/10/23 (2) 1,030,000 974
Brixmor Operating Partnership, 3.90%, 3/15/27 565,000 534
Brixmor Operating Partnership, 4.125%, 6/15/26 1,220,000 1,181
Brixmor Operating Partnership, REIT, 3.875%, 8/15/22 865,000 863
Broadcom, 3.00%, 1/15/22 2,675,000 2,602
Burlington Northern Santa Fe, 4.375%, 9/1/42 1,400,000 1,410
Burlington Northern Santa Fe, 6.15%, 5/1/37 650,000 802
Camden Property Trust, 2.95%, 12/15/22 565,000 548
Canadian Pacific Railway, 7.25%, 5/15/19 200,000 207
Capital One Bank USA, 2.15%, 11/21/18 1,000,000 998
Capital One Financial, 3.45%, 4/30/21 2,730,000 2,723
Carpenter Technology, 4.45%, 3/1/23 790,000 789
Catholic Health Initiatives, 2.60%, 8/1/18 360,000 360
CC Holdings, 3.849%, 4/15/23 440,000 435
Celgene, 3.55%, 8/15/22 1,700,000 1,688
Celgene, 4.625%, 5/15/44 1,200,000 1,114
Celulosa Arauco Y Constitucion, 3.875%, 11/2/27 1,030,000 959
Charter Communications Operating, 4.908%, 7/23/25 2,465,000 2,489
Chubb INA Holdings, 5.90%, 6/15/19 335,000 344
Citibank, 2.125%, 10/20/20 2,000,000 1,948
Citigroup, 2.35%, 8/2/21 1,460,000 1,405

srbal_0618_P4Proof #
T. Rowe PRICe BalanCed Fund
Shares/Par $ Value
(Cost and value in $000s)
40
Citigroup, VR, 3.887%, 1/10/28 (7) 3,335,000 3,229
Citigroup, VR, 4.075%, 4/23/29 (7) 2,000,000 1,955
Citizens Bank, 2.50%, 3/14/19 965,000 963
Citizens Bank, 2.55%, 5/13/21 1,085,000 1,057
Citizens Financial Group, 2.375%, 7/28/21 210,000 203
Citizens Financial Group, 4.30%, 12/3/25 990,000 983
CMS Energy, 4.70%, 3/31/43 840,000 854
CMS Energy, 4.875%, 3/1/44 1,200,000 1,272
CNA Financial, 3.95%, 5/15/24 315,000 314
CNA Financial, 5.875%, 8/15/20 800,000 841
Columbia Pipeline Group, 3.30%, 6/1/20 1,300,000 1,292
Commonwealth Bank of Australia, 4.50%, 12/9/25 (2) 1,750,000 1,733
Concho Resources, 3.75%, 10/1/27 665,000 638
Continental Airlines PTT, Series 2010-1, Class A, 4.75% 1/12/21 167,316 170
Cooperatieve Rabobank, 3.125%, 4/26/21 1,805,000 1,795
Credit Agricole, 3.75%, 4/24/23 (2) 2,125,000 2,082
Credit Suisse Group, VR, 2.997%, 12/14/23 (2)(7) 1,385,000 1,325
CRH America Finance, 3.95%, 4/4/28 (2) 2,600,000 2,513
Crown Castle International, 3.40%, 2/15/21 485,000 484
Crown Castle Towers, 3.222%, 5/15/22 (2) 45,000 44
Crown Castle Towers, 3.663%, 5/15/25 (2) 485,000 478
Crown Castle Towers, 3.72%, 7/15/23 (2) 490,000 490
CVS Health, 3.125%, 3/9/20 3,780,000 3,776
Danone, 2.947%, 11/2/26 (2) 1,925,000 1,768
Delphi, 4.15%, 3/15/24 745,000 749
Delta Air Lines, 2.875%, 3/13/20 2,200,000 2,180
Delta Air Lines, 3.80%, 4/19/23 765,000 756
Delta Air Lines PTT, Series 2009-1, Class A, 7.75%, 12/17/19 253,406 265
Delta Air Lines PTT, Series 2010-2, Class A, 4.95%, 5/23/19 87,749 89
Discover Financial Services, 3.75%, 3/4/25 590,000 563

srbal_0618_P4Proof #
T. Rowe PRICe BalanCed Fund
Shares/Par $ Value
(Cost and value in $000s)
41
Discover Financial Services, 10.25%, 7/15/19 400,000 425
Dominion Energy, 2.75%, 9/15/22 200,000 192
Dominion Energy, STEP, 2.579%, 7/1/20 640,000 631
Duke Energy, 2.65%, 9/1/26 640,000 575
Duke Energy, 3.75%, 9/1/46 500,000 443
DXC Technology, 2.875%, 3/27/20 920,000 912
Eaton Vance, 3.625%, 6/15/23 750,000 752
Enbridge, 4.00%, 10/1/23 690,000 692
Enbridge, 4.25%, 12/1/26 590,000 587
Enbridge, Series 16-A, VR, 6.00%, 1/15/77 (7) 1,135,000 1,070
Enbridge Energy Partners, 5.50%, 9/15/40 245,000 252
Enel Finance International, 2.75%, 4/6/23 (2) 1,665,000 1,551
EnLink Midstream Partners, 2.70%, 4/1/19 370,000 367
EOG Resources, 2.625%, 3/15/23 500,000 481
EOG Resources, 6.875%, 10/1/18 500,000 505
ERAC USA Finance, 2.80%, 11/1/18 (2) 170,000 170
ERAC USA Finance, 3.85%, 11/15/24 (2) 435,000 431
ERAC USA Finance, 4.50%, 2/15/45 (2) 505,000 475
Expedia, 5.00%, 2/15/26 1,810,000 1,846
Express Scripts Holding, 2.60%, 11/30/20 1,930,000 1,891
Express Scripts Holding, 3.00%, 7/15/23 810,000 769
Federal Realty Investment Trust, REIT, 2.75%, 6/1/23 1,500,000 1,437
Fidelity National Information Services, 4.25%, 5/15/28 2,590,000 2,597
Fifth Third Bancorp, 3.50%, 3/15/22 340,000 340
First American Financial, 4.60%, 11/15/24 415,000 415
FirstEnergy Transmission, 4.35%, 1/15/25 (2) 1,310,000 1,321
FMR, 4.95%, 2/1/33 (2) 740,000 791
Ford Motor Credit, 2.551%, 10/5/18 1,745,000 1,744
Ford Motor Credit, 5.75%, 2/1/21 600,000 630
Fresnillo, 5.50%, 11/13/23 (2) 805,000 833
GATX, 2.60%, 3/30/20 160,000 158

srbal_0618_P4Proof #
T. Rowe PRICe BalanCed Fund
Shares/Par $ Value
(Cost and value in $000s)
42
GATX, 4.85%, 6/1/21 1,000,000 1,036
GE Capital International Funding, 2.342%, 11/15/20 877,000 857
General Electric, 5.30%, 2/11/21 232,000 242
General Electric, 5.50%, 1/8/20 72,000 75
General Motors, 3.50%, 10/2/18 1,165,000 1,167
General Motors, 4.00%, 4/1/25 1,120,000 1,088
General Motors Financial, 3.10%, 1/15/19 1,180,000 1,181
George Washington University, 4.30%, 9/15/44 975,000 1,001
Gilead Sciences, 1.85%, 9/20/19 790,000 781
Gilead Sciences, 3.25%, 9/1/22 875,000 870
Goldcorp, 3.625%, 6/9/21 1,260,000 1,258
Goldman Sachs Group, 2.75%, 9/15/20 1,300,000 1,284
Goldman Sachs Group, 3.00%, 4/26/22 3,935,000 3,847
Goldman Sachs Group, 4.25%, 10/21/25 1,865,000 1,834
Goldman Sachs Group, 5.75%, 1/24/22 380,000 406
Goldman Sachs Group, 6.75%, 10/1/37 700,000 830
Grain Spectrum Funding, 4.00%, 10/10/18 (2) 2,300,000 2,299
Harris, 3.832%, 4/27/25 570,000 558
Healthcare Realty Trust, 3.625%, 1/15/28 1,075,000 1,006
Healthcare Realty Trust, 3.75%, 4/15/23 1,010,000 996
Heathrow Funding, 4.875%, 7/15/21 (2) 935,000 979
Hewlett Packard Enterprise, 2.10%, 10/4/19 (2) 1,010,000 997
High Street Funding Trust I, 4.111%, 2/15/28 (2) 1,800,000 1,777
Howard Hughes Medical Institute, 3.50%, 9/1/23 1,280,000 1,298
HSBC Bank USA, 5.875%, 11/1/34 950,000 1,088
HSBC Holdings, VR, 3.262%, 3/13/23 (7) 1,800,000 1,762
Humana, 2.625%, 10/1/19 300,000 298
Hyatt Hotels, 3.375%, 7/15/23 275,000 269
Hyundai Capital America, 2.55%, 2/6/19 (2) 1,720,000 1,714
Hyundai Capital America, 3.45%, 3/12/21 (2) 3,145,000 3,127
Iberdrola International, 6.75%, 9/15/33 1,000,000 1,161

srbal_0618_P4Proof #
T. Rowe PRICe BalanCed Fund
Shares/Par $ Value
(Cost and value in $000s)
43
Illinois Tool Works, 3.90%, 9/1/42 1,200,000 1,178
Imperial Brands Finance, 2.05%, 7/20/18 (2) 670,000 670
ING Groep, 3.15%, 3/29/22 560,000 549
Intercontinental Exchange, 2.50%, 10/15/18 455,000 455
Intercontinental Exchange, 2.75%, 12/1/20 965,000 955
International Paper, 4.40%, 8/15/47 1,180,000 1,071
Interpublic Group, 4.00%, 3/15/22 450,000 451
Interpublic Group, 4.20%, 4/15/24 585,000 590
Intesa Sanpaolo, 3.125%, 7/14/22 (2) 1,875,000 1,725
Intesa Sanpaolo, 3.375%, 1/12/23 (2) 660,000 606
Invesco Finance, 3.125%, 11/30/22 480,000 474
JB Hunt Transport Services, 2.40%, 3/15/19 255,000 254
John Deere Capital, 2.35%, 1/8/21 1,255,000 1,233
JPMorgan Chase, 2.75%, 6/23/20 2,445,000 2,423
JPMorgan Chase, 3.375%, 5/1/23 1,080,000 1,055
JPMorgan Chase, 4.50%, 1/24/22 2,000,000 2,069
JPMorgan Chase, VR, 3.559%, 4/23/24 (7) 1,875,000 1,856
JPMorgan Chase, VR, 3.882%, 7/24/38 (7) 2,460,000 2,273
Kaiser Foundation Hospitals, 3.50%, 4/1/22 625,000 631
Kansas Gas & Electric, 6.70%, 6/15/19 (2) 280,000 289
KeyBank, 3.35%, 6/15/21 2,675,000 2,678
Keysight Technologies, 3.30%, 10/30/19 1,870,000 1,863
Kilroy Realty, REIT, 3.45%, 12/15/24 1,350,000 1,296
Kilroy Realty, REIT, 4.375%, 10/1/25 480,000 480
Liberty Mutual Group, 4.25%, 6/15/23 (2) 410,000 415
Liberty Mutual Group, 4.85%, 8/1/44 (2) 1,700,000 1,695
Lockheed Martin, 3.80%, 3/1/45 650,000 597
Magellan Midstream Partners, 6.55%, 7/15/19 155,000 160
Manufacturers & Traders Trust, 3.40%, 8/17/27 250,000 242
Manufacturers & Traders Trust, VR, 3.317%, 12/28/20 834,000 833

srbal_0618_P4Proof #
T. Rowe PRICe BalanCed Fund
Shares/Par $ Value
(Cost and value in $000s)
44
Maple Escrow Subsidiary, 3.551%, 5/25/21 (2) 1,710,000 1,709
Marsh & McLennan, 2.55%, 10/15/18 495,000 495
Marsh & McLennan, 3.50%, 6/3/24 3,060,000 3,016
Marsh & McLennan, 4.35%, 1/30/47 235,000 233
MassMutual Global Funding II, 1.95%, 9/22/20 (2) 1,496,000 1,454
Mayo Clinic, 4.00%, 11/15/47 1,500,000 1,485
Mead Johnson Nutrition, 4.125%, 11/15/25 200,000 204
Microchip Technology, 3.922%, 6/1/21 (2) 650,000 651
Mid-atlantic Interstate Transmission, 4.10%, 5/15/28 (2) 2,640,000 2,641
Mississippi Power, 3.95%, 3/30/28 1,435,000 1,419
Morgan Stanley, 4.30%, 1/27/45 1,150,000 1,084
Morgan Stanley, 6.25%, 8/9/26 755,000 853
Morgan Stanley, VR, 3.971%, 7/22/38 (7) 1,445,000 1,338
Nabors Industries, 5.50%, 1/15/23 675,000 648
National Rural Utilities Cooperative Finance, 2.35%, 6/15/20 725,000 716
National Rural Utilities Cooperative Finance, 2.90%, 3/15/21 3,220,000 3,195
NBCUniversal Enterprise, 1.974%, 4/15/19 (2) 855,000 849
New York Life Global Funding, 1.50%, 10/24/19 (2) 2,960,000 2,901
NiSource, 3.49%, 5/15/27 1,730,000 1,656
NiSource, 3.95%, 3/30/48 1,775,000 1,621
Nordea Bank, 2.125%, 5/29/20 (2) 1,500,000 1,470
Norfolk Southern, 3.00%, 4/1/22 1,085,000 1,073
Northern Trust, 6.50%, 8/15/18 250,000 251
Northwestern Univ., 3.812%, 12/1/50 2,000,000 1,960
NSTAR Electric, 2.375%, 10/15/22 565,000 542
Nucor, 3.95%, 5/1/28 2,140,000 2,142
Nutrien, 4.00%, 12/15/26 830,000 799
O’Reilly Automotive, 3.60%, 9/1/27 1,825,000 1,722
O’Reilly Automotive, 3.80%, 9/1/22 370,000 373
O’Reilly Automotive, 4.875%, 1/14/21 1,000,000 1,032
Occidental Petroleum, 3.00%, 2/15/27 2,320,000 2,192

srbal_0618_P4Proof #
T. Rowe PRICe BalanCed Fund
Shares/Par $ Value
(Cost and value in $000s)
45
Omnicom Group, 3.60%, 4/15/26 830,000 794
Origin Energy Finance, 3.50%, 10/9/18 (2) 1,210,000 1,211
PACCAR Financial, 1.95%, 2/27/20 920,000 906
PACCAR Financial, 3.10%, 5/10/21 2,190,000 2,180
PacifiCorp, 3.85%, 6/15/21 900,000 916
Packaging Corporation of America, 3.65%, 9/15/24 785,000 775
Packaging Corporation of America, 4.50%, 11/1/23 395,000 409
Partners Healthcare System, 3.443%, 7/1/21 1,150,000 1,160
Penske Truck Leasing, 2.875%, 7/17/18 (2) 235,000 235
Penske Truck Leasing, 3.20%, 7/15/20 (2) 1,250,000 1,246
PNC Bank, 3.50%, 6/8/23 1,330,000 1,330
PNC Financial Services Group, 3.30%, 3/8/22 1,100,000 1,094
PNC Financial Services Group, 6.70%, 6/10/19 590,000 611
PPL Capital Funding, 3.10%, 5/15/26 2,200,000 2,045
Pricoa Global Funding I, 1.45%, 9/13/19 (2) 675,000 663
Principal Financial Group, 3.40%, 5/15/25 2,460,000 2,387
Progress Energy, 4.40%, 1/15/21 450,000 460
Providence Health & Services, 4.379%, 10/1/23 1,310,000 1,366
Public Service Co. of Colorado, 3.20%, 11/15/20 325,000 325
QUALCOMM, 3.00%, 5/20/22 1,595,000 1,571
QVC, 4.375%, 3/15/23 770,000 761
QVC, 4.45%, 2/15/25 140,000 135
QVC, 4.85%, 4/1/24 1,645,000 1,632
Raymond James Financial, 3.625%, 9/15/26 210,000 203
Regions Bank, 2.25%, 9/14/18 2,060,000 2,059
Reinsurance Group of America, 5.00%, 6/1/21 630,000 655
RELX Capital, 3.50%, 3/16/23 840,000 835
Republic Services, 3.375%, 11/15/27 1,045,000 990
Republic Services, 5.50%, 9/15/19 400,000 412
Rogers Communications, 3.625%, 12/15/25 610,000 596
Roper Technologies, 2.05%, 10/1/18 595,000 594

srbal_0618_P4Proof #
T. Rowe PRICe BalanCed Fund
Shares/Par $ Value
(Cost and value in $000s)
46
Roper Technologies, 3.00%, 12/15/20 1,160,000 1,153
Roper Technologies, 3.80%, 12/15/26 1,085,000 1,053
Roper Technologies, 6.25%, 9/1/19 300,000 311
Royal Bank of Canada, 2.20%, 7/27/18 600,000 600
Sabine Pass Liquefaction, 4.20%, 3/15/28 1,335,000 1,282
Santander, 2.35%, 9/10/19 1,375,000 1,365
Sempra Energy, 2.40%, 2/1/20 2,485,000 2,454
Shire Acquisition Investments Ireland, 2.875%, 9/23/23 2,870,000 2,702
Skandinaviska Enskilda Banken, 2.375%, 11/20/18 (2) 1,500,000 1,499
Sky, 2.625%, 9/16/19 (2) 355,000 352
Solvay Finance, 3.40%, 12/3/20 (2) 1,890,000 1,888
Southeast Supply Header, 4.25%, 6/15/24 (2) 905,000 906
Southern, 2.45%, 9/1/18 1,300,000 1,300
Southern Power, 5.15%, 9/15/41 1,200,000 1,221
Spectra Energy Partners, 3.375%, 10/15/26 480,000 442
Spectra Energy Partners, 4.75%, 3/15/24 1,145,000 1,168
State Street, 3.10%, 5/15/23 265,000 261
Sumitomo Mitsui Banking, 1.95%, 7/23/18 1,850,000 1,850
Sumitomo Mitsui Banking, 2.50%, 7/19/18 1,270,000 1,270
SunTrust Banks, 2.35%, 11/1/18 345,000 345
Svenska Handelsbanken, 3.35%, 5/24/21 1,825,000 1,824
Tampa Electric, 6.15%, 5/15/37 1,000,000 1,208
Teachers Insurance & Annuity Assn., 4.90%, 9/15/44 (2) 1,800,000 1,890
Tencent Holdings, 2.985%, 1/19/23 (2) 960,000 934
Teva Pharmaceutical Finance III, 1.70%, 7/19/19 3,750,000 3,670
Teva Pharmaceutical Finance IV, 3.65%, 11/10/21 1,465,000 1,400
Thomson Reuters, 3.35%, 5/15/26 405,000 373
Time Warner Cable, 4.00%, 9/1/21 200,000 200
Time Warner Cable, 5.00%, 2/1/20 485,000 495
Time Warner Cable, 6.55%, 5/1/37 450,000 474
Time Warner Cable, 6.75%, 7/1/18 320,000 320

srbal_0618_P4Proof #
T. Rowe PRICe BalanCed Fund
Shares/Par $ Value
(Cost and value in $000s)
47
Time Warner Cable, 6.75%, 6/15/39 530,000 564
Time Warner Cable, 8.25%, 4/1/19 595,000 617
Time Warner Cable, 8.75%, 2/14/19 105,000 109
Toronto-Dominion Bank, 1.45%, 9/6/18 1,300,000 1,298
Toronto-Dominion Bank, 3.25%, 6/11/21 1,595,000 1,596
Toronto-Dominion Bank, VR, 3.625%, 9/15/31 (7) 305,000 287
Toyota Motor Credit, 2.95%, 4/13/21 2,690,000 2,673
Transcontinental Gas Pipe Line, 4.60%, 3/15/48 (2) 1,645,000 1,591
Transurban Finance, 3.375%, 3/22/27 (2) 395,000 366
Transurban Finance, 4.125%, 2/2/26 (2) 335,000 332
Travelers, 6.25%, 6/15/37 750,000 927
Trinity Health, 4.125%, 12/1/45 725,000 709
UBS Group Funding Switzerland, 3.491%, 5/23/23 (2) 1,040,000 1,016
UBS Group Funding Switzerland, 4.125%, 9/24/25 (2) 1,115,000 1,103
United Airlines PTT, Series 2014-1, Class B, 4.75%, 4/11/22 384,133 386
United Airlines PTT, Series 2014-2, Class B, 4.625%, 9/3/22 1,533,437 1,530
United Overseas Bank, 3.20%, 4/23/21 (2) 3,300,000 3,291
UnitedHealth Group, 3.75%, 7/15/25 645,000 645
UnitedHealth Group, 4.70%, 2/15/21 835,000 865
UnitedHealth Group, 4.75%, 7/15/45 1,235,000 1,319
Unum Group, 3.00%, 5/15/21 590,000 580
Unum Group, 5.625%, 9/15/20 200,000 209
VEREIT Operating Partnership, 3.95%, 8/15/27 1,490,000 1,387
Verizon Communications, 4.272%, 1/15/36 870,000 802
Verizon Communications, 5.25%, 3/16/37 2,475,000 2,543
Visa, 2.15%, 9/15/22 2,420,000 2,317
Vulcan Materials, 4.50%, 6/15/47 590,000 535
WEA Finance, 3.25%, 10/5/20 (2) 720,000 716
Wells Fargo, 3.069%, 1/24/23 3,240,000 3,145
West Fraser Timber, 4.35%, 10/15/24 (2) 800,000 792
WestPac Banking, 2.15%, 3/6/20 1,200,000 1,180
srbal_0618_P4Proof #
T. Rowe PRICe BalanCed Fund
Shares/Par $ Value
(Cost and value in $000s)
48
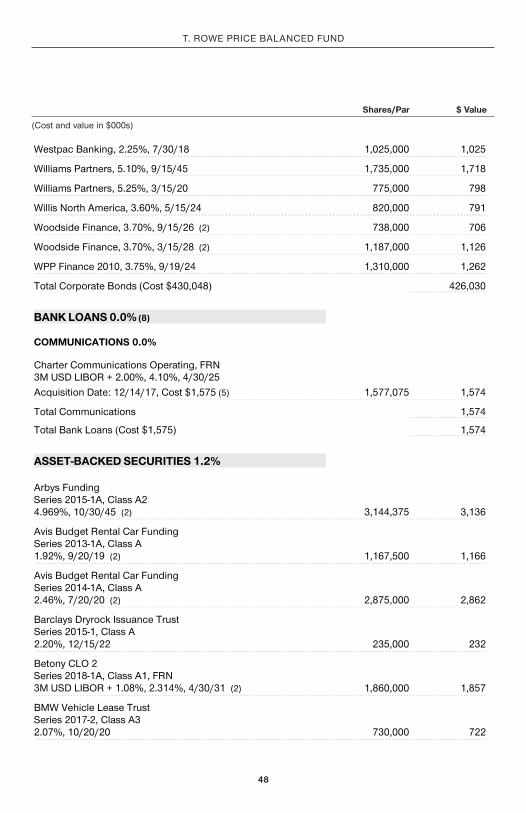
Westpac Banking, 2.25%, 7/30/18 1,025,000 1,025
Williams Partners, 5.10%, 9/15/45 1,735,000 1,718
Williams Partners, 5.25%, 3/15/20 775,000 798
Willis North America, 3.60%, 5/15/24 820,000 791
Woodside Finance, 3.70%, 9/15/26 (2) 738,000 706
Woodside Finance, 3.70%, 3/15/28 (2) 1,187,000 1,126
WPP Finance 2010, 3.75%, 9/19/24 1,310,000 1,262
Total Corporate Bonds (Cost $430,048) 426,030
BANK LOANS 0.0% (8)
COMMUNICATIONS 0.0%
Charter Communications Operating, FRN 3M USD LIBOR + 2.00%, 4.10%, 4/30/25 Acquisition Date: 12/14/17, Cost $1,575 (5) 1,577,075 1,574
Total Communications 1,574
Total Bank Loans (Cost $1,575) 1,574
ASSET-BACKED SECURITIES 1.2%
Arbys Funding Series 2015-1A, Class A2 4.969%, 10/30/45 (2) 3,144,375 3,136
Avis Budget Rental Car Funding Series 2013-1A, Class A 1.92%, 9/20/19 (2) 1,167,500 1,166
Avis Budget Rental Car Funding Series 2014-1A, Class A 2.46%, 7/20/20 (2) 2,875,000 2,862
Barclays Dryrock Issuance Trust Series 2015-1, Class A 2.20%, 12/15/22 235,000 232
Betony CLO 2 Series 2018-1A, Class A1, FRN 3M USD LIBOR + 1.08%, 2.314%, 4/30/31 (2) 1,860,000 1,857
BMW Vehicle Lease Trust Series 2017-2, Class A3 2.07%, 10/20/20 730,000 722

srbal_0618_P4Proof #
T. Rowe PRICe BalanCed Fund
Shares/Par $ Value
(Cost and value in $000s)
49
Capital Auto Receivables Asset Trust Series 2015-4, Class A4 2.01%, 7/20/20 410,000 409
CarMax Auto Owner Trust Series 2017-4, Class A3 2.11%, 10/17/22 515,000 507
CarMax Auto Owner Trust Series 2018-2, Class A3 2.98%, 1/17/23 1,185,000 1,184
CIFC Funding Series 2015-5A, Class A1R, FRN 3M USD LIBOR + 0.86%, 3.22%, 10/25/27 (2) 2,375,000 2,373
CNH Equipment Trust Series 2017-C, Class A3 2.08%, 2/15/23 995,000 978
DB Master Finance Series 2015-1A, Class A2II 3.98%, 2/20/45 (2) 2,283,300 2,289
DB Master Finance Series 2017-1A, Class A2I 3.629%, 11/20/47 (2) 1,189,025 1,168
Diamond Resorts Owner Trust Series 2013-2, Class A 2.27%, 5/20/26 (2) 239,933 240
Diamond Resorts Owner Trust Series 2014-1, Class A 2.54%, 5/20/27 (2) 332,005 331
Driven Brands Funding Series 2018-1A, Class A2 4.739%, 4/20/48 (2) 630,000 634
Elara HGV Timeshare Issuer Series 2017-A, Class A 2.69%, 3/25/30 (2) 817,223 801
Enterprise Fleet Financing Series 2015-1, Class A3 1.74%, 9/20/20 (2) 965,029 964
Enterprise Fleet Financing Series 2017-1, Class A2 2.13%, 7/20/22 (2) 201,796 201
Galaxy XXIX Series 2018-29A, Class A, CLO, FRN 3M USD LIBOR + 0.79%, 3.12%, 11/15/26 (2) 2,585,000 2,582

srbal_0618_P4Proof #
T. Rowe PRICe BalanCed Fund
Shares/Par $ Value
(Cost and value in $000s)
50
GM Financial Consumer Automobile Receivables Trust Series 2018-2, Class A3 2.81%, 12/16/22 1,855,000 1,849
GMF Floorplan Owner Revolving Trust Series 2017-1, Class A1 2.22%, 1/18/22 (2) 1,240,000 1,226
GreatAmerica Leasing Receivables Funding Series 2018-1, Class A3 2.60%, 6/15/21 (2) 490,000 486
Hardee’s Funding Series 2018-1A, Class AI 4.25%, 6/20/48 (2) 805,000 807
Hardee’s Funding Series 2018-1A, Class AII 4.959%, 6/20/48 (2) 1,985,000 2,001
Hyundai Auto Receivables Trust Series 2018-A, Class A3 2.79%, 7/15/22 930,000 927
Jimmy Johns Funding Series 2017-1A, Class A2I 3.61%, 7/30/47 (2) 516,100 513
MMAF Equipment Finance Series 2017-B, Class A3 2.21%, 10/17/22 (2) 1,445,000 1,416
MVW Owner Trust Series 2013-1A, Class A 2.15%, 4/22/30 (2) 110,392 108
Octagon Investment Partners XXIII Series 2015-1A, Class A1R, FRN 3M USD LIBOR + 0.85%, 3.187%, 7/15/27 (2) 1,320,000 1,319
OZLM VIII Series 2014-8A, Class A1AR, CLO, FRN 3M USD LIBOR + 1.13%, 3.483%, 10/17/26 (2) 1,130,000 1,130
OZLM VIII Series 2014-8A, Class A2AR, CLO, FRN 3M USD LIBOR + 1.60%, 3.953%, 10/17/26 (2) 835,000 835
Santander Drive Auto Receivables Trust Series 2018-2, Class B 3.03%, 9/15/22 1,270,000 1,267
Santander Retail Auto Lease Trust Series 2017-A, Class A3 2.22%, 1/20/21 (2) 1,265,000 1,251

srbal_0618_P4Proof #
T. Rowe PRICe BalanCed Fund
Shares/Par $ Value
(Cost and value in $000s)
51
Sierra Timeshare Receivables Funding Series 2014-3A, Class A 2.30%, 10/20/31 (2) 213,361 212
Sierra Timeshare Receivables Funding Series 2015-3A, Class A 2.58%, 9/20/32 (2) 175,784 175
SMB Private Education Loan Trust Series 2015-A, Class A2A 2.49%, 6/15/27 (2) 712,100 703
SMB Private Education Loan Trust Series 2018-B, Class A2A 3.60%, 1/15/37 (2) 1,230,000 1,230
Sonic Capital Series 2018-1A, Class A2 4.026%, 2/20/48 (2) 255,000 252
Synchrony Credit Card Master Note Trust Series 2017-2, Class A 2.62%, 10/15/25 920,000 895
Wendy’s Funding Series 2015-1A, Class A2II 4.08%, 6/15/45 (2) 2,917,500 2,950
World Omni Auto Receivables Trust Series 2018-A, Class A3 1.77%, 9/15/21 2,176,450 2,161
Total Asset-Backed Securities (Cost $48,529) 48,349
NON-U.S. GOVERNMENT MORTGAGE-BACKED SECURITIES 1.5%
Ashford Hospitality Trust Series 2018-ASHF, Class A, ARM 1M USD LIBOR + 0.90%, 2.973%, 4/15/35 (2) 2,786,446 2,783
Atrium Hotel Portfolio Trust Series 2017-ATRM, Class A, ARM 1M USD LIBOR + 0.93%, 3.003%, 12/15/36 (2) 2,530,000 2,527
BX Trust Series 2018-GW, Class A 2.873%, 5/15/35 (2) 1,390,000 1,391
Citigroup Commercial Mortgage Trust Series 2014-GC21, Class AS 4.026%, 5/10/47 235,000 238

srbal_0618_P4Proof #
T. Rowe PRICe BalanCed Fund
Shares/Par $ Value
(Cost and value in $000s)
52
Citigroup Commercial Mortgage Trust Series 2014-GC25, Class A1 1.485%, 10/10/47 128,692 128
COLT Mortgage Loan Trust Series 2017-1, Class A1, CMO, ARM 2.614%, 5/27/47 (2) 715,963 713
COLT Mortgage Loan Trust Series 2018-1, Class A1, CMO, ARM 2.93%, 2/25/48 (2) 998,071 993
Commercial Mortgage Trust Series 2014-LC15, Class B, ARM 4.599%, 4/10/47 2,495,000 2,507
Commercial Mortgage Trust Series 2014-UBS4, Class C, ARM 4.781%, 8/10/47 545,000 538
Commercial Mortgage Trust Series 2015-LC21, Class A4 3.708%, 7/10/48 3,700,000 3,706
Commercial Mortgage Trust Series 2017-PANW, Class A 3.244%, 10/10/29 (2) 2,160,000 2,106
Connecticut Avenue Securities Series 2018-C03, Class 1M1, CMO, ARM 1M USD LIBOR + 0.68%, 2.771%, 10/25/30 1,203,149 1,203
Connecticut Avenue Securities Series 2016-C04, Class 1M1, CMO, ARM 1M USD LIBOR + 1.45%, 3.541%, 1/25/29 469,407 473
Connecticut Avenue Securities Series 2016-C07, Class 2M1, CMO, ARM 1M USD LIBOR + 1.30%, 3.391%, 5/25/29 270,181 271
Deephaven Residential Mortgage Trust Series 2018-1A, Class A1, CMO, ARM 2.976%, 12/25/57 (2) 1,362,270 1,354
Galton Funding Mortgage Trust Series 2018-1, Class A23, CMO, ARM 3.50%, 11/25/57 (2) 1,231,504 1,213
Goldman Sachs Mortgage Securities Trust Series 2014-GC24, Class A1 1.509%, 9/10/47 698,359 694
Goldman Sachs Mortgage Securities Trust Series 2015-GC32, Class A4 3.764%, 7/10/48 950,000 960

srbal_0618_P4Proof #
T. Rowe PRICe BalanCed Fund
Shares/Par $ Value
(Cost and value in $000s)
53
Goldman Sachs Mortgage Securities Trust Series 2018-GS9, Class A4, ARM 3.992%, 3/10/51 1,250,000 1,271
JPMorgan Barclays Bank Commercial Mortgage Securities Trust, Series 2015-C31, Class A3 3.801%, 8/15/48 2,425,000 2,450
JPMorgan Barclays Bank Commercial Mortgage Securities Trust, Series 2014-C22, Class A1 1.451%, 9/15/47 143,348 143
JPMorgan Barclays Bank Commercial Mortgage Securities Trust, Series 2014-C23, Class A1 1.65%, 9/15/47 41,251 41
JPMorgan Chase Commercial Mortgage Securities Trust Series 2012-C8, Class A3 2.829%, 10/15/45 1,423,954 1,395
Mill City Mortgage Loan Trust Series 2016-1, Class A1, CMO, ARM 2.50%, 4/25/57 (2) 202,778 199
Mill City Mortgage Loan Trust Series 2018-1, Class A1, CMO, ARM 3.25%, 5/25/62 (2) 1,895,674 1,885
Morgan Stanley Bank of America Merrill Lynch Trust Series 2014-C17, Class B, ARM 4.464%, 8/15/47 1,670,000 1,681
Morgan Stanley Bank of America Merrill Lynch Trust Series 2015-C24, Class AS, ARM 4.036%, 5/15/48 1,375,000 1,386
Morgan Stanley Bank of America Merrill Lynch Trust Series 2015-C27, Class AS 4.068%, 12/15/47 2,775,000 2,815
Morgan Stanley Bank of America Merrill Lynch Trust Series 2016-C30, Class A5 2.86%, 9/15/49 495,000 465
Morgan Stanley Capital I Trust Series 2015-MS1, Class A4, ARM 3.779%, 5/15/48 1,440,000 1,453
Seasoned Credit Risk Transfer Trust Series 2016-1, Class M1, CMO, ARM 3.00%, 9/25/55 (2) 530,000 516
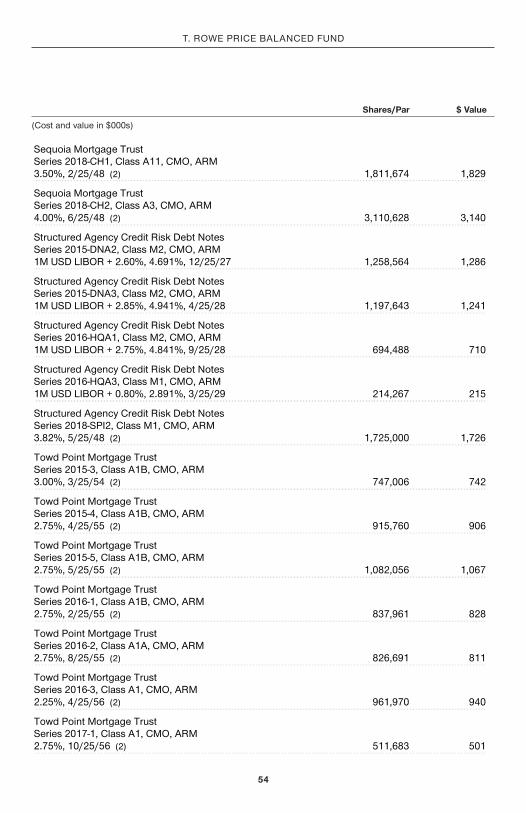
srbal_0618_P4Proof #
T. Rowe PRICe BalanCed Fund
Shares/Par $ Value
(Cost and value in $000s)
54
Sequoia Mortgage Trust Series 2018-CH1, Class A11, CMO, ARM 3.50%, 2/25/48 (2) 1,811,674 1,829
Sequoia Mortgage Trust Series 2018-CH2, Class A3, CMO, ARM 4.00%, 6/25/48 (2) 3,110,628 3,140
Structured Agency Credit Risk Debt Notes Series 2015-DNA2, Class M2, CMO, ARM 1M USD LIBOR + 2.60%, 4.691%, 12/25/27 1,258,564 1,286
Structured Agency Credit Risk Debt Notes Series 2015-DNA3, Class M2, CMO, ARM 1M USD LIBOR + 2.85%, 4.941%, 4/25/28 1,197,643 1,241
Structured Agency Credit Risk Debt Notes Series 2016-HQA1, Class M2, CMO, ARM 1M USD LIBOR + 2.75%, 4.841%, 9/25/28 694,488 710
Structured Agency Credit Risk Debt Notes Series 2016-HQA3, Class M1, CMO, ARM 1M USD LIBOR + 0.80%, 2.891%, 3/25/29 214,267 215
Structured Agency Credit Risk Debt Notes Series 2018-SPI2, Class M1, CMO, ARM 3.82%, 5/25/48 (2) 1,725,000 1,726
Towd Point Mortgage Trust Series 2015-3, Class A1B, CMO, ARM 3.00%, 3/25/54 (2) 747,006 742
Towd Point Mortgage Trust Series 2015-4, Class A1B, CMO, ARM 2.75%, 4/25/55 (2) 915,760 906
Towd Point Mortgage Trust Series 2015-5, Class A1B, CMO, ARM 2.75%, 5/25/55 (2) 1,082,056 1,067
Towd Point Mortgage Trust Series 2016-1, Class A1B, CMO, ARM 2.75%, 2/25/55 (2) 837,961 828
Towd Point Mortgage Trust Series 2016-2, Class A1A, CMO, ARM 2.75%, 8/25/55 (2) 826,691 811
Towd Point Mortgage Trust Series 2016-3, Class A1, CMO, ARM 2.25%, 4/25/56 (2) 961,970 940
Towd Point Mortgage Trust Series 2017-1, Class A1, CMO, ARM 2.75%, 10/25/56 (2) 511,683 501

srbal_0618_P4Proof #
T. Rowe PRICe BalanCed Fund
Shares/Par $ Value
(Cost and value in $000s)
55
Towd Point Mortgage Trust Series 2017-6, Class A1, CMO, ARM 2.75%, 10/25/57 (2) 1,425,400 1,389
Towd Point Mortgage Trust Series 2018-1, Class A1, CMO, ARM 3.00%, 1/25/58 (2) 770,102 758
Vendee Mortgage Trust Series 1996-3, Class 4, CMO, ARM 9.793%, 3/15/25 607 1
Verus Securitization Trust Series 2018-INV1, Class A1, CMO, ARM 3.626%, 3/25/58 (2) 1,524,679 1,526
WFRBS Commercial Mortgage Trust Series 2014-C19, Class B, ARM 4.723%, 3/15/47 610,000 629
Total Non-U.S. Government Mortgage-Backed Securities (Cost $60,263) 59,743
U.S. GOVERNMENT & AGENCY MORTGAGE-BACKED SECURITIES 9.0%
U.S. Government Agency Obligations 6.2% (9)
Federal Home Loan Mortgage
1.749%, 2/25/22 2,672,463 2,617
1.785%, 9/25/22 1,273,978 1,245
1.875%, 4/25/22 2,992,733 2,933
2.206%, 6/25/25 1,752,386 1,678
2.413%, 1/25/21 565,641 562
2.50%, 4/23/20 – 3/1/43 8,028,671 7,870
2.777%, 4/25/23 566,697 563
2.952%, 2/25/27 1,335,434 1,321
3.00%, 1/1/29 – 8/1/43 8,718,925 8,528
3.50%, 3/1/42 – 3/1/46 15,918,966 15,944
4.00%, 9/1/40 – 6/1/42 5,510,020 5,664
4.50%, 6/1/39 – 5/1/42 3,469,682 3,646
5.00%, 12/1/35 – 8/1/40 1,520,733 1,625
5.50%, 11/1/18 – 12/1/39 410,577 444

srbal_0618_P4Proof #
T. Rowe PRICe BalanCed Fund
Shares/Par $ Value
(Cost and value in $000s)
56
6.00%, 2/1/28 – 8/1/38 41,223 45
6.50%, 8/1/32 17,483 19
7.00%, 6/1/32 28,187 29
Federal Home Loan Mortgage, ARM
12M USD LIBOR + 1.588%, 3.338%, 10/1/36 23,493 24
1Y CMT + 2.25%, 3.53%, 10/1/36 26,251 28
12M USD LIBOR + 1.726%, 3.536%, 7/1/35 89,012 94
12M USD LIBOR + 1.742%, 3.606%, 2/1/37 79,882 83
12M USD LIBOR + 1.75%, 3.619%, 2/1/35 181,308 190
12M USD LIBOR + 1.966%, 3.709%, 11/1/36 40,832 43
12M USD LIBOR + 2.01%, 3.762%, 12/1/36 62,378 66
Federal National Mortgage Assn.
2.50%, 10/1/31 – 8/1/46 6,153,413 5,919
3.00%, 1/1/27 – 1/1/47 49,947,543 48,776
3.50%, 11/1/26 – 3/1/48 54,506,552 54,526
4.00%, 11/1/40 – 7/1/48 44,793,619 45,838
4.50%, 5/1/19 – 5/1/48 6,347,256 6,664
5.00%, 5/1/19 – 7/1/41 4,510,520 4,827
5.50%, 12/1/18 – 5/1/44 6,164,093 6,706
6.00%, 3/1/21 – 1/1/41 4,292,195 4,723
6.50%, 3/1/24 – 8/1/38 646,937 713
7.00%, 9/1/25 – 4/1/32 45,487 49
7.50%, 9/1/26 436 —
8.00%, 8/1/24 – 7/1/26 986 1
Federal National Mortgage Assn., ARM
12M USD LIBOR + 1.879%, 3.629%, 1/1/37 22,295 23
12M USD LIBOR + 1.573%, 4.067%, 7/1/35 54,219 57
12M USD LIBOR + 1.75%, 4.125%, 9/1/36 445 —
Federal National Mortgage Assn., CMO, 4.00%, 6/25/44 1,729,916 1,767
Federal National Mortgage Assn., TBA
2.50%, 7/1/33 1,340,000 1,302

srbal_0618_P4Proof #
T. Rowe PRICe BalanCed Fund
Shares/Par $ Value
(Cost and value in $000s)
57
3.00%, 7/1/33 – 7/1/48 4,545,000 4,435
4.50%, 7/1/48 12,045,000 12,541
254,128
U.S. Government Obligations 2.8%
Government National Mortgage Assn.
2.50%, 12/20/42 – 9/20/46 2,383,393 2,277
3.00%, 9/15/42 – 7/20/47 17,167,617 16,841
3.50%, 9/15/41 – 2/20/48 16,749,055 16,862
4.00%, 2/15/41 – 5/20/48 20,882,195 21,455
4.50%, 6/15/39 – 8/20/47 12,369,340 12,938
5.00%, 10/15/34 – 2/20/48 18,109,038 19,090
5.50%, 2/20/34 – 2/20/36 282,628 309
6.00%, 8/20/34 – 4/15/36 155,250 172
6.50%, 6/15/23 – 5/15/28 50,644 55
7.00%, 12/15/25 – 3/15/31 34,849 35
7.50%, 3/15/23 – 9/15/26 31,745 30
8.00%, 2/15/21 – 11/15/25 22,020 22
8.50%, 2/15/20 – 6/20/26 11,871 13
9.00%, 2/15/20 – 6/20/20 7,383 7
9.50%, 8/15/20 – 3/15/21 1,317 1
10.00%, 1/20/20 61 —
Government National Mortgage Assn., ARM, 1Y CMT + 1.50%, 2.75%, 8/20/23 1,101 1
Government National Mortgage Assn., CMO, 3.00%, 11/20/47-12/20/47 2,238,473 2,222
Government National Mortgage Assn., TBA
4.50%, 7/20/48 15,375,000 15,981
5.00%, 7/20/48 8,150,000 8,554
116,865
Total U.S. Government & Agency Mortgage-Backed Securities (Cost $375,923) 370,993

srbal_0618_P4Proof #
T. Rowe PRICe BalanCed Fund
Shares/Par $ Value
(Cost and value in $000s)
58
U.S. GOVERNMENT AGENCY OBLIGATIONS (EXCLUDING MORTGAGE-BACKED) 7.6%
U.S. Government Agency Obligations 0.1% (15)
Federal Home Loan Banks, 1.375%, 5/28/19 2,265,000 2,245
2,245
U.S. Treasury Obligations 7.5%
U.S. Treasury Bonds, 2.25%, 8/15/46 8,700,000 7,481
U.S. Treasury Bonds, 2.50%, 2/15/46 2,975,000 2,701
U.S. Treasury Bonds, 2.75%, 11/15/42 3,000,000 2,880
U.S. Treasury Bonds, 2.75%, 8/15/47 14,125,000 13,463
U.S. Treasury Bonds, 2.875%, 8/15/45 (10) 4,185,000 4,096
U.S. Treasury Bonds, 3.00%, 11/15/44 2,990,000 2,998
U.S. Treasury Bonds, 3.00%, 5/15/45 10,640,000 10,667
U.S. Treasury Bonds, 3.00%, 11/15/45 11,185,000 11,211
U.S. Treasury Bonds, 3.00%, 2/15/47 1,150,000 1,153
U.S. Treasury Bonds, 3.00%, 5/15/47 4,120,000 4,128
U.S. Treasury Bonds, 3.125%, 11/15/41 14,795,000 15,179
U.S. Treasury Bonds, 3.125%, 2/15/43 3,715,000 3,807
U.S. Treasury Bonds, 3.50%, 2/15/39 820,000 892
U.S. Treasury Bonds, 3.625%, 8/15/43 11,460,000 12,751
U.S. Treasury Bonds, 4.50%, 5/15/38 1,545,000 1,913
U.S. Treasury Bonds, 4.75%, 2/15/41 3,350,000 4,336
U.S. Treasury Bonds, 5.375%, 2/15/31 1,440,000 1,818
U.S. Treasury Bonds, 6.50%, 11/15/26 5,425,000 6,903
U.S. Treasury Bonds, 7.25%, 8/15/22 100,000 118
U.S. Treasury Notes, 1.125%, 7/31/21 22,135,000 21,149
U.S. Treasury Notes, 1.375%, 6/30/23 5,355,000 5,015
U.S. Treasury Notes, 1.625%, 11/15/22 315,000 301
U.S. Treasury Notes, 1.625%, 5/15/26 4,435,000 4,056

srbal_0618_P4Proof #
T. Rowe PRICe BalanCed Fund
Shares/Par $ Value
(Cost and value in $000s)
59
U.S. Treasury Notes, 1.75%, 5/31/22 19,820,000 19,123
U.S. Treasury Notes, 1.875%, 1/31/22 9,095,000 8,846
U.S. Treasury Notes, 2.00%, 12/31/21 3,270,000 3,197
U.S. Treasury Notes, 2.00%, 2/15/22 12,450,000 12,158
U.S. Treasury Notes, 2.00%, 11/30/22 27,245,000 26,440
U.S. Treasury Notes, 2.00%, 11/15/26 31,170,000 29,202
U.S. Treasury Notes, 2.125%, 12/31/22 22,745,000 22,169
U.S. Treasury Notes, 2.125%, 5/15/25 2,840,000 2,717
U.S. Treasury Notes, 2.25%, 11/15/24 17,385,000 16,817
U.S. Treasury Notes, 2.25%, 11/15/25 3,830,000 3,683
U.S. Treasury Notes, 2.25%, 2/15/27 12,695,000 12,110
U.S. Treasury Notes, 2.75%, 2/15/28 16,240,000 16,090
311,568
Total U.S. Government Agency Obligations (Excluding Mortgage-Backed) (Cost $315,056) 313,813
FOREIGN GOVERNMENT OBLIGATIONS & MUNICIPALITIES 0.9%
Autoridad del Canal de Panama, 4.95%, 7/29/35 (2) 510,000 534
CNOOC Curtis Funding, 4.50%, 10/3/23 (2) 900,000 929
CNOOC Finance, 3.00%, 5/9/23 1,390,000 1,342
Government of Bermuda, 4.138%, 1/3/23 (2) 615,000 623
Government of Bermuda, 4.854%, 2/6/24 (2) 1,305,000 1,349
Government of Bermuda, 5.603%, 7/20/20 (2) 300,000 313
Hydro-Quebec, 8.40%, 1/15/22 200,000 233
Inter-American Development Bank, 3.875%, 9/17/19 700,000 710
KFW, 2.75%, 7/15/20 3,274,000 3,274
KFW, 4.875%, 6/17/19 1,000,000 1,022
Kingdom of Morocco, 4.25%, 12/11/22 (2) 1,400,000 1,401
Pertamina, 4.30%, 5/20/23 (2) 1,250,000 1,237
Perusahaan Gas Negara Persero, 5.125%, 5/16/24 (2) 1,105,000 1,122

srbal_0618_P4Proof #
T. Rowe PRICe BalanCed Fund
Shares/Par $ Value
(Cost and value in $000s)
60
Petroleos Mexicanos, 3.50%, 7/18/18 1,125,000 1,126
Petroleos Mexicanos, 3.50%, 1/30/23 460,000 437
Petroleos Mexicanos, 5.375%, 3/13/22 495,000 509
Petroleos Mexicanos, 5.50%, 6/27/44 675,000 571
Petroleos Mexicanos, 6.00%, 3/5/20 668,000 691
Province of Alberta, 2.20%, 7/26/22 3,050,000 2,948
Province of Ontario, 2.40%, 2/8/22 2,300,000 2,246
Province of Ontario, 2.55%, 2/12/21 1,980,000 1,960
Province of Quebec, 2.875%, 10/16/24 2,000,000 1,967
Province of Quebec, 3.50%, 7/29/20 750,000 760
Republic of Colombia, 4.00%, 2/26/24 275,000 275
Republic of Indonesia, 4.875%, 5/5/21 1,000,000 1,030
Republic of Poland, 3.25%, 4/6/26 1,030,000 996
Republic of South Africa, 5.50%, 3/9/20 1,405,000 1,444
Republic of South Africa, 5.875%, 9/16/25 495,000 509
State Grid Overseas Investment, 2.25%, 5/4/20 (2) 2,225,000 2,183
State Grid Overseas Investment, 3.75%, 5/2/23 (2) 1,175,000 1,178
Syngenta Finance, 3.698%, 4/24/20 (2) 1,830,000 1,825
United Mexican States, 4.125%, 1/21/26 1,760,000 1,748
Total Foreign Government Obligations & Municipalities (Cost $38,539) 38,492
MUNICIPAL SECURITIES 0.9%
California 0.2%
California, Build America, GO, 7.625%, 3/1/40 2,200,000 3,245
Inland Valley Dev. Agency, Tax Allocation, Series B, 5.50% 3/1/33 (11) 695,000 766
Los Angeles Airport, Build America, Series C, 7.053%, 5/15/40 1,000,000 1,403
Univ. of California Regents, Build America, 5.77%, 5/15/43 750,000 925
Univ. of California Regents, Series AJ, 4.601%, 5/15/31 1,625,000 1,753
Univ. of California Regents, Series J, 4.131%, 5/15/45 365,000 371
8,463

srbal_0618_P4Proof #
T. Rowe PRICe BalanCed Fund
Shares/Par $ Value
(Cost and value in $000s)
61
Colorado 0.0%
Denver City & County School District No. 1, Series B, COP 4.242%, 12/15/37 760,000 780
780
Florida 0.0%
Florida Hurricane Catastrophe Fund Fin., Series A, 2.107% 7/1/18 1,700,000 1,700
1,700
Illinois 0.1%
Chicago O’Hare International Airport, Build America, Series B 6.395%, 1/1/40 755,000 999
Illinois Toll Highway Auth., Build America, Series A, 6.184% 1/1/34 470,000 587
Metropolitan Water Reclamation Dist. Of Greater Chicago, Build America, 5.72%, 12/1/38 500,000 619
2,205
Maryland 0.1%
Maryland HHEFA, Univ. of Maryland Medical, Series B, 4.665% 7/1/36 1,800,000 1,884
Maryland Transportation Auth., Build America, 5.888%, 7/1/43 350,000 450
2,334
Michigan 0.1%
Detroit City School Dist., Qualified School Construction Bonds GO, 6.645%, 5/1/29 2,000,000 2,412
2,412
New Jersey 0.0%
New Jersey Turnpike Auth., Build America, Series F, 7.414% 1/1/40 415,000 603
603

srbal_0618_P4Proof #
T. Rowe PRICe BalanCed Fund
Shares/Par $ Value
(Cost and value in $000s)
62
New York 0.1%
Dormitory Auth. Of the State of New York, Build America 5.628%, 3/15/39 1,300,000 1,549
Metropolitan Transportation Auth., Build America, 7.336% 11/15/39 240,000 351
Metropolitan Transportation Auth., Build America, Series A-1 5.871%, 11/15/39 700,000 851
New York City Municipal Water & Sewer System, Build America Series EE 6.011%, 6/15/42 245,000 318
New York City Transitional Fin. Auth., Build America, 5.508% 8/1/37 950,000 1,125
Port Auth. Of New York & New Jersey, Series 182, 5.31% 8/1/46 1,400,000 1,518
5,712
Ohio 0.0%
JobsOhio Beverage System, Series B, 3.985%, 1/1/29 1,225,000 1,260
1,260
Oregon 0.0%
Oregon DOT, Build America, Series A, 5.834%, 11/15/34 375,000 462
462
Pennsylvania 0.0%
Philadelphia Auth. For IDA, 3.964%, 4/15/26 805,000 798
798
South Carolina 0.1%
South Carolina Public Service Auth., Santee Cooper, Series C 5.784%, 12/1/41 2,000,000 2,367
2,367

srbal_0618_P4Proof #
T. Rowe PRICe BalanCed Fund
Shares/Par $ Value
(Cost and value in $000s)
63
Texas 0.1%
Tarrant County Cultural Ed. Fac. Fin., Texas Health Resources Series A, 4.366%, 11/15/47 1,200,000 1,223
Texas, Build America, 5.517%, 4/1/39 1,300,000 1,642
2,865
Utah 0.0%
Utah Transit Auth., Build America, Series B, 5.937%, 6/15/39 900,000 1,130
1,130
Virginia 0.1%
Virginia Commonwealth Transportation Board, Build America, 5.35%, 5/15/35 690,000 798
Virginia Public Building Auth., Build America, Series B-2, 5.90% 8/1/30 755,000 906
1,704
Total Municipal Securities (Cost $30,420) 34,795
BOND MUTUAL FUNDS 4.0%
T. Rowe Price Inflation Protected Bond Fund – I Class 5.08% (12)(13) 1,132,168 13,427
T. Rowe Price Institutional High Yield Fund, 5.94% (12)(13) 15,604,624 134,980
T. Rowe Price U.S. Bond Enhanced Index Fund, 2.96% (12)(13) 1,473,220 15,734
Total Bond Mutual Funds (Cost $168,076) 164,141
EQUITY MUTUAL FUNDS 2.2%
T. Rowe Price Institutional Large-Cap Core Growth Fund (12) 156,956 6,567
T. Rowe Price Institutional U.S. Structured Research Fund (12) 495,495 6,620
T. Rowe Price Overseas Stock Fund – I Class (12) 846,996 9,393
T. Rowe Price Real Assets Fund – I Class (12) 5,116,454 59,607
T. Rowe Price Value Fund – I Class (12) 177,993 6,504
Total Equity Mutual Funds (Cost $75,623) 88,691

srbal_0618_P4Proof #
T. Rowe PRICe BalanCed Fund
Shares/Par $ Value
(Cost and value in $000s)
64
SHORT-TERM INVESTMENTS 3.8%
Money Market Funds 3.8%
T. Rowe Price Treasury Reserve Fund, 1.88% (12)(14) 154,730,579 154,731
Total Short-Term Investments (Cost $154,730) 154,731
SECURITIES LENDING COLLATERAL 0.0%
Investments in a Pooled Account through Securities Lending Program with JPMorgan Chase Bank 0.0%
Short-Term Funds 0.0%
T. Rowe Price Short-Term Fund, 2.08% (12)(14) 161,865 1,619
Total Investments through Securities Lending Program with JPMorgan Chase Bank 1,619
Total Securities Lending Collateral (Cost $1,619) 1,619
Total Investments in Securities
101.8% of Net Assets (Cost $3,148,012) $ 4,181,305‡
Shares/Par and Notional Amounts are denominated in U.S. dollars unless otherwise noted.
(1) Non-income producing (2)
Security was purchased pursuant to Rule 144A under the Securities Act of 1933 and may be resold in transactions exempt from registration only to qualified institutional buyers – total value of such securities at June 30, 2018 amounts to $181,737 and represents 4.4% of net assets.
(3) Organized as a closed-end management investment company. (4)
All or a portion of this security is on loan at June 30, 2018 – total value of such securities at period-end amounts to $1,511. See Note 4.
(5)
Security cannot be offered for public resale without first being registered under the Securities Act of 1933 and related rules (“restricted security”). Acquisition date represents the day on which an enforceable right to acquire such security is obtained and is presented along with related cost in the security description. The fund has registration rights for certain restricted securities. Any costs related to such registration are borne by the issuer. The aggregate value of restricted securities (excluding 144A holdings) at period-end amounts to $2,710 and represents 0% of net assets.
(6) Level 3 in fair value hierarchy. See Note 2. (7)
Security is a fix-to-float security, which carries a fixed coupon until a certain date, upon which it switches to a floating rate. Reference rate and spread is provided if the rate is currently floating.
(8)
Bank loan positions may involve multiple underlying tranches. In those instances, the position presented reflects the aggregate of those respective underlying tranches and the rate presented reflects their weighted average rate.

srbal_0618_P4Proof #
T. Rowe PRICe BalanCed Fund
65
(9)
The issuer operates under a federal conservatorship; however its securities are neither issued nor guaranteed by the U.S. government.
(10)
At June 30, 2018, all or a portion of this security is pledged as collateral and/or margin deposit to cover future funding obligations.
(11) Insured by Assured Guaranty Municipal Corp. (12) Affiliated Company (13) SEC 30-day yield (14) Seven-day yield (15)
The issuer operates under a Congressional charter; its securities are neither issued nor guaranteed by the U.S. government.
12M USD LIBOR Twelve month USD LIBOR (London interbank offered rate) 1M USD LIBOR One month USD LIBOR (London interbank offered rate)
1Y CMT One year U.S. Treasury note constant maturity rate 3M USD LIBOR Three month USD LIBOR (London interbank offered rate)
ADR American Depositary Receipts ARM
Adjustable Rate Mortgage (ARM); rate shown is effective rate at period-end. The rates for certain ARMs are not based on a published reference rate and spread but may be determined using a formula-based on the rates of the underlying loans
AUD Australian Dollar BRL Brazilian Real CAD Canadian Dollar CHF Swiss Franc CLO Collateralized Loan Obligation
CMO Collateralized Mortgage Obligation COP Certificate of Participation DKK Danish Krone DOT Department of Transportation ETC Equipment Trust Certificate EUR Euro FRN Floating Rate Note GBP British Pound GDR Global Depositary Receipts
GO General Obligation HHEFA Health & Higher Educational Facility Authority
HKD Hong Kong Dollar IDA Industrial Development Authority/Agency JPY Japanese
KRW South Korean Won NOK Norwegian Krone PTT Pass-Through Trust
REIT
A domestic Real Estate Investment Trust whose distributions pass-through with original tax character to the shareholder
SDR Swedish Depository Receipts SEK Swedish Krona SGD Singapore Dollar
STEP
Stepped coupon bond for which the coupon rate of interest adjusts on specified date(s); rate shown is effective rate at period-end.
TWD Taiwan Dollar TBA
To-Be-Announced purchase commitment; TBAs totaled $42,813 (1.0% of net assets) at period-end - see Note 4.
USD U.S. Dollar

srbal_0618_P4Proof #
T. Rowe PRICe BalanCed Fund
66
VR
Variable Rate; rate shown is effective rate at period-end. The rates for certain variable rate securities are not based on a published reference rate and spread but are determined by the issuer or agent and based on current market conditions.

srbal_0618_P4Proof #
($000s)
T. Rowe PRICe BalanCed Fund
67
FUTURES CONTRACTS
Expiration
Date Notional Amount
Value and Unrealized Gain (Loss)
Long, 27 MSCI EAFE Mini Index contracts 9/18 2,640 (80)
Long, 40 S&P 500 E-Mini Index contracts 9/18 5,443 (117)
Long, 22 U.S. Treasury Long Bond contracts 9/18 3,190 26
Short, 18 U.S. Treasury Notes five year contracts 9/18 (2,045) (4)
Long, 60 U.S. Treasury Notes ten year contracts 9/18 7,211 (5)
Short, 23 U.S. Treasury Notes two year contracts 9/18 (4,872) (4)
Short, 2 Ultra U.S. Treasury Bonds contracts 9/18 (319) (8)
Net payments (receipts) of variation margin to date 242
Variation margin receivable (payable) on open futures contracts $ 50

srbal_0618_P4Proof #
AFFILIATED COMPANIES
($000s)
T. Rowe PRICe BalanCed Fund
68
The fund may invest in certain securities that are considered affiliated companies. As defined by the 1940 Act, an affiliated company is one in which the fund owns 5% or more of the outstanding voting securities, or a company that is under common ownership or control. The following securities were considered affiliated companies for all or some portion of the six months ended June 30, 2018. Net realized gain (loss), investment income, change in net unrealized gain/loss, and purchase and sales cost reflect all activity for the period then ended.
Affiliate
Net Realized Gain(Loss)
Change in NetUnrealizedGain/Loss
InvestmentIncome
T. Rowe Price Inflation Protected Bond Fund $ — $ (11) $ 31 T. Rowe Price Institutional High Yield Fund — (5,377) 4,012 T. Rowe Price Institutional Large-Cap Core Growth Fund 263 610 — T. Rowe Price Institutional U.S. Structured Research Fund 13 224 — T. Rowe Price Limited Duration Inflation Focused Bond Fund (110) 94 — T. Rowe Price Overseas Stock Fund 14 (165) (185) T. Rowe Price Real Assets Fund — (153) — T. Rowe Price U.S. Bond Enhanced Index Fund (26) (422) 215 T. Rowe Price Value Fund 4 (136) — T. Rowe Price Short-Term Fund — — —++T. Rowe Price Treasury Reserve Fund — — 943 Totals $ 158# $ (5,336) $ 5,016+ Supplementary Investment Schedule Affiliate
Value12/31/17
PurchaseCost
SalesCost
Value6/30/18
T. Rowe Price Inflation Protected Bond Fund $ 13,358 $ 80 $ — $ 13,427 T. Rowe Price Institutional High Yield Fund 133,793 6,564 — 134,980
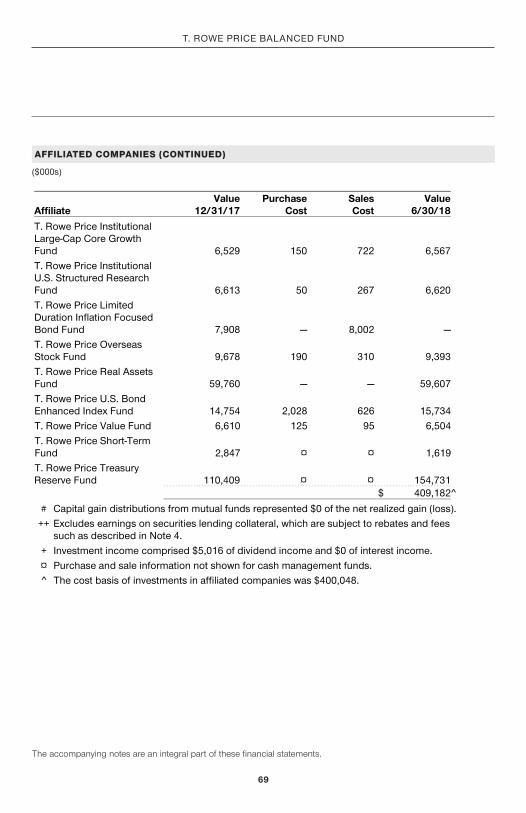
srbal_0618_P4Proof #
($000s)
T. Rowe PRICe BalanCed Fund
69
The accompanying notes are an integral part of these financial statements.
AFFILIATED COMPANIES (CONTINUED)
Affiliate
Value12/31/17
PurchaseCost
SalesCost
Value6/30/18
T. Rowe Price Institutional Large-Cap Core Growth Fund 6,529 150 722 6,567 T. Rowe Price Institutional U.S. Structured Research Fund 6,613 50 267 6,620 T. Rowe Price Limited Duration Inflation Focused Bond Fund 7,908 — 8,002 — T. Rowe Price Overseas Stock Fund 9,678 190 310 9,393 T. Rowe Price Real Assets Fund 59,760 — — 59,607 T. Rowe Price U.S. Bond Enhanced Index Fund 14,754 2,028 626 15,734 T. Rowe Price Value Fund 6,610 125 95 6,504 T. Rowe Price Short-Term Fund 2,847 ¤ ¤ 1,619 T. Rowe Price Treasury Reserve Fund 110,409 ¤ ¤ 154,731 $ 409,182^
# Capital gain distributions from mutual funds represented $0 of the net realized gain (loss). ++ Excludes earnings on securities lending collateral, which are subject to rebates and fees
such as described in Note 4. + Investment income comprised $5,016 of dividend income and $0 of interest income. ¤ Purchase and sale information not shown for cash management funds. ^ The cost basis of investments in affiliated companies was $400,048.

srbal_0618_P4Proof #
T. Rowe PRICe BalanCed Fund
June 30, 2018 (unaudited)
($000s, except shares and per share amounts)
STATEMENT OF ASSETS AND LIABILITIES
70
Assets Investments in securities, at value (cost $3,148,012) $ 4,181,305 Receivable for investment securities sold 59,208 Interest and dividends receivable 11,545 Receivable for shares sold 1,914 Foreign currency (cost $1,284) 1,279 Variation margin receivable on futures contracts 50 Other assets 2,345 Total assets 4,257,646 Liabilities Payable for investment securities purchased 133,302 Payable for shares redeemed 6,914 Obligation to return securities lending collateral 1,619 Investment management fees payable 1,386 Due to affiliates 273 Payable to directors 3 Other liabilities 6,992 Total liabilities 150,489 N E T A S S E T S $ 4 , 1 0 7 , 1 5 7

srbal_0618_P4Proof #
T. Rowe PRICe BalanCed Fund
June 30, 2018 (unaudited)
The accompanying notes are an integral part of these financial statements.
($000s, except shares and per share amounts)
STATEMENT OF ASSETS AND LIABILITIES
71
Net Assets Consist of: Undistributed net investment income $ 309 Accumulated undistributed net realized gain 141,956 Net unrealized gain 1,033,069 Paid-in capital applicable to 169,087,604 shares of $0.01 par value capital stock outstanding; 1,000,000,000 shares authorized 2,931,823 N E T A S S E T S $ 4 , 1 0 7 , 1 5 7 NET ASSET VALUE PER SHARE Investor Class ($3,681,930,839 / 151,582,272 shares outstanding) $ 24.29 I Class ($425,226,644 / 17,505,332 shares outstanding) $ 24.29

srbal_0618_P4Proof #
T. Rowe PRICe BalanCed Fund
($000s)
STATEMENT OF OPERATIONS
72
Unaudited
6 Months Ended
6/30/18Investment Income (Loss) Income
Dividend $ 36,073 Interest 18,919 Securities lending 205 Total income 55,197
Expenses Investment management 8,952 Shareholder servicing
Investor Class $ 2,357 I Class 3 2,360
Prospectus and shareholder reports Investor Class 66 I Class 1 67
Custody and accounting 227 Registration 40 Legal and audit 30 Directors 8 Proxy and annual meeting 54 Miscellaneous 26 Waived / paid by Price Associates (641) Total expenses 11,123
Net investment income 44,074

srbal_0618_P4Proof #
T. Rowe PRICe BalanCed Fund
($000s)
STATEMENT OF OPERATIONS
The accompanying notes are an integral part of these financial statements.
73
Unaudited
6 Months Ended
6/30/18Realized and Unrealized Gain / Loss Net realized gain (loss)
Securities 133,021 Futures 548 Options written 102 Foreign currency transactions (320) Net realized gain 133,351
Change in net unrealized gain / loss
Securities (139,779) Futures (336) Options written (196) Other assets and liabilities denominated in foreign currencies (115) Change in net unrealized gain / loss (140,426)
Net realized and unrealized gain / loss (7,075) INCREASE IN NET ASSETS FROM OPERATIONS $ 36,999

srbal_0618_P4Proof #
T. Rowe PRICe BalanCed Fund
($000s)
STATEMENT OF CHANGES IN NET ASSETS
74
Unaudited
6 Months Ended
6/30/18
Year Ended
12/31/17Increase (Decrease) in Net Assets Operations
Net investment income $ 44,074 $ 68,937 Net realized gain 133,351 264,064 Change in net unrealized gain / loss (140,426) 319,126
Increase in net assets from operations 36,999 652,127 Distributions to shareholders Net investment income Investor Class (39,381) (68,028) I Class (4,649) (4,355) Net realized gain Investor Class – (168,377) I Class – (12,262)
Decrease in net assets from distributions (44,030) (253,022) Capital share transactions* Shares sold Investor Class 289,379 542,714 I Class 175,734 98,036 Distributions reinvested Investor Class 38,065 230,053 I Class 4,532 16,406 Shares redeemed Investor Class (416,850) (970,732) I Class (31,388) (23,015)
Increase (decrease) in net assets from capital share transactions 59,472 (106,538)

srbal_0618_P4Proof #
T. Rowe PRICe BalanCed Fund
The accompanying notes are an integral part of these financial statements.
($000s)
STATEMENT OF CHANGES IN NET ASSETS
75
Unaudited
6 Months Ended
6/30/18
Year Ended
12/31/17Net Assets Increase during period 52,441 292,567 Beginning of period 4,054,716 3,762,149 E n d o f p e r i o d $ 4 , 1 0 7 , 1 5 7 $ 4 , 0 5 4 , 7 1 6 Undistributed net investment income 309 265 *Share information Shares sold Investor Class 11,775 22,658 I Class 7,140 4,073 Distributions reinvested Investor Class 1,578 9,512 I Class 188 677 Shares redeemed Investor Class (16,969) (40,450) I Class (1,282) (959)
Increase (decrease) in shares outstanding 2,430 (4,489)

srbal_0618_P4Proof #
T. Rowe PRICe BalanCed Fund
NOTES TO FINANCIAL STATEMENTS
76
Unaudited
T. Rowe Price Balanced Fund, Inc. (the fund), is registered under the Investment Company Act of 1940 (the 1940 Act) as a diversified, open-end management investment company. The fund seeks to provide capital growth, current income, and preservation of capital through a portfolio of stocks and fixed-income securities. The fund has two classes of shares: the Balanced Fund (Investor Class) and the Balanced Fund–I Class (I Class). I Class shares generally are available only to investors meeting a $1,000,000 minimum investment or certain other criteria. Each class has exclusive voting rights on matters related solely to that class; separate voting rights on matters that relate to both classes; and, in all other respects, the same rights and obligations as the other class.
NOTE 1 - SIGNIFICANT ACCOUNTING POLICIES
Basis of Preparation The fund is an investment company and follows accounting and reporting guidance in the Financial Accounting Standards Board (FASB) Accounting Standards Codification Topic 946 (ASC 946). The accompanying financial statements were prepared in accordance with accounting principles generally accepted in the United States of America (GAAP), including, but not limited to, ASC 946. GAAP requires the use of estimates made by management. Management believes that estimates and valuations are appropriate; however, actual results may differ from those estimates, and the valuations reflected in the accompanying financial statements may differ from the value ultimately realized upon sale or maturity.
Investment Transactions, Investment Income, and Distributions Investment transactions are accounted for on the trade date basis. Income and expenses are recorded on the accrual basis. Realized gains and losses are reported on the identified cost basis. Premiums and discounts on debt securities are amortized for financial reporting purposes. Paydown gains and losses are recorded as an adjustment to interest income. Dividends received from mutual fund investments are reflected as dividend income; capital gain distributions are reflected as realized gain/loss. Dividend income and capital gain distributions are recorded on the ex-dividend date. Income tax-related interest and penalties, if incurred, are recorded as income tax expense. Distributions from REITs are initially recorded as dividend income and, to the extent such represent a return of capital or capital gain for tax purposes, are reclassified when such information becomes available. Income distributions, if any, are declared and paid by each class quarterly. Distributions to shareholders are recorded on the ex-dividend date. A capital gain distribution may also be declared and paid by the fund annually.

srbal_0618_P4Proof #
T. Rowe PRICe BalanCed Fund
77
Currency Translation Assets, including investments, and liabilities denominated in foreign currencies are translated into U.S. dollar values each day at the prevailing exchange rate, using the mean of the bid and asked prices of such currencies against U.S. dollars as quoted by a major bank. Purchases and sales of securities, income, and expenses are translated into U.S. dollars at the prevailing exchange rate on the respective date of such transaction. The portion of the results of operations attributable to changes in foreign exchange rates on investments is not bifurcated from the portion attributable to changes in market prices. The effect of changes in foreign currency exchange rates on realized and unrealized security gains and losses is reflected as a component of security gains and losses.
Class Accounting Shareholder servicing, prospectus, and shareholder report expenses incurred by each class are charged directly to the class to which they relate. Expenses common to both classes, investment income, and realized and unrealized gains and losses are allocated to the classes based upon the relative daily net assets of each class. To the extent any expenses are waived or reimbursed in accordance with an expense limitation (see Note 6), the waiver or reimbursement is charged to the applicable class or allocated across the classes in the same manner as the related expense.
Rebates Subject to best execution, the fund may direct certain security trades to brokers who have agreed to rebate a portion of the related brokerage commission to the fund in cash. Commission rebates are reflected as realized gain on securities in the accompanying financial statements and totaled $2,000 for the six months ended June 30, 2018.
New Accounting Guidance In March 2017, the FASB issued amended guidance to shorten the amortization period for certain callable debt securities held at a premium. The guidance is effective for fiscal years and interim periods beginning after December 15, 2018. Adoption will have no effect on the fund’s net assets or results of operations.
Indemnification In the normal course of business, the fund may provide indemnification in connection with its officers and directors, service providers, and/or private company investments. The fund’s maximum exposure under these arrangements is unknown; however, the risk of material loss is currently considered to be remote.

srbal_0618_P4Proof #
T. Rowe PRICe BalanCed Fund
78
NOTE 2 - VALUATION
The fund’s financial instruments are valued and each class’s net asset value (NAV) per share is computed at the close of the New York Stock Exchange (NYSE), normally 4 p.m. ET, each day the NYSE is open for business. However, the NAV per share may be calculated at a time other than the normal close of the NYSE if trading on the NYSE is restricted, if the NYSE closes earlier, or as may be permitted by the SEC.
Fair Value The fund’s financial instruments are reported at fair value, which GAAP defines as the price that would be received to sell an asset or paid to transfer a liability in an orderly transaction between market participants at the measurement date. The T. Rowe Price Valuation Committee (the Valuation Committee) is an internal committee that has been delegated certain responsibilities by the fund’s Board of Directors (the Board) to ensure that financial instruments are appropriately priced at fair value in accordance with GAAP and the 1940 Act. Subject to oversight by the Board, the Valuation Committee develops and oversees pricing-related policies and procedures and approves all fair value determinations. Specifically, the Valuation Committee establishes procedures to value securities; determines pricing techniques, sources, and persons eligible to effect fair value pricing actions; oversees the selection, services, and performance of pricing vendors; oversees valuation-related business continuity practices; and provides guidance on internal controls and valuation-related matters. The Valuation Committee reports to the Board and has representation from legal, portfolio management and trading, operations, risk management, and the fund’s treasurer.
Various valuation techniques and inputs are used to determine the fair value of financial instruments. GAAP establishes the following fair value hierarchy that categorizes the inputs used to measure fair value:
Level 1 – quoted prices (unadjusted) in active markets for identical financial instruments that the fund can access at the reporting date
Level 2 – inputs other than Level 1 quoted prices that are observable, either directly or indirectly (including, but not limited to, quoted prices for similar financial instruments in active markets, quoted prices for identical or similar financial instruments in inactive markets, interest rates and yield curves, implied volatilities, and credit spreads)
Level 3 – unobservable inputs
Observable inputs are developed using market data, such as publicly available information about actual events or transactions, and reflect the assumptions that market participants would use to price the financial instrument. Unobservable inputs are those for which market data are not available and are developed using the best information available about the assumptions that market participants would use to price the financial instrument.

srbal_0618_P4Proof #
T. Rowe PRICe BalanCed Fund
79
GAAP requires valuation techniques to maximize the use of relevant observable inputs and minimize the use of unobservable inputs. When multiple inputs are used to derive fair value, the financial instrument is assigned to the level within the fair value hierarchy based on the lowest-level input that is significant to the fair value of the financial instrument. Input levels are not necessarily an indication of the risk or liquidity associated with financial instruments at that level but rather the degree of judgment used in determining those values.
Valuation Techniques Equity securities listed or regularly traded on a securities exchange or in the over-the-counter (OTC) market are valued at the last quoted sale price or, for certain markets, the official closing price at the time the valuations are made. OTC Bulletin Board securities are valued at the mean of the closing bid and asked prices. A security that is listed or traded on more than one exchange is valued at the quotation on the exchange determined to be the primary market for such security. Listed securities not traded on a particular day are valued at the mean of the closing bid and asked prices for domestic securities and the last quoted sale or closing price for international securities.
For valuation purposes, the last quoted prices of non-U.S. equity securities may be adjusted to reflect the fair value of such securities at the close of the NYSE. If the fund determines that developments between the close of a foreign market and the close of the NYSE will affect the value of some or all of its portfolio securities, the fund will adjust the previous quoted prices to reflect what it believes to be the fair value of the securities as of the close of the NYSE. In deciding whether it is necessary to adjust quoted prices to reflect fair value, the fund reviews a variety of factors, including developments in foreign markets, the performance of U.S. securities markets, and the performance of instruments trading in U.S. markets that represent foreign securities and baskets of foreign securities. The fund may also fair value securities in other situations, such as when a particular foreign market is closed but the fund is open. The fund uses outside pricing services to provide it with quoted prices and information to evaluate or adjust those prices. The fund cannot predict how often it will use quoted prices and how often it will determine it necessary to adjust those prices to reflect fair value. As a means of evaluating its security valuation process, the fund routinely compares quoted prices, the next day’s opening prices in the same markets, and adjusted prices.
Actively traded equity securities listed on a domestic exchange generally are categorized in Level 1 of the fair value hierarchy. Non-U.S. equity securities generally are categorized in Level 2 of the fair value hierarchy despite the availability of quoted prices because, as described above, the fund evaluates and determines whether those quoted prices reflect fair value at the close of the NYSE or require adjustment. OTC Bulletin Board securities, certain preferred securities, and equity securities traded in inactive markets generally are categorized in Level 2 of the fair value hierarchy.

srbal_0618_P4Proof #
T. Rowe PRICe BalanCed Fund
80
Debt securities generally are traded in the over-the-counter (OTC) market and are valued at prices furnished by dealers who make markets in such securities or by an independent pricing service, which considers the yield or price of bonds of comparable quality, coupon, maturity, and type, as well as prices quoted by dealers who make markets in such securities. Generally, debt securities are categorized in Level 2 of the fair value hierarchy ; however, to the extent the valuations include significant unobservable inputs, the securities would be categorized in Level 3.
Investments in mutual funds are valued at the mutual fund’s closing NAV per share on the day of valuation and are categorized in Level 1 of the fair value hierarchy. Financial futures contracts are valued at closing settlement prices and are categorized in Level 1 of the fair value hierarchy. Assets and liabilities other than financial instruments, including short-term receivables and payables, are carried at cost, or estimated realizable value, if less, which approximates fair value.
Thinly traded financial instruments and those for which the above valuation procedures are inappropriate or are deemed not to reflect fair value are stated at fair value as determined in good faith by the Valuation Committee. The objective of any fair value pricing determination is to arrive at a price that could reasonably be expected from a current sale. Financial instruments fair valued by the Valuation Committee are primarily private placements, restricted securities, warrants, rights, and other securities that are not publicly traded.
Subject to oversight by the Board, the Valuation Committee regularly makes good faith judgments to establish and adjust the fair valuations of certain securities as events occur and circumstances warrant. For instance, in determining the fair value of an equity investment with limited market activity, such as a private placement or a thinly traded public company stock, the Valuation Committee considers a variety of factors, which may include, but are not limited to, the issuer’s business prospects, its financial standing and performance, recent investment transactions in the issuer, new rounds of financing, negotiated transactions of significant size between other investors in the company, relevant market valuations of peer companies, strategic events affecting the company, market liquidity for the issuer, and general economic conditions and events. In consultation with the investment and pricing teams, the Valuation Committee will determine an appropriate valuation technique based on available information, which may include both observable and unobservable inputs. The Valuation Committee typically will afford greatest weight to actual prices in arm’s length transactions, to the extent they represent orderly transactions between market participants, transaction information can be reliably obtained, and prices are deemed representative of fair value. However, the
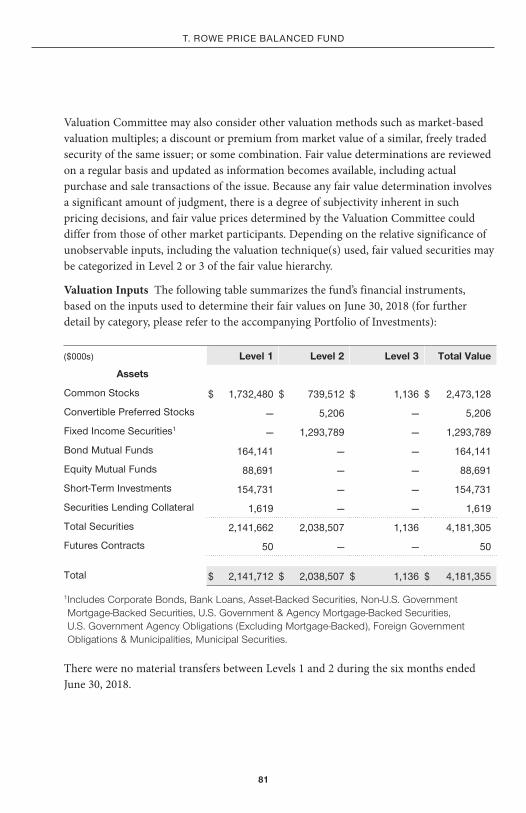
srbal_0618_P4Proof #
T. Rowe PRICe BalanCed Fund
81
Valuation Committee may also consider other valuation methods such as market-based valuation multiples; a discount or premium from market value of a similar, freely traded security of the same issuer; or some combination. Fair value determinations are reviewed on a regular basis and updated as information becomes available, including actual purchase and sale transactions of the issue. Because any fair value determination involves a significant amount of judgment, there is a degree of subjectivity inherent in such pricing decisions, and fair value prices determined by the Valuation Committee could differ from those of other market participants. Depending on the relative significance of unobservable inputs, including the valuation technique(s) used, fair valued securities may be categorized in Level 2 or 3 of the fair value hierarchy.
Valuation Inputs The following table summarizes the fund’s financial instruments, based on the inputs used to determine their fair values on June 30, 2018 (for further detail by category, please refer to the accompanying Portfolio of Investments):
($000s) Level 1 Level 2 Level 3 Total Value
Assets
Common Stocks $ 1,732,480 $ 739,512 $ 1,136 $ 2,473,128
Convertible Preferred Stocks — 5,206 — 5,206
Fixed Income Securities1 — 1,293,789 — 1,293,789
Bond Mutual Funds 164,141 — — 164,141
equity Mutual Funds 88,691 — — 88,691
Short-Term Investments 154,731 — — 154,731
Securities lending Collateral 1,619 — — 1,619
Total Securities 2,141,662 2,038,507 1,136 4,181,305
Futures Contracts 50 — — 50
Total $ 2,141,712 $ 2,038,507 $ 1,136 $ 4,181,355
1 Includes Corporate Bonds, Bank Loans, Asset-Backed Securities, Non-U.S. Government Mortgage-Backed Securities, U.S. Government & Agency Mortgage-Backed Securities, U.S. Government Agency Obligations (Excluding Mortgage-Backed), Foreign Government Obligations & Municipalities, Municipal Securities.
There were no material transfers between Levels 1 and 2 during the six months ended June 30, 2018.

srbal_0618_P4Proof #
T. Rowe PRICe BalanCed Fund
82
Following is a reconciliation of the fund’s Level 3 holdings for the six months ended June 30, 2018. Gain (loss) reflects both realized and change in unrealized gain/loss on Level 3 holdings during the period, if any, and is included on the accompanying Statement of Operations. The change in unrealized gain/loss on Level 3 instruments held at June 30, 2018, totaled $0 for the six months ended June 30, 2018.
($000s) Beginning Balance 1/1/18
Gain (Loss) During Period
Total Purchases
Ending Balance 6/30/18
Investment in Securities
Common Stocks $ — $ — $ 1,136 $ 1,136
Total $ — $ — $ 1,136 $ 1,136
NOTE 3 - DERIVATIVE INSTRUMENTS
During the six months ended June 30, 2018, the fund invested in derivative instruments. As defined by GAAP, a derivative is a financial instrument whose value is derived from an underlying security price, foreign exchange rate, interest rate, index of prices or rates, or other variable; it requires little or no initial investment and permits or requires net settlement. The fund invests in derivatives only if the expected risks and rewards are consistent with its investment objectives, policies, and overall risk profile, as described in its prospectus and Statement of Additional Information. The fund may use derivatives for a variety of purposes, such as seeking to hedge against declines in principal value, increase yield, invest in an asset with greater efficiency and at a lower cost than is possible through direct investment, or to adjust credit exposure. The risks associated with the use of derivatives are different from, and potentially much greater than, the risks associated with investing directly in the instruments on which the derivatives are based. The fund at all times maintains sufficient cash reserves, liquid assets, or other SEC-permitted asset types to cover its settlement obligations under open derivative contracts.

srbal_0618_P4Proof #
T. Rowe PRICe BalanCed Fund
83
The fund values its derivatives at fair value and recognizes changes in fair value currently in its results of operations. Accordingly, the fund does not follow hedge accounting, even for derivatives employed as economic hedges. Generally, the fund accounts for its derivatives on a gross basis. It does not offset the fair value of derivative liabilities against the fair value of derivative assets on its financial statements, nor does it offset the fair value of derivative instruments against the right to reclaim or obligation to return collateral. The following table summarizes the fair value of the fund’s derivative instruments held as of June 30, 2018, and the related location on the accompanying Statement of Assets and Liabilities, presented by primary underlying risk exposure:
($000s) Location on Statement of Assets and Liabilities Fair Value
Assets
Interest rate derivatives Futures* $ 26
Total $ 26
Liabilities
Interest rate derivatives Futures* $ 21
equity derivatives Futures* 197
Total $ 218
* The fair value presented includes cumulative gain (loss) on open futures contracts; however, the value reflected on the accompanying Statement of Assets and Liabilities is only the unsettled variation margin receivable (payable) at that date.

srbal_0618_P4Proof #
T. Rowe PRICe BalanCed Fund
84
Additionally, the amount of gains and losses on derivative instruments recognized in fund earnings during the six months ended June 30, 2018, and the related location on the accompanying Statement of Operations is summarized in the following table by primary underlying risk exposure:
($000s)Securities^
Options Written Futures Total
Realized Gain (Loss)
Interest rate contracts $ (52) $ (234) $ 260 $ (21)
Credit contracts (168) 336 — 168
equity contracts — — 288 283
Total $ (220) $ 102 $ 548 $ 430
Change in Unrealized Gain / Loss
Interest rate contracts $ — $ — $ (40) $ (40)
Credit contracts 82 (196) — (114)
equity contracts — — (296) (296)
Total $ 82 $ (196) $ (336) $ (450)
^ Purchased options are reported as securities.
Counterparty Risk and Collateral The fund invests in exchange-traded or centrally cleared derivative contracts, such as futures, exchange-traded options, and centrally cleared swaps. Counterparty risk on such derivatives is minimal because the clearinghouse provides protection against counterparty defaults. For futures and centrally cleared swaps, the fund is required to deposit collateral in an amount specified by the clearinghouse and the clearing firm (margin requirement), and the margin requirement must be maintained over the life of the contract. Each clearinghouse and clearing firm, in its sole discretion, may adjust the margin requirements applicable to the fund.
Collateral may be in the form of cash or debt securities issued by the U.S. government or related agencies. Cash posted by the fund is reflected as cash deposits in the accompanying financial statements and generally is restricted from withdrawal by the fund; securities posted by the fund are so noted in the accompanying Portfolio of Investments; both remain in the fund’s assets. While typically not sold in the same manner as equity or fixed income securities, exchange-traded or centrally cleared

srbal_0618_P4Proof #
T. Rowe PRICe BalanCed Fund
85
derivatives may be closed out only on the exchange or clearinghouse where the contracts were traded. This ability is subject to the liquidity of underlying positions. As of June 30, 2018, securities valued at $415,000 had been posted by the fund for exchange-traded and/or centrally cleared derivatives.
Futures Contracts The fund is subject to interest rate and equity price risk in the normal course of pursuing its investment objectives and uses futures contracts to help manage such risks. The fund may enter into futures contracts to manage exposure to interest rate and yield curve movements, security prices, foreign currencies, credit quality, and mortgage prepayments; as an efficient means of adjusting exposure to all or part of a target market; to enhance income; as a cash management tool; or to adjust portfolio duration and credit exposure. A futures contract provides for the future sale by one party and purchase by another of a specified amount of a specific underlying financial instrument at an agreed upon price, date, time, and place. The fund currently invests only in exchange-traded futures, which generally are standardized as to maturity date, underlying financial instrument, and other contract terms. Payments are made or received by the fund each day to settle daily fluctuations in the value of the contract (variation margin), which reflect changes in the value of the underlying financial instrument. Variation margin is recorded as unrealized gain or loss until the contract is closed. The value of a futures contract included in net assets is the amount of unsettled variation margin; net variation margin receivable is reflected as an asset and net variation margin payable is reflected as a liability on the accompanying Statement of Assets and Liabilities. Risks related to the use of futures contracts include possible illiquidity of the futures markets, contract prices that can be highly volatile and imperfectly correlated to movements in hedged security values and/or interest rate, and potential losses in excess of the fund’s initial investment. During the six months ended June 30, 2018, the volume of the fund’s activity in futures, based on underlying notional amounts, was approximately 1% of net assets.
Options The fund is subject to interest rate risk and credit risk in the normal course of pursuing its investment objectives and uses options to help manage such risks. The fund may use options to manage exposure to security prices, interest rates, foreign currencies, and credit quality; as an efficient means of adjusting exposure to all or a part of a target market; to enhance income; as a cash management tool; or to adjust credit exposure. Options are included in net assets at fair value, options purchased are included in Investments in Securities, and Options written are separately reflected as a liability on the accompanying Statement of Assets and Liabilities. Premiums on unexercised, expired options are recorded as realized gains or losses; premiums on exercised options are recorded as an adjustment to the proceeds from the sale or cost of the purchase. The difference between the premium and the amount received or paid in a closing transaction

srbal_0618_P4Proof #
T. Rowe PRICe BalanCed Fund
86
is also treated as realized gain or loss. In return for a premium paid, options on swaps give the holder the right, but not the obligation, to enter a specified swap contract on predefined terms. The exercise price of an option on a credit default swap is stated in terms of a specified spread that represents the cost of credit protection on the reference asset, including both the upfront premium to open the position and future periodic payments. The exercise price of an interest rate swap is stated in terms of a fixed interest rate; generally, there is no upfront payment to open the position. Risks related to the use of options include possible illiquidity of the options markets; trading restrictions imposed by an exchange or counterparty; movements in the underlying asset values and credit rating; and, for Options written, potential losses in excess of the fund’s initial investment. During the six months ended June 30, 2018, the volume of the fund’s activity in options, based on underlying notional amounts, was generally between 0% and 12% of net assets.
NOTE 4 - OTHER INVESTMENT TRANSACTIONS
Consistent with its investment objective, the fund engages in the following practices to manage exposure to certain risks and/or to enhance performance. The investment objective, policies, program, and risk factors of the fund are described more fully in the fund’s prospectus and Statement of Additional Information.
Restricted Securities The fund may invest in securities that are subject to legal or contractual restrictions on resale. Prompt sale of such securities at an acceptable price may be difficult and may involve substantial delays and additional costs.
Collateralized Loan Obligations The fund may invest in collateralized loan obligations (CLOs) which are entities backed by a diversified pool of syndicated bank loans. The cash flows of the CLO can be split into multiple segments, called “tranches” or “classes”, which will vary in risk profile and yield. The riskiest segments, which are the subordinate or “equity” tranches, bear the greatest risk of loss from defaults in the underlying assets of the CLO and serve to protect the other, more senior, tranches. Senior tranches will typically have higher credit ratings and lower yields than the securities underlying the CLO. Despite the protection from the more junior tranches, senior tranches can experience substantial losses.
TBA Purchase and Sale Commitments The fund may enter into to-be-announced (TBA) purchase or sale commitments (collectively, TBA transactions), pursuant to which it agrees to purchase or sell, respectively, mortgage-backed securities for a fixed unit price, with payment and delivery at a scheduled future date beyond the customary settlement period for such securities. With TBA transactions, the particular securities to be received or delivered by the fund are not identified at the trade date; however, the

srbal_0618_P4Proof #
T. Rowe PRICe BalanCed Fund
87
securities must meet specified terms, including issuer, rate, and mortgage term, and be within industry-accepted “good delivery” standards. The fund may enter into TBA transactions with the intention of taking possession of or relinquishing the underlying securities, may elect to extend the settlement by “rolling” the transaction, and/or may use TBA transactions to gain or reduce interim exposure to underlying securities. Until settlement, the fund maintains liquid assets sufficient to settle its commitment to purchase a TBA or, in the case of a sale commitment, the fund maintains an entitlement to the security to be sold.
To mitigate counterparty risk, the fund has entered into agreements with TBA counterparties that provide for collateral and the right to offset amounts due to or from those counterparties under specified conditions. Subject to minimum transfer amounts, collateral requirements are determined and transfers made based on the net aggregate unrealized gain or loss on all TBA commitments with a particular counterparty. At any time, the fund’s risk of loss from a particular counterparty related to its TBA commitments is the aggregate unrealized gain on appreciated TBAs in excess of unrealized loss on depreciated TBAs and collateral received, if any, from such counterparty. As of June 30, 2018, no collateral had been posted by the fund to counterparties for TBAs. As of June 30, 2018, collateral pledged by counterparties to the fund for TBAs consisted of securities valued at $117,000.
Bank Loans The fund may invest in bank loans, which represent an interest in amounts owed by a borrower to a syndicate of lenders. Bank loans are generally noninvestment grade and often involve borrowers whose financial condition is highly leveraged. Bank loans may be in the form of either assignments or participations. A loan assignment transfers all legal, beneficial, and economic rights to the buyer, and transfer typically requires consent of both the borrower and agent. In contrast, a loan participation generally entitles the buyer to receive the cash flows from principal, interest, and any fee payments on a portion of a loan; however, the seller continues to hold legal title to that portion of the loan. As a result, the buyer of a loan participation generally has no direct recourse against the borrower and is exposed to credit risk of both the borrower and seller of the participation. Bank loans often have extended settlement periods, generally may be repaid at any time at the option of the borrower, and may require additional principal to be funded at the borrowers’ discretion at a later date (e.g. unfunded commitments and revolving debt instruments). Until settlement, the fund maintains liquid assets sufficient to settle its unfunded loan commitments. The fund reflects both the funded portion of a bank loan as well as its unfunded commitment in the Portfolio of Investments. However, if a credit agreement provides no initial funding of a tranche and funding of the full commitment at a future date(s) is at the borrower’s discretion and considered uncertain, a loan is reflected in the Portfolio of Investments only if, and only to the extent that, the fund has actually settled a funding commitment.

srbal_0618_P4Proof #
T. Rowe PRICe BalanCed Fund
88
Securities Lending The fund may lend its securities to approved borrowers to earn additional income. Its securities lending activities are administered by a lending agent in accordance with a securities lending agreement. Security loans generally do not have stated maturity dates, and the fund may recall a security at any time. The fund receives collateral in the form of cash or U.S. government securities, valued at 102% to 105% of the value of the securities on loan. Collateral is maintained over the life of the loan in an amount not less than the value of loaned securities; any additional collateral required due to changes in security values is delivered to the fund the next business day. Cash collateral is invested in accordance with investment guidelines approved by fund management. Additionally, the lending agent indemnifies the fund against losses resulting from borrower default. Although risk is mitigated by the collateral and indemnification, the fund could experience a delay in recovering its securities and a possible loss of income or value if the borrower fails to return the securities, collateral investments decline in value, and the lending agent fails to perform. Securities lending revenue consists of earnings on invested collateral and borrowing fees, net of any rebates to the borrower, compensation to the lending agent, and other administrative costs. In accordance with GAAP, investments made with cash collateral are reflected in the accompanying financial statements, but collateral received in the form of securities is not. At June 30, 2018, the value of loaned securities was $1,511,000; the value of cash collateral and related investments was $1,619,000.
Mortgage-Backed Securities The fund may invest in mortgage-backed securities (MBS or pass-through certificates) that represent an interest in a pool of specific underlying mortgage loans and entitle the fund to the periodic payments of principal and interest from those mortgages. MBS may be issued by government agencies or corporations, or private issuers. Most MBS issued by government agencies are guaranteed; however, the degree of protection differs based on the issuer. MBS are sensitive to changes in economic conditions that affect the rate of prepayments and defaults on the underlying mortgages; accordingly, the value, income, and related cash flows from MBS may be more volatile than other debt instruments.
Other Purchases and sales of portfolio securities other than short-term and U.S. government securities aggregated $844,494,000 and $805,640,000, respectively, for the six months ended June 30, 2018. Purchases and sales of U.S. government securities aggregated $666,851,000 and $644,858,000, respectively, for the six months ended June 30, 2018.

srbal_0618_P4Proof #
T. Rowe PRICe BalanCed Fund
89
NOTE 5 - FEDERAL INCOME TAXES
No provision for federal income taxes is required since the fund intends to continue to qualify as a regulated investment company under Subchapter M of the Internal Revenue Code and distribute to shareholders all of its taxable income and gains. Distributions determined in accordance with federal income tax regulations may differ in amount or character from net investment income and realized gains for financial reporting purposes. Financial reporting records are adjusted for permanent book/tax differences to reflect tax character but are not adjusted for temporary differences. The amount and character of tax-basis distributions and composition of net assets are finalized at fiscal year-end; accordingly, tax-basis balances have not been determined as of the date of this report.
At June 30, 2018, the cost of investments for federal income tax purposes was $3,189,516,000. Net unrealized gain aggregated $991,566,000 at period-end, of which $1,083,627,000 related to appreciated investments and $92,061,000 related to depreciated investments.
NOTE 6 - RELATED PARTY TRANSACTIONS
The fund is managed by T. Rowe Price Associates, Inc. (Price Associates), a wholly owned subsidiary of T. Rowe Price Group, Inc. (Price Group). The investment management agreement between the fund and Price Associates provides for an annual investment management fee, which is computed daily and paid monthly. The fee consists of an individual fund fee, equal to 0.15% of the fund’s average daily net assets, and a group fee. The group fee rate is calculated based on the combined net assets of certain mutual funds sponsored by Price Associates (the group) applied to a graduated fee schedule, with rates ranging from 0.48% for the first $1 billion of assets to 0.265% for assets in excess of $650 billion. The fund’s group fee is determined by applying the group fee rate to the fund’s average daily net assets. At June 30, 2018, the effective annual group fee rate was 0.29%.
The I Class is subject to an operating expense limitation (I Class limit) pursuant to which Price Associates is contractually required to pay all operating expenses of the I Class, excluding management fees, interest, expenses related to borrowings, taxes, brokerage, and other non-recurring expenses permitted by the investment management agreement, to the extent such operating expenses, on an annualized basis, exceed 0.05% of average

srbal_0618_P4Proof #
T. Rowe PRICe BalanCed Fund
90
net assets. This agreement will continue until April 30, 2020, and may be renewed, revised, or revoked only with approval of the fund’s Board. The I Class is required to repay Price Associates for expenses previously paid to the extent the class’s net assets grow or expenses decline sufficiently to allow repayment without causing the class’s operating expenses (after the repayment is taken into account) to exceed both: (1) the expense limitation in place at the time such amounts were paid; and (2) the class’s current expense limitation. However, no repayment will be made more than three years after the date of a payment or waiver. For the six months ended June 30, 2018, the I Class operated below its expense limitation.
In addition, the fund has entered into service agreements with Price Associates and two wholly owned subsidiaries of Price Associates, each an affiliate of the fund (collectively, Price). Price Associates provides certain accounting and administrative services to the fund. T. Rowe Price Services, Inc., provides shareholder and administrative services in its capacity as the fund’s transfer and dividend-disbursing agent. T. Rowe Price Retirement Plan Services, Inc., provides subaccounting and recordkeeping services for certain retirement accounts invested in the Investor Class and I Class. For the six months ended June 30, 2018, expenses incurred pursuant to these service agreements were $46,000 for Price Associates; $611,000 for T. Rowe Price Services, Inc.; and $783,000 for T. Rowe Price Retirement Plan Services, Inc. All amounts due to and due from Price, exclusive of investment management fees payable, are presented net on the accompanying Statement of Assets and Liabilities.
The fund may invest its cash reserves in certain open-end management investment companies managed by Price Associates and considered affiliates of the fund: the T. Rowe Price Government Reserve Fund or the T. Rowe Price Treasury Reserve Fund, organized as money market funds, or the T. Rowe Price Short-Term Fund, a short-term bond fund (collectively, the Price Reserve Funds). The Price Reserve Funds are offered as short-term investment options to mutual funds, trusts, and other accounts managed by Price Associates or its affiliates and are not available for direct purchase by members of the public. Cash collateral from securities lending is invested in the T. Rowe Price Short-Term Fund. The Price Reserve Funds pay no investment management fees.
The fund may also invest in certain other T. Rowe Price funds (Price Funds) as a means of gaining efficient and cost-effective exposure to certain markets. The fund does not invest for the purpose of exercising management or control; however, investments by the fund may represent a significant portion of an underlying Price Fund’s net assets. Each underlying Price Fund is an open-end management investment company managed by Price Associates and is considered an affiliate of the fund. To ensure that the fund does not incur duplicate management fees (paid by the underlying Price Fund(s) and the fund), Price Associates has agreed to permanently waive a portion of its management fee

srbal_0618_P4Proof #
T. Rowe PRICe BalanCed Fund
91
charged to the fund in an amount sufficient to fully offset that portion of management fees paid by each underlying Price Fund related to the fund’s investment therein. Annual management fee rates and amounts waived related to investments in the underlying Price Fund(s) for the six months ended June 30, 2018, are as follows:
($000s) Effective Management
Fee RateManagement
Fee Waived
T. Rowe Price Inflation Protected Bond Fund - I Class 0.17% $ 8
T. Rowe Price Institutional High Yield Fund 0.50 335
T. Rowe Price Institutional large-Cap Core Growth Fund 0.55 18
T. Rowe Price Institutional u.S. Structured Research Fund 0.50 17
T. Rowe Price limited duration Inflation Focused Bond Fund - I Class 0.25 3
T. Rowe Price overseas Stock Fund - I Class 0.64 31
T. Rowe Price Real assets Fund - I Class 0.64 186
T. Rowe Price u.S. Bond enhanced Index Fund 0.30 23
T. Rowe Price Value Fund - I Class 0.59 20
Total $ 641
The fund may participate in securities purchase and sale transactions with other funds or accounts advised by Price Associates (cross trades), in accordance with procedures adopted by the fund’s Board and Securities and Exchange Commission rules, which require, among other things, that such purchase and sale cross trades be effected at the independent current market price of the security. During the six months ended June 30, 2018, the aggregate value of purchases and sales cross trades with other funds or accounts advised by Price Associates was less than 1% of the fund’s net assets as of June 30, 2018.

srbal_0618_P4Proof #
92
T. Rowe PRICe BalanCed Fund
INFORMATION ON PROXY VOTING POLICIES, PROCEDURES, AND RECORDS
A description of the policies and procedures used by T. Rowe Price funds and portfolios to determine how to vote proxies relating to portfolio securities is available in each fund’s Statement of Additional Information. You may request this document by calling 1-800-225-5132 or by accessing the SEC’s website, sec.gov.
The description of our proxy voting policies and procedures is also available on our corporate website. To access it, please visit the following Web page:
https://www3.troweprice.com/usis/corporate/en/utility/policies.html
Scroll down to the section near the bottom of the page that says, “Proxy Voting Policies.” Click on the Proxy Voting Policies link in the shaded box.
Each fund’s most recent annual proxy voting record is available on our website and through the SEC’s website. To access it through T. Rowe Price, visit the website location shown above, and scroll down to the section near the bottom of the page that says, “Proxy Voting Records.” Click on the Proxy Voting Records link in the shaded box.
HOW TO OBTAIN QUARTERLY PORTFOLIO HOLDINGS
The fund files a complete schedule of portfolio holdings with the Securities and Exchange Commission for the first and third quarters of each fiscal year on Form N-Q. The fund’s Form N-Q is available electronically on the SEC’s website (sec.gov); hard copies may be reviewed and copied at the SEC’s Public Reference Room, 100 F St. N.E., Washington, DC 20549. For more information on the Public Reference Room, call 1-800-SEC-0330.

srbal_0618_P4Proof #
93
T. Rowe PRICe BalanCed Fund
APPROVAL OF INVESTMENT MANAGEMENT AGREEMENT
Each year, the fund’s Board of Directors (Board) considers the continuation of the investment management agreement (Advisory Contract) between the fund and its investment advisor, T. Rowe Price Associates, Inc. (Advisor), on behalf of the fund. In that regard, at an in-person meeting held on March 5–6, 2018 (Meeting), the Board, including a majority of the fund’s independent directors, approved the continuation of the fund’s Advisory Contract. At the Meeting, the Board considered the factors and reached the conclusions described below relating to the selection of the Advisor and the approval of the Advisory Contract. The independent directors were assisted in their evaluation of the Advisory Contract by independent legal counsel from whom they received separate legal advice and with whom they met separately.
In providing information to the Board, the Advisor was guided by a detailed set of requests for information submitted by independent legal counsel on behalf of the independent directors. In considering and approving the Advisory Contract, the Board considered the information it believed was relevant, including, but not limited to, the information discussed below. The Board considered not only the specific information presented in connection with the Meeting but also the knowledge gained over time through interaction with the Advisor about various topics. The Board meets regularly and, at each of its meetings, covers an extensive agenda of topics and materials and considers factors that are relevant to its annual consideration of the renewal of the T. Rowe Price funds’ advisory contracts, including performance and the services and support provided to the funds and their shareholders.
Services Provided by the AdvisorThe Board considered the nature, quality, and extent of the services provided to the fund by the Advisor. These services included, but were not limited to, directing the fund’s investments in accordance with its investment program and the overall management of the fund’s portfolio, as well as a variety of related activities such as financial, investment operations, and administrative services; compliance; maintaining the fund’s records and registrations; and shareholder communications. The Board also reviewed the background and experience of the Advisor’s senior management team and investment personnel involved in the management of the fund, as well as the Advisor’s compliance record. The Board concluded that it was satisfied with the nature, quality, and extent of the services provided by the Advisor.
Investment Performance of the FundThe Board took into account discussions with the Advisor and reports that it receives throughout the year relating to fund performance. In connection with the Meeting, the Board reviewed the fund’s net annualized total returns for the 1-, 2-, 3-, 4-, 5-, and 10-year periods as of September 30, 2017, and compared these returns with the performance of a peer group of funds with similar investment programs and a wide variety of other previously agreed-upon comparable performance measures and market data, including those supplied by Broadridge, which is an independent provider of mutual fund data.

srbal_0618_P4Proof #
94
T. Rowe PRICe BalanCed Fund
On the basis of this evaluation and the Board’s ongoing review of investment results, and factoring in the relative market conditions during certain of the performance periods, the Board concluded that the fund’s performance was satisfactory.
Costs, Benefits, Profits, and Economies of ScaleThe Board reviewed detailed information regarding the revenues received by the Advisor under the Advisory Contract and other benefits that the Advisor (and its affiliates) may have realized from its relationship with the fund, including any research received under “soft dollar” agreements and commission-sharing arrangements with broker-dealers. The Board considered that the Advisor may receive some benefit from soft-dollar arrangements pursuant to which research is received from broker-dealers that execute the fund’s portfolio transactions. The Board received information on the estimated costs incurred and profits realized by the Advisor from managing the T. Rowe Price funds. The Board also reviewed estimates of the profits realized from managing the fund in particular, and the Board concluded that the Advisor’s profits were reasonable in light of the services provided to the fund.
The Board also considered whether the fund benefits under the fee levels set forth in the Advisory Contract from any economies of scale realized by the Advisor. Under the Advisory Contract, the fund pays a fee to the Advisor for investment management services composed of two components—a group fee rate based on the combined average net assets of most of the T. Rowe Price funds (including the fund) that declines at certain asset levels and an individual fund fee rate based on the fund’s average daily net assets—and the fund pays its own expenses of operations. The Board concluded that the advisory fee structure for the fund continued to provide for a reasonable sharing of benefits from any economies of scale with the fund’s investors.
Fees and ExpensesThe Board was provided with information regarding industry trends in management fees and expenses. Among other things, the Board reviewed data for peer groups that were compiled by Broadridge, which compared: (i) contractual management fees, total expenses, actual management fees, and nonmanagement expenses of the Investor Class of the fund with a group of competitor funds selected by Broadridge (Expense Group) and (ii) total expenses, actual management fees, and nonmanagement expenses of the Investor Class of the fund with a broader set of funds within the Lipper investment classification (Expense Universe). The Board considered the fund’s contractual management fee rate, actual management fee rate (which reflects the management fees actually received from the fund by the Advisor after any applicable waivers, reductions, or reimbursements), operating expenses, and total expenses (which reflect the net total expense ratio of the fund after any waivers, reductions, or reimbursements) in comparison with the information for the Broadridge peer groups. Broadridge generally constructed the peer groups by seeking the most comparable funds based on similar investment classifications and objectives, expense structure, asset size, and operating components and attributes and ranked funds into quintiles, with the first quintile
APPROVAL OF INVESTMENT MANAGEMENT AGREEMENT (CONTINUED)

srbal_0618_P4Proof #
95
T. Rowe PRICe BalanCed Fund
representing the funds with the lowest relative expenses and the fifth quintile representing the funds with the highest relative expenses. When compared against mixed-asset target allocation growth funds, the information provided to the Board indicated that the fund’s contractual management fee ranked in the first quintile (Expense Group), the fund’s actual management fee rate ranked in the second quintile (Expense Group) and first quintile (Expense Universe), and the fund’s total expenses ranked in the first quintile (Expense Group and Expense Universe). When compared against balanced funds, the information provided to the Board indicated that the fund’s contractual management fee ranked in the second quintile (Expense Group), the fund’s actual management fee rate ranked in the second quintile (Expense Group and Expense Universe), and the fund’s total expenses ranked in the first and second quintiles (Expense Group) and first quintile (Expense Universe).
The Board also reviewed the fee schedules for institutional accounts and private accounts with similar mandates that are advised or subadvised by the Advisor and its affiliates. Management provided the Board with information about the Advisor’s responsibilities and services provided to subadvisory and other institutional account clients, including information about how the requirements and economics of the institutional business are fundamentally different from those of the mutual fund business. The Board considered information showing that the Advisor’s mutual fund business is generally more complex from a business and compliance perspective than its institutional account business and considered various relevant factors, such as the broader scope of operations and oversight, more extensive shareholder communication infrastructure, greater asset flows, heightened business risks, and differences in applicable laws and regulations associated with the Advisor’s proprietary mutual fund business. In assessing the reasonableness of the fund’s management fee rate, the Board considered the differences in the nature of the services required for the Advisor to manage its mutual fund business versus managing a discrete pool of assets as a subadvisor to another institution’s mutual fund or for an institutional account and that the Advisor generally performs significant additional services and assumes greater risk in managing the fund and other T. Rowe Price funds than it does for institutional account clients.
On the basis of the information provided and the factors considered, the Board concluded that the fees paid by the fund under the Advisory Contract are reasonable.
Approval of the Advisory ContractAs noted, the Board approved the continuation of the Advisory Contract. No single factor was considered in isolation or to be determinative to the decision. Rather, the Board concluded, in light of a weighting and balancing of all factors considered, that it was in the best interests of the fund and its shareholders for the Board to approve the continuation of the Advisory Contract (including the fees to be charged for services thereunder).
APPROVAL OF INVESTMENT MANAGEMENT AGREEMENT (CONTINUED)

srbal_0618_P4Proof #
This page intentionally left blank.

srbal_0618_P4Proof #
This page intentionally left blank.

srbal_0618_P4Proof #
This page intentionally left blank.

srbal_0618_P4Proof #
This page intentionally left blank.

srbal_0618_P4Proof #
This page intentionally left blank.

srbal_0618_P4Proof #
This page intentionally left blank.

srbal_0618_P4Proof #
STOCK FUNDSDomestic Blue Chip GrowthCapital Appreciation‡
Capital OpportunityCommunications & TechnologyDiversified Mid-Cap GrowthDividend GrowthEquity IncomeEquity Index 500Extended Equity Market IndexFinancial ServicesGrowth & IncomeGrowth StockHealth SciencesMid-Cap Growth‡
Mid-Cap Value‡
New America GrowthNew EraNew Horizons‡
QM U.S. Small & Mid-Cap Core Equity
QM U.S. Small-Cap Growth EquityQM U.S. Value EquityReal EstateScience & TechnologySmall-Cap Stock‡
Small-Cap ValueTax-Efficient Equity Total Equity Market IndexU.S. Large-Cap CoreValue
ASSET ALLOCATION FUNDSBalanced Global AllocationMulti-Strategy Total ReturnPersonal Strategy BalancedPersonal Strategy GrowthPersonal Strategy IncomeReal AssetsSpectrum GrowthSpectrum IncomeSpectrum InternationalTarget Date Fundsˆ
BOND FUNDSDomestic TaxableCorporate IncomeCredit OpportunitiesFloating RateGNMA High Yield‡
Inflation Protected BondLimited Duration Inflation
Focused BondNew IncomeShort-Term BondTotal ReturnUltra Short-Term BondU.S. Bond Enhanced IndexU.S. High YieldU.S. Treasury IntermediateU.S. Treasury Long-Term
Domestic Tax-FreeCalifornia Tax-Free BondGeorgia Tax-Free BondIntermediate Tax-Free High YieldMaryland Short-Term Tax-Free BondMaryland Tax-Free BondNew Jersey Tax-Free BondNew York Tax-Free BondSummit Municipal IncomeSummit Municipal IntermediateTax-Free High YieldTax-Free IncomeTax-Free Short-IntermediateVirginia Tax-Free Bond
MONEY MARKET FUNDSTaxableCash Reserves1
Government Money2
U.S. Treasury Money2
MONEY MARKET FUNDS (cont.)Tax-FreeCalifornia Tax-Free Money1
Maryland Tax-Free Money1
New York Tax-Free Money1
Summit Municipal Money Market1
Tax-Exempt Money1
INTERNATIONAL/GLOBAL FUNDSStockAfrica & Middle EastAsia OpportunitiesEmerging EuropeEmerging Markets StockEmerging Markets Value StockEuropean Stock Global ConsumerGlobal Growth StockGlobal IndustrialsGlobal Real EstateGlobal StockGlobal Technology‡
International Concentrated EquityInternational Discovery‡
International Equity IndexInternational StockInternational Value EquityJapanLatin AmericaNew AsiaOverseas StockQM Global Equity
BondDynamic Global BondEmerging Markets BondEmerging Markets Corporate BondEmerging Markets Local Currency
BondGlobal High Income BondGlobal Multi-Sector BondInternational BondInternational Bond (USD Hedged)
201808-544900F68-051 8/18 T. Rowe Price Investment Services, Inc. | 100 East Pratt Street | Baltimore, MD 21202-1009
T. Rowe Price Mutual Funds This page contains supplementary information that is not part of the shareholder report.
Call 1-800-225-5132 to request a prospectus or summary prospectus; each includes investment objectives, risks, fees, expenses, and other information that you should read and consider carefully before investing.
‡ Subject to certain exceptions, the fund is currently closed to new investors and new accounts.ˆ The Target Date Funds are inclusive of the Retirement Funds, the Target Funds, and the Retirement Balanced Fund.1 Retail Funds: You could lose money by investing in the Fund. Although the Fund seeks to preserve the value of your
investment at $1.00 per share, it cannot guarantee it will do so. Beginning October 14, 2016, the Fund may impose a fee upon the sale of your shares or may temporarily suspend your ability to sell shares if the Fund’s liquidity falls below required minimums because of market conditions or other factors. An investment in the Fund is not insured or guaranteed by the Federal Deposit Insurance Corporation or any other government agency. The Fund’s sponsor has no legal obligation to provide financial support to the Fund, and you should not expect that the sponsor will provide financial support to the Fund at any time.
2 Government Funds: You could lose money by investing in the Fund. Although the Fund seeks to preserve the value of your investment at $1.00 per share, it cannot guarantee it will do so. An investment in the Fund is not insured or guaranteed by the Federal Deposit Insurance Corporation or any other government agency. The Fund’s sponsor has no legal obligation to provide financial support to the Fund, and you should not expect that the sponsor will provide financial support to the Fund at any time.