april 2013 methane finance study group...
TRANSCRIPT
A p r i l 2 0 1 3
Methane Finance Study Group reportUsing Pay-for-Performance Mechanisms to Finance Methane Abatement
Pub
lic D
iscl
osur
e A
utho
rized
Pub
lic D
iscl
osur
e A
utho
rized
Pub
lic D
iscl
osur
e A
utho
rized
Pub
lic D
iscl
osur
e A
utho
rized
Pub
lic D
iscl
osur
e A
utho
rized
Pub
lic D
iscl
osur
e A
utho
rized
Pub
lic D
iscl
osur
e A
utho
rized
Pub
lic D
iscl
osur
e A
utho
rized
Methane Finance Study Group Members
Mr. SaMuel TuMiwa ..................... Asian Development Bank
Mr. Jiwan acharya ...................... Asian Development Bank
MS. DeniSe Seabra ...................... Caixa Econômica Federal
Mr. ruperT eDwarDS ................... Climate Change Capital
Dr. Ken newcoMbe ...................... C-Quest Capital
Mr. bo riiSgaarD peDerSen .......... Danish Energy Agency
Dr. williaM pizer ....................... Duke University
Mr. FrancK porTalupi .................. Environment Canada
Mr. laurence blanDForD .............. Environment Canada
MS. carey bylin ......................... Global Methane Initiative
Mr. aleJanDro poSaDaS ................ Ministry of the Environment and Natural Resources (SEMARNAT) – Mexico
Mr. céSar chávez ....................... Ministry of the Environment and Natural Resources (SEMARNAT) – Mexico
Dr. M. naSir uDDin .................... Ministry of Environment and Forests, Government of Bangladesh
MS. aDriana FelipeTTo .................. Haztec
MS. JoSeFina a. raMoS ................. Landbank of the Philippines
Mr. pruDencio calaDo ................. Landbank of the Philippines
Mr. rayMonD babanawo................ Ministry of Environment, Ghana
MS. SuzanTy SiToruS ................... National Council on Climate Change, Indonesia
Mr. aSh SharMa ......................... NEFCO
Mr. einar TelneS ........................ NORAD
MS. Sun biao ............................. Shanxi Jincheng Anthracite Mining Group Co. Ltd.
Dr. bengT boSTröM ..................... Swedish Energy Agency
MS. anniKa chriSTell................... Swedish Energy Agency
MS. Marlene SiecK ...................... Federal Environment Agency, Germany
Mr. Jichong wu ......................... UN Foundation
Dr. alexanDra Soezer .................. UNDP
Mr. eric uSher .......................... UNEP
Mr. paul boDnar ........................ US Department of State
Mr. DaviD TurK .......................... US Department of State
APRIL 2013 | MethAne FInAnce Study GRouP RePoRt

1Using Pay-for-Performance Mechanisms to Finance Methane Abatement
this report looks at whether and how public funds, utilizing pay-for-performance mechanisms, may be used to incentivize
reductions of methane emissions. The work is the product of an international group of experts, the Methane Finance Study Group, convened in late 2012 at the request of the G8, and facilitated by the World Bank.
This report documents the discussions of the Methane Finance Study Group. The views expressed in this report are not necessarily those of the agencies or their representatives participating in the Study Group. Group members expressed a range of views and the drafters have made every effort to reflect those views in the report. This report is not an official publication of the World Bank Group.
The report was drafted on behalf of the Study Group by Scott Cantor and Brice Quesnel with support from Peter Maniloff, Alexandrina Platonova-Oquab, and Joshua Schneck and inputs from Jessica Wade-Murphy de Jimenez, Zhuo Cheng, Claudia Barrera, and Sintana Vergara.
The team wishes to acknowledge financial support from the US Environmental Protection Agency.
To download the Study Group’s report and its related appendices please visit publications at www.carbonfinance.org.
About

2 APRIL 2013 | MethAne FInAnce Study GRouP RePoRt
and cost-effective methane reduction measures identified would also contribute to improvements in local air quality (which will have a positive human health impact) and food security, by avoiding 27 million tons per year of crop losses in four major staple crops. Additionally, captured methane can be burned for cooking or electricity generation, contributing to increased access to clean energy. (see section I).
Unlocking Established Sectors to Reduce Emissions
Reducing methane can be achieved in a range of sectors, including oil and gas production and natural gas processing, transmission, and distribution; coal mine methane; solid waste and wastewater management, and agriculture. Across these sectors, the Study Group found that a large and growing number of abatement opportunities have been identified in developing countries, but in many cases these were not implemented due to financial and other barriers. Yet the additional revenue required to unlock these investments is often small. The methane sectors studied could deliver as much as 8,200 Mt of CO2e over the period 2013–2020 in emission reductions in developing countries at less than $10 per ton in incremental cost financing. Pay-for-performance mechanisms are well adapted to closing this narrow funding gap. (see section II).
Executive Summary
…the Study Group found that a large and growing number of abatement opportunities have been identified in developing countries, but in many cases these were not implemented due to financial and other barriers.
An international Study Group of experts evaluated new approaches for financing
projects that reduce methane emissions, including “pay-for-performance” mechanisms. Requested by the G8 and convened by the World Bank, this group recognizes the potential for these innovative mechanisms to deliver cost-effective, transparent results for climate change mitigation.1
Why Focus on Methane?
According to two 2011 studies by the World Meteorological Organization and the UN Environment Program, aggressive reduction of methane emissions, together with actions on black carbon, can substantially slow the rate of climate change over the next few decades. Methane actions alone are responsible for approximately half of the potential identified in these reports of 0.4–0.5°C in avoided global warming by 2050, complementing the international community’s critical measures to reduce CO2 emissions in order to avoid catastrophic climate change. Full implementation of the technically feasible
1 While the Study Group focused on financing methane mitigation using pay-for-performance in developing countries, it notes that these mechanisms could also be applied to reduce methane emissions in OECD countries (23% of the global amount in 2010, US EPA).

3Using Pay-for-Performance Mechanisms to Finance Methane Abatement
Paying-for-Performance: An Attractive Funding Mechanism
Pay-for-performance mechanisms disburse cash on the delivery of pre-determined and independently verified results. This makes them attractive instruments for governments facing expanding funding needs and scrutiny on achievements. These mechanisms can be used alone or in combination with traditional instruments such as loans, guarantees, or capacity building. Compared to traditional funding mechanisms, pay-for-performance provides increased transparency and accountability along with greater scope for innovation. They establish additional incentives that directly place a value on the public good in the real economy and offer increased scope for aid coordination and effectiveness. Such mechanisms can also be a powerful catalyst for private investment when they create creditworthy, hard-currency revenue streams which reduce emerging-market financing risks. Importantly, pay-for-performance mechanisms can be designed to directly incentivize private investment through allocation methods that maximize public value for money. (see section III).
the Study Group identifies three major opportunities for applying pay-for-
performance mechanisms to methane mitigation.
Deliver a Quick-Win: Paying for Methane Emission Reductions as a Climate Finance Pilot
First, the Study Group examined an innovative approach to financing methane reductions that aims to combine immediate impact and maximum cost-effectiveness. As an alternative to up-front grants, payments are made to project implementers based on independently verified emission reductions measured in terms of CO2 equivalent. Such an approach builds on the technical work of carbon offset standards such as the Clean Development Mechanism (CDM), the Verified Carbon Standard and the Climate Action Reserve. To date, in the CDM alone, over 2,000 projects have already issued certified emission reductions, and over 300 of these projects reduce methane. A payment program for CO2e would not be intended to support the existing carbon markets. Instead, it would make use of all the work that has already been completed internationally to design rigorous and transparent methodologies for calculating emission reductions through offset standards. A payment program would also rely on existing offset standards’ systems for monitoring, reporting and independently verifying emission reductions, thereby minimizing administrative costs. This results-based approach would use a competitive auction to determine the level of funding each project will receive, guaranteeing the lowest possible cost to the funder.
4 APRIL 2013 | MethAne FInAnce Study GRouP RePoRt
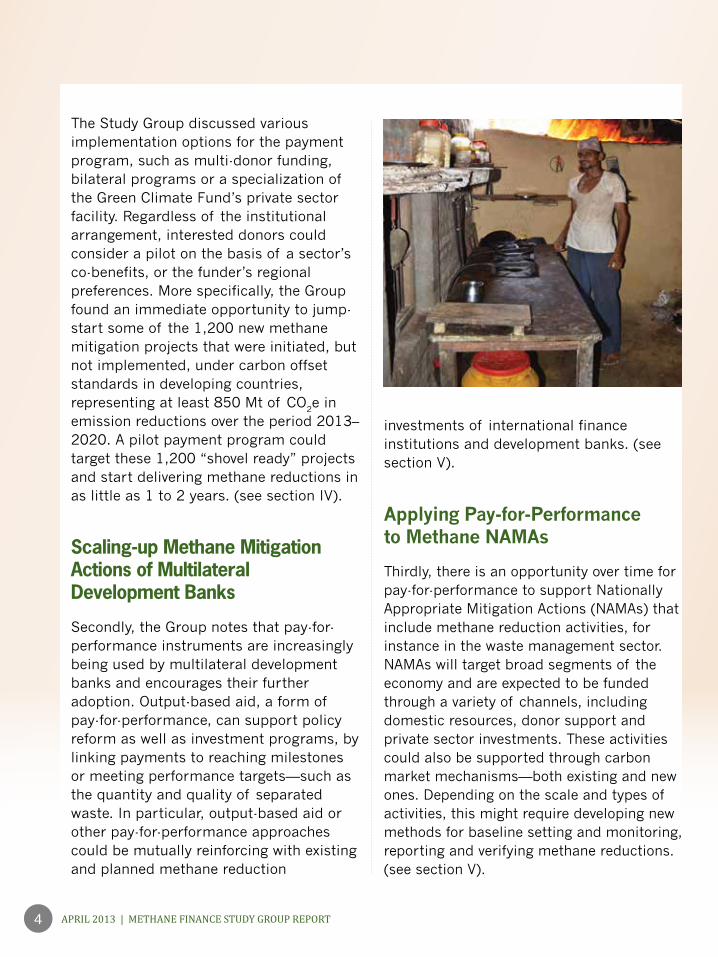
The Study Group discussed various implementation options for the payment program, such as multi-donor funding, bilateral programs or a specialization of the Green Climate Fund’s private sector facility. Regardless of the institutional arrangement, interested donors could consider a pilot on the basis of a sector’s co-benefits, or the funder’s regional preferences. More specifically, the Group found an immediate opportunity to jump-start some of the 1,200 new methane mitigation projects that were initiated, but not implemented, under carbon offset standards in developing countries, representing at least 850 Mt of CO2e in emission reductions over the period 2013–2020. A pilot payment program could target these 1,200 “shovel ready” projects and start delivering methane reductions in as little as 1 to 2 years. (see section IV).
Scaling-up Methane Mitigation Actions of Multilateral Development Banks
Secondly, the Group notes that pay-for-performance instruments are increasingly being used by multilateral development banks and encourages their further adoption. Output-based aid, a form of pay-for-performance, can support policy reform as well as investment programs, by linking payments to reaching milestones or meeting performance targets—such as the quantity and quality of separated waste. In particular, output-based aid or other pay-for-performance approaches could be mutually reinforcing with existing and planned methane reduction
investments of international finance institutions and development banks. (see section V).
Applying Pay-for-Performance to Methane NAMAs
Thirdly, there is an opportunity over time for pay-for-performance to support Nationally Appropriate Mitigation Actions (NAMAs) that include methane reduction activities, for instance in the waste management sector. NAMAs will target broad segments of the economy and are expected to be funded through a variety of channels, including domestic resources, donor support and private sector investments. These activities could also be supported through carbon market mechanisms—both existing and new ones. Depending on the scale and types of activities, this might require developing new methods for baseline setting and monitoring, reporting and verifying methane reductions. (see section V).

5Using Pay-for-Performance Mechanisms to Finance Methane Abatement
Methane Reduction Activities Deliver Quick and Significant Climate Change Mitigation
the Group’s tasking to focus on innovating financing for methane is highly relevant to address the urgency of the
climate challenge. Methane emissions caused by human activities are the second largest driver of climate change behind carbon dioxide. Methane is also a short lived climate pollutant (SLCP) with an average life-time in the atmosphere of around 12 years. It joins black carbon, tropospheric ozone, and some hydrofluorocarbons in this category of pollutants where near term action can have a significant effect on near term climate change. According to recent estimates (UNEP, 2011; Shindell et al. 2012), a concerted program to reduce methane and black carbon emissions would slow global warming by approximately 0.4 to 0.5°C by 2050. In isolation, methane measures alone are estimated in the same study to lessen warming by approximately 0.3°C by 2050.
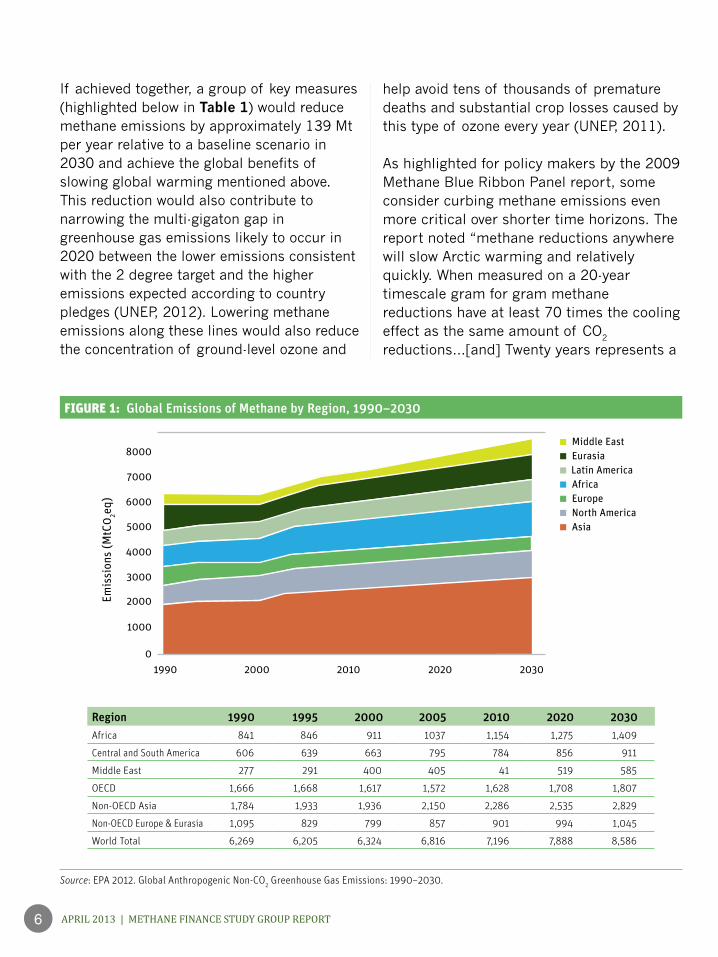
Over the next 20 years methane emissions are expected to grow by 19 percent, accounting for nearly half of all warming over this period. In its Global Non-CO2 GHG Emissions 1990-2030 report released in December 2012, the US EPA estimates that 7,196 Mt of CO2e of methane was emitted globally in 2010. In the absence of concerted action, this figure is expected to grow to 7,888 Mt by 2020 and 8,586 Mt by 2030. Figure 1 shows that the growth in methane emissions over the period is expected across all regions and at similar rates.
I. Why Focus on Methane?
6 APRIL 2013 | MethAne FInAnce Study GRouP RePoRt
Figure 1: Global Emissions of Methane by Region, 1990–2030
Middle East
1990
1000
2000
3000
4000
5000
6000
7000
8000
02000 2010 2020 2030
EurasiaLatin America
Emis
sion
s (M
tC0
2eq)
AfricaEuropeNorth AmericaAsia
Source: EPA 2012. Global Anthropogenic Non-CO2 Greenhouse Gas Emissions: 1990–2030.
If achieved together, a group of key measures (highlighted below in Table 1) would reduce methane emissions by approximately 139 Mt per year relative to a baseline scenario in 2030 and achieve the global benefits of slowing global warming mentioned above. This reduction would also contribute to narrowing the multi-gigaton gap in greenhouse gas emissions likely to occur in 2020 between the lower emissions consistent with the 2 degree target and the higher emissions expected according to country pledges (UNEP, 2012). Lowering methane emissions along these lines would also reduce the concentration of ground-level ozone and
help avoid tens of thousands of premature deaths and substantial crop losses caused by this type of ozone every year (UNEP, 2011).
As highlighted for policy makers by the 2009 Methane Blue Ribbon Panel report, some consider curbing methane emissions even more critical over shorter time horizons. The report noted “methane reductions anywhere will slow Arctic warming and relatively quickly. When measured on a 20-year timescale gram for gram methane reductions have at least 70 times the cooling effect as the same amount of CO2 reductions…[and] Twenty years represents a
Region 1990 1995 2000 2005 2010 2020 2030Africa 841 846 911 1037 1,154 1,275 1,409
Central and South America 606 639 663 795 784 856 911
Middle East 277 291 400 405 41 519 585
OECD 1,666 1,668 1,617 1,572 1,628 1,708 1,807
Non-OECD Asia 1,784 1,933 1,936 2,150 2,286 2,535 2,829
Non-OECD Europe & Eurasia 1,095 829 799 857 901 994 1,045
World Total 6,269 6,205 6,324 6,816 7,196 7,888 8,586

7Using Pay-for-Performance Mechanisms to Finance Methane Abatement
TABLE 1: Seven Key CH4 Measures Identified by UNEP for Methane Abatement
Measure SectorExtended pre-mine degasification and recovery and oxidation of metane from ventilation air from coal mines
Fossil fuel production and transport
Extended recovery and utilization, rather than venting, of associated gas and improved control of unintended fugitive emissions from the production of oil and natural gas
Reduced gas leaking from long-distance transmission piplines
Separation and treatment of biodegradable municipal waste through recycling, composting and anaerobic digestion as well as landfill gas collection with combustion/utilization
Waste managementUpgrading primary wastewater treatment to secondary/tertiary treatment with gas recovery and overflow control
Control of methane emissions from livestock, mainly through farm–scale anaerobic digestion of manure from cattle and pigs
Intermittent aeration of continuously flooded rice paddies Agriculture
Figure 2: Regional and Sector Distribution of 139 Mt of Methane Emission Reductions in 2030 Achieved with the Identified Measures in Table 1, Compared to the Reference Scenario in 2030
Aeration of rice paddies
Upgrading wastewater treatment
Waste treatment and landfill gas utilization
Reduced leaking from transmission in gas pipelines
Extended gas recovery and reduced fugitive emissions from oil & gas production
Methane capture in coal mines
Control of emissions fromlivestock (anaerobic digestionand feed options)
–50
–40
–30
–20
–10
0
Chan
ge in
met
hane
em
issi
ons
in 2
030
com
pare
d to
20
30
refr
ence
sce
nari
o (m
illio
ns o
f ton
s of
met
hane
)
Lati
n Am
eric
aan
dCa
ribb
ean
Nor
th E
ast,
Sout
h Ea
stAs
ia a
nd P
acifi
c
Afri
ca
Nor
thAm
eric
aan
d Eu
rope
Sout
hW
est a
ndCe
ntra
l Asi
a
Source: UNEP Synthesis Report Near-term Climate Protection and Clean Air Benefits: Actions for Controlling Short-Lived Climate Forcers.
critical time period for the Arctic and other sensitive areas” (Methane Blue Ribbon Panel, 2009).
While methane has the potential to provide low-cost abatement, the Study Group
emphasizes that near-term efforts to curb emissions of it and other SLCPs must be matched with near term measures and longer term structural changes that reduce carbon dioxide and other longer-lived greenhouse gases.

8 APRIL 2013 | MethAne FInAnce Study GRouP RePoRt
Methane Mitigation Activities also Provide Important Co-benefits
In addition to mitigating climate change, reduced methane emissions will deliver significant additional benefits including reduced air pollution, increased agriculture yields and improved public health. Methane is a precursor to tropospheric ozone, an air pollutant that is ubiquitous in the modern urban and rural environment. At high concentrations, ozone is phytotoxic and leads to crop losses. The effects of measures to reduce tropospheric ozone from methane tend to be global and not constrained to the regions implementing those measures as methane has a longer atmospheric lifetime than other ozone precursors and travels longer distances becoming mixed in the atmosphere (UNEP Synthesis Report, 2011). It is estimated that if action is taken on the methane measures referenced in table 1, as much as 27 million metric tons of crop yield losses in just four staple crops (wheat, rice, maize and soybeans) could be avoided in 2030, saving $4.2 billion (Shindell et al., 2012).
increase the risk of many respiratory and cardiac health endpoints including asthma and heart attack (US EPA, 2006). Ozone is a strong oxidant and respiratory irritant; it can damage the surface of the lungs and the lining of the esophagus (US EPA, 2006). The same study by Shindell et al. estimates that if action is taken on the key methane measures by 2030 47,000 premature deaths could be avoided annually, saving an estimated $148 billion.
Improved air quality has many other benefits, including increased visibility, reduced infrastructure damage, reduced acid deposition, and other local welfare benefits (US EPA, 2006). In addition to these general co-benefits, methane reduction activities can deliver important localized benefits such as reduced pollution run-off, improved municipal solid waste management and wastewater collection and clean power generation (therefore contributing to the universal goal of providing “sustainable energy for all”). These are often the motivating drivers locally for methane abatement action.
Relative to other Abatement Opportunities, Methane Is among the Lowest Cost Options
Relative to other global greenhouse gas abatement opportunities, methane is among the lowest cost options. Methane is unique as a greenhouse gas because, being a combustible fuel source, it can have a monetary value. Consequently, several activities that capture methane emissions have a negative or positive, but very low economic cost when the value of the captured methane is considered.
In addition to mitigating climate change, reduced methane emissions will deliver several significant additional benefits including reduced air pollution, increased agriculture yields and improved public health.
High ambient concentrations of tropospheric ozone can also significantly

9Using Pay-for-Performance Mechanisms to Finance Methane Abatement
As highlighted by the McKinsey Global Abatement Cost Curve, landfill gas for electricity and waste recycling have the potential to be economically profitable under appropriate conditions, while livestock management practices and composting of new waste are estimated as a low-cost option (depending on scale and technology employed). Also, several activities in the oil and gas sectors, including a reduction in flaring can be economically profitable (McKinsey, 2009).
In addition, top-down academic studies have also pointed to methane for its potential to deliver some of the least-cost opportunities to reduce global greenhouse gases. Highlighted are the low abatement costs from capturing vented gas associated with oil production, fixing gas pipelines, livestock waste management, landfill gas utilization for energy, flaring and composting as well as the recovery of coal mine methane (UNEP, 2011, Smith et al., 2007, Delhotal et al., 2006).
10 APRIL 2013 | MethAne FInAnce Study GRouP RePoRt
11Using Pay-for-Performance Mechanisms to Finance Methane Abatement
II. Unlocking Established Sectors to Reduce Methane Emissions
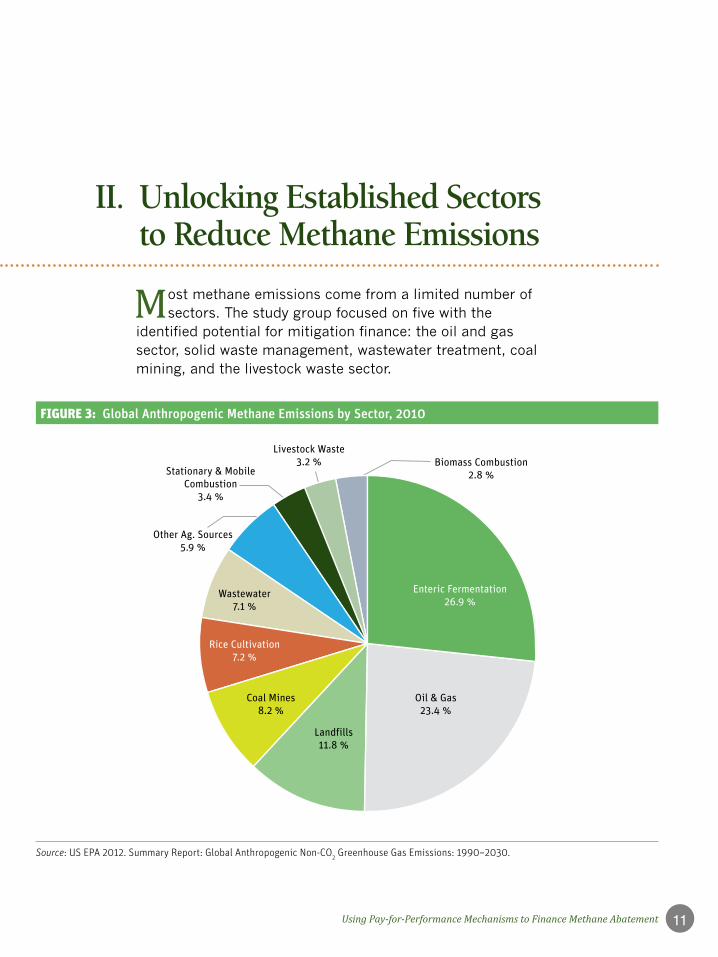
Figure 3: Global Anthropogenic Methane Emissions by Sector, 2010
Source: US EPA 2012. Summary Report: Global Anthropogenic Non-CO2 Greenhouse Gas Emissions: 1990–2030.
Enteric Fermentation26.9 %
Oil & Gas23.4 %
Landfills11.8 %
Coal Mines8.2 %
Rice Cultivation7.2 %
Wastewater7.1 %
Other Ag. Sources5.9 %
Stationary & MobileCombustion
3.4 %
Biomass Combustion2.8 %
Livestock Waste3.2 %
Most methane emissions come from a limited number of sectors. The study group focused on five with the
identified potential for mitigation finance: the oil and gas sector, solid waste management, wastewater treatment, coal mining, and the livestock waste sector.

12 APRIL 2013 | MethAne FInAnce Study GRouP RePoRt
Methane emissions can come from all stages of the natural gas value chain, including production, processing, and pipeline transport. Emissions from both leaks and deliberate releases may comprise over 4 percent of global natural gas production. Emissions in the oil sector arise from leaks in both production and processing because methane-rich natural gas deposits are often co-located with oil deposits. Meanwhile, in the waste management sector, landfills give off methane during the breakdown of organic matter. This can be reduced by either capturing the methane via installed pipes and burning it or using it for electricity, or by broader efforts to reduce the amount of organic matter entering the landfill, including recycling and composting or anaerobic digestion. Examples from EU-27 countries show that restricting untreated municipal solid waste from landfills leads to significant reduction in GHG emissions, at the same time contributing to higher resource efficiency (EEA 2011; UBA 2010).
methane, but also dramatically reduces human disease transmission. The health benefits of disease reduction are typically even larger than the benefits of greenhouse gas reductions.
Like landfills and wastewater, livestock solid wastes give off methane during the anaerobic decomposition of organic matter. Anaerobic decomposition typically occurs when the wastes are stored in liquid systems for extended periods of time. Methane is also released from coal and surrounding rock strata due to mining activities. This coal mine methane is a direct safety hazard and is thus vented to the atmosphere. Capturing and burning this methane reduces its global warming impact and the gas can also be utilized for power generation, district heating, boiler fuel, town gas, and in the case of high-quality gas, can be sold to a natural gas pipeline.
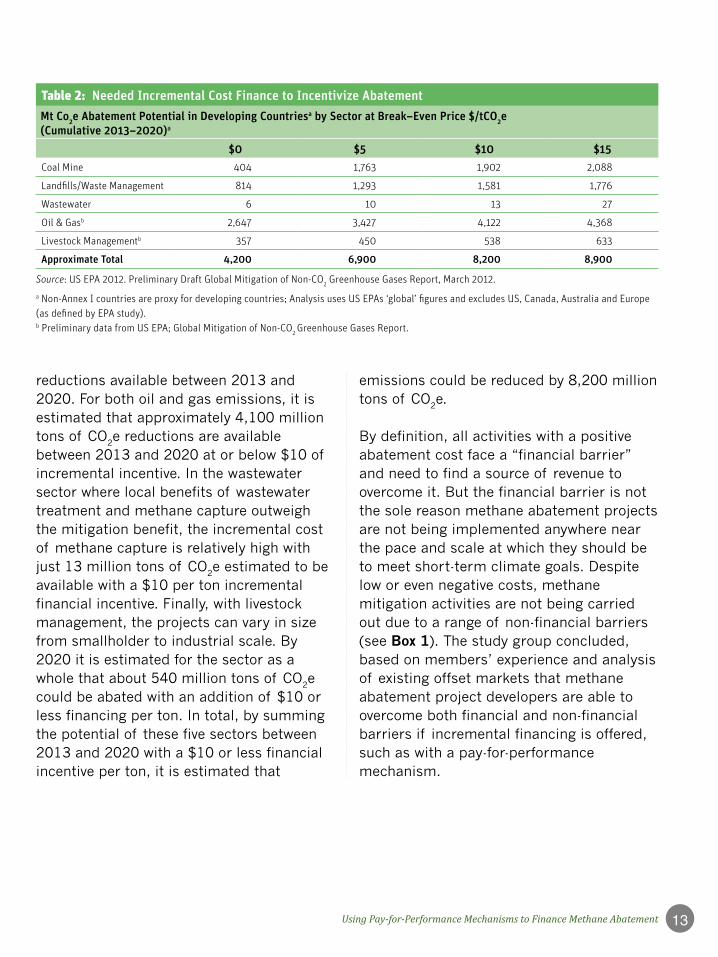
As highlighted above, a wide range of methane abatement opportunities have a low or even negative economic cost. Table 2 illustrates this by providing an estimate of the millions of tons that could be avoided in developing countries cumulatively between 2013 and 2020 given a certain economic incentive, presented as a price per ton of CO
2e. Clearly, effective and low-cost abatement measures are available in coal mine methane. There reduction technologies are well understood, and often low-cost, with 1,900 million tons of CO2e reductions possible between 2013 and 2020 if a $10 per ton or lower financial incentive is added. Options for capturing gas from landfills and for using it to produce electricity are well-tested and often low-cost, with a number of CDM projects ongoing, and an estimated 1,600 million tons of CO2e
A wide range of of methane abatement opportunities have low or negative economic cost.
Wastewater gives off methane produced during anaerobic breakdown. At centralized treatment facilities this methane can be captured and combusted. However, many areas lack centralized treatment facilities for wastewater, instead using septic systems, latrines, and open sewers, which give off methane. Replacing latrines and open sewers with centralized sewers and treatment facilities not only reduces
13Using Pay-for-Performance Mechanisms to Finance Methane Abatement
Table 2: Needed Incremental Cost Finance to Incentivize Abatement
Mt Co2e Abatement Potential in Developing Countriesa by Sector at Break–Even Price $/tCO2e (Cumulative 2013–2020)a
$0 $5 $10 $15Coal Mine 404 1,763 1,902 2,088
Landfills/Waste Management 814 1,293 1,581 1,776
Wastewater 6 10 13 27
Oil & Gasb 2,647 3,427 4,122 4,368
Livestock Managementb 357 450 538 633
Approximate Total 4,200 6,900 8,200 8,900
Source: US EPA 2012. Preliminary Draft Global Mitigation of Non-CO2 Greenhouse Gases Report, March 2012.a Non-Annex I countries are proxy for developing countries; Analysis uses US EPAs ‘global’ figures and excludes US, Canada, Australia and Europe (as defined by EPA study).b Preliminary data from US EPA; Global Mitigation of Non-CO2 Greenhouse Gases Report.
reductions available between 2013 and 2020. For both oil and gas emissions, it is estimated that approximately 4,100 million tons of CO2e reductions are available between 2013 and 2020 at or below $10 of incremental incentive. In the wastewater sector where local benefits of wastewater treatment and methane capture outweigh the mitigation benefit, the incremental cost of methane capture is relatively high with just 13 million tons of CO2e estimated to be available with a $10 per ton incremental financial incentive. Finally, with livestock management, the projects can vary in size from smallholder to industrial scale. By 2020 it is estimated for the sector as a whole that about 540 million tons of CO2e could be abated with an addition of $10 or less financing per ton. In total, by summing the potential of these five sectors between 2013 and 2020 with a $10 or less financial incentive per ton, it is estimated that
emissions could be reduced by 8,200 million tons of CO2e.
By definition, all activities with a positive abatement cost face a “financial barrier” and need to find a source of revenue to overcome it. But the financial barrier is not the sole reason methane abatement projects are not being implemented anywhere near the pace and scale at which they should be to meet short-term climate goals. Despite low or even negative costs, methane mitigation activities are not being carried out due to a range of non-financial barriers (see Box 1). The study group concluded, based on members’ experience and analysis of existing offset markets that methane abatement project developers are able to overcome both financial and non-financial barriers if incremental financing is offered, such as with a pay-for-performance mechanism.

14 APRIL 2013 | MethAne FInAnce Study GRouP RePoRt
Box 1. Overcoming Non-financial Barriers
In the agricultural sector, documented barriers include limited local bank knowledge about the technical aspects of the methane emission reduction processes. Also, local farmers are sometimes unaware of affordable methane reduction technologies and can be concerned about the scrutiny public stakeholder consultations will bring.
In the solid waste and wastewater sectors barriers include poor local or community enabling environments. Often municipal governments provide insufficient fees for the disposal of waste. Newly elected public officials have also been known to stymie the work of past administrations. With landfill gas, the project may be located far from gas demand sources or pipelines. With wastewater, working closely with the local water utility and within its policies has proven important to overcome risks that are outside the control of the methane reduction project developer.
In the oil & gas and coal mine sectors, there is a wide range of capacity among operators. Some firms lack access to capital and technology, while in other cases it is difficult to convince managers to focus on methane reducing revenue generating projects that are not related to the firm’s core business. In the pipeline sector it is documented that the contractual nature of the relationship between the owner of a gas pipeline and the owner of the gas itself can fail to provide incentives for fixing leaky pipes.

15Using Pay-for-Performance Mechanisms to Finance Methane Abatement
Results-based Financing is Receiving Growing Attention
Pay-for-performance mechanisms, also known as results-based financing (RBF), are increasingly considered and employed by
donors and governments to support development objectives and domestic policy goals. RBF was pioneered in the health sector, and has been used successfully as a form of payments for ecosystem services in Costa Rica. RBF serves as the backbone of anticipated payments for REDD+ and is increasingly being considered as a means for financing the adoption of low-carbon development pathways and GHG emissions abatement, including through the Green Climate Fund.
The defining element of RBF is that payments are made upon the delivery of pre-defined, verified results. In doing so much of the performance risk is shifted from the funder to the project implementer, which creates added incentives for these providers to succeed. Offset schemes such as the Clean Development Mechanism (CDM) of the Kyoto Protocol are forms of RBF that reward the production of a specific and quantified outcome—the reduction of greenhouse gas (GHG) emissions equivalent to one ton of CO2. The CDM has delivered significant results to date, including the registration of 6,500 projects and the issuance of 1.2 Gt of CO2e from nearly 2,100 projects, of which more than 300 are in methane sectors.
A successful RBF approach requires three main conditions be met. First, both the funder and the project implementer must possess institutional capacity to, respectively, set up and respond to an RBF incentive mechanism. Second, the project implementer must be able to access sufficient amounts of capital to undertake the project. Lastly, the funder and project implementer need the ability to monitor and verify results against which payments are made.
A number of factors impact the costs faced by project implementers under an RBF contract. These include the extent to which results being incentivized are largely under the control of project implementers, the size of the upfront investment, and the length of time between project
III. Results-Based Finance: An Attractive Approach to Public Spending
16 APRIL 2013 | MethAne FInAnce Study GRouP RePoRt
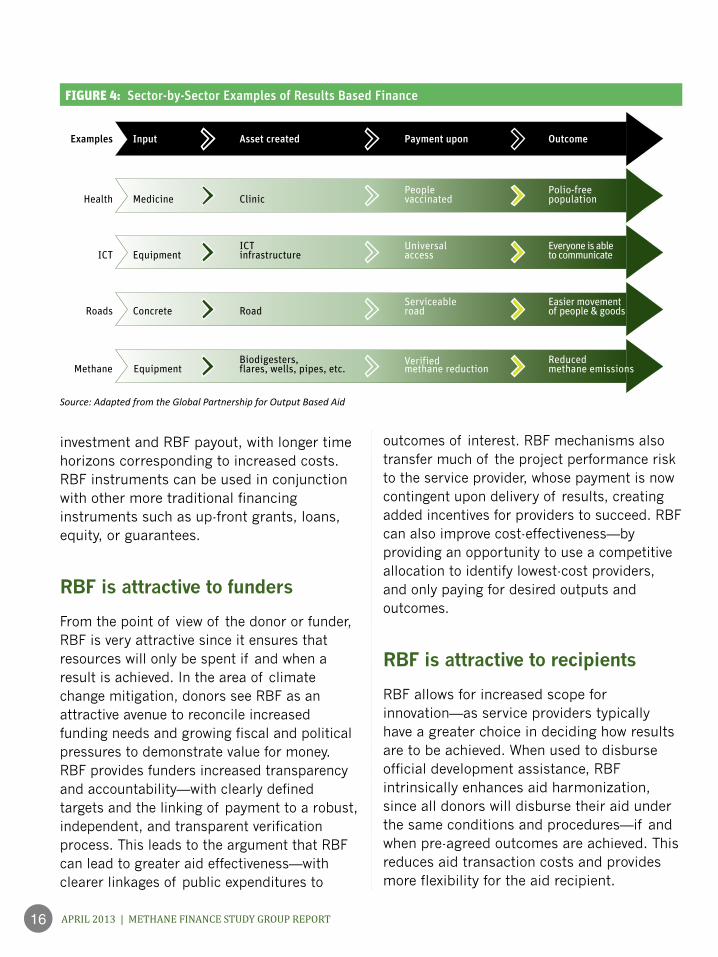
Figure 4: Sector-by-Sector Examples of Results Based Finance
Input
Medicine
Examples
Health
ICT
Roads
Methane
Equipment
Asset created
ICTinfrastructure
Clinic
Payment upon
Peoplevaccinated
Universalaccess
Outcome
Polio-freepopulation
Everyone is ableto communicate
EquipmentBiodigesters,flares, wells, pipes, etc.
Verifiedmethane reduction
Reducedmethane emissions
ConcreteServiceableroad
Easier movement of people & goodsRoad
investment and RBF payout, with longer time horizons corresponding to increased costs. RBF instruments can be used in conjunction with other more traditional financing instruments such as up-front grants, loans, equity, or guarantees.
RBF is attractive to funders
From the point of view of the donor or funder, RBF is very attractive since it ensures that resources will only be spent if and when a result is achieved. In the area of climate change mitigation, donors see RBF as an attractive avenue to reconcile increased funding needs and growing fiscal and political pressures to demonstrate value for money. RBF provides funders increased transparency and accountability—with clearly defined targets and the linking of payment to a robust, independent, and transparent verification process. This leads to the argument that RBF can lead to greater aid effectiveness—with clearer linkages of public expenditures to
outcomes of interest. RBF mechanisms also transfer much of the project performance risk to the service provider, whose payment is now contingent upon delivery of results, creating added incentives for providers to succeed. RBF can also improve cost-effectiveness—by providing an opportunity to use a competitive allocation to identify lowest-cost providers, and only paying for desired outputs and outcomes.
RBF is attractive to recipients
RBF allows for increased scope for innovation—as service providers typically have a greater choice in deciding how results are to be achieved. When used to disburse official development assistance, RBF intrinsically enhances aid harmonization, since all donors will disburse their aid under the same conditions and procedures—if and when pre-agreed outcomes are achieved. This reduces aid transaction costs and provides more flexibility for the aid recipient.
Source: Adapted from the Global Partnership for Output Based Aid

17Using Pay-for-Performance Mechanisms to Finance Methane Abatement
The Study Group considered a number of RBF instruments in the methane sector. The Group noted that providing results based finance to methane abatement projects by paying for emission reductions measured and verified in terms of CO2 equivalent is a unique opportunity to deliver quickly, and in a highly cost-efficient way, a large volume of methane reductions. The RBF instrument would take the form of a contract between a funder (such as an individual donor, a multilateral fund, or a specific window of a multilateral institution) and a project implementer (in most cases a private sector entity), whereby the funder commits, under specified conditions, to pay an agreed amount for each ton of CO2e in emission reduction achieved by the project implementer. The emission reduction would be independently verified by a third-party auditor.
This approach builds on the successful experience of over 10 years with offset mechanisms in the carbon markets. As demonstrated in this context, the revenues associated with a contract for units of CO2e reduction can provide the missing incentive for the project entity to invest in a methane mitigation activity, and help raise the needed equity and debt or overcome other barriers to implementation. In some cases, such as when the collected methane is destroyed rather than sold or used for power generation, these emission reduction payments will be the only source of income for the project. This approach takes advantage of existing carbon accounting methodologies, the large institutional architecture for monitoring, reporting and verification, as well as the transparency of the CDM (as well as other standards, for example, Verified Carbon Standard (VCS) and Climate Action Reserve (CAR)).
IV. Deliver a Quick-Win: Paying for Methane Emission Reductions as a Climate Finance Pilot
18 APRIL 2013 | MethAne FInAnce Study GRouP RePoRt
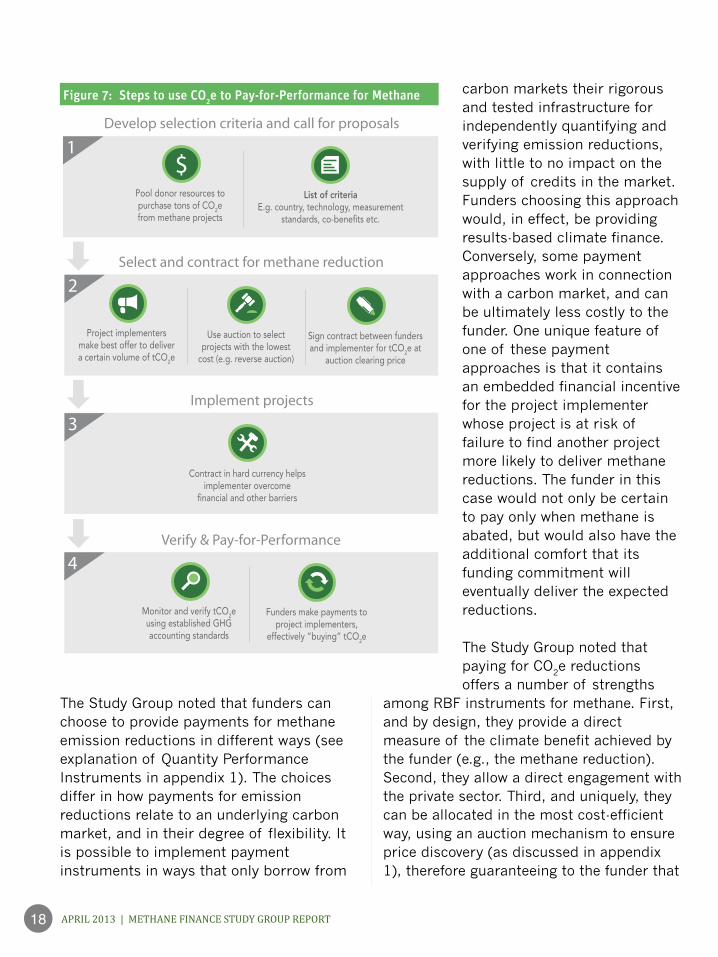
The Study Group noted that funders can choose to provide payments for methane emission reductions in different ways (see explanation of Quantity Performance Instruments in appendix 1). The choices differ in how payments for emission reductions relate to an underlying carbon market, and in their degree of flexibility. It is possible to implement payment instruments in ways that only borrow from
carbon markets their rigorous and tested infrastructure for independently quantifying and verifying emission reductions, with little to no impact on the supply of credits in the market. Funders choosing this approach would, in effect, be providing results-based climate finance. Conversely, some payment approaches work in connection with a carbon market, and can be ultimately less costly to the funder. One unique feature of one of these payment approaches is that it contains an embedded financial incentive for the project implementer whose project is at risk of failure to find another project more likely to deliver methane reductions. The funder in this case would not only be certain to pay only when methane is abated, but would also have the additional comfort that its funding commitment will eventually deliver the expected reductions.
The Study Group noted that paying for CO2e reductions offers a number of strengths
among RBF instruments for methane. First, and by design, they provide a direct measure of the climate benefit achieved by the funder (e.g., the methane reduction). Second, they allow a direct engagement with the private sector. Third, and uniquely, they can be allocated in the most cost-efficient way, using an auction mechanism to ensure price discovery (as discussed in appendix 1), therefore guaranteeing to the funder that
Figure 7: Steps to use CO2e to Pay-for-Performance for Methane
Develop selection criteria and call for proposals
Select and contract for methane reduction
Implement projects
Verify & Pay-for-Performance
$Pool donor resources to purchase tons of CO2e from methane projects
List of criteriaE.g. country, technology, measurement
standards, co-benefits etc.
Project implementers make best offer to deliver a certain volume of tCO2e
Sign contract between funders and implementer for tCO2e at
auction clearing price
Use auction to select projects with the lowest
cost (e.g. reverse auction)
Contract in hard currency helps implementer overcome
financial and other barriers
Monitor and verify tCO2e using established GHG accounting standards
Funders make payments to project implementers,
effectively “buying” tCO2e
1
2
3
4

19Using Pay-for-Performance Mechanisms to Finance Methane Abatement
the project implementer receives only the minimum amount of subsidy required. By creating a predictable revenue stream, payments for CO2e reductions can be a powerful catalyst for private investment, especially when they come from a AAA credit rated (or similar) institution or fund, and are paid in hard currency. These payments help reduce emerging market financing risks for foreign investors and project implementers and facilitate raising equity and debt finance.
A final positive feature of delivering RBF by paying for CO2e, is that by relying on existing regulatory standards it would also benefit from these standards’ pipeline of early stage projects that have been identified, but are not moving forward to be implemented because of low prices in the carbon market (or “stranded assets”). The study group noted a conservative estimate of 850 Mt CO2e of emission reductions from methane abatement projects that could immediately move forward if offered access to a buyer (see appendix 4). Funders choosing to buy CO2e reductions have the power to allocate capital to the lowest cost and low risk abatement projects (i.e., the low hanging fruit), and when used in conjunction with auctions, ensure that these projects are funded at the lowest possible cost. Meanwhile, purchasing emission reductions can also be tailored to allow funders to target certain methane reducing technologies or countries. To do
this, the purchase rules could dictate the technologies eligible for funding or the countries permitted, as funders may demonstrate preferences for project types with the most environmental or developmental co-benefits and countries where results based finance can achieve the greatest impact.
Beyond mobilizing these “stranded projects”, buying methane emission reductions could also incentivize additional (“new”) projects, where the average “time-to-market”in the case of the CDM has been found to be about 1.8 years to achieve registration. The Study Group therefore noted that a purchase scheme has the potential to quickly start

20 APRIL 2013 | MethAne FInAnce Study GRouP RePoRt
Manure treatment facility
generating methane emission reductions and disbursing funds.
The Study Group encourages all interested donors to consider this innovative and highly attractive approach which combines immediate impact and maximum cost-effectiveness. Various implementation options can be envisaged. A fund could be established within an international financial institution, allowing interested funders to pool resources for maximum efficiency. A number of bilateral donors have developed
deep in-house expertise on methane mitigation and carbon offsets and could implement such mechanisms rapidly. A sub-theme of the Green Climate Fund private sector facility may also be devoted to these approaches. Regardless of the institutional arrangement, a pilot targeting a sub-set of the 8,200 Mt available at $10 per ton or less between 2013–20, could be selected on the basis of co-benefits or regional preferences, and start delivering methane reductions in as little as 1 to 2 years.

21Using Pay-for-Performance Mechanisms to Finance Methane Abatement
Multilateral Development Banks
the Study Group highlighted the potential for results based finance to be delivered through Multilateral Development Banks.
While the size of Official Development Assistance (ODA)—about $134 billion (OECD, 2011)—is small in comparison to global foreign direct investment of $1.6 trillion (World Bank, 2011), or local private investment, multilateral institutions, by incorporating results-based financing principles can have a demonstration and leveraging effect, proving RBF’s merit and impact.
In 2012 the World Bank approved a new lending instrument, the Program-for-Results (PforR), which aims to strengthen government programs by working with a program’s own systems and linking the disbursement of funds directly to the delivery of results. Disbursements are directly linked to the achievement of tangible and verifiable results. Disbursement-Linked Indicators, or DLIs, are used to provide governments with incentives to achieve critical program milestones and improve program performance. DLIs can be outcomes, outputs, intermediate outcomes, or process indicators that are key actions needed to address specific risks or constraints in order to achieve development objectives. The first operations to use this new approach were in Morocco (education), Nepal (transport), Tanzania (urban), Vietnam (water and sanitation) and Uruguay (transport). Early results indicate that the overall engagement and discussions on results and DLIs have fundamentally changed the dialogue between recipient countries and the World Bank.
The Asian Development Bank (ADB) is pursing piloting of results-based lending (RBL) for programs, with the acceptance of a policy paper on the topic approved by its Board in March 2013. According to the paper, “the program will support government-owned sector programs, and link disbursements directly to the achievement of
V. Scaling-up Methane Mitigation through Pay-for-Performance
22 APRIL 2013 | MethAne FInAnce Study GRouP RePoRt
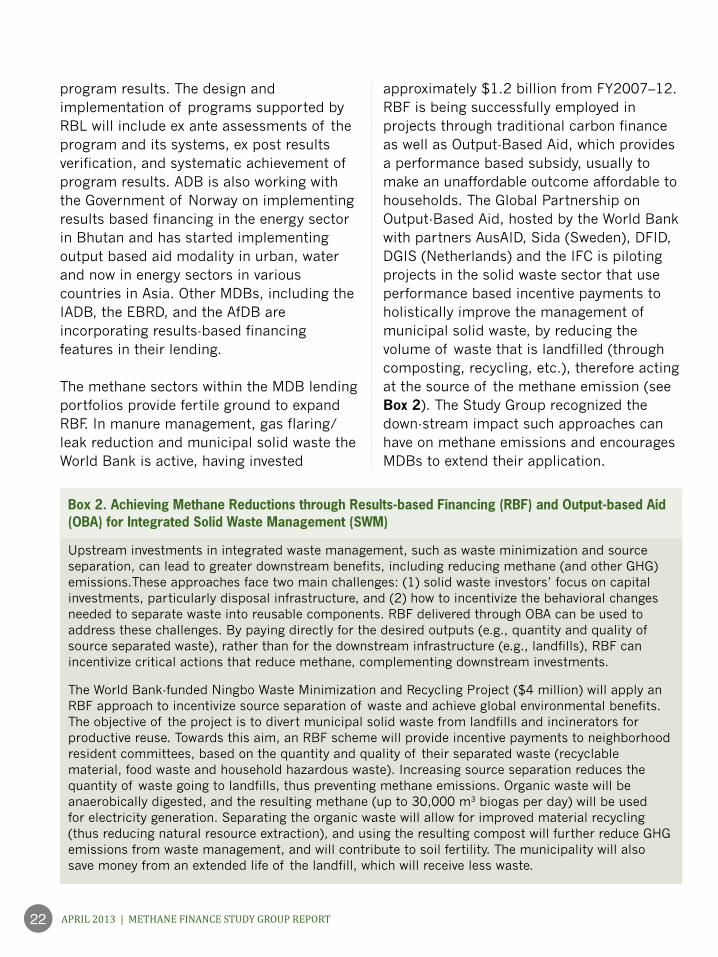
Box 2. Achieving Methane Reductions through Results-based Financing (RBF) and Output-based Aid (OBA) for Integrated Solid Waste Management (SWM)
Upstream investments in integrated waste management, such as waste minimization and source separation, can lead to greater downstream benefits, including reducing methane (and other GHG) emissions.These approaches face two main challenges: (1) solid waste investors’ focus on capital investments, particularly disposal infrastructure, and (2) how to incentivize the behavioral changes needed to separate waste into reusable components. RBF delivered through OBA can be used to address these challenges. By paying directly for the desired outputs (e.g., quantity and quality of source separated waste), rather than for the downstream infrastructure (e.g., landfills), RBF can incentivize critical actions that reduce methane, complementing downstream investments.
The World Bank-funded Ningbo Waste Minimization and Recycling Project ($4 million) will apply an RBF approach to incentivize source separation of waste and achieve global environmental benefits. The objective of the project is to divert municipal solid waste from landfills and incinerators for productive reuse. Towards this aim, an RBF scheme will provide incentive payments to neighborhood resident committees, based on the quantity and quality of their separated waste (recyclable material, food waste and household hazardous waste). Increasing source separation reduces the quantity of waste going to landfills, thus preventing methane emissions. Organic waste will be anaerobically digested, and the resulting methane (up to 30,000 m3 biogas per day) will be used for electricity generation. Separating the organic waste will allow for improved material recycling (thus reducing natural resource extraction), and using the resulting compost will further reduce GHG emissions from waste management, and will contribute to soil fertility. The municipality will also save money from an extended life of the landfill, which will receive less waste.
program results. The design and implementation of programs supported by RBL will include ex ante assessments of the program and its systems, ex post results verification, and systematic achievement of program results. ADB is also working with the Government of Norway on implementing results based financing in the energy sector in Bhutan and has started implementing output based aid modality in urban, water and now in energy sectors in various countries in Asia. Other MDBs, including the IADB, the EBRD, and the AfDB are incorporating results-based financing features in their lending.
The methane sectors within the MDB lending portfolios provide fertile ground to expand RBF. In manure management, gas flaring/leak reduction and municipal solid waste the World Bank is active, having invested
approximately $1.2 billion from FY2007–12. RBF is being successfully employed in projects through traditional carbon finance as well as Output-Based Aid, which provides a performance based subsidy, usually to make an unaffordable outcome affordable to households. The Global Partnership on Output-Based Aid, hosted by the World Bank with partners AusAID, Sida (Sweden), DFID, DGIS (Netherlands) and the IFC is piloting projects in the solid waste sector that use performance based incentive payments to holistically improve the management of municipal solid waste, by reducing the volume of waste that is landfilled (through composting, recycling, etc.), therefore acting at the source of the methane emission (see Box 2). The Study Group recognized the down-stream impact such approaches can have on methane emissions and encourages MDBs to extend their application.
23Using Pay-for-Performance Mechanisms to Finance Methane Abatement
RBF and NAMAs
The Study Group also considered another promising opportunity for using RBF in the methane sector—to finance countries’ Nationally Appropriate Mitigation Actions (NAMAs), where RBF could be structured to make payments against a variety of outcomes, including implementation of policy actions made by governments.
NAMAs were introduced at the United Nations Bali Climate Change Conference in 2007. While there is no unique or agreed definition of a NAMA, the concept focuses on the voluntary implementation of GHG reduction activities in developing countries that are not subject to mitigation commitments. The Cancun Agreements (2010) recognize two kinds of NAMAs—those developed with domestic resources (“unilateral NAMAs”) and those requesting international support (“supported NAMAs”). NAMAs can also comprise elements of technology transfer or capacity building. Supported NAMAs are expected to receive financing from bilateral or multilateral donors, or through facilities such as the Green Climate Fund or the Global Environment Facility. Such approaches are also being considered and discussed in the context of future carbon market mechanisms under the Untied Nations Framework Convention on Climate Change (UNFCCC), and some countries have proposed ‘credited NAMAs’ which are financed through the generation and sale of carbon credits.
While a NAMA may encompass a specific project or measure to reduce emissions in the short-term, it may also include policies, strategies and research programs that lead to emission reductions in the long-term. Many developing countries are now developing NAMAs based on their national development plans,
Sector and Policy Level Action Policy

24 APRIL 2013 | MethAne FInAnce Study GRouP RePoRt
where GHG emission reductions are considered in the context of broader strategic, long-term sustainable development benefits and aim at catalyzing transformational change towards a low carbon society. While momentum on NAMAs is accelerating, with many international activities and proposals underway, few NAMAs have reached the implementation stage. International support currently focuses on creating ‘readiness’ by building capacity and raising awareness, by setting up processes and institutions, and by developing NAMA proposals.
As of March 2013, among the NAMAs that are seeking international finance, technology or capacity building support, and that indicate specific actions, nine were targeting the waste sector (Ecofys 2013). Examples include an organic waste NAMA in Tunisia which envisages a coordinated package of measures to significantly reduce methane emissions from agricultural waste, market waste, waste products from food production, and sewage sludge (Wuppertal Institute, 2011). NAMAs offer the possibility to work beyond the level of individual projects and reward government regulations or other policy actions that restrict methane emissions.
RBF has a role to play together with other financing instruments to support policy-level or other broad approaches to methane mitigation within NAMAs. RBF could be used to disburse ODA or climate finance to the host government (in the case of supported NAMAs), but also as a financing instrument within the NAMA itself, to support methane reducing activities or investments
implemented inside the country. Another form of RBF support to a NAMA would occur in the case where its implementation would lead to the generation of carbon credits to be sold in carbon markets. While using RBF to support NAMAs offers wide flexibility in choosing the outcomes against which payments will be made, significant conceptual work will be required to develop methodologies and protocols for evaluating the resulting emission reductions. Piloting the actual implementation activities (to confirm feasibility at scale) should be prioritized.
25Using Pay-for-Performance Mechanisms to Finance Methane Abatement
ReferencesDelhotal, K. C., de la Chesnaye, F. C., Gardiner, A., Bates, J. & Sankovski, A. 2006. “Mitigation of methane and nitrous oxide emissions from waste, energy and industry,” The Energy Journal. Special Issue: Multi-Greenhouse Gas Mitigation and Climate Policy.
EEA (European Environment Agency), 2011. “Waste opportunities Past and future climate benefits from better municipal waste management in Europe” http://www.eea.europa.eu/publications/waste-opportunities-84-past-and
Ecofys. 2013. NAMA Database. See details at: http://namadatabase.org/index.php/Main_Page. Accessed March 2013.
Ghosh, Arunabha, Benito Muller, William Pizer, and Gernot Wagner, 2012. “Mobilizing the Private Sector, Quantity-Performance instruments for Public Climate Funds”, The Oxford Institute for Energy Studies.
McKinsey & Company 2009. Pathways to a Low Carbon Economy: Version 2 of the Global Greenhouse Gas Abatement Cost Curve. McKinsey & Company.
Methane Blue Ribbon Panel, 2009. “A Fast-Action Plan for Methane Abatement”.
Shindell et al., 2012. “Simultaneously Mitigating Near-term Climate Change and Improving Human Health and Food Security,” Science, 335, pg. 183.
Smith, P., Martino, D., Cai, Z., Gwary, D., Janzen, H., Kumar, P., McCarl, B., Ogle, S., O’Mara, F., Rice, C., Scholes, B. & Sirotenko, O., 2007. “Agriculture”. In Metz, B., Davidson, O. R., Bosch, P. R., Dave, R. & Meyer, L. A. eds. Climate Change 2007: Mitigation.
Contribution of Working Group III to the Fourth Assessment Report of the Intergovernmental Panel on Climate Change, 2007. Cambridge, UK and New York, NY: Cambridge University Press.
UBA, 2010. Climate Protection Potential in the Waste Management Sector – Examples: Municipal Waste and Waste Wood, http://www.uba.de/uba-info-medien-e/4049.html.
UNEP, 2010. The Emissions Gap Report. Nairobi, Kenya: United Nations Environment Programme (UNEP).
UNEP, 2011a. Near-term Climate Protection and Clean Air Benefits: Actions for Controlling Short-Lived Climate Forcers. Nairobi, Kenya: United Nations Environment Programme (UNEP).
UNEP, 2011b. Bridging the Emissions Gap, A UNEP Synthesis Report. Nairobi, Kenya: United Nations Environment Programme (UNEP).
US EPA, 2006. Air Quality Criteria for Ozone and Related Photochemical Oxidants. U.S. Environmental Protection Agency, Washington, DC, EPA/600/R-05/004aF-cF, 2006.
US EPA, 2012. Summary Report: Global Anthropogenic Non-CO2 Greenhouse Gas Emissions: 1990–2030, U.S. EPA Report EPA 430-S-12–002. Washington, DC: USEPA Office of Atmospheric Programs.
Wuppertal Institute for Climate, Environment and Energy, 2011. Newsletter of the Product “Joint Implementation & Clean Development Mechanism. JIKO Info 01/11.

1
Appendix 1: Background on Results-Based Financing
Overview Results-based financing1 (RBF) is a financing approach increasingly employed to support development objectives and domestic policy goals. The defining element of RBF is that payments are made upon the delivery of pre-defined, verified results. RBF was pioneered in the health sector, but is increasingly being considered as a means for financing the adoption of low-carbon development pathways and GHG emissions abatement, including through the Green Climate Fund.2 Potential benefits of RBF Compared with traditional ex-ante public sector funding, which typically finances inputs at the front end of the project cycle (i.e., capital investments, service contracts), RBF rewards production of desired outputs and outcomes. In doing so, much of the performance risk is shifted from funders to service providers, whose payment is now contingent upon delivery of results. Making payment contingent upon service delivery creates added incentives for service providers to succeed. In the context of aid and concessional finance, RBF offers several additional attractions:3
Increased transparency and accountability – with clearly defined targets and the linking of payment to a robust, independent, and transparent verification process.
Increased scope for innovation – as service providers will typically have greater choice in deciding how results are to be achieved.
Cost-effectiveness – by providing opportunity to use a competitive allocation to identify lowest-cost providers, and only paying for desired outputs and outcomes.
A stronger argument for aid-effectiveness – with clearer linkages of public expenditures to outcomes of interest.
Transferring performance risk from funders to service providers does not eliminate the need to pay for those risks. Agents operating under RBF contracts will face additional costs in terms of higher capital costs and/or upfront investment requirements that will be reflected in higher fees to provide those services. Economic theory suggests that contracting for outputs (emission reductions) is typically more economically efficient than contracting for inputs (projects which could later result in emission
1 Many terms are currently used to describe funding approaches where payments are made upon the
verified delivery of pre-defined results. This appendix uses “results-based financing” (RBF) as an umbrella
term to encompass the full range of funding instruments operating in this way. Other terms denoting RBF-
like approaches in general and more tailored applications are detailed in the section on Terminology. 2 The Governing Instrument for the Green Climate Fund, approved by the Conference of the Parties to the
UNFCCC in December 2011 states that “The Fund may employ results-based financing approaches,
including, in particular for incentivizing mitigation actions, payment for verified results, where
appropriate.” See: http://unfccc.int/resource/docs/2011/cop17/eng/09a01.pdf 3 Mumssen, Y., Johannes, L., Kumar, G. (2010). Output-Based Aid – Lessons Learned and Best Practices.
World Bank, Washington DC.
2
reductions).4 This is because the project developer has a greater incentive to deliver performance under output-based contracting. This incentive can result in greater effort, novel technological innovation, etc. This is particularly true when inputs are not a good proxy for outputs, or when continued effort and investment are required to produce outputs from the inputs. Criteria for using RBF The ability to employ an RBF approach is dependent upon three primary preconditions:5
The ability to monitor and verify results against which payments are made.
The ability of agents to access sufficient capital to undertake projects.
Both principal and agent must possess institutional capacity to, respectively, set up and respond to an RBF incentive mechanism.
Beyond these preconditions, a number of factors serve to increase costs faced by agents under an RBF contract, and therefore factor into any decision on whether an RBF approach is appropriate. These include:
The extent to which results being incentivized are largely under the control of agents. Agents will demand higher premiums to the degree that outside risks to project success are present.
The size of the upfront investment required by agents.
The length of time between project investment and RBF payout, with longer time horizons corresponding to increased costs to agents.
Key Design Elements RBF instruments can be designed to target different sectors, incentivize a range of private and public sector actors, and be distributed in various ways. Below are three key elements in the design of RBF instruments for climate mitigation: 1. Eligibility for RBF – The first issue to consider in designing any RBF instrument is who should
be eligible to receive an RBF payment. While maximizing cost-effectiveness entails limiting restrictions on participation to capture as much low-cost abatement as possible, such arrangements may not achieve a desired balance in funding flows. The Clean Development Mechanism (CDM), for example, has been criticized for a lack of balance, with more than 60% of all credits arising from a single host country.6 It may therefore be desirable to allocate funds in part by region or country. Eligibility requirements can also facilitate targeting of instruments to specific sectors, or to projects that provide co-benefits. Moreover, in addition to directly incentivizing project developers, potentially RBF instruments can help incentivize sovereign countries, or having RBF instruments administered by national entities.
4 Maskin, E.S. and Riley, J.G. (1985). Input versus output incentive schemes. Journal of Public Economics
28:1, pp 1-23 5 Vivid Economics (2012). An operational guide for Results Based Financing approaches. Draft report
prepared for ESMAP. 6 See http://cdm.unfccc.int/Statistics/Public/files/201212/cers_iss_byHost.pdf
3
2. Allocation method – The way in which contracts are awarded is a key step in achieving cost-effectiveness and meeting transparency and equitability objectives. Typically this can be most easily facilitated through the use of a competitive auction. Two variants are frequently proposed:
Reverse auction – Venders who meet eligibility requirements offer to sell emission reductions, and those with the lowest prices win contracts. While venders do not pay anything to win contracts, contracts may include penalties for non-delivery of emission reductions (see below).
Forward auction – Funders offer contracts to purchase emission reductions at a fixed price and venders bid to buy these contracts. Unlike reverse auctions, contracts awarded through forward auctions have monetary value.
Auctions accomplish both pricing and the allocation of contracts in one step. Other non-competitive allocations are possible, where, for example, pricing could be set by committee or on a simple first-come first-serve basis. Such approaches are unlikely to be as transparent or as cost-effective as competitive auctions.7
3. MRV – An important component in any RBF scheme is the process used for monitoring, reporting and verification of results. Most often a trade-off will exist between the desire for thoroughness, which is costly, and the desire for speed and predictability.8 There is also the question of who pays for verification.
Amount of RBF Funding – Funders of RBF would have to supply resources on a sufficient scale to garner the interest of project developers and garner the interest of enough different developers to have a competitive marketplace. The Study Group considered that a fund of $100 million could be sufficient to motivate project developers to learn the rules of the RBF system and participate. That would support approximately 35 average sized methane CDM projects.9 Other considerations in the design of RBF schemes relevant to methane abatement include whether the scheme is intended to work with existing carbon markets. Linking RBF instruments to markets can help catalyze the supply of low-cost abatement – potentially freeing-up scarce public funds for other uses if private sector funds cover part or all of the cost of the purchased reductions. If, however, the intent is to maximize environmental outcomes, then funders should prefer that the resulting emission reductions do not enter compliance markets, where they would be used to offset emissions. Instead, funders will want to purchase and retire resulting emissions reductions regardless of whether the RBF instrument links with any carbon market. Finally, while RBF schemes transfer much of the performance risk from funders to vendors, non-performance is not without cost to funders. To be effective at incentivizing abatement, adequate public funds must be set aside to cover commitments. Thus, funders may wish to include penalties for non-performance in contracts, or requirements for insurance or the posting
7 Ghosh, A., Müller, B., Pizer, W., Wagner, G. (2012). Mobilizing the Private Sector: Quantity-
Performance Instruments for Public Climate Funds. Oxford Energy and Environment Brief. 8 Ibid.
9 For comparison, the U.S. D.O.J. typically considers a market un-concentrated if it has 10 or more equally
sized firms, and 10 bidders are typically sufficient to ensure competitive bidding in auctions.
4
of performance bonds alongside other eligibility criteria. Such measures will likewise increase costs to venders, and possibly reduce or deter participation.
Terminology and Existing RBF Schemes There is no universally agreed nomenclature for aid and public finance mechanisms that involve payment upon pre-defined, verified results.10 Many terms are currently used to denote what are similar or identical concepts. Here we provide a brief guide to the results-based financing universe, beginning with largely synonymous umbrella terms covering RBF mechanisms in general, followed by descriptions of more tailored RBF mechanisms. Frequently-used umbrella terms for results-based financing approaches:
Results-Based Financing (RBF) – the umbrella term used here, by the World Bank’s Results-Based Financing for Health portal, and elsewhere to denote all aid and public finance mechanisms where payment is made on the delivery of pre-defined, verified results. A narrower definition for RBF is made by the UK’s Department for International Development (DFID). DFID defines RBF as a results-based funding arrangement between a funder and a service provider, and not between a donor and recipient government. The latter is defined by DFID as Results-Based Aid (see below).
Payment by Results (PBR) – umbrella term used by the UK’s Department for International Development and the Energy Sector Management Assistance Program11 to refer to all results-based funding mechanisms.
Other less common umbrella terms for RBF that do not introduce any additional distinctions include Pay for Performance (P4P); Performance-Based Payment; Performance-Based Incentives.12 More tailored RBF mechanisms include:
Advance Market Commitments (AMCs)13 – RBF mechanisms that increase the size and certainty of markets by creating demand for services or products. AMCs encompass a variety of well-established interventions including feed-in tariffs and renewables obligations. The term was first used to describe a policy aimed at promoting development and the availability of vaccines for diseases prevalent in the developing world.
Cash-On-Delivery Aid (COD)14 – an RBF aid delivery mechanism proposed by the Center for Global Development. It involves payments to recipient governments after measurable performance, and only to the degree of results achieved. It’s also distinguished by the
10
Pearson, M. (2011). Results based aid and results based financing: What are they? Have they delivered
results? HLSP Institute. 11
ESMAP is a global knowledge and technical assistance program administered by the World Bank with a
mission to support sustainable energy solutions for poverty reduction and economic growth. 12
Musgrove, P. (2011) Financial and Other Rewards for Good Performance or Results: A Guided Tour of
Concepts and Terms and a Short Glossary. World Bank Group, Results Based Financing For Health brief. 13
DFID (2009). Advance Market Commitments for low-carbon development: an economic assessment.
Vivid Economics final report. 14
Birdsall, N., Mahgoub, A., Savedoff, W. Cash on Delivery: A New Approach to Foreign Aid. Center for
Global Development Brief.

5
maximal degree of autonomy for recipient governments in deciding how to generate and deliver results.
Conditional Cash Transfers (CCT) – term for demand-side RBF programs where cash payments are made directly to program beneficiaries rather than to agents delivering services. Results incentivized are typically enrollment in programs (i.e., school enrollment) or consumption of services (i.e., vaccination).
Output-Based Aid (OBA) – an RBF mechanism typically used to deliver basic infrastructure and social services to the poor. Works by providing a performance-based subsidy to cover cost of service, payable on achievement of measurable results. Although OBA is aid-like, funds may flow directly to service providers with national governments providing only approval or coordination. Box 2 discusses a Global Partnership on Output-Based Aid program focusing on landfill waste.
Output-Based Disbursement (OBD) – similar to OBA except that it targets efficiencies in existing services and payments pass through federal governments.15
Performance-Based Contracting – A form of RBF whereby a portion of contracted compensation is based on performance.
Quantity-Performance (QP) Instruments – term used to reference RBF instruments that incentivize outputs that can be assessed in terms of equivalent measured quantities, such as tons of CO2e emissions, kWh, or hectares.16
Results-Based Aid (RBA) – term used by UK’s DFID to define RBF mechanisms involving payments from funders to partner governments.
A number of these various RBF instruments are suitable for incentivizing methane abatement. For instance, OBA can be used to support waste management practices that reduce methane emissions (see Box 2). The Study Group did not discuss extensively these instruments, their respective strengths and weaknesses and suitability to specific methane emitting sectors, but chose to focus on QP Instruments (QPIs). Indeed, methane emissions and a range of abatement activities clearly meet the requirements of Quantity-Performance Instruments in that emissions are well-defined and measureable, and methodologies exist for monitoring, reporting and verification of results. Methane-reducing activities are also typically implemented by the private sector (waste management company, large farms, oil and gas companies, etc.), and QPIs can be set up to be directly accessed by private sector actors. Building on the experience with the Clean Development Mechanism, QPIs can also be set up very quickly. Lastly, QPIs are also attractive due to the possibility to use cost-efficient allocation mechanisms. Less straightforward are questions over how to design and administer such instruments, which are looked at in the following section.
QP Instruments for Driving Emissions Reductions Quantity-Performance Instruments (QPI) are RBF instruments that incentivize outputs that can be assessed in terms of equivalent measured quantities, such as tons of CO2e emissions (as would be the case in the context of methane), kWh, or hectares. Concretely, a QPI would take the form of a contract between a funder (such as an individual donor, a multilateral fund, or a specific window of a multilateral institution) and a private sector entity, whereby the funder commits under certain conditions to pay an agreed amount for each ton of CO2e in emission
15
Saltiel, G., and Mandri-Perrott, C. (2008). Output-Based Disbursements in Mexico: Transforming the
Water Sector in Guanajuato. GPOBA Approaches, Note Number 20. 16
Ibid (6).
6
reductions achieved by the private sector entity, as independently verified by a third-party auditor. A QPI scheme can be operationalized using tailored instruments that set out rules for eligibility, how contracts will be allocated, results verified, and so on. Three QP instruments often featured in discussions over climate finance are described here in some detail.17 Direct Purchase As the name implies, this QP instrument is a contracted commitment by a fund to directly purchase verified emissions reductions at a fixed price. The price of emissions reductions and the awarding of contracts could be accomplished in a number of ways. One cost-effective way is through a reverse auction. In this approach, venders of emissions reductions bid on the amount and price of reductions they are willing to supply. The fund would then award contracts to the lowest-priced bidders.18 This QP instrument does not presuppose the existence of any carbon market. Top-Up Instrument The top-up instrument is designed to work with emissions markets. It seeks to bolster the number of emission reductions delivered to market by providing suppliers with both a level of price certainty and potentially higher revenue than the prevailing market price. The instrument is a guarantee by the funder to pay the difference between a fixed price and the market price when reductions are sold to market – to ‘top-up’ the revenue generated by the sale of emission reductions to private market buyers. If the prevailing market price exceeds the top-up instrument’s contracted price, the funder pays nothing and the contract ends. Unlike with direct purchase instruments, the funder never receives the emission reductions, but rather facilitates the expanded delivery of reductions to private market buyers. As with the direct purchase instrument, determining the top-up price (price floor) and awarding of contracts can be achieved in several ways. One approach, similar to that proposed for the Prototype Methane Finance Facility,19 would be for a committee of experts to set a price floor and then award contracts on a first-come, first-serve basis, until resources are expended.20 Another more cost-effective approach would have the price floor determined and contracts awarded through a reverse auction. Tradable Put Options Combining some features of both direct purchase and top-up instruments are tradable put options. Here the QP instrument is a standardized contract that gives the holder the right to sell a specified volume of certified emission reductions at a fixed price (the strike price) to the funder on or before a certain date21. If, at the time emission reductions are ready to be sold the
17
Ibid (6). 18
Edwards, Rupert (2010). Advance Market Commitments/Emission Reduction Underwriting Mechanisms
for climate change finance. Climate Change Capital working paper, London UK. 19
Methane Blue Ribbon Panel (2009). A Fast Action Plan for Methane Abatement. Policy paper. 20
The proposed PMFF is intended to catalyze the CDM market and reduce the risk of non-delivery for
methane projects already in the CDM pipeline. Because PMFF funds are only available to developers of
CDM-approved projects, much of the due diligence is achieved through the CDM Executive Board. Top-up
instruments not-linked to CDM markets could address performance risks in other ways, by requiring
bidders to post performance bonds or pay a penalty in case of non-performance (see Design section above). 21
Pizer, William A. (2011). Seeding the market: Auctioned Put Options for Certified Emissions Reductions.
Nicholas Institute Policy Brief, Duke University.
7
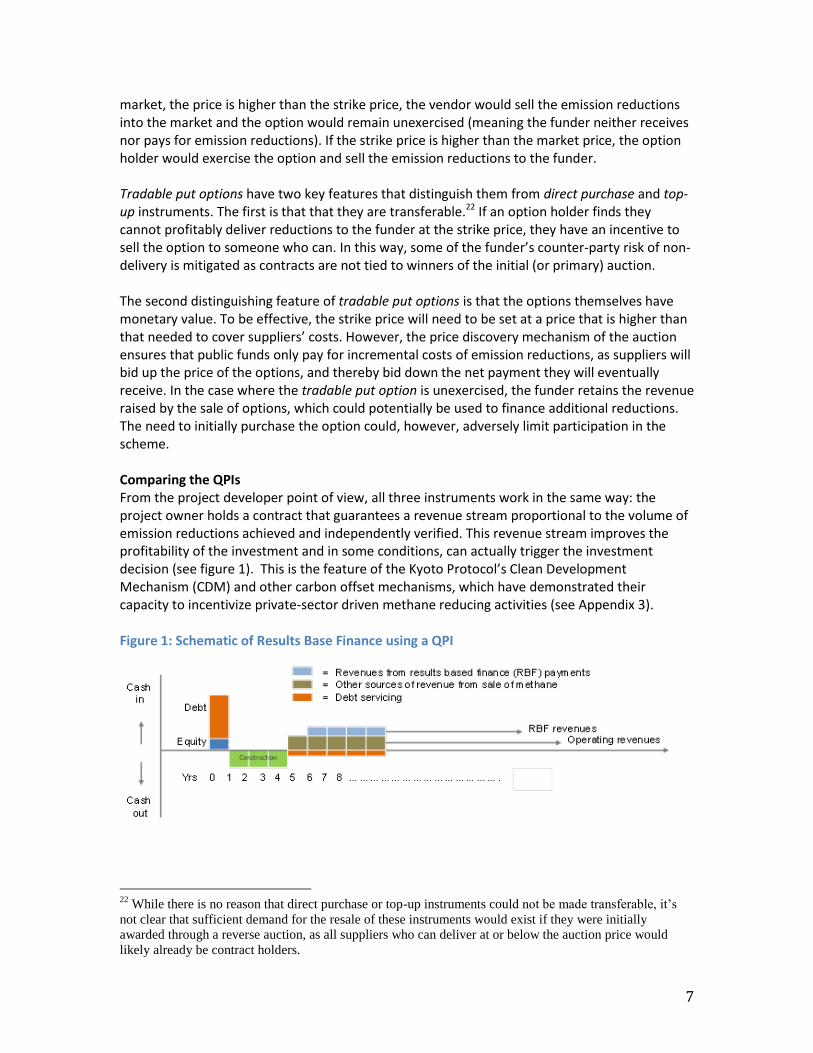
market, the price is higher than the strike price, the vendor would sell the emission reductions into the market and the option would remain unexercised (meaning the funder neither receives nor pays for emission reductions). If the strike price is higher than the market price, the option holder would exercise the option and sell the emission reductions to the funder. Tradable put options have two key features that distinguish them from direct purchase and top-up instruments. The first is that that they are transferable.22 If an option holder finds they cannot profitably deliver reductions to the funder at the strike price, they have an incentive to sell the option to someone who can. In this way, some of the funder’s counter-party risk of non-delivery is mitigated as contracts are not tied to winners of the initial (or primary) auction. The second distinguishing feature of tradable put options is that the options themselves have monetary value. To be effective, the strike price will need to be set at a price that is higher than that needed to cover suppliers’ costs. However, the price discovery mechanism of the auction ensures that public funds only pay for incremental costs of emission reductions, as suppliers will bid up the price of the options, and thereby bid down the net payment they will eventually receive. In the case where the tradable put option is unexercised, the funder retains the revenue raised by the sale of options, which could potentially be used to finance additional reductions. The need to initially purchase the option could, however, adversely limit participation in the scheme. Comparing the QPIs From the project developer point of view, all three instruments work in the same way: the project owner holds a contract that guarantees a revenue stream proportional to the volume of emission reductions achieved and independently verified. This revenue stream improves the profitability of the investment and in some conditions, can actually trigger the investment decision (see figure 1). This is the feature of the Kyoto Protocol’s Clean Development Mechanism (CDM) and other carbon offset mechanisms, which have demonstrated their capacity to incentivize private-sector driven methane reducing activities (see Appendix 3). Figure 1: Schematic of Results Base Finance using a QPI
22
While there is no reason that direct purchase or top-up instruments could not be made transferable, it’s
not clear that sufficient demand for the resale of these instruments would exist if they were initially
awarded through a reverse auction, as all suppliers who can deliver at or below the auction price would
likely already be contract holders.

8
These instruments also transfer downside carbon price risk from the project developer to the funder – if a world carbon price decreases, the project developer can still be paid. Direct purchase agreements can also transfer upside carbon price risk – if the carbon price rises, the amount the developer makes selling their reductions may not increase. If the project developers are much smaller and more financially risk averse than the funders, then this transfer also increases efficiency. If a risk is not controllable, the less risk-averse party will be better situated to bear it.23 QP Instruments Illustrated through Examples The three QP instruments are perhaps best explained through the use of a stylized example. Table 1 shows outcomes using the three QP instruments under two different market scenarios: one where the market price of CERs is $5/ton and the other where the market price of CERs is $15/ton. Assuming venders hold contracts with an identical selling, or strike price, of $10/ton, the outcomes are shown accordingly.
Table 1: QP instrument outcomes under different market prices
First Crediting Period – 10,000 CERs for sale and market price is $5/ton
Second Crediting Period – 10,000 CERs for sale and market price is $15/ton
Fund Pays
Vender Receives
Credits Delivered
Fund Pays Vender
Receives Credits
Delivered
Direct Purchase with $10 contract price
$100,000 $100,000 To the fund $100,000 $100,000 To the fund
Top-up Instrument with $10 price floor
$50,000 $100,000 To market $0 $150,000 To market
Put Option with $10 strike price*
$100,000 $100,000 To the fund $0 $150,000 To market
Table 1 is provided for illustrative purposes and not as a guide for evaluating which of the QP instruments is to be favored. As discussed in the design section, the choice between instruments depends upon many things, including whether instruments are intended to support and work alongside existing markets, and whether performance risk is best addressed through the use of transferable instruments (i.e., a put option) or other measures. Also, regardless of where credits are initially delivered, a funder could always choose to repurchase and retire credits to ensure maximum environmental outcomes. Such repurchase could result in greater costs if the price is market price is higher than the original option strike price.
23
This is a common economic result. See any microeconomics textbook, e.g. Mas-Colell, A., Whinston,
M.D., and Green, J.R. (1995) Microeconomic Theory. Oxford University Press, New York, New York,
Chapter 6: Choice under uncertainty
9
One issue of QPI design is the scope of the instruments. The marginal cost of reducing emissions is likely to vary widely across project technologies and countries. If policymakers wish to target specific technologies or countries because they have particularly desirable co-benefits, or to complement other efforts, QPIs could be restricted to only those technologies or countries. However, this would inherently result in economic inefficiency in abatement because marginal costs would vary. Further, restricting QPIs would shrink the effective market size and introduce market power concerns if few venders specialize in the particular technology or country.
Achieving price discovery – allocating the QPI via auctions Auctioning QPI instruments offers funders two major advantages: efficiency of initial allocation and price discovery. The nature of auctioning means that the bidders with the lowest expected cost of producing emission reductions will win. This would allow the funders to secure the greatest number of emission reductions in a cost-efficient manner. Using auctions also means that the funder does not need to know the precise cost of emission reductions a priori. Instead bidders will bid based on their projected costs. This allows the funder to learn about the costs directly. In other words, a donor using a QPI allocated via auction not only is certain that its resources are only spent when emission reductions are achieved, but the funder is also guaranteed that it is spending the least possible amount of money to achieve this result.
In the case of direct purchase and top-up mechanism, reverse auctions would be used, whereby project entities bid down the price at which they are willing to sell their emission reductions (the lowest offer becoming the fixed price in emission reductions sale contracts). In the case of the tradable put option, the funder specifies up-front the fixed price (“strike price”) at which it will purchase emission reductions, and project entities bid up the price at which they are willing to purchase the tradable put option (via a direct auction). In that latter case, price discovery results from the difference between the strike price and the price at which options are sold by the funder.
Decisions about QPI auction design depend on a series of other questions, including whether bidders up-front should have to pay or whether this would constitute an undue burden. For example, if up-front payments would be too burdensome, then a QPI based on reverse auctions of contracts for direct purchase for emission reduction procurement would allow for both price discovery and efficient allocation without requiring vendors to pay up-front. In this case, funders could require eligibility or performance standards to maintain confidence that bidders will be able to ultimately deliver on their contracts. Alternatively, if the funder desires to raise revenue (which could potentially be recycled into additional projects), then a direct auction of put options or top-up contracts would be appropriate. In either case, the strike price would need to be set at a price that is higher than the price needed to cover suppliers’ costs. Suppliers will then bid up the price to a point where the price covers their costs.
Measurement Reporting and Verification of QPIs QPIs can immediately build on the methodologies for measuring and reporting emission reductions of existing offset schemes, and therefore spare donors the costs of setting up new methodologies and independent auditors. There are a number of methane emission reductions accounting standards currently existing, and many have been successfully implemented at scale and the lessons learned broadly shared. The standards include the Clean Development Mechanism (CDM), Verified Carbon Standard (VCS) and Climate Action Reserve (CAR). The most successful methodologies tend to strike a
10
right balance between simplicity and adequacy of monitoring parameters. Country-specific enabling environments also play a role (e.g., availability of data, capacity of national authorities). Methane projects have often proved to deliver fewer emission reductions than their nominal potential (as calculated prior to project start using the offset methodologies). Some of this is the result of methodological issues that have been, or are being, addressed (see Appendix 3). While the CDM process benefits from a high level of transparency, challenges of the CDM are well known and include high transaction costs and limited support for accessing early stage finance.
Linking QPIs to the ‘carbon market’ QPIs also have the potential to link to carbon markets. The direct purchase and the tradable put option can function without any formal link to a carbon market – other than the possibility to borrow the rules, regulators and auditors of the offset standard that they would decide to rely on (for instance, in the case of the CDM, the CDM methane methodologies, the accredited Designated Operational Entities, and the CDM Executive Board, panels and supporting UNFCCC secretariat). Without any link to carbon markets, they would only differ in the way they are allocated (direct or reverse auctions, as described below). Conversely, the top-up is the only QPI that requires an underlying carbon market. It will be up to the funder(s) of a QPI to decide whether and how to link to a carbon market, and that each option carries both benefits and drawbacks. If the emission reductions can be sold to a carbon market, it provides an additional source of funding which can then be re-invested in other projects. Top-up contracts and tradable put options linked to a carbon market also offer the vendor access to any upside in carbon market prices. If emission reductions are not introduced in a carbon market, they can either be used by the funder for its own compliance needs (for instance to meet voluntary national mitigation targets) or they could be claimed as emission reductions by the country of origin – resulting in a net benefit to the climate. While the current weakened status of carbon markets makes this discussion somewhat theoretical, there may be value in maintaining a formal link with carbon markets, since any QPI initiative would be intended to last between 7 to 10 years (e.g., duration of crediting periods in the offset scheme), a time frame over which it is possible that a recovery of carbon prices might materialize. However, maintaining the potential to link with carbon markets comes with a cost of flexibility – as QPIs would need to meet rules of the carbon market. Severing any link with a carbon market gives the funders total flexibility on the choice of the methodologies and processes for third party verification. While some funders would likely show preference for deploying a QPI with well established and internationally recognized standards, such flexibility could be welcomed in order to address some limitations in existing methodologies and procedures. The use of new, bespoke accounting methodologies or an accounting standard could bring more flexibility and less regulatory burden. The envelope of QPI funding for methane reductions would have to be sufficiently large to justify the creation of new methodologies as their creation is costly and investors would seek compensation (in terms of higher risk premiums) for the regulatory risk of a standard with no experience. In all cases, it will be important to maintain the additionality test as found in offset standards, so as to avoid QPI funders to finance mitigation activities that would have occurred without the QPI. The exact methodologies and standards to use, like the decision to link to a carbon market, will be a decision for the governments or donors that chose to fund methane mitigation using a QPI mechanism.

11
Administering a QPI program Experience with past RBF systems suggests that direct administrative expenditures would be low. This is because a variety of cost centers, such as finding new emission reduction projects, have effectively been outsourced to project developers.

12
Appendix 2: Review of Identified Sectors
Oil and Gas sector
Sectoral Overview Twenty-three percent of all anthropogenic emissions of methane came from the oil and gas sector in 2010, making this sector the second largest source of emissions. Methane is the primary component of natural gas (95 percent of pipeline quality gas) and emissions come from all stages of the natural gas value chain: production, processing, transmission and distribution. Methane is also emitted during oil production and processing because natural gas is often found with petroleum deposits. Emissions come from leaky equipment and system upsets (i.e., maintenance, service interruptions), as well as from deliberate flaring and venting of natural gas. From 1990 to 2010, sectoral emissions increased by 31 percent and are expected to increase another 26 percent by 2030, rising to 2,112.9 MtCO2eq (in the absence of mitigating actions). Emissions growth is associated with increased oil and gas production, and is projected in all regions except Europe. In the United States, use of hydraulic fracturing technology has opened up vast shale gas reserves to production, while enhanced oil recovery and unconventional production from oil sands is expected to increase oil production in Canada and the United States. Production increases in other regions is achieved largely through conventional extractive techniques.
Abatement Opportunities Effective measures for reducing methane emissions are available, and often at low cost (see GMI 2009, Partnership Accomplishments 2004-2009). Abatement options generally are of three groupings: upgrades and changes in equipment; changes in operational practices; and direct inspection and maintenance. According to an analysis of a hypothetical group of typical projects, the average cost of the projects that reduce emissions at under $6/ton CO2eq range from just $30,000 to $675,000, with an average payback period of 6 months to 2 years, using revenue from the sale or use of captured gas (see Appendix 6, GMI 2/8/2013 presentation). Co-benefits can include significant improvements in operational safety. Figure 2 shows the emissions profile of the Oil & Gas sector, as well as the global marginal abatement curve for the sector in year 2020, and distribution of potential abatement in 2030 given a $10/ton CO2eq price. More than twenty percent of sectoral emissions can be cost-effectively reduced with a zero carbon price. About a third of all emissions can be cost-effectively reduced given a carbon price of $10/ton. Above this price point, marginal abatement costs rise faster but still yield significant reductions due to the overall size of this sector’s emissions. Low cost abatement opportunities are most prevalent in Eurasia, but also found in the Middle East, Africa, North America and Asia.

13
Table 2: Global potential abatement from the oil and gas sector in 2030 with baseline emissions of 2,113 MtCO2e
Cost per ton CO2eq
$0 $10 $20 $30 $50
Potential reductions (MtCO2eq)
470.2 694 777.4 800.1 832.2
Percentage of sectoral 2030 emissions
22.3% 32.9% 36.8% 37.9% 39.4%
Figure 2: Emissions profile and abatement opportunity in the oil and gas sector
Source: US EPA, preliminary data from Global Mitigation of Non-CO2 Greenhouse Gases Report ( Best available data uses 2020 global MAC Curve and 2030 abatement potential)
Applicability of RBF to the Oil & Gas Sector Unlike other sectors where significant opportunities exist for reducing methane emissions, with oil and gas the concern is with incentivizing oil and gas companies to save more of their own product. Projects that have been developed through the Global Methane Initiative have been largely self-financed, and barriers to project development are often associated with a lack of awareness about the scale of the problem and mitigation opportunities, rather than a lack of access to finance or a price signal.
14
However, RBF may have an impact incentivizing projects that target the transmission and distribution segment of the industry, where companies often lack incentives to address emissions because these companies do not own the gas themselves. Opportunities for RBF may also be found where there is a lack of infrastructure or market for captured gas, such as in oil production sites. Moreover, the widespread perception that the oil & gas sector is comprised uniformly of well-capitalized companies with little need for outside funding is false, particularly for state-owned companies in developing countries, as well as downstream transmission and distribution companies that typically operate under small profit margins. To date, 55 projects have been developed under the CDM addressing methane emissions from the oil and gas sector out of 1,381 methane abatement projects in total. These projects have been developed worldwide, with the largest number coming from Brazil, Uzbekistan, and Nigeria. Those 55 projects are expected to generate some 450 MtCO2eq reductions by 2020 (according to the Project Design Documents), which is 19 percent of the reductions from all methane projects. This gives an indication of the size of potential reductions from projects in this sector.
Landfill Sector
Sectoral Overview Landfills are the third largest anthropogenic source of methane emissions, accounting for 847 million metric tons of carbon dioxide (MtCO2eq) in 2010, or nearly 12 percent of global methane emissions.24 Total methane emissions from landfills are expected to increase by 13 percent between 2010 and 2030 (in the absence of mitigating actions), driven principally by growth in developing country populations, GDP and consumption, along with improved waste management practices that divert more waste into sanitary landfills. The production of methane, in combination with other gases in a landfill, occurs through the natural process of bacterial decomposition of organic waste (food scraps, paper, brush) under anaerobic conditions. Gas is generated over a period of several decades and consists of approximately 50 percent methane, and 50 percent carbon dioxide mixed with small quantities of other gases. If the gas is not collected, it will escape into the atmosphere. In general there are three kinds of waste disposal sites: open dumps, managed dumps which apply some kind of controls over the waste stream, and sanitary landfills. Open dumps and managed dumps are not very conducive to methane generation because waste is typically deposited in shallow layers exposed to oxygen. Sanitary landfills are designed to alleviate many of the environmental problems associated with open and managed dumps, including potential ground and surface water contamination, air pollution, and disease transmission. They employ liners, mechanical compaction, daily cover, and a final cap. One consequence of these measures is that they create the anaerobic conditions necessary for methane generation.
24
EPA 2012. Global Anthropogenic Non-CO2 Greenhouse Gas Emissions: 1990 – 2030. EPA 430-R-12-
006. Available at: http://www.epa.gov/climatechange/EPAactivities/economics/nonco2projections.html
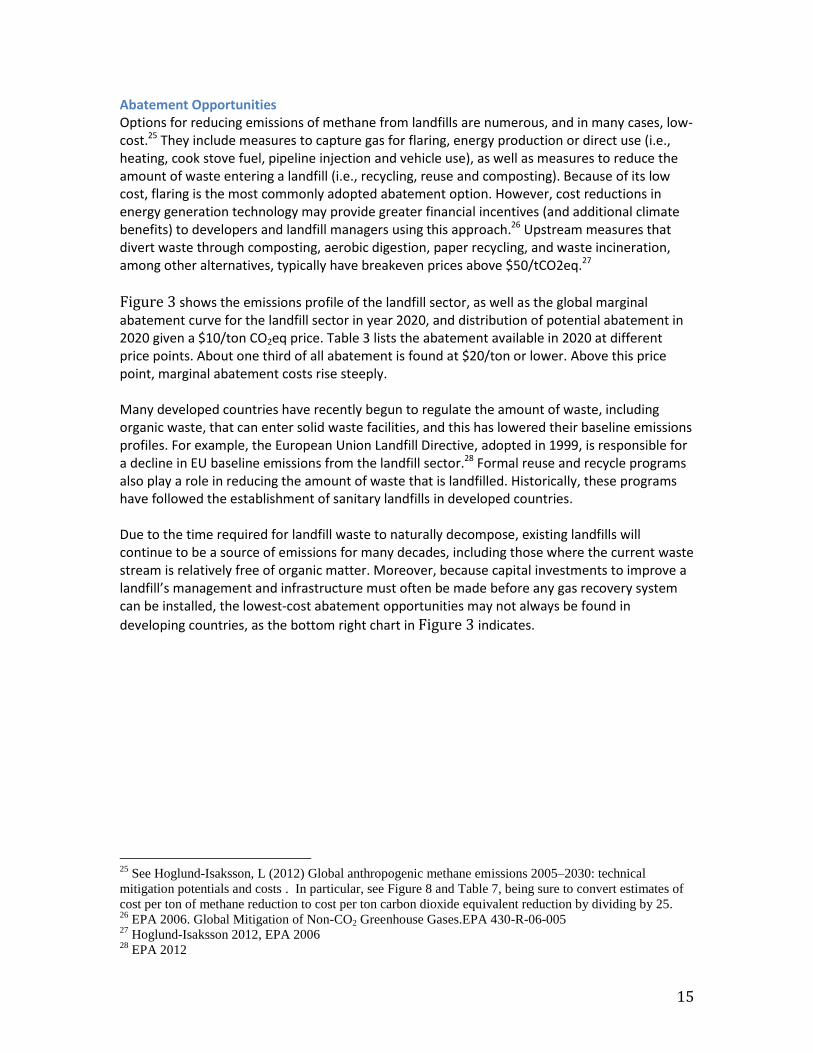
15
Abatement Opportunities Options for reducing emissions of methane from landfills are numerous, and in many cases, low-cost.25 They include measures to capture gas for flaring, energy production or direct use (i.e., heating, cook stove fuel, pipeline injection and vehicle use), as well as measures to reduce the amount of waste entering a landfill (i.e., recycling, reuse and composting). Because of its low cost, flaring is the most commonly adopted abatement option. However, cost reductions in energy generation technology may provide greater financial incentives (and additional climate benefits) to developers and landfill managers using this approach.26 Upstream measures that divert waste through composting, aerobic digestion, paper recycling, and waste incineration, among other alternatives, typically have breakeven prices above $50/tCO2eq.27
Figure 3 shows the emissions profile of the landfill sector, as well as the global marginal abatement curve for the landfill sector in year 2020, and distribution of potential abatement in 2020 given a $10/ton CO2eq price. Table 3 lists the abatement available in 2020 at different price points. About one third of all abatement is found at $20/ton or lower. Above this price point, marginal abatement costs rise steeply. Many developed countries have recently begun to regulate the amount of waste, including organic waste, that can enter solid waste facilities, and this has lowered their baseline emissions profiles. For example, the European Union Landfill Directive, adopted in 1999, is responsible for a decline in EU baseline emissions from the landfill sector.28 Formal reuse and recycle programs also play a role in reducing the amount of waste that is landfilled. Historically, these programs have followed the establishment of sanitary landfills in developed countries. Due to the time required for landfill waste to naturally decompose, existing landfills will continue to be a source of emissions for many decades, including those where the current waste stream is relatively free of organic matter. Moreover, because capital investments to improve a landfill’s management and infrastructure must often be made before any gas recovery system can be installed, the lowest-cost abatement opportunities may not always be found in
developing countries, as the bottom right chart in Figure 3 indicates.
25
See Hoglund-Isaksson, L (2012) Global anthropogenic methane emissions 2005–2030: technical
mitigation potentials and costs . In particular, see Figure 8 and Table 7, being sure to convert estimates of
cost per ton of methane reduction to cost per ton carbon dioxide equivalent reduction by dividing by 25. 26
EPA 2006. Global Mitigation of Non-CO2 Greenhouse Gases.EPA 430-R-06-005 27
Hoglund-Isaksson 2012, EPA 2006 28
EPA 2012
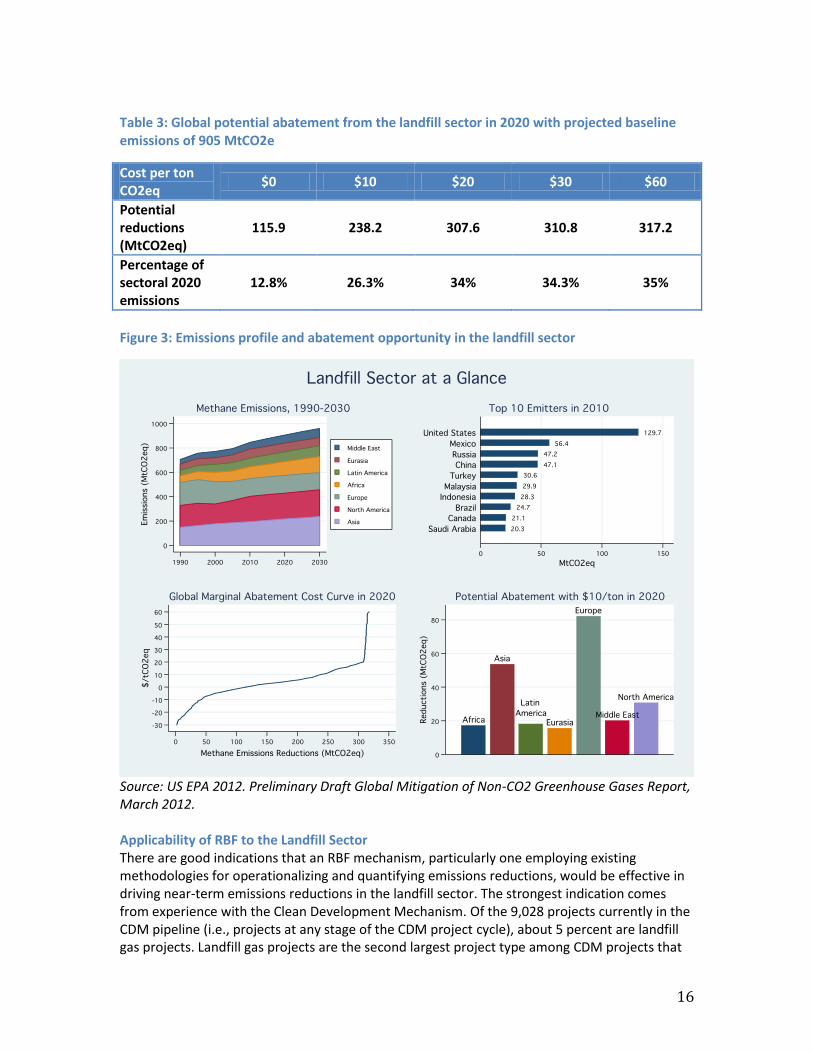
16
Table 3: Global potential abatement from the landfill sector in 2020 with projected baseline emissions of 905 MtCO2e
Cost per ton CO2eq
$0 $10 $20 $30 $60
Potential reductions (MtCO2eq)
115.9 238.2 307.6 310.8 317.2
Percentage of sectoral 2020 emissions
12.8% 26.3% 34% 34.3% 35%
Figure 3: Emissions profile and abatement opportunity in the landfill sector
Source: US EPA 2012. Preliminary Draft Global Mitigation of Non-CO2 Greenhouse Gases Report, March 2012. Applicability of RBF to the Landfill Sector There are good indications that an RBF mechanism, particularly one employing existing methodologies for operationalizing and quantifying emissions reductions, would be effective in driving near-term emissions reductions in the landfill sector. The strongest indication comes from experience with the Clean Development Mechanism. Of the 9,028 projects currently in the CDM pipeline (i.e., projects at any stage of the CDM project cycle), about 5 percent are landfill gas projects. Landfill gas projects are the second largest project type among CDM projects that
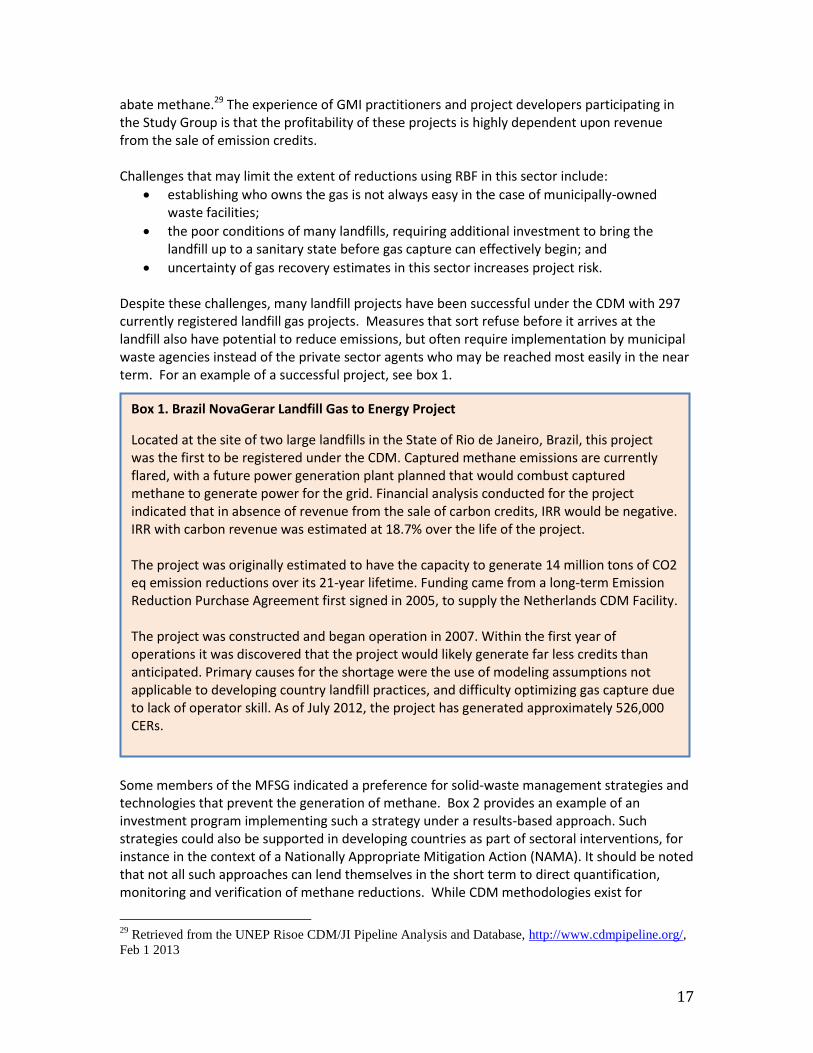
17
abate methane.29 The experience of GMI practitioners and project developers participating in the Study Group is that the profitability of these projects is highly dependent upon revenue from the sale of emission credits. Challenges that may limit the extent of reductions using RBF in this sector include:
establishing who owns the gas is not always easy in the case of municipally-owned waste facilities;
the poor conditions of many landfills, requiring additional investment to bring the landfill up to a sanitary state before gas capture can effectively begin; and
uncertainty of gas recovery estimates in this sector increases project risk. Despite these challenges, many landfill projects have been successful under the CDM with 297 currently registered landfill gas projects. Measures that sort refuse before it arrives at the landfill also have potential to reduce emissions, but often require implementation by municipal waste agencies instead of the private sector agents who may be reached most easily in the near term. For an example of a successful project, see box 1.
Some members of the MFSG indicated a preference for solid-waste management strategies and technologies that prevent the generation of methane. Box 2 provides an example of an investment program implementing such a strategy under a results-based approach. Such strategies could also be supported in developing countries as part of sectoral interventions, for instance in the context of a Nationally Appropriate Mitigation Action (NAMA). It should be noted that not all such approaches can lend themselves in the short term to direct quantification, monitoring and verification of methane reductions. While CDM methodologies exist for
29
Retrieved from the UNEP Risoe CDM/JI Pipeline Analysis and Database, http://www.cdmpipeline.org/,
Feb 1 2013
Box 1. Brazil NovaGerar Landfill Gas to Energy Project
Located at the site of two large landfills in the State of Rio de Janeiro, Brazil, this project was the first to be registered under the CDM. Captured methane emissions are currently flared, with a future power generation plant planned that would combust captured methane to generate power for the grid. Financial analysis conducted for the project indicated that in absence of revenue from the sale of carbon credits, IRR would be negative. IRR with carbon revenue was estimated at 18.7% over the life of the project. The project was originally estimated to have the capacity to generate 14 million tons of CO2 eq emission reductions over its 21-year lifetime. Funding came from a long-term Emission Reduction Purchase Agreement first signed in 2005, to supply the Netherlands CDM Facility. The project was constructed and began operation in 2007. Within the first year of operations it was discovered that the project would likely generate far less credits than anticipated. Primary causes for the shortage were the use of modeling assumptions not applicable to developing country landfill practices, and difficulty optimizing gas capture due to lack of operator skill. As of July 2012, the project has generated approximately 526,000 CERs.

18
composting and waste recycling, there is little experience so far and only 21 projects have been successfully registered for landfill composting.
Box 2. Achieving methane reductions through results-based financing (RBF) and Output-based Aid (OBA) for integrated solid waste management (SWM)
Upstream investments in integrated waste management, such as waste minimization and source separation, can lead to greater downstream benefits, including reducing methane (and other GHG) emissions, and reduced exploitation of natural resources. These approaches face two main challenges: (1) solid waste investments typically focus on disposal infrastructure, and (2) the difficulty of incentivizing the behavioral changes needed to separate waste into reusable components. RBF/OBA can be used to address these challenges. By paying directly for the desired outputs (e.g. quantity and quality of source separated waste), rather than for the infrastructure (landfill construction), OBA/RBF can incentivize critical actions that reduce methane, complementing downstream investments. The work featured in the case studies below was funded by the Global Partnership on Output-Based Aid.
The World Bank-funded Ningbo Waste Minimization and Recycling Project (US$4 million) will apply an RBF approach to incentivize source separation of waste and achieve global environmental benefits. The objective of the project is to divert municipal solid waste from landfills and incinerators for productive reuse. Towards this aim, an RBF scheme will provide incentive payments to neighborhood resident committees, based on the quantity and quality of their separated waste (recyclable material, food waste and hazardous waste). Increasing source separation reduces the quantity of waste going to landfills, thus preventing methane emissions. Methane released from organic waste (as much as 30,000 m3 per day of biogas) will be collected in an anaerobic digester for electricity generation. Separating the organic waste will allow for improved material recycling (thus reducing natural resource extraction), and using the resulting compost will further reduce GHG emissions, and contribute to soil fertility. The municipality will also save money from the extended life of the landfill, which will receive less waste.
In Nepal, a $4.3 million OBA scheme will incentivize improved municipal SWM services. Improved collection and disposal in sanitary landfills with gas collection systems will lead to local and global environmental benefits, including methane reduction. The waste collection rate in Nepal is less than 50%. With a high organic (60%) content, uncollected waste directly affects the environment and public health, contaminating soil and water, emitting methane and other GHGs, and attracting disease vectors. A GPOBA grant will incentivize better service delivery in five municipalities over four years, covering the gap between the costs of delivering SWM services and the revenues. Independent verification of municipal waste services will be used to trigger the release of OBA subsidies. Where performance is satisfactory, municipalities will receive subsidies proportional to the revenue they collect from households and businesses. The scorecard used for performance verification represents a starting point for national efforts to benchmark and monitor SWM service delivery.

19
Wastewater sector
Sectoral Overview The Wastewater sector includes methane emissions from both domestic wastewater (sewage) and industrial wastewater. Emissions were 511.8 MtCO2eq in 2010,30 which is 7 percent of global methane emissions, making this sector the sixth largest among individual sources. From 1990-2010, sectoral emissions increased 45 percent, and are expected to increase another 19 percent over the next two decades (in the absence of mitigating actions). The principle driver of emissions growth is population growth, particularly among countries where sewage is largely untreated. The highest increases in emissions from 2010-2030 are projected in Africa (41 percent), the Middle East (28 percent), and Latin America (24 percent). As with the Landfill and Livestock Waste sectors, methane emissions come from the breakdown of organic matter under anaerobic conditions. Most developed countries rely upon large centralized wastewater treatment plants fed by sewer infrastructure, where waste is broken down under predominantly aerobic conditions. A relatively small amount of emissions are produced during a final anaerobic treatment stage, and this gas can be captured and utilized. In contrast, less advanced systems for handling waste, including latrines, septic tanks, and open sewers, are common in developing countries. In these systems, breakdown of waste occurs primarily under anaerobic conditions, and resulting methane emissions are high. Septic tanks are still utilized in parts of the developed world where centralized sewer infrastructure is not available. In the United States, for example, septic tanks are the source of an estimated 65 percent of wastewater emissions, while accounting for only 25 percent of total wastewater treatment.
Abatement Opportunities Wastewater is typically handled by municipalities and may not be easily accessible to private project developers. In addition, most centralized systems already capture and flare methane for safety reasons. Potential reductions are then limited to changes in pre-treatment waste management practices.
There is significant investment in this sector in locations without centralized wastewater treatment systems. Installation of centralized wastewater management and treatment systems can dramatically reduce disease; this disease reduction benefit is larger than greenhouse gas reduction benefits and thus methane finance is unlikely to drive investment decisions.
30
EPA modeling of emissions from this sector, used here, does not include industrial wastewater emissions
unless a country reports them. Total emissions for this sector are therefore likely higher.
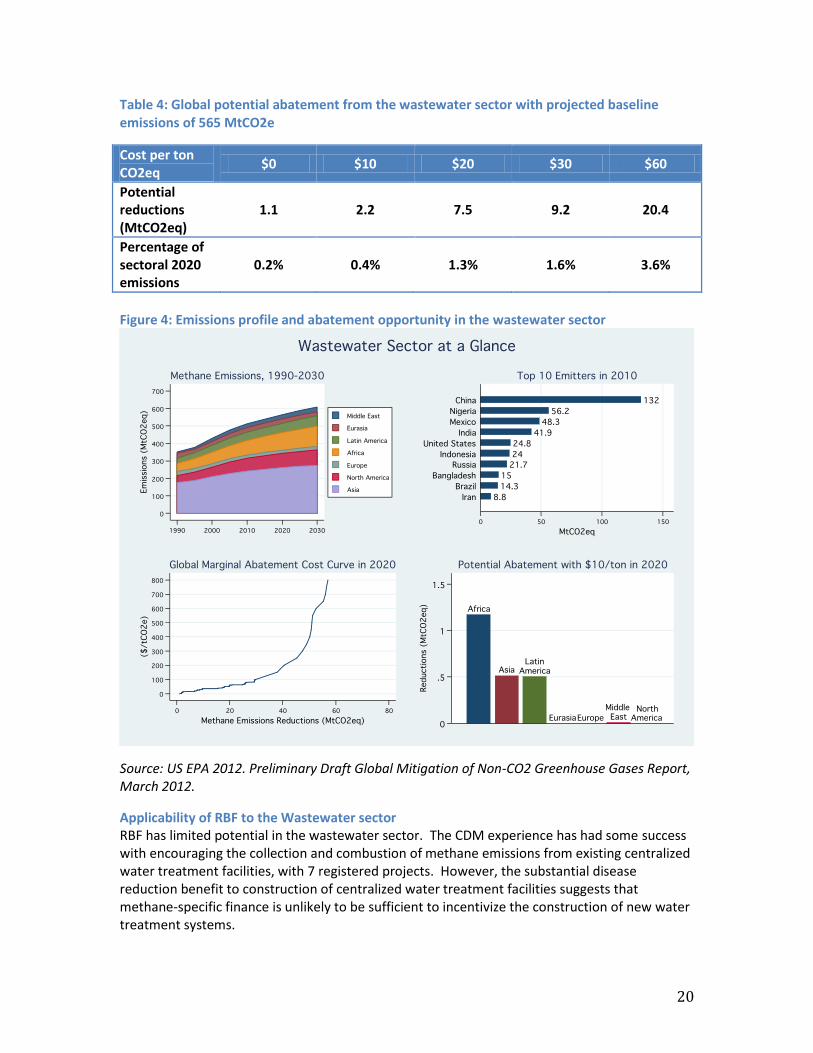
20
Table 4: Global potential abatement from the wastewater sector with projected baseline emissions of 565 MtCO2e
Cost per ton CO2eq
$0 $10 $20 $30 $60
Potential reductions (MtCO2eq)
1.1 2.2 7.5 9.2 20.4
Percentage of sectoral 2020 emissions
0.2% 0.4% 1.3% 1.6% 3.6%
Figure 4: Emissions profile and abatement opportunity in the wastewater sector
Source: US EPA 2012. Preliminary Draft Global Mitigation of Non-CO2 Greenhouse Gases Report, March 2012.
Applicability of RBF to the Wastewater sector RBF has limited potential in the wastewater sector. The CDM experience has had some success with encouraging the collection and combustion of methane emissions from existing centralized water treatment facilities, with 7 registered projects. However, the substantial disease reduction benefit to construction of centralized water treatment facilities suggests that methane-specific finance is unlikely to be sufficient to incentivize the construction of new water treatment systems.
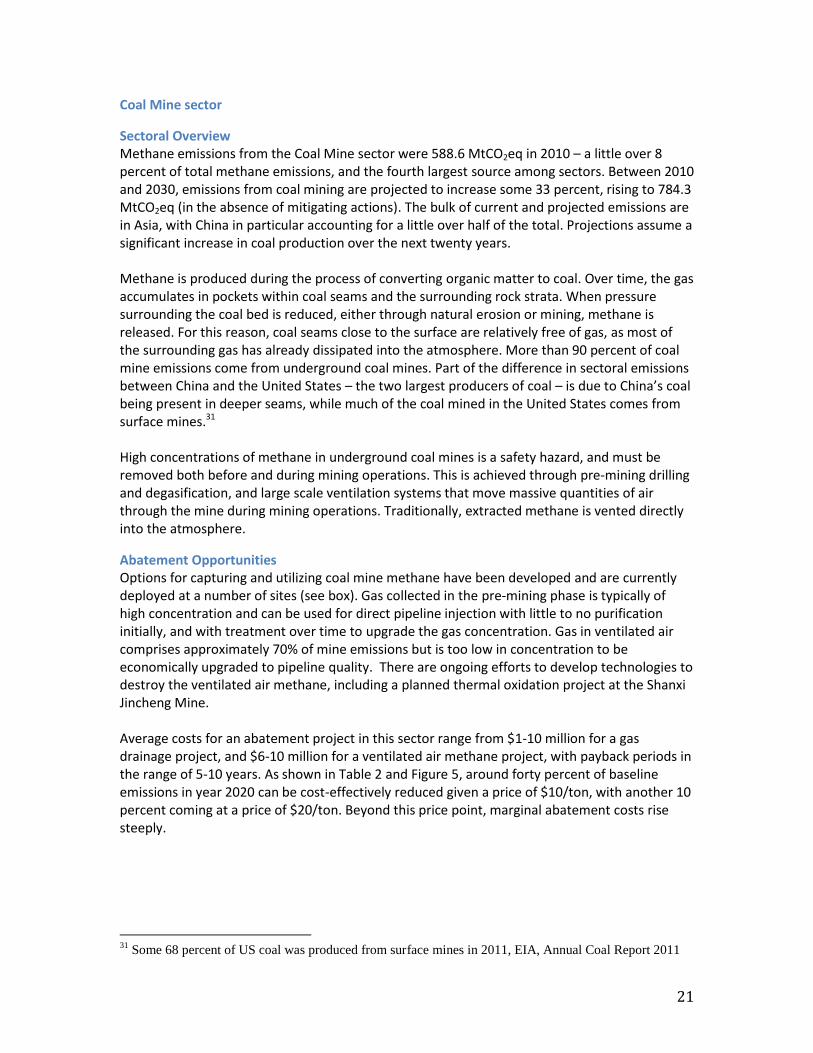
21
Coal Mine sector
Sectoral Overview Methane emissions from the Coal Mine sector were 588.6 MtCO2eq in 2010 – a little over 8 percent of total methane emissions, and the fourth largest source among sectors. Between 2010 and 2030, emissions from coal mining are projected to increase some 33 percent, rising to 784.3 MtCO2eq (in the absence of mitigating actions). The bulk of current and projected emissions are in Asia, with China in particular accounting for a little over half of the total. Projections assume a significant increase in coal production over the next twenty years. Methane is produced during the process of converting organic matter to coal. Over time, the gas accumulates in pockets within coal seams and the surrounding rock strata. When pressure surrounding the coal bed is reduced, either through natural erosion or mining, methane is released. For this reason, coal seams close to the surface are relatively free of gas, as most of the surrounding gas has already dissipated into the atmosphere. More than 90 percent of coal mine emissions come from underground coal mines. Part of the difference in sectoral emissions between China and the United States – the two largest producers of coal – is due to China’s coal being present in deeper seams, while much of the coal mined in the United States comes from surface mines.31 High concentrations of methane in underground coal mines is a safety hazard, and must be removed both before and during mining operations. This is achieved through pre-mining drilling and degasification, and large scale ventilation systems that move massive quantities of air through the mine during mining operations. Traditionally, extracted methane is vented directly into the atmosphere.
Abatement Opportunities Options for capturing and utilizing coal mine methane have been developed and are currently deployed at a number of sites (see box). Gas collected in the pre-mining phase is typically of high concentration and can be used for direct pipeline injection with little to no purification initially, and with treatment over time to upgrade the gas concentration. Gas in ventilated air comprises approximately 70% of mine emissions but is too low in concentration to be economically upgraded to pipeline quality. There are ongoing efforts to develop technologies to destroy the ventilated air methane, including a planned thermal oxidation project at the Shanxi Jincheng Mine. Average costs for an abatement project in this sector range from $1-10 million for a gas drainage project, and $6-10 million for a ventilated air methane project, with payback periods in the range of 5-10 years. As shown in Table 2 and Figure 5, around forty percent of baseline emissions in year 2020 can be cost-effectively reduced given a price of $10/ton, with another 10 percent coming at a price of $20/ton. Beyond this price point, marginal abatement costs rise steeply.
31
Some 68 percent of US coal was produced from surface mines in 2011, EIA, Annual Coal Report 2011
22
Table 5: Global potential abatement from the coal mine sector in 2020 with projected baseline emissions of 671 MtCO2e
Cost per ton CO2eq
$0 $10 $20 $30 $60
Potential reductions (MtCO2eq)
58.1 290.7 341.7 357.8 360.8
Percentage of sectoral 2020 emissions
8.7% 43.3% 50.9% 53.3% 53.7%
Box 3. Jincheng Sihe Coal Mine Methane Generation Project China’s Jincheng Sihe Coal Mine was the site of one of the first coal mine methane CDM projects. This project uses coal mine methane which was previously vented to generate electricity. This electricity is sold to the North China Grid, which supplies Beijing, Tianjin, Heibi, Shanxi, Shandong, and Inner Mongolia while reducing methane emissions by more than 3 million tons of CO2e per year.
The project required construction of improved gas capture infrastructure, a 120 MW gas power plant on-site, and power transmission lines to connect to the electricity grid at a total cost of 793 million yuan. The project’s electricity sales generate revenue, but not enough to meet the 15% hurdle rate justifying investment without the sales of emission reduction credits. The World Bank entered into an Emission Reduction Purchase Agreement with the project developer, committing to buy a portion of the project’s future emission reduction credits. This commitment allowed the project developer to secure private capital investments from commercial banks to finance construction.
The project began generating emission reduction credits in April 2009. The project has exceeded projections to date, generating over 11 million CERs through September 2012. It is expected to generate over 30 million tons of CO2e reductions by 2018 and continue reducing emissions by more than 3 million tons of CO2e per year over its twenty year lifespan.

23
Figure 5: Emissions profile and abatement opportunity in the coal mine sector
Source: US EPA 2012. Preliminary Draft Global Mitigation of Non-CO2 Greenhouse Gases Report, March 2012. Note – the substantial reduction in emissions from 1995-2000, seen in the above left chart, is due to a high level of reported mine closures and significant reduction of coal production during this period. However, EPA’s methodology does not include emissions from abandoned mines (unless reported by a country), and thus a fair amount of uncertainty is assumed in the model.
Applicability of RBF to the Coal Mine sector As with the landfill sector, the relative profitability of projects without revenue from the sale of emission credits is low. An exception has been some mines in the US, which have benefited from a unique set of circumstances, including preexisting pipeline infrastructure, and relatively high gas prices. There are now more than 220 coal mine methane abatement projects worldwide in 14 countries, which together avoid around 3.8 billion cubic meters of methane every year. This figure includes 115 CDM projects and 33 Joint Implementation projects, which together account for two-thirds of the total. Challenges that may limit the extent of reductions using RBF in this sector include:
Cultural barriers, with the industry historically treating methane as a waste product, and otherwise not a concern; and
Infrastructure to distribute gas, along with favorable gas prices, may not be present.

24
Livestock Waste Sector
Sectoral Overview Methane emissions from the management of livestock manure totaled 229.2 MtCO2eq in 2010 – just over 3 percent of total methane emissions. Total emissions from this sector have remained relatively stable from 1990-2010, but are projected to increase by about 10 percent over the next two decades (in the absence of mitigating actions). Growth in emissions is driven by increased demand for dairy and meat products, as well as a trend towards larger, more commercialized livestock management operations with concentrated waste management systems. Africa and Asia are the two regions with the highest projected growth in emissions, at 32 and 24 percent respectively, from 2010-2030. Methane is produced by the anaerobic decomposition of manure, which occurs when manure is stored or treated in liquid systems such as lagoons, ponds, or pits. When manure is handled as a solid or deposited on pasture or rangeland, it decomposes aerobically and produces little or no methane. For this reason, the bulk of methane emissions from manure management come from swine and dairy cattle, as beef cattle tend to be managed on pasture with solid manure handling. Transformation of the pork industry from small-scale individual producers to larger commercialized operations, particularly in countries such as China and Brazil, is expected to further increase the utilization of liquid-based manure management systems. Significant household-level co-benefits have been generated and documented in the livestock waste sector. A number of biogas projects (e.g., The World Bank’s Community Development Carbon Fund Biogas project in Nepal) have been using subsidized small-scale anaerobic digesters of animal bio-slurry to provide an alternative source of cooking and heating. Substituting for traditional wood-fuel and kerosene can significantly improve health outcomes and reduce household energy expenditures.
Abatement Opportunities Livestock emissions abatement opportunities primarily either reduce methane emissions from livestock digestion or capture the emissions from manure.
There are a variety of potential options to reduce emissions from livestock digestion, also known as enteric fermentation: improvements in feed, use of growth supplements such as antibiotics, nutritional supplements, grazing and related herd management changes, and genetic engineering of livestock. However, these options have not been widely deployed and research is ongoing.
If emissions are captured from manure, they can be burned for electricity or heat production. This electricity production can represent a supplemental revenue source. If electricity or heat production displaces less clean-burning fuel sources, it can also offer substantial health and development co-benefits.

25
Table 6: Global potential abatement from livestock sector in 2020 with projected baseline emissions of 240 MtCO2e
Cost per ton CO2eq
$0 $10 $20 $30 $60
Potential reductions (MtCO2eq)
54.1 67.5 86.6 95.4 113.6
Percentage of sectoral 2020 emissions
23% 28% 36% 40% 47%
Figure 6: Emissions profile and abatement opportunity in the livestock sector
Source: US EPA, preliminary data from Global Mitigation of Non-CO2 Greenhouse Gases Report
Applicability of RBF to the Livestock Waste sector There is substantial potential for RBF in the livestock waste sector, as demonstrated by over 200 registered CDM projects for methane capture from livestock manure. New projects face a variety of barriers to implementation at each stage of the project cycle. Initially projects face significant financing barriers. Project development requires a significant initial capital investment, and banks may be hesitant to provide financing if they do not have the technical capability to evaluate the project. Projects also may need access to local energy markets, which

26
requires both interconnections and regulatory permission. Further, the time lag between the initial investment and the generation of recognized emission reductions can be several years. Finally, over the period between investment and generation of emission reductions operators may change the system operations to fit with other business needs; this requires a costly and timely reorganization of the emission reduction program. However, in spite of all of these barriers, projects have proven profitable with low carbon costs demonstrating that RBF can be a powerful incentive to overcome these barriers.
27
Appendix 3: Methane-related methodologies in existing carbon offset standards
Introduction Existing carbon offset programs (standards) serve as a vehicle for result-based finance for projects that generate verifiable quantity of GHG emission reductions. These standards have developed a number of methodologies (or protocols) for estimating methane (CH4) emission reductions from a variety of activities. Each methodology provides a means to monitor, quantify, report and verify emission reductions as a condition for issuance of carbon offsets. The Clean Development Mechanism (CDM), established under the Kyoto Protocol of the UNFCCC, alone has 50 methodologies focused on reducing CH4 emissions. The US-based offset programs, VCS (Verified Carbon Standard) and CAR (Climate Action Reserve), have developed several more methodologies. Other commonly used project standards either have limited activity in CH4 reductions, or do not provide publicly available information on their activity and cannot be evaluated. Hence, this section focuses on methodologies from the CDM, VCS and CAR.32
First, the appendix describes the main building blocks and typology of existing methodologies. Second, it identifies the list of the ten most used methane-related methodologies followed by a brief assessment of their main monitoring approaches, level of complexity and three real-life implementation examples. This assessment is mainly informed by the expert judgment based on the experience gained in developing and implementing CDM projects. Finally, the appendix provides brief observations in terms of main factors that may influence the level of MRV performance for methane-related projects.
Building blocks of existing methodologies The methodologies determine emission reductions using three building blocks, defined by a set of equations, populated by input parameters: baseline emissions, projects emissions and leakages. Emission reductions correspond to the positive difference between the baseline emissions, project emissions and leakages. The methodologies then provide for monitoring approaches that shall be used to measure, collect and record variable parameters used to calculate resulting emission reductions.
Baseline emissions & additionality Baseline reflects a counterfactual scenario that would happen in the absence of the project. The baseline emissions have a direct impact on the amount of emission reductions that can be attributed to the project. Therefore, each methodology prescribes an approach that shall be used to define the baseline (e.g., a list of possible alternative scenarios). For instance, for the CDM projects the baseline can be defined in one of three ways: (i) by historical conditions at the project site, (ii) by an economically attractive alternative to the project, or (iii) by observed emissions from a subset of comparable activities. In practice, most methodologies use one of the first two options. Conservativeness of the baseline selection further depends on the ways existing and planned sectoral policies, practices and achievable level of performance are built-in (e.g., average versus top-20% efficiency).
32
These standards have limited or no activity (yet) in CH4 reduction: American Carbon Registry,
Australia’s Carbon Farming Initiative, the Gold Standard. The following standards do not offer publicly
available information about projects: IPIECA Guidelines, RGGI, Western Climate Initiative.

28
Last but not least, the baseline selection is subject to the additionality test. The additionality requirement aims to ensure that only activities that would not be implemented without the incremental revenues from carbon offsets are rewarded. In practice, it means that common practice projects and/or economically attractive activities are not eligible options for carbon offset generation. The interpretation and use of additionality concept in the CDM is subject to substantial controversy largely covered in the literature (see Box 4).
Ways have been explored to overcome these controversies through defining positive lists of technologies/interventions deemed additional (or negative lists for de facto ineligible projects) and/or development of conservative standardized baselines with imbedded additionality test (e.g. sectoral benchmarks). Nevertheless, the controversy of additionality is far from being resolved.
Box 4 – Additionality concept: Theory and practice
The Concept of Additionality The additionality test aims to ensure a proper balance between environmental integrity and availability of incentives from the carbon market. In other words, the crediting instrument should simultaneously neither reward business-as-usual activities, nor under-credit mitigation efforts that are mobilized through the offset program. In practice, this concept is challenging to implement because individual projects face specific policy, regulatory and economic circumstances and each project entity uses its own investment appraisal approaches and criteria, all of which impact the decision whether or not to proceed with a project. Thus the assessment of an individual project’s additionality is subject to interpretation.
CDM Additionality – Complexity and Controversy In the case of the CDM, the guidance for determination of additionality still does not provide sufficient objectivity, and its application is often inconsistent. Inappropriate additionality argumentation is reported to be one of the main barriers for project approval (IGES, 2011). The constant revisions and clarifications to the requirements for additionality demonstration in CDM reflect the evolving effort to strike an adequate balance between environmental integrity and availability of the incentive. For instance, guidance on the demonstration of lack of financial attractiveness became increasingly stringent, while at the same time approaches such as positive lists to demonstrate additionality for micro-scale and small-scale projects were introduced. Some important controversies remain with regard to the additionality demonstration of activities benefiting from domestic support schemes (e.g., special electricity tariffs for Chinese wind projects), and for economically attractive measures that are suppressed by regulation, market failures or engrained practices (e.g., methane leaks reduction from natural gas production and distribution).
CAR Additionality Tests The CAR standard utilizes tests of additionality that are specific to the project type, included in each methodology. These include a performance standard test, in which the project design is compared to minimum requirements, and a legal requirement test, which is a check against regulatory obligations. The requirements were developed in consultation with workgroups composed of sector stakeholders. In practice, these tests have been sufficiently objective such that additionality demonstration has not proved especially controversial for projects developed under the CAR standard.

29
Project emissions This building block defines the scope and types of direct GHG emissions resulting from project implementation that have to be accounted by the project (e.g., fuel use for power generated for the needs of the project, leaks from project infrastructure) and provides relevant equations. Leakage emissions, emissions that project implementation influences indirectly, are accounted and deducted from the amount of emission reductions.
Typology of methodologies (under the CDM) Methodologies under the CDM are also grouped in three distinct categories (and their designations): Large scale (AM), Consolidated (ACM), and Small scale (AMS). This distinction aims to better facilitate the GHG mitigation potential from projects of different size, technical complexity and capacity to accommodate and support the costs of different monitoring techniques.
Small-scale methodologies are for projects that reduce less than 60,000 tCO2equivalent per year. They are providing for simplified calculation and monitoring requirements, and tend to rely more on default factors to increase efficiency and reduce transaction costs (e.g., reduced data requirements, cost of monitoring equipment). The accuracy requirements are also somehow less stringent (e.g., parameter values for main emissions sources should be known to an accuracy / precision standard of 90/10).33
Large-scale methodologies are for projects that reduce large amounts of GHG emissions. The methodologies mainly apply to narrowly specified mitigation options implemented by individual interventions. Taking into account a potentially higher impact of any errors in large-scale projects on the environmental integrity of the standard, the accuracy requirements of these methodologies are more stringent and include among others: (i) larger coverage and more detailed assessment of different emissions sources in the baseline and project emissions; (ii) parameter values for main emissions sources should be known to an accuracy / precision standard of 95/10.
Consolidated methodologies cover the same type of projects as large scale, but they aim to quantify emissions for a broad group of projects of a given type/sectoral scope (e.g., ACM0001 “Flaring or use of landfill gas” as opposed to large scale methodology AM0002 “Landfill gas capture and flaring where the baseline is established by a public concession contract”). The broader variation of eligible types of activities is accommodated by a “modular” approach when the project proponent can select/combine relevant sets of equations to calculate emission reductions.
Despite this differentiation, small-scale methodologies are not systematically simpler than large scale, and consolidated methodologies are not always more broadly applicable than large scale. To further improve efficiency of the CDM and its attractiveness to different types of projects in various regions, the CDM initiated a move toward standardization that has been extensively discussed (Lazarus et al., 2000; Probase, 2002, World Bank, 2010& 2012; Schneider et al., 2012).
33
This mainly applies when sampling is used to determine the parameter value. For instance, ±10% in
relative units means that the interval around a proportion value of 70% is 63% to 77%. Thus the 90%
confidence interval for mean value 70% should not be wider than 63%-77%.

30
Standardized approaches. Standardization approaches can be distinguished between (i) improvements in methodologies using, for example, default factors (e.g., ex ante available deemed values) or benchmarks (emission performance standards) to calculate baseline, project emission or leakage, and (ii) efforts to move away from a project-by-project approach to a higher level of aggregation (e.g., establishing sector-specific standardized baselines; deemed additionality approaches). In terms of monitoring, aggregated standardized approaches would be particularly relevant for sector with dispersed emission sources, such as household-level biodigesters or small charcoaling kilns, relying on e.g., conservative estimates using data on changes in market penetration rates or focusing on activities rather than on direct emission reductions measurements. Further, the verification process could be streamlined by using risk-based verification approaches (e.g., spot-check approach focusing verification on a sample of implemented activities).
While the CDM, VCS, and CAR have more than 50 methane-related methodologies, 80% of
projects use one of the 10 most common methodologies. Those 10 are listed in Table 77.
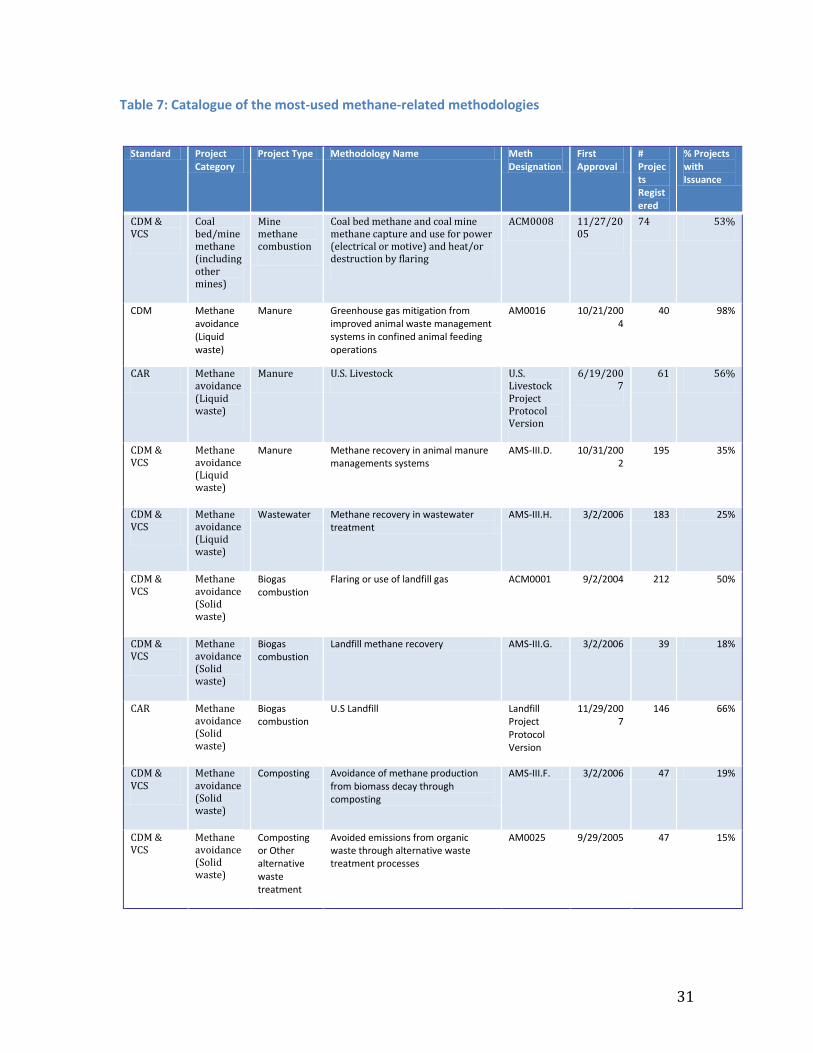
31
Table 7: Catalogue of the most-used methane-related methodologies
Standard Project Category
Project Type Methodology Name Meth Designation
First Approval
# Projects Registered
% Projects with Issuance
CDM & VCS
Coal bed/mine methane (including other mines)
Mine methane combustion
Coal bed methane and coal mine methane capture and use for power (electrical or motive) and heat/or destruction by flaring
ACM0008 11/27/2005
74 53%
CDM Methane avoidance (Liquid waste)
Manure Greenhouse gas mitigation from improved animal waste management systems in confined animal feeding operations
AM0016 10/21/2004
40 98%
CAR Methane avoidance (Liquid waste)
Manure U.S. Livestock U.S. Livestock Project Protocol Version
6/19/2007
61 56%
CDM & VCS
Methane avoidance (Liquid waste)
Manure Methane recovery in animal manure managements systems
AMS-III.D. 10/31/2002
195 35%
CDM & VCS
Methane avoidance (Liquid waste)
Wastewater Methane recovery in wastewater treatment
AMS-III.H. 3/2/2006 183 25%
CDM & VCS
Methane avoidance (Solid waste)
Biogas combustion
Flaring or use of landfill gas ACM0001 9/2/2004 212 50%
CDM & VCS
Methane avoidance (Solid waste)
Biogas combustion
Landfill methane recovery AMS-III.G. 3/2/2006 39 18%
CAR Methane avoidance (Solid waste)
Biogas combustion
U.S Landfill Landfill Project Protocol Version
11/29/2007
146 66%
CDM & VCS
Methane avoidance (Solid waste)
Composting Avoidance of methane production from biomass decay through composting
AMS-III.F. 3/2/2006 47 19%
CDM & VCS
Methane avoidance (Solid waste)
Composting or Other alternative waste treatment
Avoided emissions from organic waste through alternative waste treatment processes
AM0025 9/29/2005 47 15%

32
A low uptake of a bulk part of existing methodologies, in particular under the CDM, may be due to (i) their narrow scope (applicability to very specific technology or practice of methane abatement); (ii) over-conservativeness of resulting emission reduction estimates that reduces the amount of expected revenues as compared to the transaction costs, and (iii) high transaction costs that are associated with applying methodology requirements (e.g., in terms of data requirements, scope of monitored parameters and cost of prescribed monitoring techniques).
As a proxy of the success of MRV under each methodology, Table 7 shows the percentage of projects that have issued carbon credits (final column).34 In other words, it shows the extent to which projects, via MRV, are able to demonstrate their reductions to the satisfaction of the carbon standard.
Main sources of monitoring parameters The input parameters used by the methane-related methodologies have four main sources described in Table 8. Most commonly, methodologies use directly measured parameters or default factors. On the basis of the ten methodologies analyzed, on average almost 60% of parameters are directly monitored.
Table 8: Monitoring parameters and their sources
Parameter Source
Example Generally relies on… Most often used for… Strengths Weaknesses
Direct monitoring
Amount of biogas from an anaerobic reactor, measured by a flow meter
A piece of measuring equipment
Main sources of baseline and project emissions
Accurate Cost of equipment; Capacity of project owner to operate equipment
Default factor
Fraction of fugitive CH4 emissions from an anaerobic reactor
Scientific literature or reputed sector-specific studies
Minor sources of project emissions; Emissions intensity in small-scale projects
Simple Not representative for individual cases
Model
Amount of CH4 avoided at a composting plant that would have otherwise been generated from decaying waste in a landfill
Scientific literature, informed by directly monitored parameters and default factors
Estimation of baseline emissions
Replicable Result only as accurate as the model itself
Sector-wide indicator
Emissions intensity of one MWh from the electricity grid
Sector wide data, preferably in the public domain
Emission reduction through substitution of fossil fuels used by the power grid
Representative for sector-wide emissions levels
Limited availability of data
34
All three standards analyzed here currently issue offsets. Each standard’s offset units have their own
name: CDM issues CERs (Certified Emission Reductions), the VCS issues VCUs (Verified Carbon Units)
and CAR issues CRTs (Climate Reserve Tonnes).
33
Complexity of the MRV requirements This report characterizes each of the ten most-used methodologies by the level of complexity of its MRV requirements.35 The level of complexity was based on factors related to the absolute number and type of input parameters (including the requirement to use separate methodological tools), the availability of default factors that can be used instead of monitorable input, and whether the emissions are concentrated in a small number of large sources or are generated by multiple dispersed small/micro-scale sources. A single large point source is, for example, the outlet of the pipe through which waste gas is collected from a refinery. A source of a dispersed nature comprises, for example, a group of small charcoal kilns or house-hold level biodigesters.
More parameters than typical were considered as more complexity, and vice-versa for more simplicity. Large single sources were considered as being less complex. The following table shows the results, with the methodologies organized from highest to lowest issuance success.
35
Such characterization is an indicative approximate way to analyze complexity and only partially reflects
the barriers of regulatory and operational nature that are briefly discussed below.
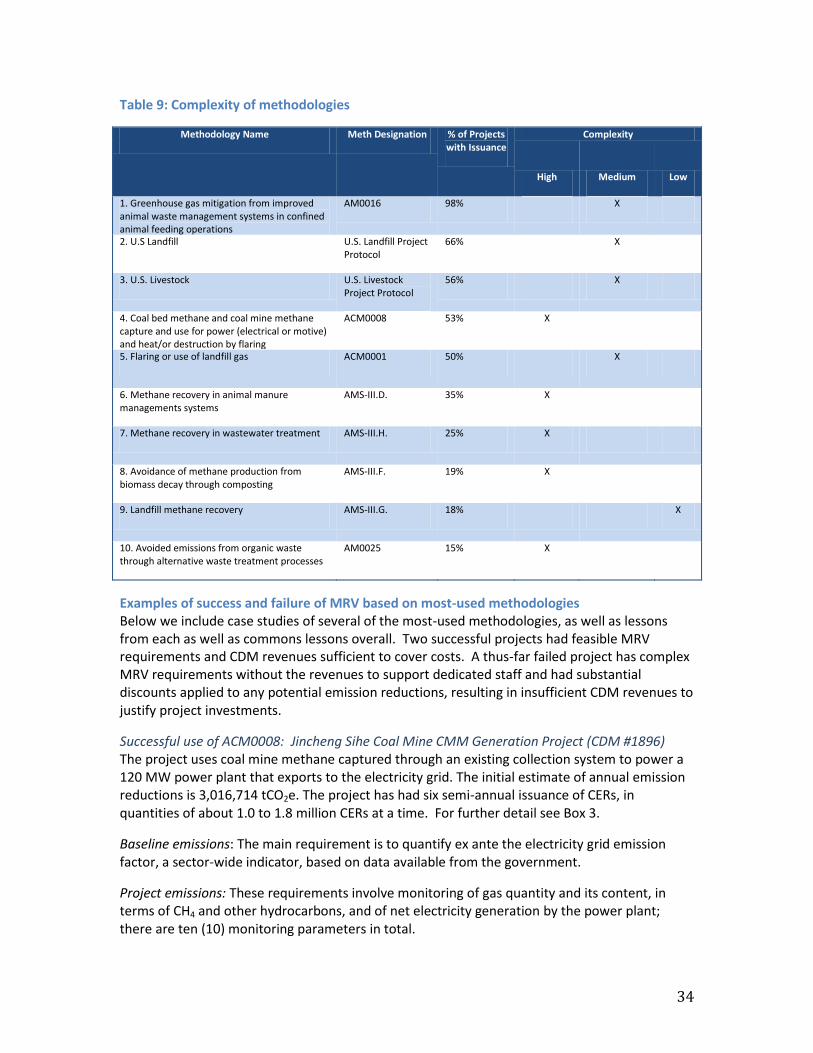
34
Table 9: Complexity of methodologies
Methodology Name Meth Designation % of Projects with Issuance
Complexity
High Medium Low
1. Greenhouse gas mitigation from improved animal waste management systems in confined animal feeding operations
AM0016 98% X
2. U.S Landfill U.S. Landfill Project Protocol
66% X
3. U.S. Livestock U.S. Livestock Project Protocol
56% X
4. Coal bed methane and coal mine methane capture and use for power (electrical or motive) and heat/or destruction by flaring
ACM0008 53% X
5. Flaring or use of landfill gas ACM0001 50% X
6. Methane recovery in animal manure managements systems
AMS-III.D. 35% X
7. Methane recovery in wastewater treatment AMS-III.H. 25% X
8. Avoidance of methane production from biomass decay through composting
AMS-III.F. 19% X
9. Landfill methane recovery AMS-III.G. 18% X
10. Avoided emissions from organic waste through alternative waste treatment processes
AM0025 15% X
Examples of success and failure of MRV based on most-used methodologies Below we include case studies of several of the most-used methodologies, as well as lessons from each as well as commons lessons overall. Two successful projects had feasible MRV requirements and CDM revenues sufficient to cover costs. A thus-far failed project has complex MRV requirements without the revenues to support dedicated staff and had substantial discounts applied to any potential emission reductions, resulting in insufficient CDM revenues to justify project investments.
Successful use of ACM0008: Jincheng Sihe Coal Mine CMM Generation Project (CDM #1896) The project uses coal mine methane captured through an existing collection system to power a 120 MW power plant that exports to the electricity grid. The initial estimate of annual emission reductions is 3,016,714 tCO2e. The project has had six semi-annual issuance of CERs, in quantities of about 1.0 to 1.8 million CERs at a time. For further detail see Box 3.
Baseline emissions: The main requirement is to quantify ex ante the electricity grid emission factor, a sector-wide indicator, based on data available from the government.
Project emissions: These requirements involve monitoring of gas quantity and its content, in terms of CH4 and other hydrocarbons, and of net electricity generation by the power plant; there are ten (10) monitoring parameters in total.
35
Lessons learned: The MRV is simplified by having a single source of emissions in the project and baseline, and relatively simple methodological requirements for project emissions monitoring. The use of special equipment is required for monitoring gas amount, methane content and other hydrocarbon content, but the expected carbon revenues are sufficient to fully cover the cost of purchase and maintenance of such equipment. Furthermore, some monitoring equipment and practices used for the CDM project correspond to the current practices used by the project owner that has sufficient capacity to manage complex monitoring devices.
Successful use of ACM0001: Monterrey II LFG to Energy Project (CDM #2186) The project installed a collection system to capture landfill gas and use this biogas to generate 8.48 MW of electricity, which is exported to the electricity grid. Excess gas is flared. The official estimate of annual emission reductions is 225,323 tCO2e. The project has issued CERs four times, with a total of 655,898 CERs covering approximately 3 years of its crediting period.
Baseline emissions: The project had to calculate an ex-ante estimate of landfill methane generation using a model. The other requirement was to quantify the electricity grid emission factor, a sector indicator, based on data available from the government. This was done ex-ante.
Project emissions: The project monitors gas quantity and its CH4 content, flare efficiency, and net electricity generation by the power plant, using a total of 15 monitoring parameters with 7 pieces of monitoring equipment, which is relatively many. Several of these are for monitoring flare efficiency, which involves measuring quantity and characteristics of the exhaust from the flare.
Lessons learned: The MRV is complex, but the project owner has one staff member whose full time job is managing the CDM monitoring requirements, and this person is supported by a team. This has made it possible to implement the complex monitoring successfully. The methodology provides an option for default flare efficiency of 90% or monitoring of flare efficiency by measuring exhaust gas via highly technical monitoring equipment. The measured flare efficiency is around 99%. Given the CH4 volumes, it was worth it for the project owner to purchase and operate the dedicated monitoring equipment.
Failure in using AMS-III.H.: Methane recovery from wastewater treatment at Dwarikesh Sugar Industries Limited, (CDM #3191) This small-scale project in a distillery that produces industrial alcohol, installed an anaerobic reactor to treat its wastewater. The biogas captured is used as fuel to generate steam for internal use. The new system replaced an open, anaerobic lagoon. The official estimate of annual emission reductions is 9,408 tCO2e. The project was registered in early 2010. Nearly three years later, no monitoring report has been published on the CDM website, so no steps have been made toward issuance of carbon credits.
Baseline emissions: The methodology required monitored data to calculate methane generation by the baseline wastewater treatment system. This included a chemical characteristic that the project owner had never monitored; furthermore the owner installed the project system before he learned of this requirement. The CDM Executive Board required the project owner to submit a request to approve application of an estimated value instead (deviation from the methodology requirements), which resulted in a discount of around 50% to expected emission reductions. Furthermore the time consuming “deviation” process reduced the crediting period for the project by several months.

36
Project emissions: The project includes 15 monitoring parameters including monitoring of methane generation in two different ways, and several other minor emissions sources influenced by the project.
Lessons learned: The methodology required monitoring of many parameters as compared to the expected amount of emission reductions. The redundant monitoring of methane generation meant that the project owner had to pay for and operate both flow meters and methane analyzers for measuring biogas, and flow meters and chemical analysis for wastewater at multiple measuring points. Also, to avoid the purchase of further equipment, optional default factors were applied that likely overestimate project emissions, further discounting the results demonstrated by the project’s MRV.
Main factors for MRV performance at project/program level
Methodology-related factors of MRV performance The main methodology-related factors of MRV performance at project/program level may include: (i) balance between simplicity and adequacy of methodology requirements; (ii) scope of covered types of baseline/project emission and appropriate tools to account for emissions from dispersed sources; and (iii) data requirements.
These factors are considered below in more details.
1. The methodologies with most successful MRV performance contain neither very many, nor very few monitorable parameters ensuring an appropriate balance between simplicity and adequacy of methodology requirements.
This observation is supported by the analysis of the five methodologies with most issuance. The overall complexity of the consolidated methodology for coal bed (mine) methane projects (ACM0008) is reduced at the level of individual projects that are applying only relevant MRV “modules”. For the methodologies analyzed, having 15 or more directly monitored parameters was correlated with poorer MRV results.
On the other hand, unclear monitoring requirements like those on earlier versions of small scale methodologies, such as AMS-III.G that have a priori relatively low complexity, can result in unclear expectations, leading to disagreements among project proponents, auditors and regulatory authority (standards) about the adequacy of monitoring, and hence unsuccessful MRV. Therefore, requirements must be transparent and consistent so that the project owner can understand monitoring requirements before it starts operation.36
2. Methodologies with extensive scope of monitoring parameters may lead to lower issuance success, especially when considering the quantity of directly monitored, project-related parameters.
Several methodologies require the project proponent to monitor many potential sources of baseline/project emissions, including those with low magnitude. Such relatively minor sources may include emissions from fuel use by transportation, supplemental power and heat usage, and the final fate of project material. This results in a high number of monitoring requirements,
36
For example, the unclear requirements in the earlier versions of small-scale methodology AMS-III.G.
induced most registered projects to implement the same monitoring approach as large scale projects.

37
which may be burdensome and lead to lower level of MRV performance (such as for projects using earlier versions AM0025, AMS-III.H and AMS-III.D).
In particular, for projects at small or less sophisticated companies, the cost of complex monitoring equipment and the capacity to undertake technical monitoring may become a major barrier. This impact is even more pronounced in case where the project activity addresses dispersed emission sources. To improve practicability of MRV for such projects, special provisions have been introduced by the CDM such as using sampling with pre-identified requirements for accuracy and precision.
3. Requirements for historical (monitored) data to define baseline emissions may become a barrier, especially for small or less sophisticated companies.
This particular reason, for example, has been one of the factors of failure of using AMS.III-H as described above. Using sector-wide indicators as a conservative proxy for the site-specific data could reduce the data requirements. However, it is important to ensure that designated national/sectoral authorities have necessary tools and capacities to define and timely revise (maintain) such indicators.
Critical factors other than methodology Other factors that exercise critical influence on the final performance of project’ issuance of creditable emission reductions include, for example:
4. National and sectoral enabling infrastructure and capacities
Host countries may not always have adequate infrastructure, regulations or institutional capacity for calibration of monitoring equipment required by monitoring methodologies. Thus, methodologies shall take into account such limitations and allow for progressive improvement while simplifying the initial requirements to reduce the “entry barrier”. The same may be relevant for the national/sector-wide data requirements.
5. Timing of the results based finance & efficiency of MRV cycle
Under existing standards, project proponent is required to support the full costs of the MRV cycle (including verification process) while the carbon revenues are mainly generated ex post37 upon successful verification and issuance. In this context, the predictability and efficiency of the MRV cycle are critical to reduce project risks to an acceptable level. The efficiency of the MRV cycle (e.g., time and cost required to get from the project approval to the issuance of carbon offsets) varies significantly between the standards referred in this note. For example CDM and VCS utilize many of the same methodologies, but the difference in issuance success between the two is substantial (for instance, 35% of 895 methane-related CDM projects are issuing CERs whether for VCS 83% of 152 projects have had successful issuance).38 This may reflect, among other factors, different structure of governance, adequacy of oversight capacities, and approaches used by each standard to maintain environmental integrity to the satisfaction of its main stakeholders.
37
In some instances, the emission reduction purchase contracts include advance payments prior to
registration or issuance of credits. 38
For comparison, 136 (or 54%) of 250 registered projects under CAR are successfully issuing credits.

38
Appendix 4: Stranded projects in the existing carbon offset project pipeline
One guide to the scale of “shovel-ready” projects that could proceed with financing is the number of stranded projects – projects which were started but abandoned with the price collapse in the CDM market. Thus the CDM/JI and VCS portfolio have been screened to assess the number of project activities that entered the pipeline of an existing carbon offset mechanisms, but failed to realize their emission reduction potential. Further, the approximate amount of methane emission reductions (ERs) that could be generated by these projects during the period 2013-2020 has been estimated. A variety of scenarios were analyzed, ranging from only considering compliance grade projects to an inclusive estimate which includes projects using non-typical methodologies and thus facing greater regulatory risk. Table 10 describes these scenarios as well as the number of projects and estimated stranded emission reductions.
Please note that for all scenarios, the CDM projects are contributing at least to 80% of potential ERs. The analysis of the CDM/JI portfolio also indicates that the time-to-market39 expectation by the project proponents is in average about 1.8 years (660 days). This indicator could be used as a proxy for the time required to mobilize new methane abatement projects and getting them ready for delivering ERs.
Table 10: Stranded projects and emission reductions under different scenarios
Scenario Number of Projects
MtCO2e
(2013-2020)
Portion of reductions from CDM
Scenario 1 – Compliance grade
Only CH4 reduction projects already accepted by an existing carbon finance mechanism, applying one of the top 10 used methodologies
566 195 82%
Scenario 2 – Offset grade
All CH4 reduction projects that have officially begun the process to gain approval from an existing finance mechanism, applying one of the top 10 used methodologies
961 483 91%
Scenario 3 – Inclusive
All CH4 reduction projects that have officially begun the process to gain approval from an existing finance mechanism, applying any CH4 reduction methodology
1228 844 85%
Detailed Description of Scenarios Scenario 1 includes all projects that have been accepted by the CDM, JI, VCS and CAR, but that have not yet issued credits, and apply one of the 10 most used CH4 reduction methodologies. Scenario 1 also includes projects in CDM Validation or Request for Registration for which additionality is certain, namely landfill gas flaring projects, since these imply costs but have no
39
Based on the time period between the start of the project and the expected start of the crediting period (as
in the Project Design Document).

39
revenues other than carbon credits. Scenario 1 does not calculate emission reductions from CAR projects since no data are available on estimated emissions for its accepted projects.
Scenario 2 includes all projects from Scenario 1 and added all projects in CDM Validation or Request for Registration that apply one of the 10 most used CH4 reduction methodologies. No further projects from VCS, CAR or JI are added since no equivalent stage to “Validation” exists where public information is readily available. Scenario 2 does not calculate emission reductions from CAR projects since no data are available on estimated emissions for its accepted projects.
Scenario 3 includes all projects that have been accepted by the CDM, JI, VCS and CAR, but that have not yet issued credits, and apply any CH4 reduction methodology. It adds all projects in CDM Validation or Request for Registration that apply any CH4 reduction methodology. Scenario 3 does not calculate emission reductions from CAR projects since no data are available on estimated emissions for its accepted projects.

40
Method
Overview of input criteria Table 11 provides a brief summary of input data used in the analysis of stranded projects.
Table11: Input data for stranded project analysis
CDM JI VCS CAR
Project acceptance criteria Registered Recognized Registered Listed
Cut-off date for project information used in the analysis
25 Jan. 2013 31 Oct. 2012 19 Jan. 2013 19 Jan. 2013
Project data source IGES, UNEP Risoe IGES, UNEP Risoe v-c-s.org Climateactionreserve.org
Crediting Period Renewable (7 years x 3 periods = 21 years potential), or
Fixed (10 years), depending upon project information
All assumed renewable All assumed renewable
All assumed renewable
Basic ER estimate IGES annual average value IGES annual average value “PDD” annual estimate
No values available
Applied methodology As stated in project information
Where applicable, assumed an equivalent CDM methodology based on project type
As stated in project information
As stated in project information
Starting date of crediting Registered projects:
Starting date from CDM website
Projects in Validation:
If no information provided, 1 Jan. 2013
If provided starting date is in the future, provided date.
If provided starting date is in the past, 1 Jan. 2013
Starting date from IGES database
If no information provided, 1 Jan. 2013
If no information provided, 1 Jan. 2013
Removed projects The following projects were removed from consideration since data were too limited:
NZ1000303 RU1000302 PL1000071 PL1000064 PL1000062 PL1000060 PL1000057

41
Assumptions & Discounts Crediting period renewal: A discount of 30% was applied to ERs in each new crediting period, where a renewable crediting period is applied. This discount factor is a best estimate of the proportion of projects that might not be approved when requesting crediting period renewal.
Issuance success: ER estimates were discounted for expected issuance success. An issuance success rate (actual observed issuance / PDD estimate) was calculated for each of the 8 CDM methodologies in the top 10 used methodologies. The rate for the methodology is the average of the rates of all projects that have issued using that methodology (individual project rates calculated by IGES). For methodologies other than these 8 CDM methodologies, the specific CDM methodology rate was applied when available. For all the other methodologies, the issuance success rate considering all other methane reduction methodologies was calculated and applied as a default.
Multiple methodology projects: ER estimates were discounted by 20% to take into account only the CH4 reductions, where projects had more than one component (e.g. methane capture and electricity generation). The 20% value is based on expert judgment; usually in a mixed methane-energy project, the proportion of ERs from CH4 destruction or avoidance represents 80-90% of overall reductions.

42
Appendix 5: PowerPoint Presentations at MFSG Meeting #1, December 19, 2012 GMI Methane Introduction Presentation to MFSG Dr. Billy Pizer Introduction to RBF GPOBA Presentation to MFSG World Bank Lessons from CDM Experience
Appendix 6: PowerPoint Presentations at MFSG Meeting #2, February 7-8, 2013 Review of RBF Concepts and Tools for Methane GMI Methane Project Cycle MRV Methodologies for Methane Dr. Billy Pizer QPI and Auctioning Land Bank of the Philippines Experience with Financing Waste Management Projects
1
Barriers to Methane Mitigation and the Role of Finance
World Bank Methane Finance Study Group: First Meeting
December 19, 2012
U.S. Environmental Protection Agency
2 2
Agenda
Overview of Methane Sources and Global Methane
Initiative
Agriculture
Coal Mining
Landfills
Oil and Natural Gas Systems
Wastewater
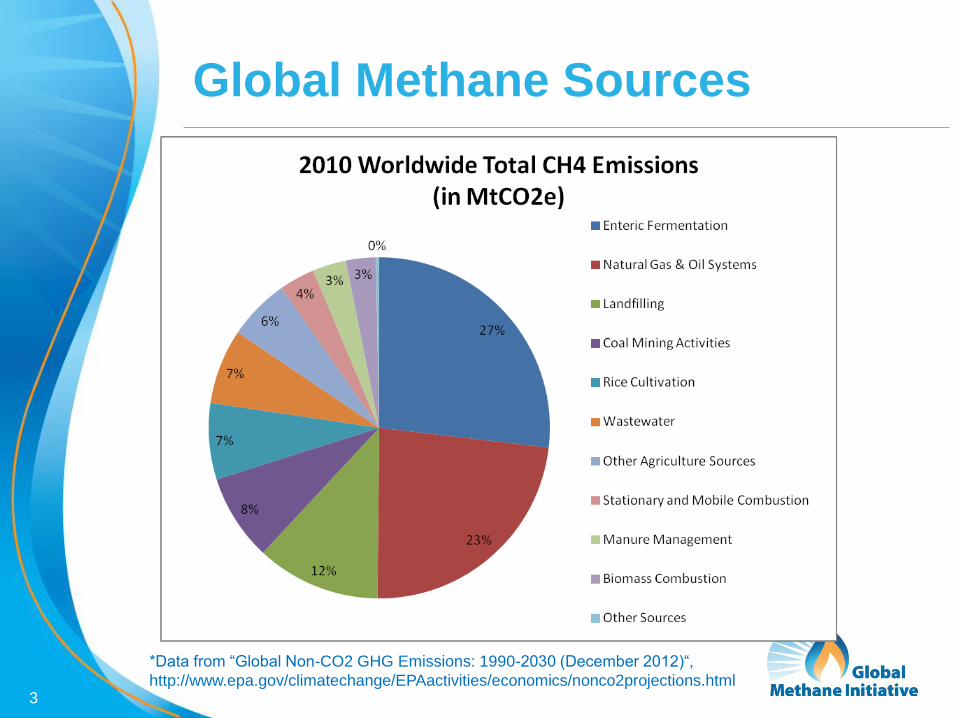
3
Global Methane Sources
3
*Data from “Global Non-CO2 GHG Emissions: 1990-2030 (December 2012)“,
http://www.epa.gov/climatechange/EPAactivities/economics/nonco2projections.html

4 4
Global Methane Initiative
• 42 Partner
Governments
• Nearly 70% global
anthropogenic
methane emissions
• 10 top methane
emitting countries
• Project Network:
over 1,000 private
companies,
multilateral
development banks
and other relevant
organizations
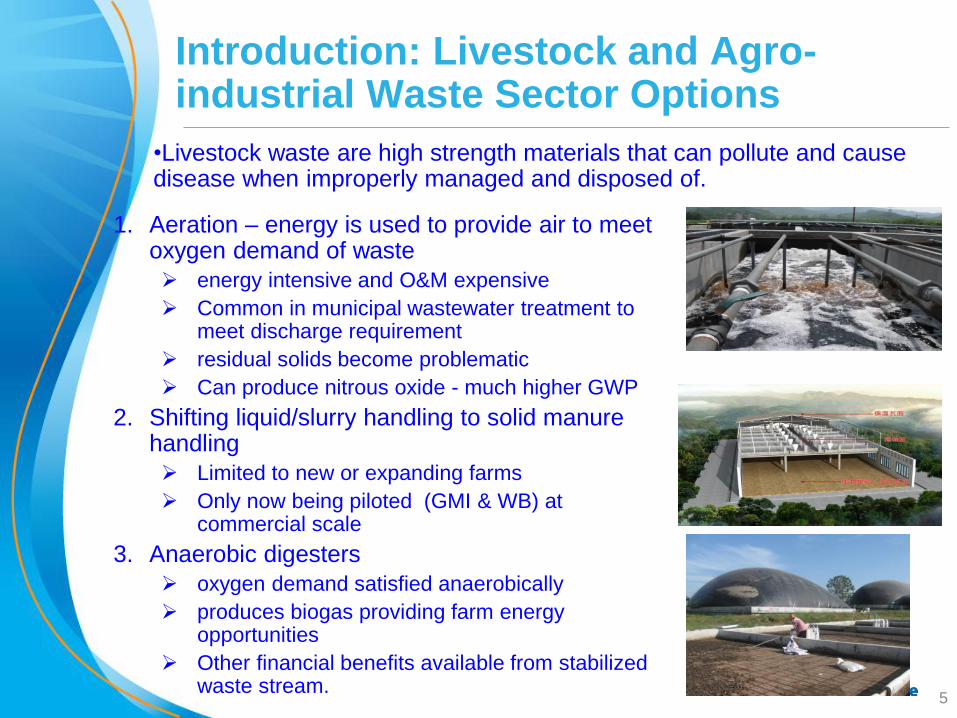
5 5
Introduction: Livestock and Agro-industrial Waste Sector Options
1. Aeration – energy is used to provide air to meet oxygen demand of waste
energy intensive and O&M expensive
Common in municipal wastewater treatment to meet discharge requirement
residual solids become problematic
Can produce nitrous oxide - much higher GWP
2. Shifting liquid/slurry handling to solid manure handling
Limited to new or expanding farms
Only now being piloted (GMI & WB) at commercial scale
3. Anaerobic digesters
oxygen demand satisfied anaerobically
produces biogas providing farm energy opportunities
Other financial benefits available from stabilized waste stream.
•Livestock waste are high strength materials that can pollute and cause disease when improperly managed and disposed of.

6 6
Barriers: Livestock and Agro-industrial Waste
FINANCE: High cost hurdles and lack of financing access.
TECHNICAL: Lack of appropriate technology choices and/or
capacity and equipment availability to replicate.
Many large and small scale failures, overbuilt and too
expensive often foreign provided.
AWARENESS: Lack of appropriate technology and market
opportunities where available.
REGULATORY AND ENERGY POLICY: Lack of enforcement on
discharge standards in the large scale waste sector.
BOD/COD, N, P, and sometimes odor and Fecal coliform
Some treatment processes can produce nitrous (GWP 310)
Unfavorable energy or utility policies.
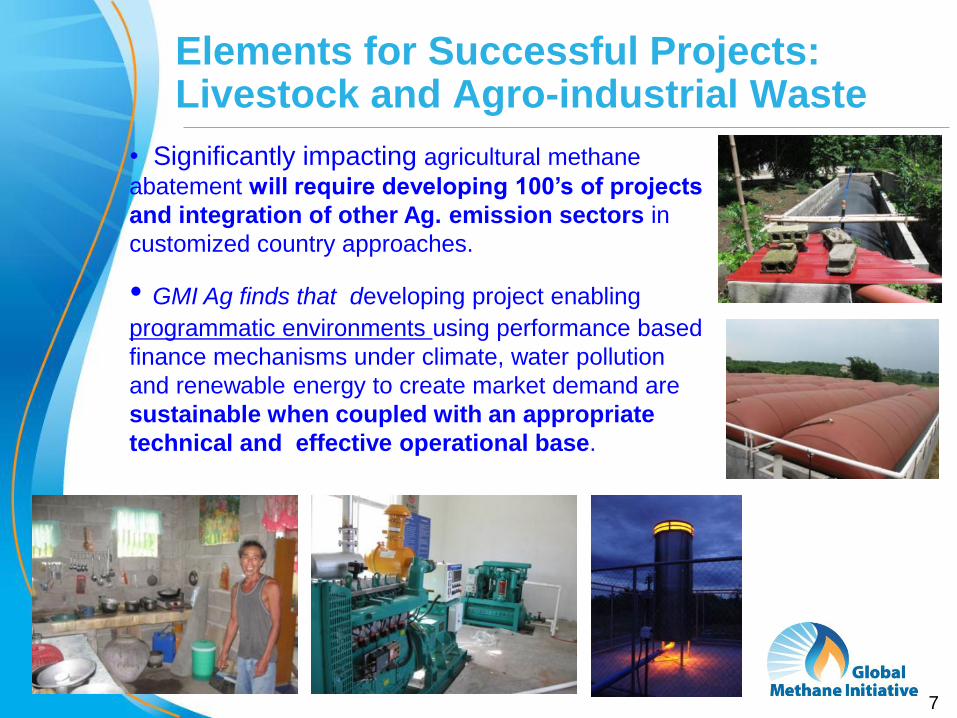
7 7
Elements for Successful Projects: Livestock and Agro-industrial Waste
• Significantly impacting agricultural methane
abatement will require developing 100’s of projects
and integration of other Ag. emission sectors in
customized country approaches.
• GMI Ag finds that developing project enabling
programmatic environments using performance based
finance mechanisms under climate, water pollution
and renewable energy to create market demand are
sustainable when coupled with an appropriate
technical and effective operational base.
8 8
Coal Mines: Introduction Gas drained from active/abandoned underground mines (largest emission
source) abandoned mines, surface mines
Methane liberated includes emissions from ventilation and degas systems Degas systems employ vertical / horizontal wells to recover methane in advance of
mining / after mining. Gas is destroyed or captured for utilization via wells.
Ventilation systems move vast quantities of air through the mine, into shafts leading to
the surface. VAM can be destroyed or captured for utilization.
End uses include: Pipeline gas (high-quality)
Power gen, CHP, boiler and dryer fuel (medium-quality)
Lean-burn turbines, oxidation (VAM)
More than 220 CMM projects worldwide in 14 countries, avoid around 3.8 billion
cubic meters of methane emissions every year
One CMM project at one mine has the potential to reduce emissions by as much
as 7 to 70 million cubic meters
Lifecycle Costs:
Average costs range from $9-30 million USD
50% of projects pay back investment in 3 yrs (most < 5yrs)
Significant improvement in operational safety and productivity; gas displaces
other fossil fuel use

9 9
Coal Mines: Barriers to Project Implementation
Informational and Cultural Barriers
– Absence of inventory and assessment of resources
– Lack of awareness of mitigation options
– Lack of mine expertise in gas recovery
– Industry resistance to new practices
Technical Barriers
– Lack of on-the-ground experience in project development and
technology use
– Pre-mine drainage efficiency
– Project development, construction and operational risks
Financial / Regulatory Barriers
– Gas prices
– Carbon prices
– Distributed power prices
– Ownership issues
10 10
Coal Mines: Key Elements for Successful Projects
Requires commitment and strong management team to plan
and implement
Available markets for recovered energy
Favorable regulatory regime
Financial incentives
Robust carbon market
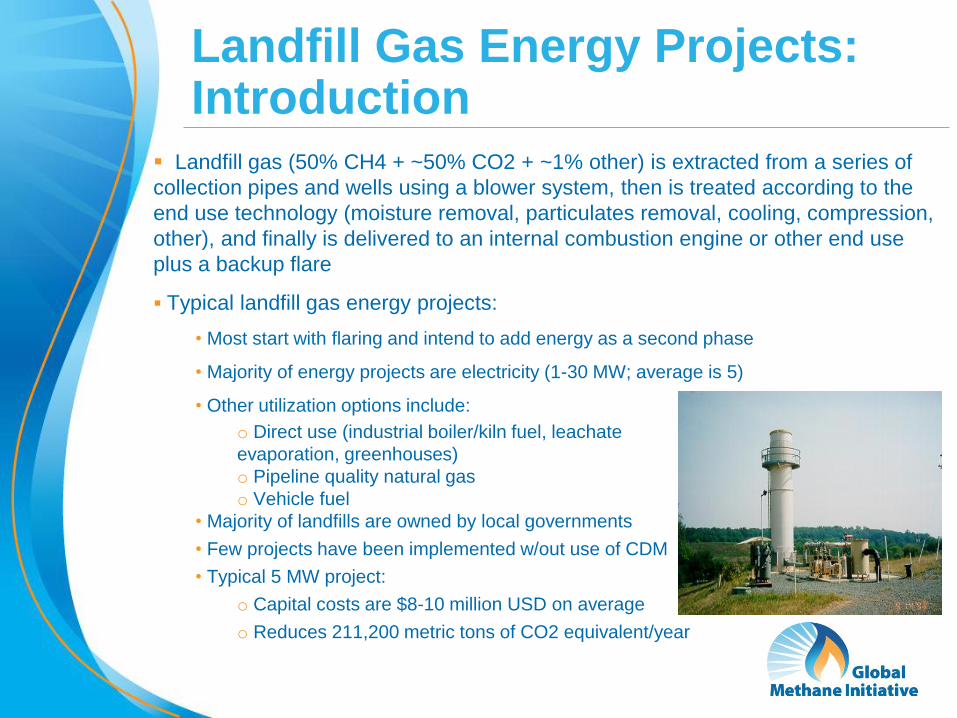
11
Landfill Gas Energy Projects: Introduction
Landfill gas (50% CH4 + ~50% CO2 + ~1% other) is extracted from a series of
collection pipes and wells using a blower system, then is treated according to the
end use technology (moisture removal, particulates removal, cooling, compression,
other), and finally is delivered to an internal combustion engine or other end use
plus a backup flare
Typical landfill gas energy projects:
• Most start with flaring and intend to add energy as a second phase
• Majority of energy projects are electricity (1-30 MW; average is 5)
• Other utilization options include:
o Direct use (industrial boiler/kiln fuel, leachate
evaporation, greenhouses)
o Pipeline quality natural gas
o Vehicle fuel
• Majority of landfills are owned by local governments
• Few projects have been implemented w/out use of CDM
• Typical 5 MW project:
o Capital costs are $8-10 million USD on average
o Reduces 211,200 metric tons of CO2 equivalent/year
12 12
LFG Energy: Barriers to Project Implementation
Informational and Cultural Barriers • Private landfills have unrealistic expectations of profitability of projects
• Municipal governments have short-term political will to plan and execute
projects (mayoral terms of 3-4 years)
• Lack of awareness of technologies other than electricity
Technical Barriers • Municipal governments don’t have technical capacity to operate & maintain a
project after its implemented
• Most sites are not sanitary landfills – leads to less methane production, low
collection efficiencies, & increased project costs
Financial Barriers • Municipalities have limited financial resources, don’t charge tipping fees
• Private developers want 2-3 yr paybacks – not conducive to municipal cycle
Regulatory/Policy Barriers • Unfavorable energy or utility policies/regulations
• Lack of laws requiring sanitary landfills
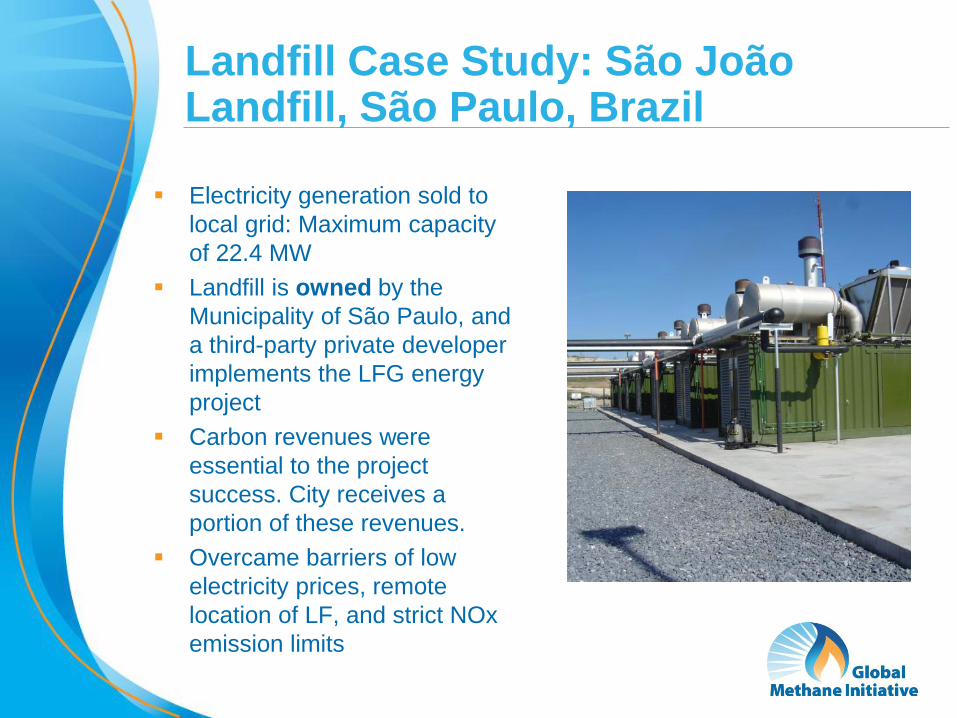
13
Landfill Case Study: São João Landfill, São Paulo, Brazil
Electricity generation sold to
local grid: Maximum capacity
of 22.4 MW
Landfill is owned by the
Municipality of São Paulo, and
a third-party private developer
implements the LFG energy
project
Carbon revenues were
essential to the project
success. City receives a
portion of these revenues.
Overcame barriers of low
electricity prices, remote
location of LF, and strict NOx
emission limits

14 14
Oil and Gas: Introduction Second largest source of man-made methane emissions globally
– Over 4,200 Bcf (120 Bcm) of natural gas lost annually
– $12 to $29 billion lost revenues
– 1,595 MMTCO2e
Entire natural gas value chain and upstream oil production Leaks/fugitives, Process (engineered) venting, System upsets
Over 60 mitigation technologies and practices to reduce natural gas losses – Enhanced maintenance practices
– Retrofits of existing equipment
– Capital projects introducing new equipment/processes
Aggregated projects can reduce 5,000 – 170,000 tCO2e at cost of
$30,000 to $675,000; <$1 to $6/tCO2e reduced 50% of projects pay back investment in <1 year ($3/Mcf gas)
Significant improvement in operational safety

15 15
Oil and Gas: Barriers to Project Implementation
Informational and Cultural Barriers – Absence of specific data on emissions sources and volumes (corporate)
– Lack of awareness of mitigation options
– Industry perception of venting as “minimal” and gas as a “waste product”
– Resistance to implementing change in operations
Technical Barriers – No productive use for captured gas (for associated gas with no market)
– Limited availability of service providers, success stories in-country
Financial Barriers – Low gas prices (artificially or market-based)
– Low EH&S budgets, competition for limited resources
– Inability of corporate accounting to recognize economic value of saved
gas/added revenues
– Distorted payback expectations in oil and gas industry (don’t see a $1MM
NPV project as meaningful)
Barriers to Receiving Carbon Credit – Labor intensive process for establishing baseline and verifying reductions
(less so for discrete projects)
– Uncertainty whether company was flaring vs. venting prior to project
implementation
– Cost-effectiveness of projects (if additionality principle applies)
16 16
Oil and Gas: Case Studies/Key Elements for Successful Projects
Voluntary oil and gas projects typically implemented based on
environmental and safety benefits and value of saved gas
Drivers for project implementation include – Knowledge of methane sources and levels (e.g. source-specific inventories)
– Mandate/commitment by management
– Policy drivers can encourage project implementation (e.g. Indonesia)
– Projects typically financed internally
Carbon markets can encourage implementation – Projects where gas has no economic value (ie. no market/use)
– Developing a market and/or accessibility to a market should also be a priority
– Marginal projects with unfavorable economics
Considerations for carbon financing for oil and gas sector – Consider possibility of “technical additionality”
– Projects tend to be smaller (10K-100K TCO2e)
– Ease administrative burden
– Consider programmatic options to group related activities
(eg. efforts to reduce emissions from all compressors)
17
Wastewater: Introduction Wastewater treatment accounts for about 9 percent of
methane emissions, over 618 million MMTCO2e in 2010.
Renewable source of biogas, consistent production 24/7
over lifetime of WW infrastructure.
Methane from wastewater biogas can be used for: Electricity
generation, Fueling vehicle fleets, Gas distribution systems,
Backup power, Combined heat and power (CHP)
Wastewater treatment is highly energy intensive,
representing one of the highest costs to operation of
treatment facilities. Biogas utilization offers opportunity to
offset these costs increasing viability of these systems.
Increasing WW treatment coverage in developing nations is
a major focus of MDBs and national governments.
Opportunity exists to incorporate methane mitigation and
utilization from early stages of project development.

18
Wastewater: Barriers to Project Implementation
High costs of recovery and use technologies and
lack of access to financing
Unfavorable energy or utility policies
Lack of data on emissions produced within the
wastewater sector
Few examples of CDM as project driver in this
sector
Lack of expertise or awareness of recovery and
use technologies and practices
Lack of enforcement of existing wastewater
effluent discharge standards.

19
Wastewater Case Study: La Farfana WWTP Santiago, Chile
La Farfana WWTP treats
more than 60 percent of
the wastewater in Santiago
Biogas from biosolid
digesters upgraded to town
gas quality
Treated gas distributed
locally
Expected to yield
reductions of 26,000
tonnes of CO2e annually
Total Investment (USD):
$3,500,000
La Farfana Wastewater Treatment Plant,
registered as a Clean Development
Mechanism (CDM) project in 2011.
Project drivers: Energy demand from both industrial
and residential end-users and limited domestic
natural gas resources.
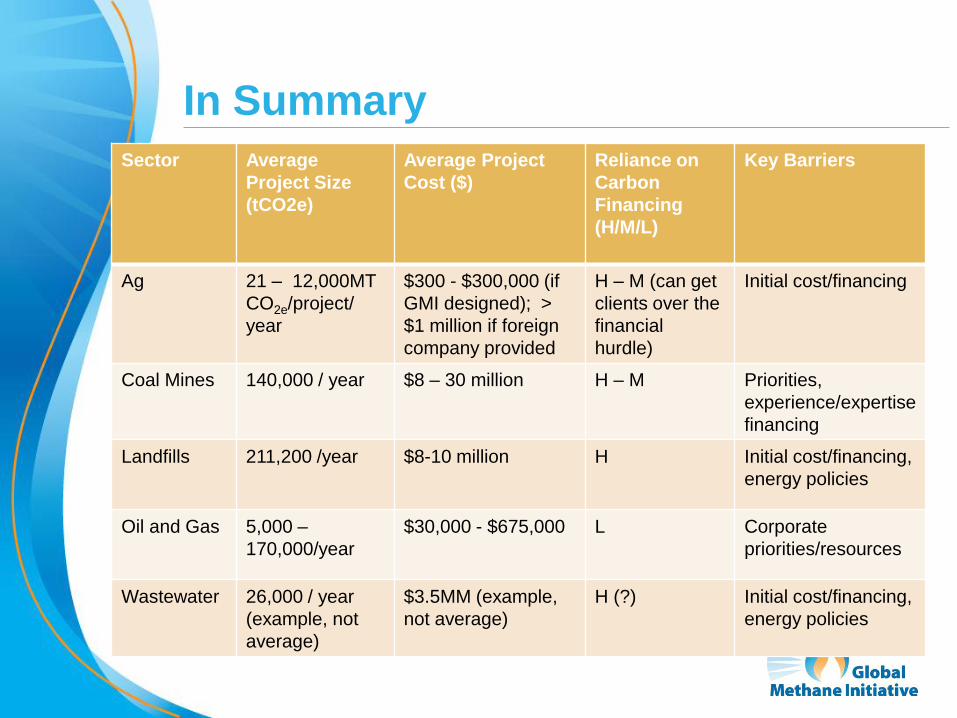
20
In Summary
Sector Average
Project Size
(tCO2e)
Average Project
Cost ($)
Reliance on
Carbon
Financing
(H/M/L)
Key Barriers
Ag 21 – 12,000MT
CO2e/project/
year
$300 - $300,000 (if
GMI designed); >
$1 million if foreign
company provided
H – M (can get
clients over the
financial
hurdle)
Initial cost/financing
Coal Mines 140,000 / year $8 – 30 million H – M
Priorities,
experience/expertise
financing
Landfills 211,200 /year $8-10 million H Initial cost/financing,
energy policies
Oil and Gas 5,000 –
170,000/year
$30,000 - $675,000 L Corporate
priorities/resources
Wastewater 26,000 / year
(example, not
average)
$3.5MM (example,
not average)
H (?) Initial cost/financing,
energy policies

21
Summary: Common Barriers
Data gaps with respect to emission levels
Lack of awareness about reduction options
Availability of experience and technical
expertise
Project costs and availability of financing
(either due to lack of resources or directing
resources to other projects)
Low gas or carbon prices
Unfavorable energy or utility policies – Ag, Landfill, Wastewater
22
Contact Information – US EPA
Kurt Roos
Agricultural Methane Programs
202 343-9041, [email protected]
Felicia A. Ruiz
Coalbed Methane Outreach Program (CMOP)
(202) 343-9129, [email protected]
Victoria Ludwig
EPA Landfill Methane Outreach Program
Phone: (202) 343-9291, [email protected]
Carey Bylin
GMI Oil and Gas
+1-202-343-9669, [email protected]
Christopher Godlove
EPA Landfill Methane Outreach Program, GMI Waste Water Sector
Phone: (202) 343-9795, [email protected]
www.globalmethane.org 22

Results Based Finance
Billy Pizer

Traditional versus QPI project finance “Q”uantity “P”erformance “I”instrument
• Features of traditional project finance by public sector
• Features of QPI project finance by public sector
– measurement
Ex ante versus ex post QPI contracting
• Risk sharing.
• Contracting & performance.

Overview of QPI models
• Direct purchase
• Top-up instrument
• Tradable put options
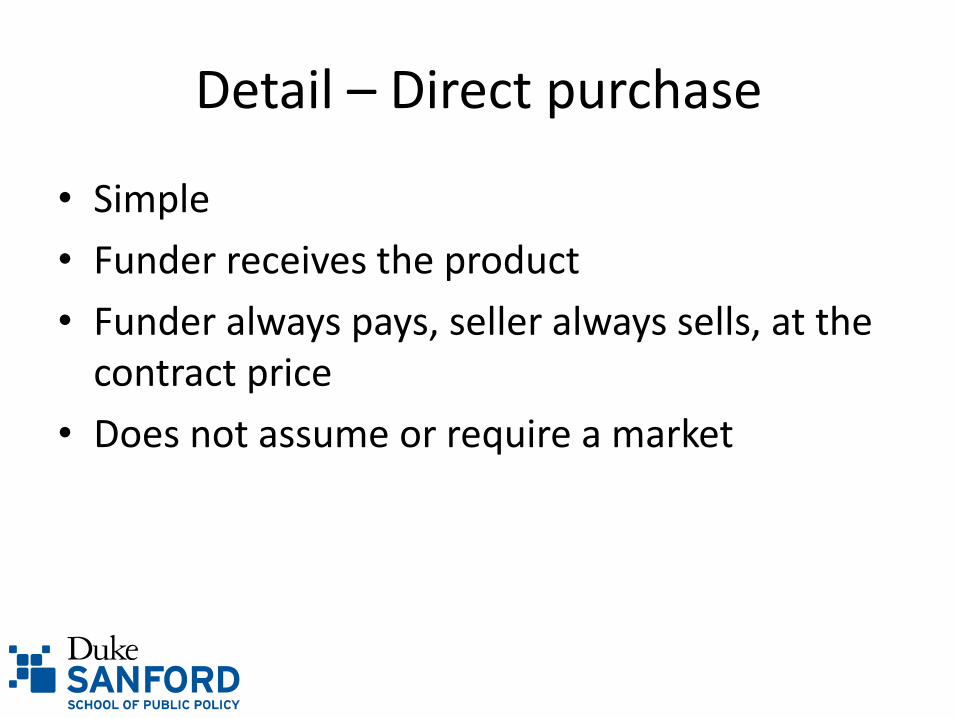
Detail – Direct purchase
• Simple
• Funder receives the product
• Funder always pays, seller always sells, at the contract price
• Does not assume or require a market
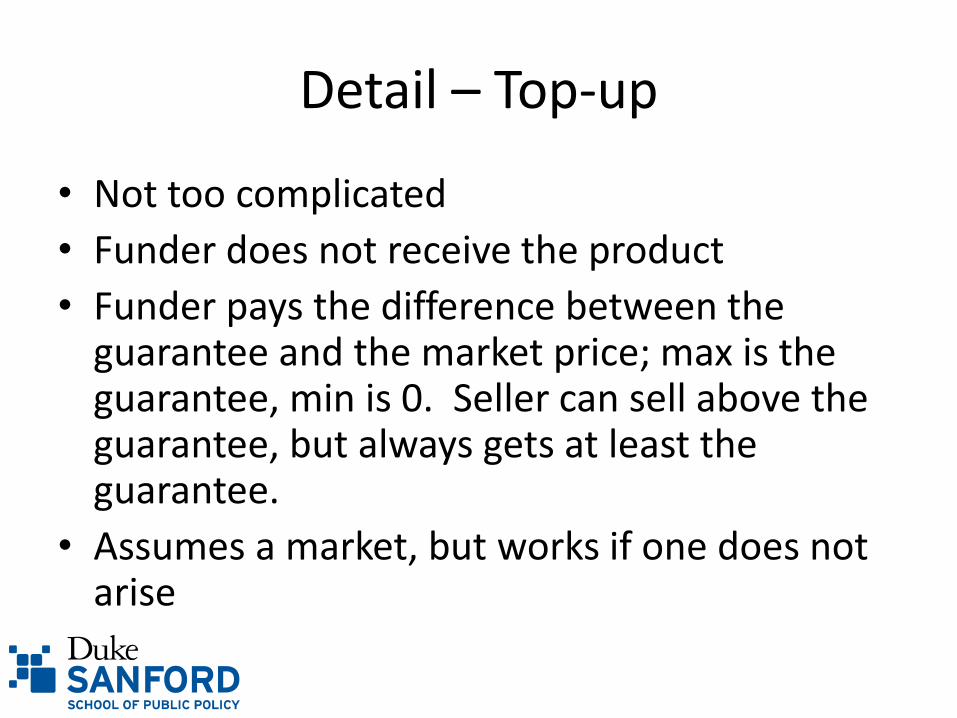
Detail – Top-up
• Not too complicated
• Funder does not receive the product
• Funder pays the difference between the guarantee and the market price; max is the guarantee, min is 0. Seller can sell above the guarantee, but always gets at least the guarantee.
• Assumes a market, but works if one does not arise

Detail – Put option
• Most complicated
• Funder may or may not receive the product
• Funder pays the difference between the guarantee and the market price; max is the guarantee, min is 0. Seller can sell above the guarantee, but always gets at least the guarantee.
• Assumes a market, but works if one does not arise
***contracts can be traded***
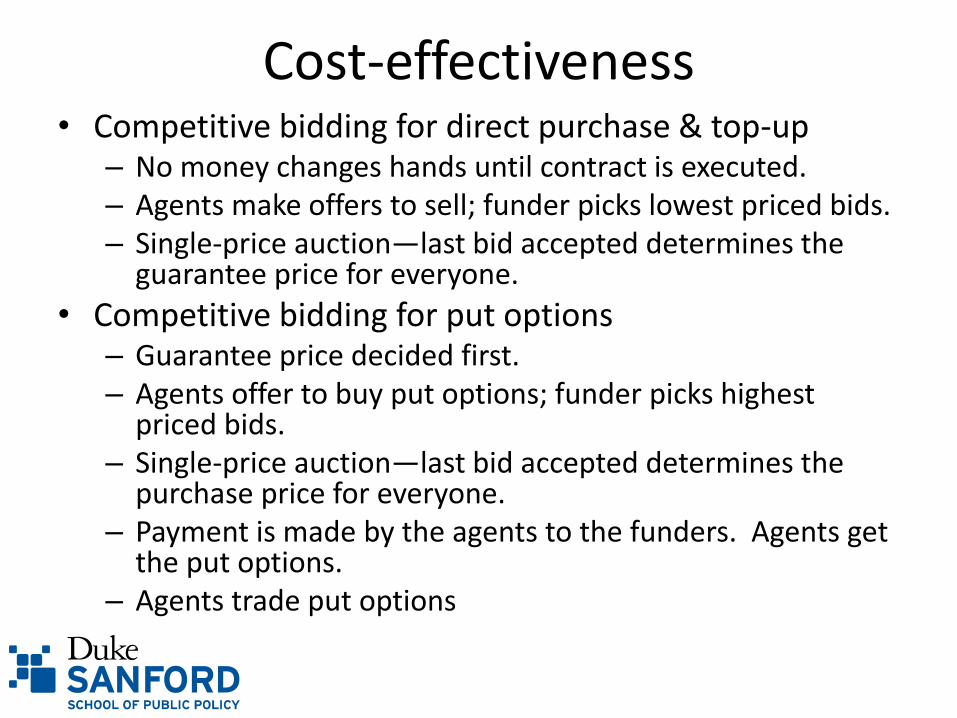
Cost-effectiveness • Competitive bidding for direct purchase & top-up
– No money changes hands until contract is executed. – Agents make offers to sell; funder picks lowest priced bids. – Single-price auction—last bid accepted determines the
guarantee price for everyone.
• Competitive bidding for put options – Guarantee price decided first. – Agents offer to buy put options; funder picks highest
priced bids. – Single-price auction—last bid accepted determines the
purchase price for everyone. – Payment is made by the agents to the funders. Agents get
the put options. – Agents trade put options
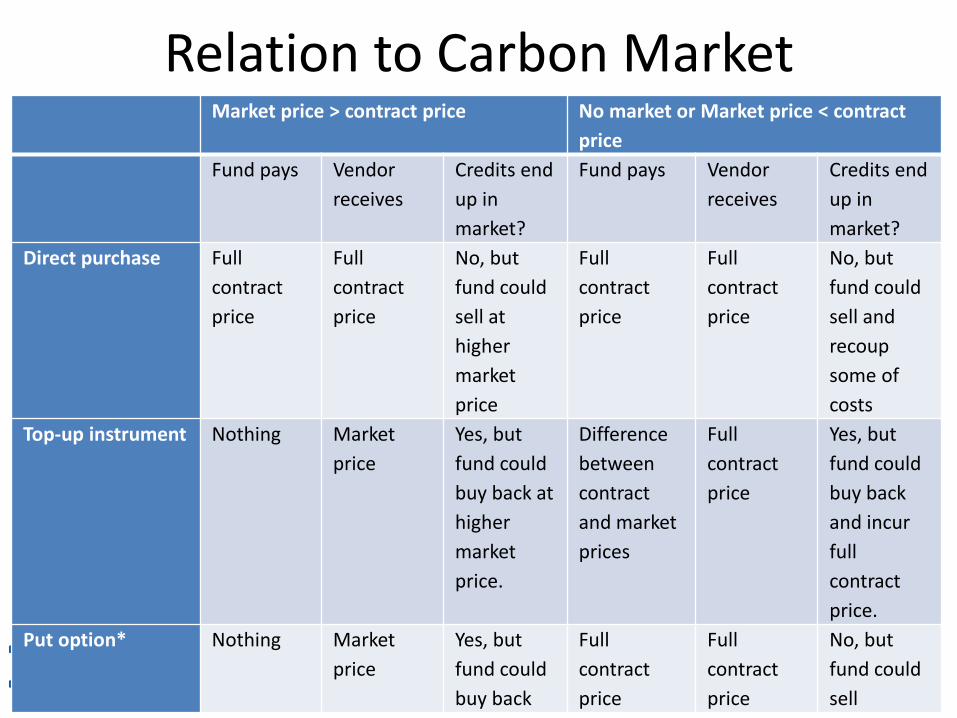
Relation to Carbon Market Market price > contract price No market or Market price < contract
price
Fund pays Vendor
receives
Credits end
up in
market?
Fund pays Vendor
receives
Credits end
up in
market?
Direct purchase Full
contract
price
Full
contract
price
No, but
fund could
sell at
higher
market
price
Full
contract
price
Full
contract
price
No, but
fund could
sell and
recoup
some of
costs
Top-up instrument Nothing Market
price
Yes, but
fund could
buy back at
higher
market
price.
Difference
between
contract
and market
prices
Full
contract
price
Yes, but
fund could
buy back
and incur
full
contract
price.
Put option* Nothing Market
price
Yes, but
fund could
buy back
Full
contract
price
Full
contract
price
No, but
fund could
sell

Other issues
• Credits retired or sold into the market.
• Who claims credit.
• Non-performance.
• Balance and adequacy.
• Application to methane.

Introducing Output-Based Aid:
Core Concepts
and Project Design
Iain Menzies
Senior Infrastructure Specialist, GPOBA Methane Finance Study Group, 19 December 2012
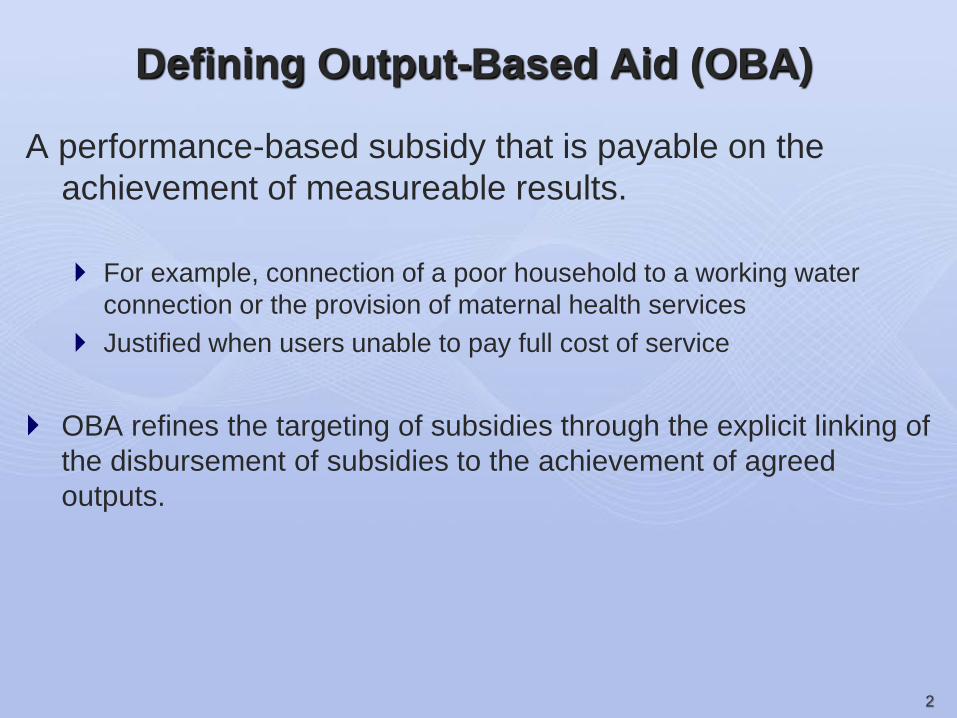
Defining Output-Based Aid (OBA)
A performance-based subsidy that is payable on the
achievement of measureable results.
For example, connection of a poor household to a working water
connection or the provision of maternal health services
Justified when users unable to pay full cost of service
OBA refines the targeting of subsidies through the explicit linking of
the disbursement of subsidies to the achievement of agreed
outputs.
2
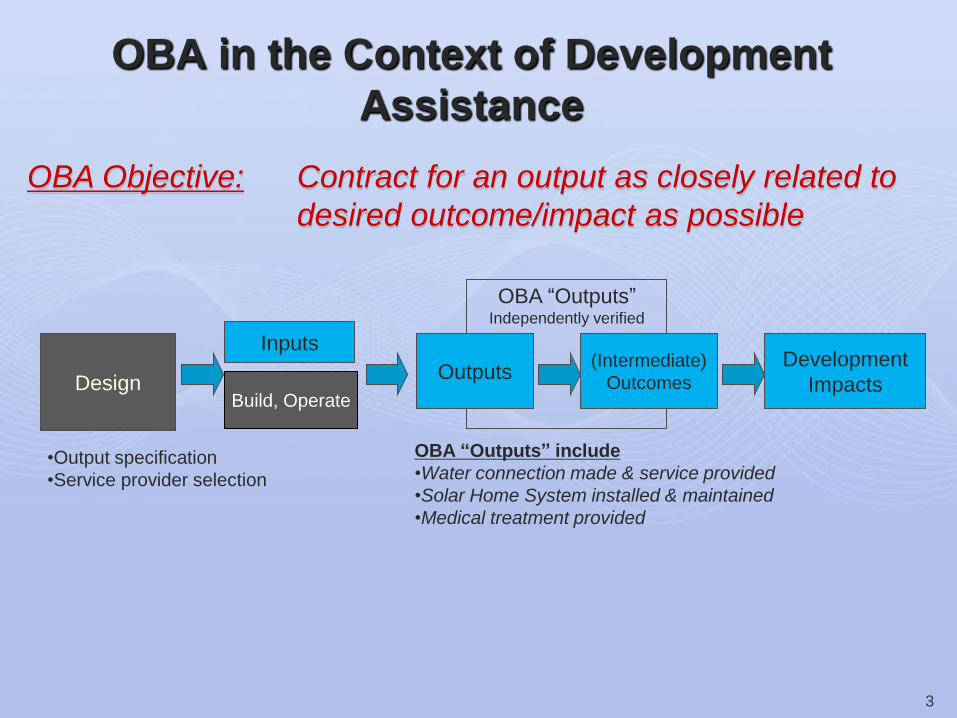
OBA in the Context of Development
Assistance
OBA Objective: Contract for an output as closely related to
desired outcome/impact as possible
Design Development
Impacts
(Intermediate)
Outcomes Outputs
Build, Operate
•Output specification
•Service provider selection
OBA “Outputs” include
•Water connection made & service provided
•Solar Home System installed & maintained
•Medical treatment provided
OBA “Outputs” Independently verified
Inputs
3
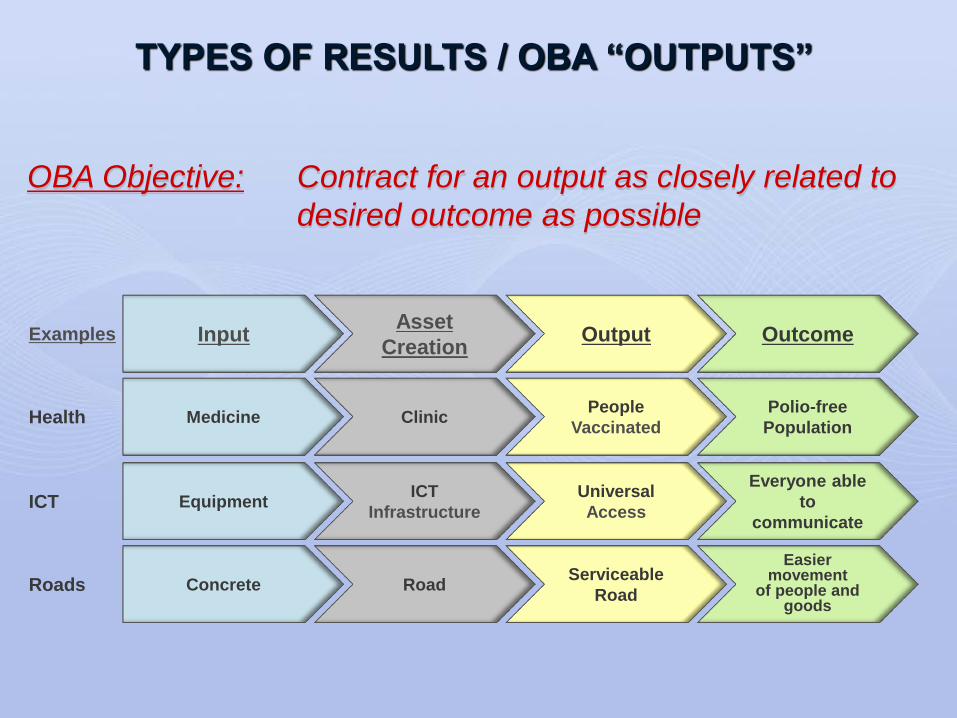
TYPES OF RESULTS / OBA “OUTPUTS”
OBA Objective: Contract for an output as closely related to
desired outcome as possible
Input Asset
Creation Output
Medicine Clinic People
Vaccinated
Equipment ICT
Infrastructure
Universal
Access
Concrete Road Serviceable
Road
Examples
Health
ICT
Roads
Outcome
Polio-free
Population
Everyone able
to
communicate
Easier movement
of people and goods

Contracting for Services – Comparison of
Traditional and OBA Approaches
Inputs (such as materials)
Public
Finance
Inputs (such as materials)
Service
Provider
Service
Provider
Commercially
Structured
Finance
Outputs
(Services for End Users)
Outputs
(Services for End Users) OBA reimburses the service provider
after the delivery of outputs.
Government purchases specific
“inputs”, builds assets and contracts
out or provides services itself
Output-Based
Approach
Traditional
Approach
5
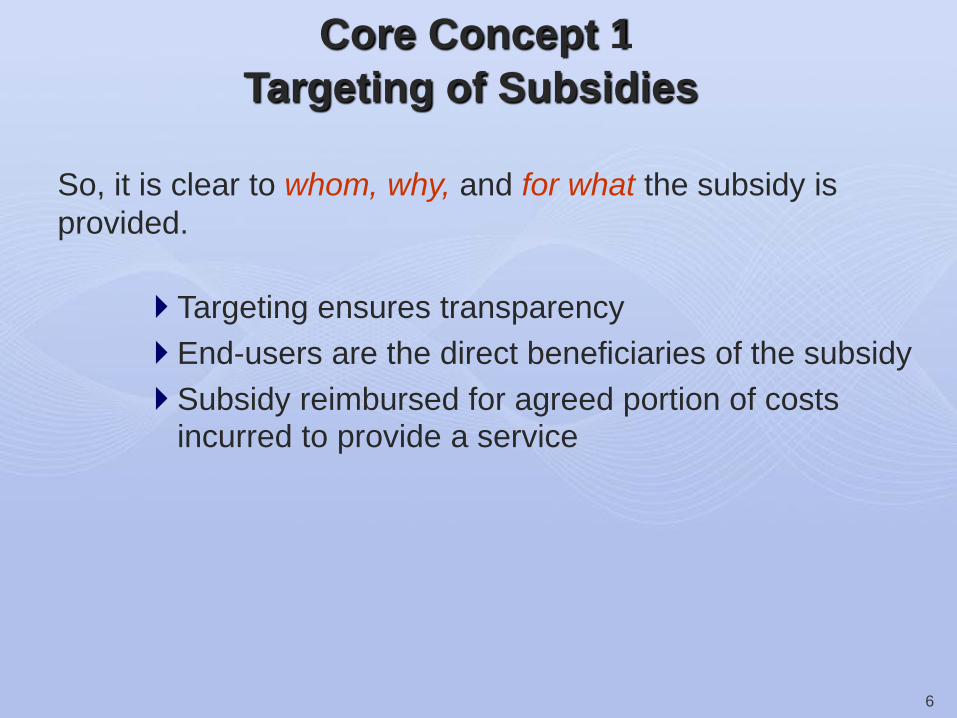
Core Concept 1
Targeting of Subsidies
So, it is clear to whom, why, and for what the subsidy is
provided.
Targeting ensures transparency
End-users are the direct beneficiaries of the subsidy
Subsidy reimbursed for agreed portion of costs incurred to provide a service
6

Targeting of subsidies
A combination of income-level and geographic targeting used to connect
poor households in the lowest-income strata with natural gas service on
the Caribbean coast in Colombia.
7

Core Concept 2
Accountability
Service provider is accountable for results, and incurs a
“penalty” if results are not achieved.
Service provider takes both performance and
finance risks
Service provider is reimbursed after delivery of
agreed and verified output to targeted end-users
(i.e. the “subsidy”)
8

Accountability
9
In Lesotho, GPOBA is supporting a PPP for a hospital that replaces the main
referral hospital of the country. The GPOBA project also includes support for
filter clinics that provide relatively basic services to the poor.
The service provider is only reimbursed after providing services in both the
hospital and the filter clinics.

Predetermined “subsidy” in the form of a reimbursement
paid on agreed outputs instead of inputs.
Service “solutions” are partly left to the service
provider to encourage innovation
Efficiency achieved through competition (for new
services) or benchmarking leading to value-for-money
Core Concept 3
Innovation & Efficiency
10

Innovation & Efficiency
In Uganda, a competitive bidding process to provide
water supply resulted in an average efficiency gain of
20% in 10 towns.
11
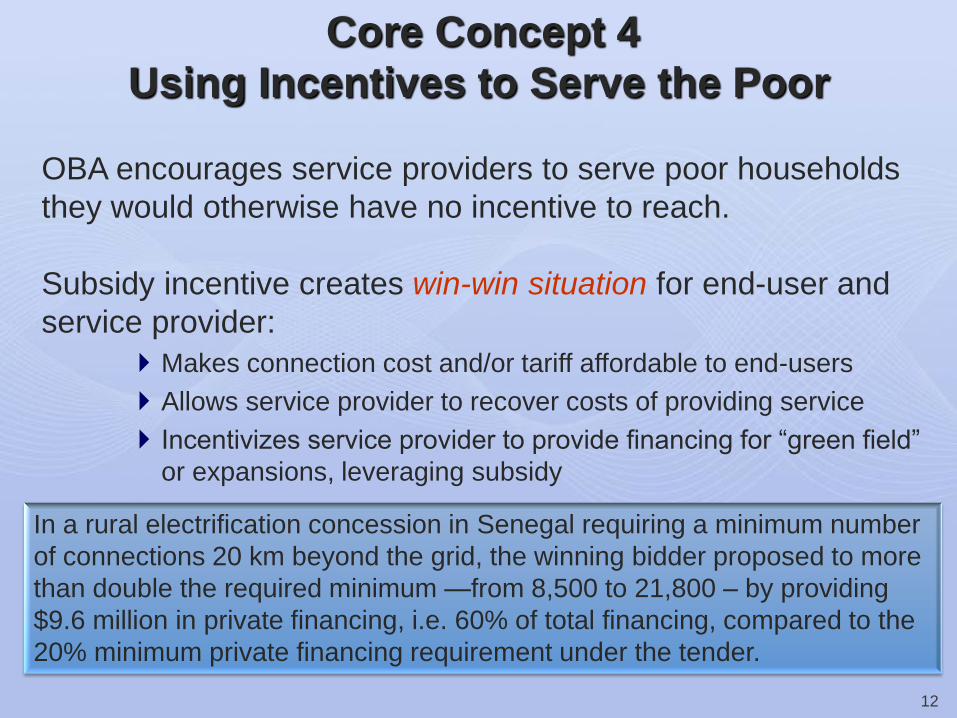
OBA encourages service providers to serve poor households
they would otherwise have no incentive to reach.
Subsidy incentive creates win-win situation for end-user and
service provider:
Makes connection cost and/or tariff affordable to end-users
Allows service provider to recover costs of providing service
Incentivizes service provider to provide financing for “green field”
or expansions, leveraging subsidy
Core Concept 4
Using Incentives to Serve the Poor
In a rural electrification concession in Senegal requiring a minimum number
of connections 20 km beyond the grid, the winning bidder proposed to more
than double the required minimum —from 8,500 to 21,800 – by providing
$9.6 million in private financing, i.e. 60% of total financing, compared to the
20% minimum private financing requirement under the tender.
12

The (ongoing) monitoring of outputs (or results) is easier and
more precise in an OBA as the subsidy payment reimburses
the service provider only after outputs are verified.
Core Concept 5
Output Verification & Monitoring
13

Output Verification & Monitoring
In Vietnam, a project to provide safe drinking water for 75
locally managed, village-based piped water schemes,
disburses 80% of subsidy on verification of connection
and 20% after 6 months of satisfactory service. 14
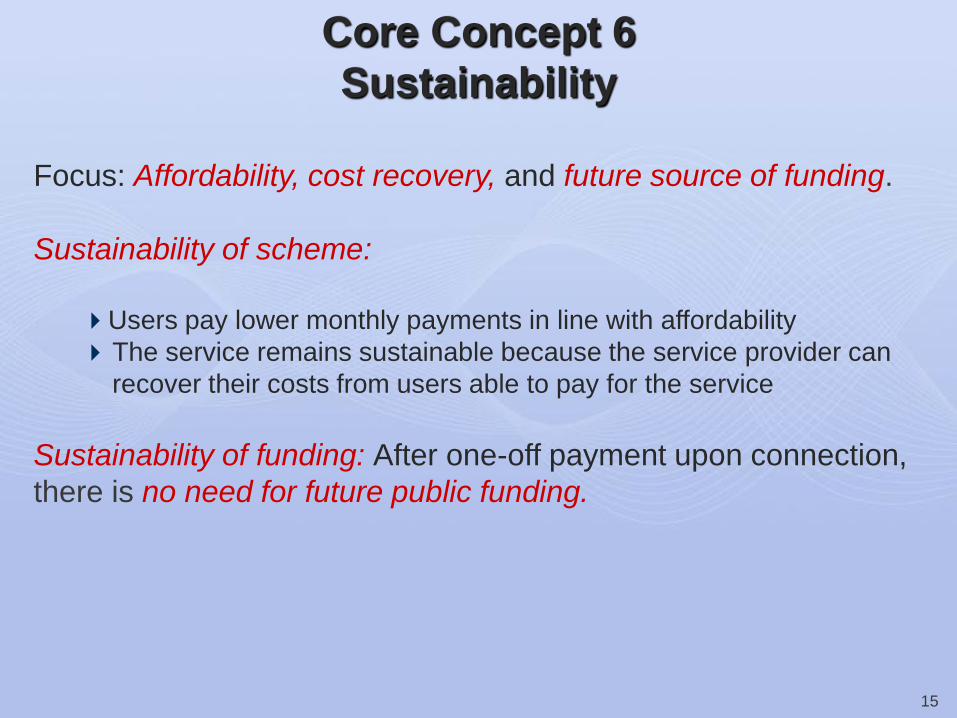
Focus: Affordability, cost recovery, and future source of funding.
Sustainability of scheme:
Users pay lower monthly payments in line with affordability
The service remains sustainable because the service provider can
recover their costs from users able to pay for the service
Sustainability of funding: After one-off payment upon connection,
there is no need for future public funding.
Core Concept 6
Sustainability
15
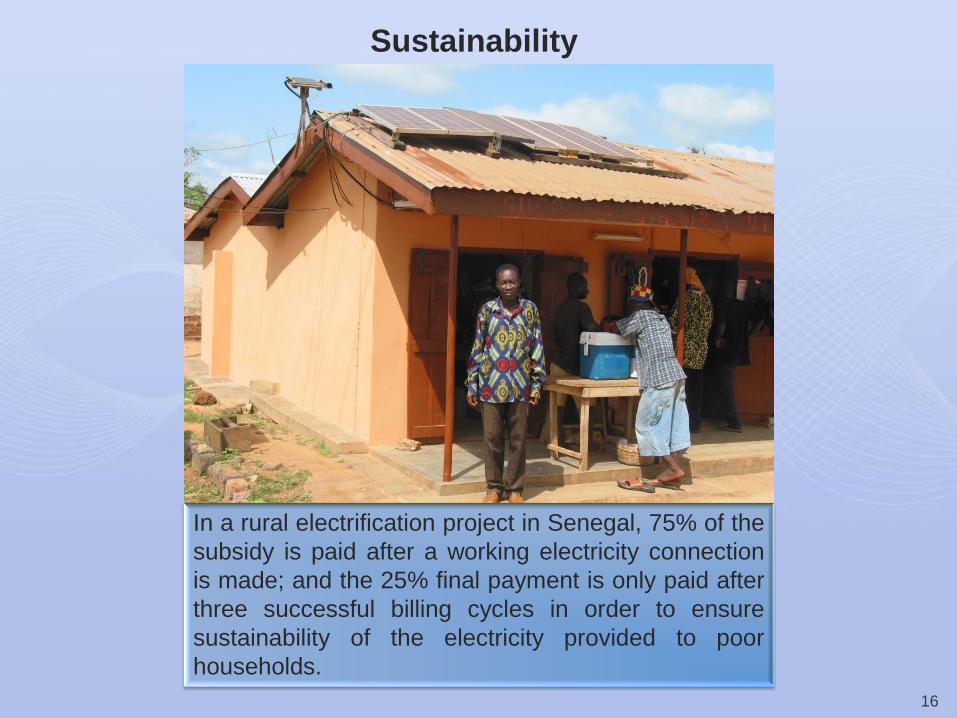
Sustainability
In a rural electrification project in Senegal, 75% of the
subsidy is paid after a working electricity connection
is made; and the 25% final payment is only paid after
three successful billing cycles in order to ensure
sustainability of the electricity provided to poor
households.
16
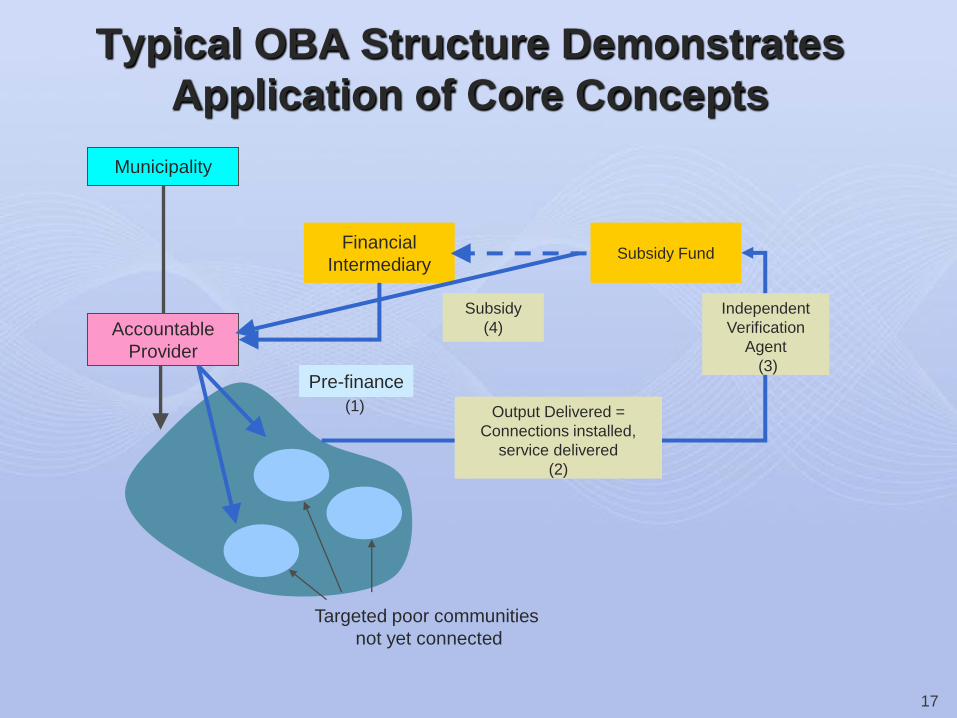
Typical OBA Structure Demonstrates
Application of Core Concepts
Targeted poor communities
not yet connected
Municipality
Accountable
Provider
Subsidy Fund Financial
Intermediary
Subsidy
(4)
Pre-finance
(1) Output Delivered =
Connections installed,
service delivered
(2)
Independent
Verification
Agent
(3)
17
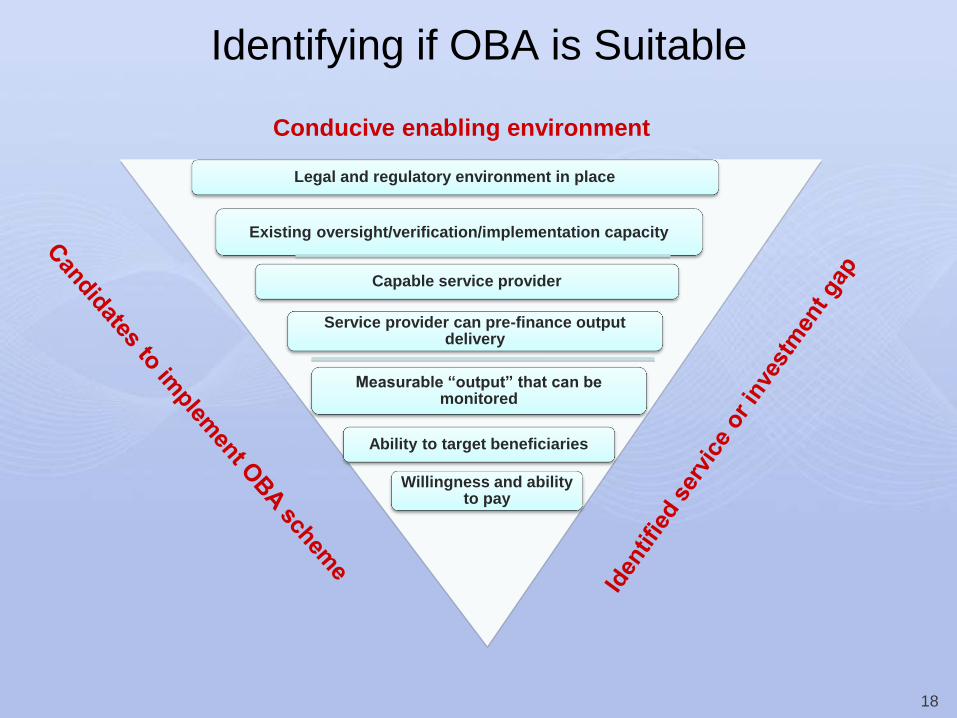
Identifying if OBA is Suitable
Conducive enabling environment
Legal and regulatory environment in place
Existing oversight/verification/implementation capacity
Capable service provider
Service provider can pre-finance output delivery
Measurable “output” that can be monitored
Ability to target beneficiaries
Willingness and ability to pay
18
Designing OBA Projects
The Basic Elements A. Determining the output: What service is to be
provided?
B. Reaching target population and selecting targeting
methodology
C. Choosing an appropriate subsidy form
D. Determining the value of the subsidy
E. Linking outputs to subsidy disbursement
F. Organizing the institutional framework
G. Evaluating and mitigating project risks
H. Monitoring for results
19
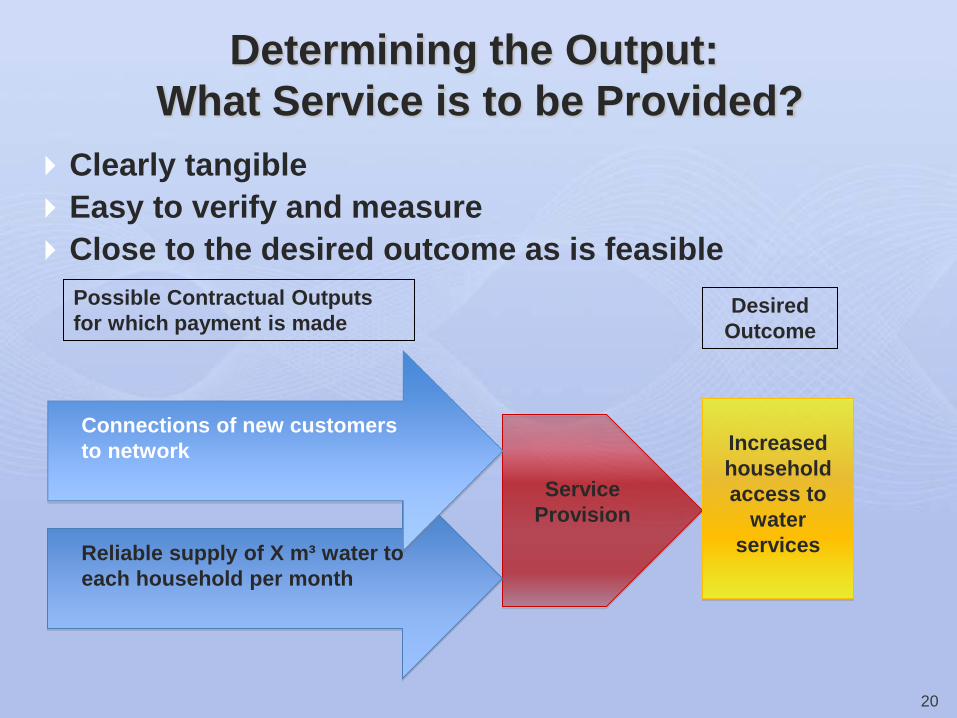
Determining the Output:
What Service is to be Provided?
Clearly tangible
Easy to verify and measure
Close to the desired outcome as is feasible
Desired
Outcome
Possible Contractual Outputs
for which payment is made
Increased
household
access to
water
services
20
Connections of new customers
to network
Reliable supply of X m³ water to
each household per month
Service
Provision
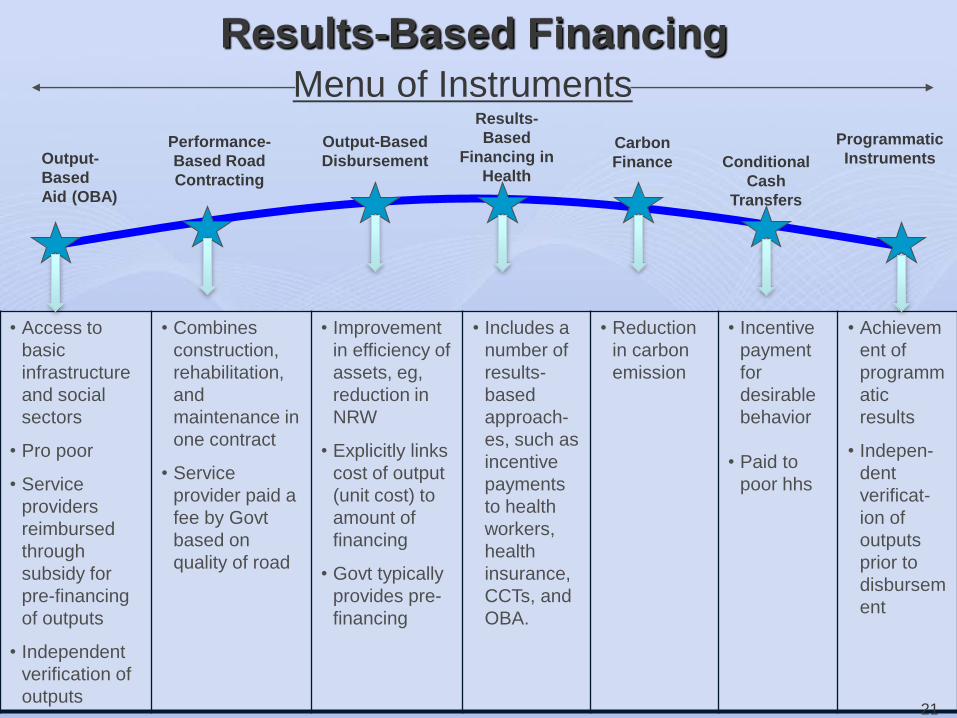
Results-Based Financing Menu of Instruments
Output-
Based
Aid (OBA)
Performance-
Based Road
Contracting
Output-Based
Disbursement Carbon
Finance
Programmatic
Instruments
Results-
Based
Financing in
Health Conditional
Cash
Transfers
• Access to
basic
infrastructure
and social
sectors
• Pro poor
• Service
providers
reimbursed
through
subsidy for
pre-financing
of outputs
• Independent
verification of
outputs
• Combines
construction,
rehabilitation,
and
maintenance in
one contract
• Service
provider paid a
fee by Govt
based on
quality of road
• Improvement
in efficiency of
assets, eg,
reduction in
NRW
• Explicitly links
cost of output
(unit cost) to
amount of
financing
• Govt typically
provides pre-
financing
• Includes a
number of
results-
based
approach-
es, such as
incentive
payments
to health
workers,
health
insurance,
CCTs, and
OBA.
• Reduction
in carbon
emission
• Incentive
payment
for
desirable
behavior
• Paid to
poor hhs
• Achievem
ent of
programm
atic
results
• Indepen-
dent
verificat-
ion of
outputs
prior to
disbursem
ent
21

What is RBF?
Results-Based Financing (RBF) encompasses a
range of mechanisms designed to enhance
access to and delivery of infrastructure and
social services through the use of performance-
based incentives, rewards, or subsidies
RBF applies some core concepts from OBA to
broader development problems, not necessarily
associated to the issue of affordability or access
to services by low-income populations, the
defining characteristic of OBA

Core RBF Concepts
A funding entity (typically a government or sub-
government agency) provides a financial
incentive, reward, subsidy, or grant conditional
on the recipient undertaking a set of pre-
determined actions or achieving a pre-
determined performance or results
Resources are disbursed not against individual
expenditures or contracts on the input side, but
against demonstrated and verified results that
are largely within the control of the recipient
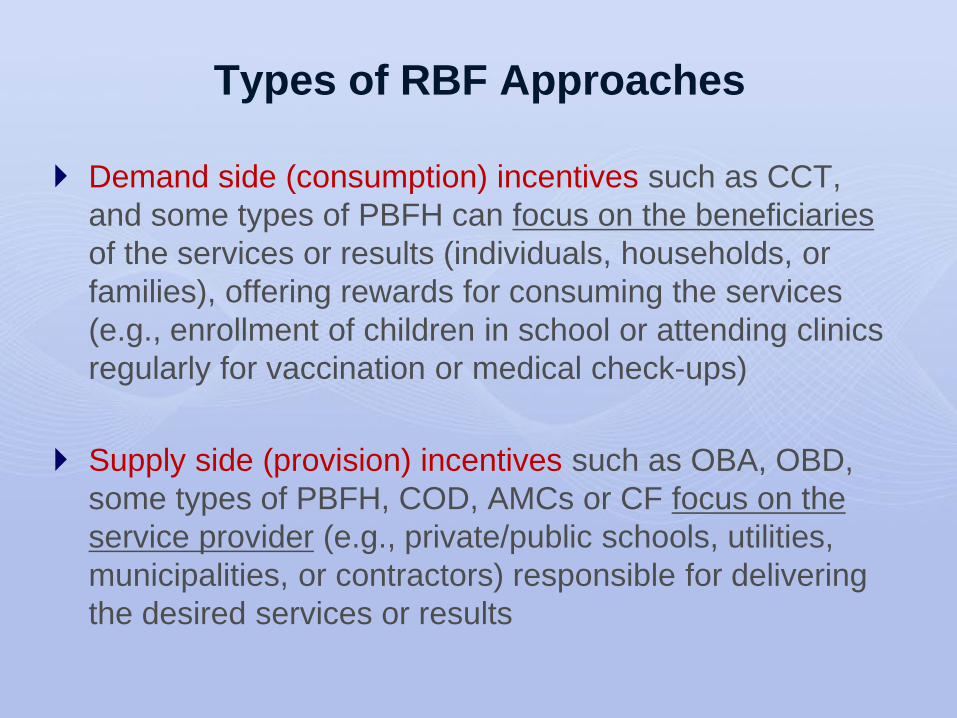
Types of RBF Approaches
Demand side (consumption) incentives such as CCT,
and some types of PBFH can focus on the beneficiaries
of the services or results (individuals, households, or
families), offering rewards for consuming the services
(e.g., enrollment of children in school or attending clinics
regularly for vaccination or medical check-ups)
Supply side (provision) incentives such as OBA, OBD,
some types of PBFH, COD, AMCs or CF focus on the
service provider (e.g., private/public schools, utilities,
municipalities, or contractors) responsible for delivering
the desired services or results
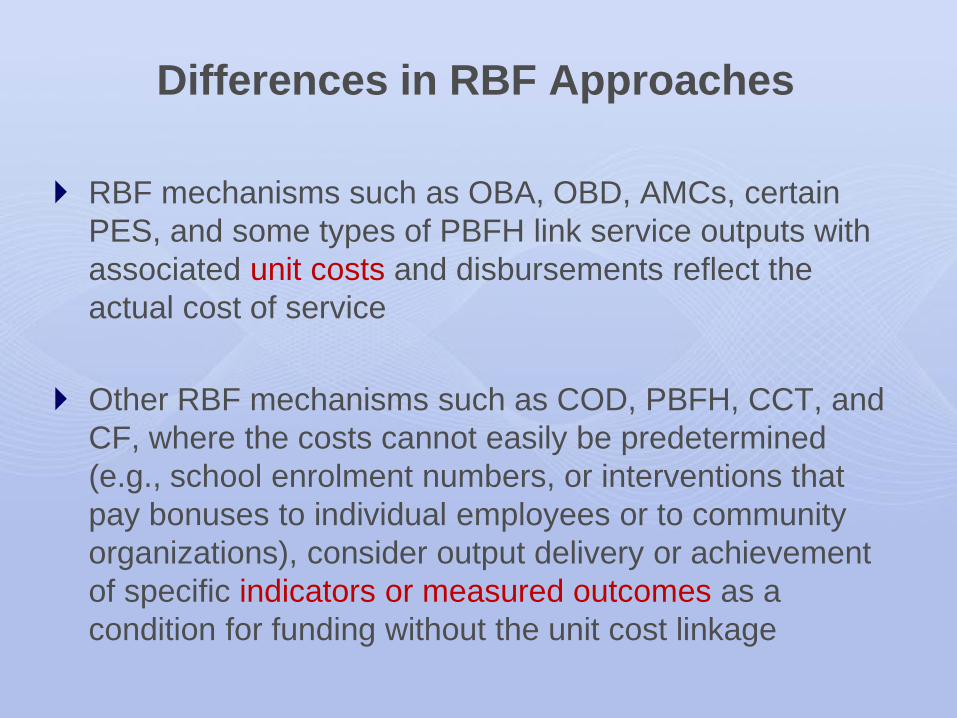
Differences in RBF Approaches
RBF mechanisms such as OBA, OBD, AMCs, certain
PES, and some types of PBFH link service outputs with
associated unit costs and disbursements reflect the
actual cost of service
Other RBF mechanisms such as COD, PBFH, CCT, and
CF, where the costs cannot easily be predetermined
(e.g., school enrolment numbers, or interventions that
pay bonuses to individual employees or to community
organizations), consider output delivery or achievement
of specific indicators or measured outcomes as a
condition for funding without the unit cost linkage

Proposed indicators/outputs as the basis for disbursements are:
i. Physical efficiency improvements: cubic meter of water saved
per month (m3/month)
ii. Energy efficiency improvements: kilowatt of electricity saved per
cubic meter produced per month (kWh/m3/month)
iii. Commercial efficiency improvements: additional cubic meters
billed on the basis of metered volume (m3/month)
Both baseline conditions and outputs achieved by the
participating water operators will be independently
audited. Documentation of funds will be based on the
independent technical verification of outputs, rather than
expenditures receipts, as is the case under the main PROME
financing window.
Mexico: Water Utilities Efficiency Improvement Project (PROME)

Experience of the Clean Development Mechanism as a result based mechanism for
methane abatement
Methane finance study group meeting Washington, DC
December 19, 2012
Clean Development Mechanism achievements
and pitfalls in delivering methane abatement
Today’s main focus

CDM basics: principles, requirements & project cycle
CDM achievements in the field of methane abatement
Challenges and pitfalls of the CDM in addressing barriers to
investment in methane abatement
Topics to be covered today

CDM basics: principles, requirements, main
actors & project cycle
Carbon finance: revenues from the sale of GHG emission reductions or from
trading in carbon permits/allocations based on their market value
Clean Development Mechanism (CDM) and Joint Implementation (JI):
project-based carbon finance instruments established by the Kyoto Protocol
Main objectives of the CDM:
Help meeting Kyoto targets in cost effective way through offsetting
Achieve real, measurable and verifiable emission reductions
Contribute to sustainable development
CDM: project-based mechanism of carbon finance

CDM: generation of certified carbon assets
CDM requirements and rules set at the international level
Strict oversight and approval process a the UNFCCC level to ensure
environmental integrity:
Additionality: “net” emission reduction to what would happen otherwise
(e.g., in the baseline scenario)
Use of pre-approved conservative quantification methodologies & tools
Use of pre-approved monitoring methodologies to measure results
Multiple independent verifications
Stakeholder consultation & public reporting
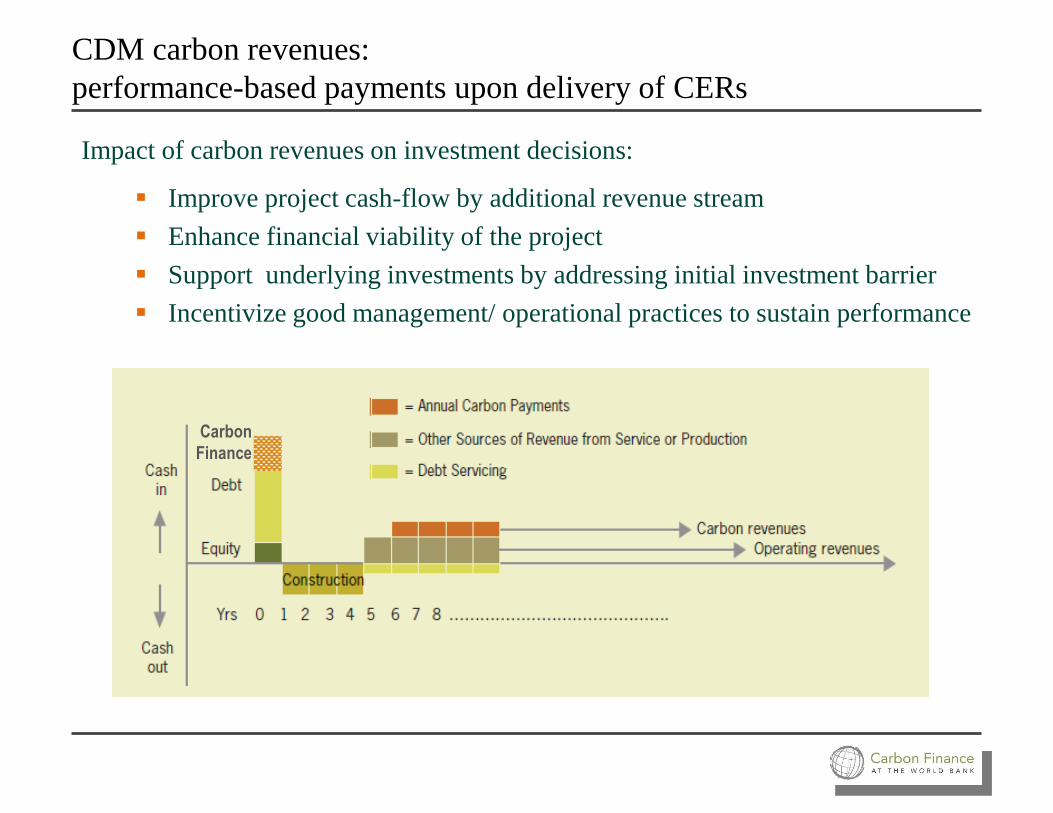
CDM carbon revenues:
performance-based payments upon delivery of CERs
Impact of carbon revenues on investment decisions:
Improve project cash-flow by additional revenue stream
Enhance financial viability of the project
Support underlying investments by addressing initial investment barrier
Incentivize good management/ operational practices to sustain performance
Carbon
Finance
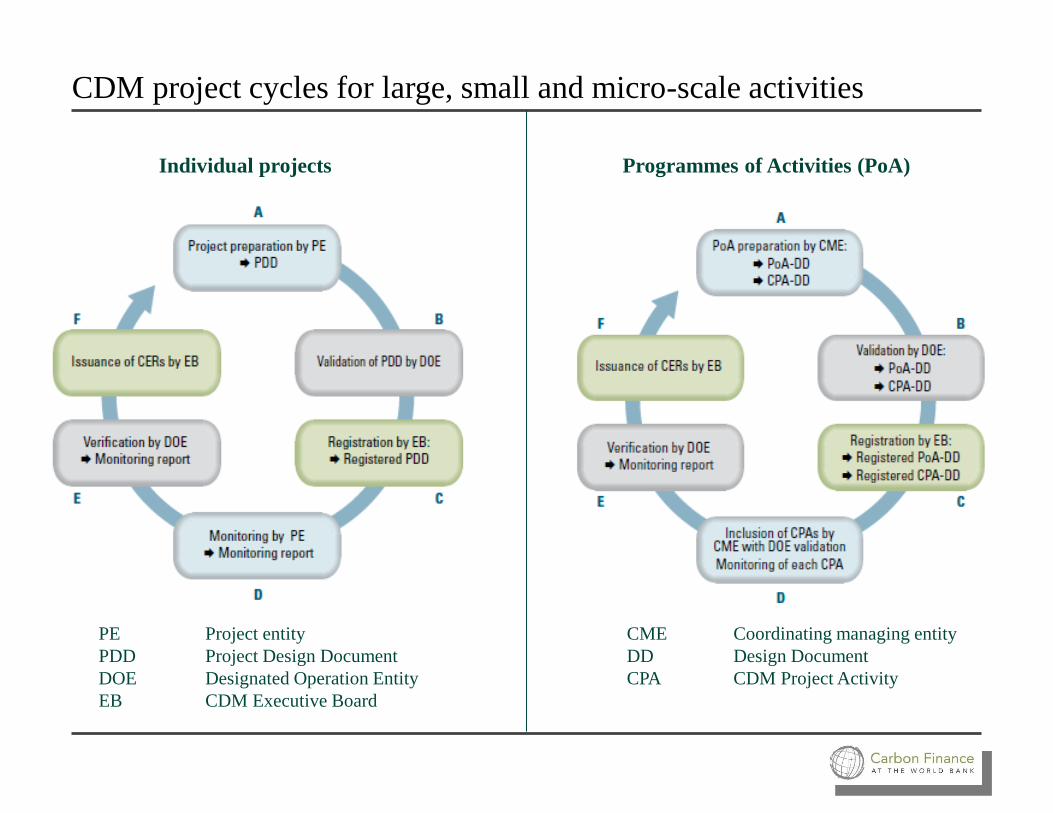
CDM project cycles for large, small and micro-scale activities
Individual projects Programmes of Activities (PoA)
PE Project entity
PDD Project Design Document
DOE Designated Operation Entity
EB CDM Executive Board
CME Coordinating managing entity
DD Design Document
CPA CDM Project Activity
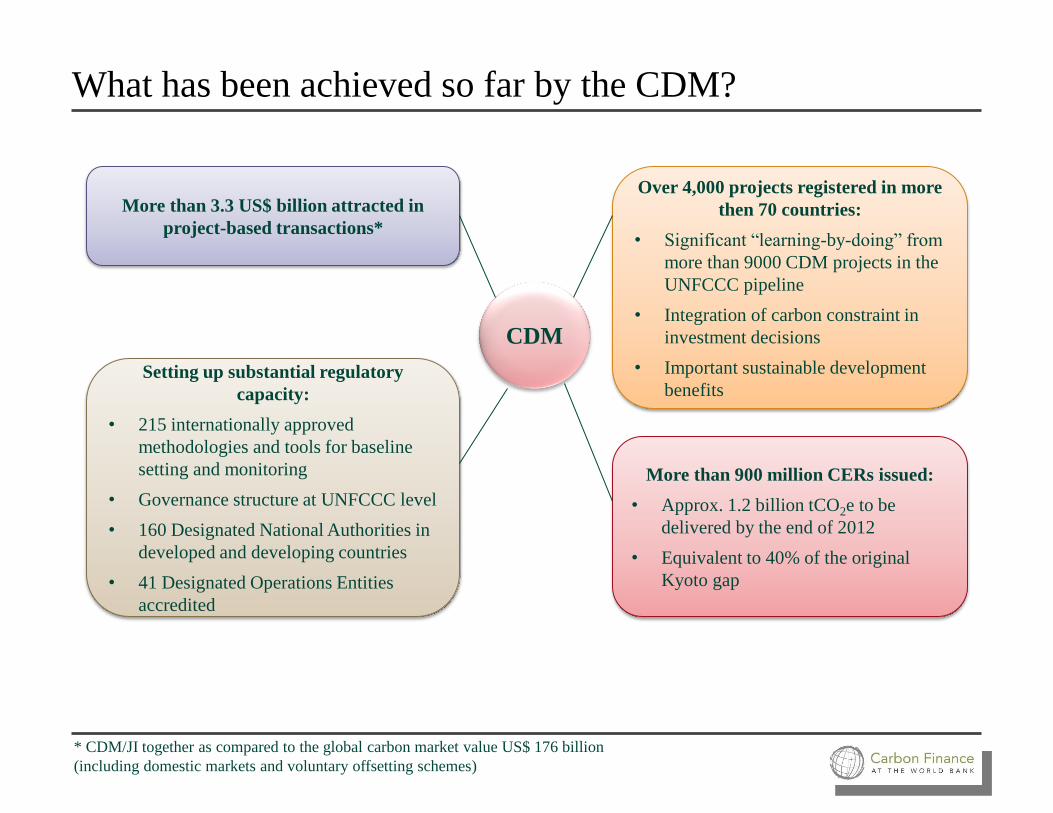
What has been achieved so far by the CDM?
CDM
More than 3.3 US$ billion attracted in
project-based transactions*
Over 4,000 projects registered in more
then 70 countries:
• Significant “learning-by-doing” from
more than 9000 CDM projects in the
UNFCCC pipeline
• Integration of carbon constraint in
investment decisions
• Important sustainable development
benefits Setting up substantial regulatory
capacity:
• 215 internationally approved
methodologies and tools for baseline
setting and monitoring
• Governance structure at UNFCCC level
• 160 Designated National Authorities in
developed and developing countries
• 41 Designated Operations Entities
accredited
More than 900 million CERs issued:
• Approx. 1.2 billion tCO2e to be
delivered by the end of 2012
• Equivalent to 40% of the original
Kyoto gap
* CDM/JI together as compared to the global carbon market value US$ 176 billion
(including domestic markets and voluntary offsetting schemes)
CDM achievements in the field of methane abatement
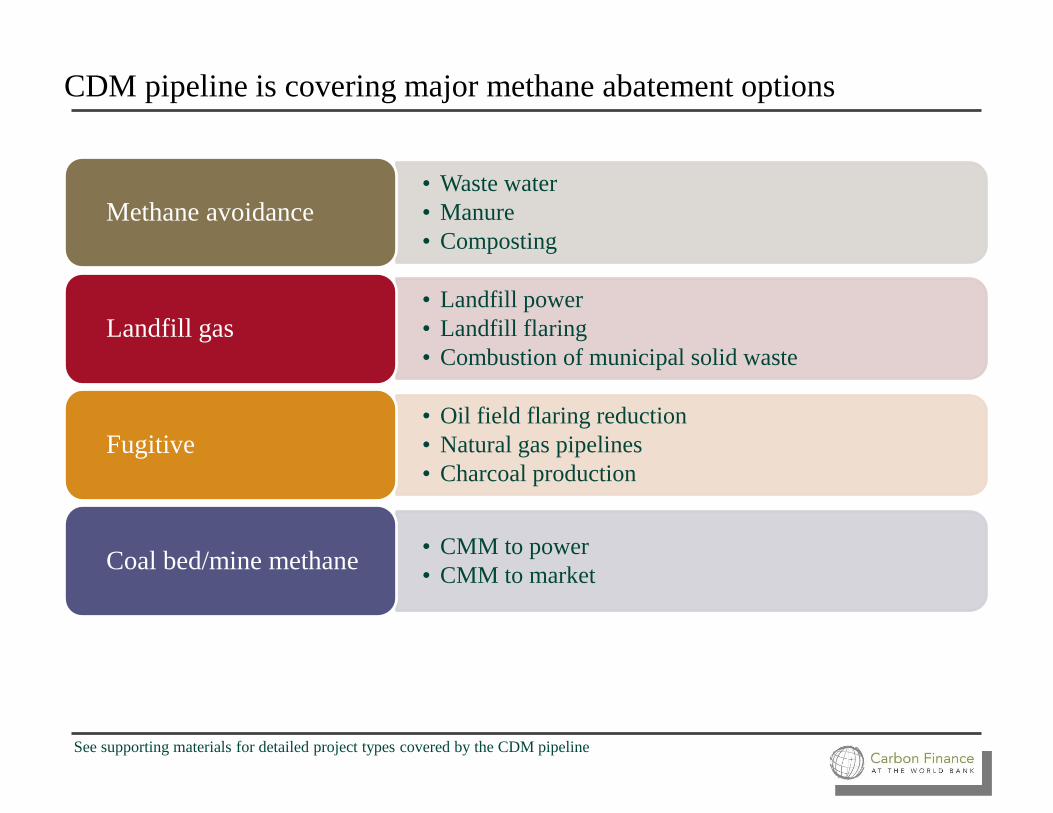
CDM pipeline is covering major methane abatement options
• Waste water
• Manure
• Composting
Methane avoidance
• Landfill power
• Landfill flaring
• Combustion of municipal solid waste
Landfill gas
• Oil field flaring reduction
• Natural gas pipelines
• Charcoal production
Fugitive
• CMM to power
• CMM to market Coal bed/mine methane
See supporting materials for detailed project types covered by the CDM pipeline
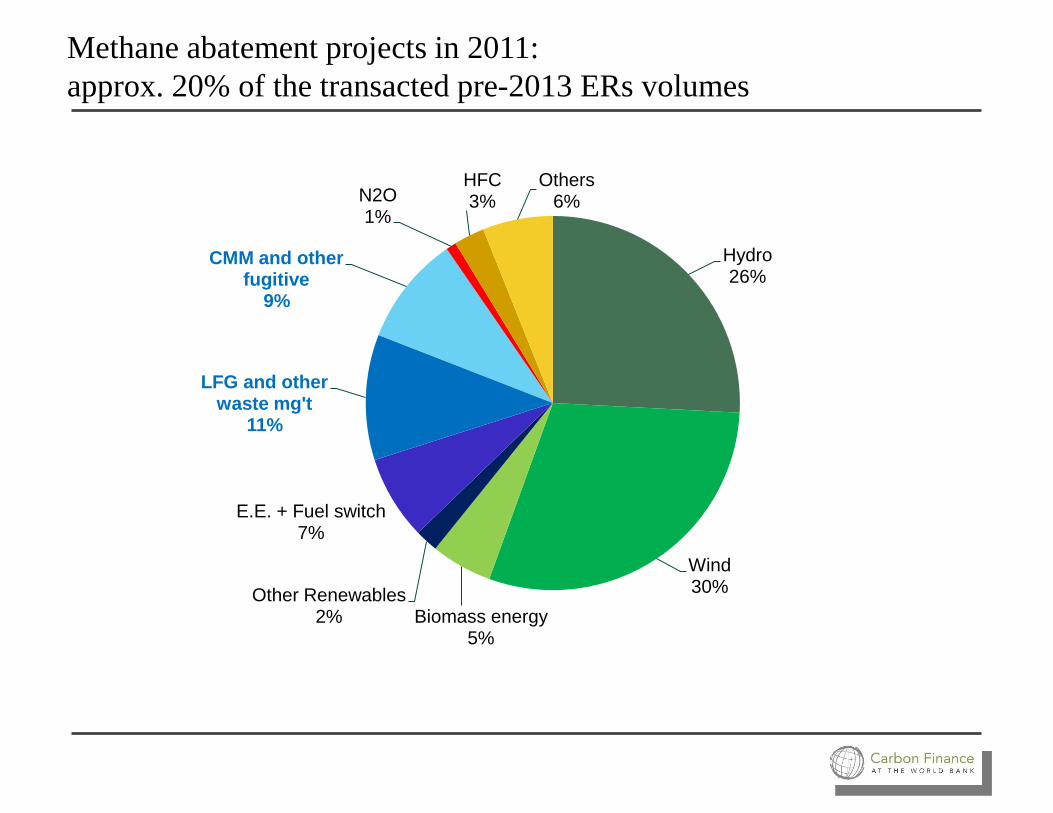
Methane abatement projects in 2011:
approx. 20% of the transacted pre-2013 ERs volumes
Hydro 26%
Wind 30%
Biomass energy 5%
Other Renewables 2%
E.E. + Fuel switch 7%
LFG and other waste mg't
11%
CMM and other fugitive
9%
N2O 1%
HFC 3%
Others 6%

Methane projects offer relatively attractive abatement costs
In the absence of detailed data on abatement costs, the ratio of investment to
NPV of ERPA gives indication of comparative costs
Methane abatement projects offer economically attractive carbon offsets as
compared to other types of GHG mitigation options
UNEP RISO CDM statistics offer supportive conclusions*
See supporting materials for more detailed project type information
Ratio of investment
to NPV of ERPA
in the World Bank
CDM portfolio
(as of 2010)
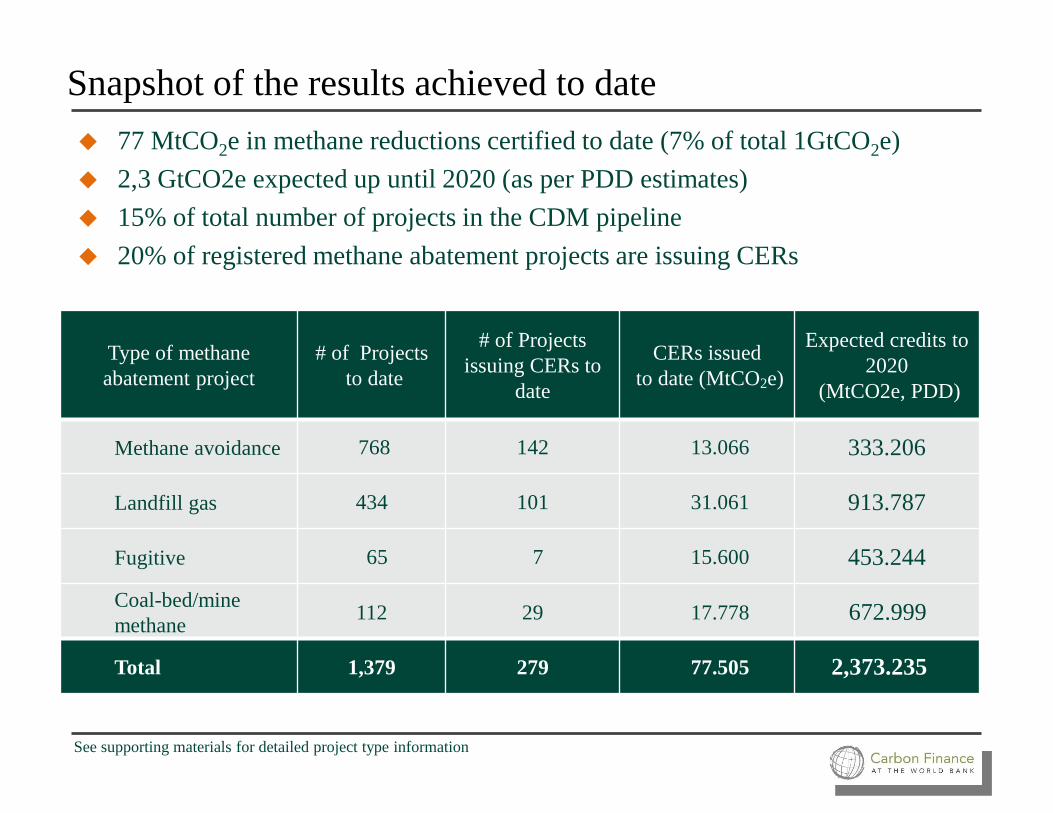
Type of methane
abatement project # of Projects
to date
# of Projects
issuing CERs to
date
CERs issued
to date (MtCO2e)
Expected credits to
2020
(MtCO2e, PDD)
Methane avoidance 768 142 13.066 333.206
Landfill gas 434 101 31.061 913.787
Fugitive 65 7 15.600 453.244
Coal-bed/mine
methane 112 29 17.778 672.999
Total 1,379 279 77.505 2,373.235
77 MtCO2e in methane reductions certified to date (7% of total 1GtCO2e)
2,3 GtCO2e expected up until 2020 (as per PDD estimates)
15% of total number of projects in the CDM pipeline
20% of registered methane abatement projects are issuing CERs
Snapshot of the results achieved to date
See supporting materials for detailed project type information

Challenges and pitfalls of the CDM in addressing
barriers to investment in methane abatement
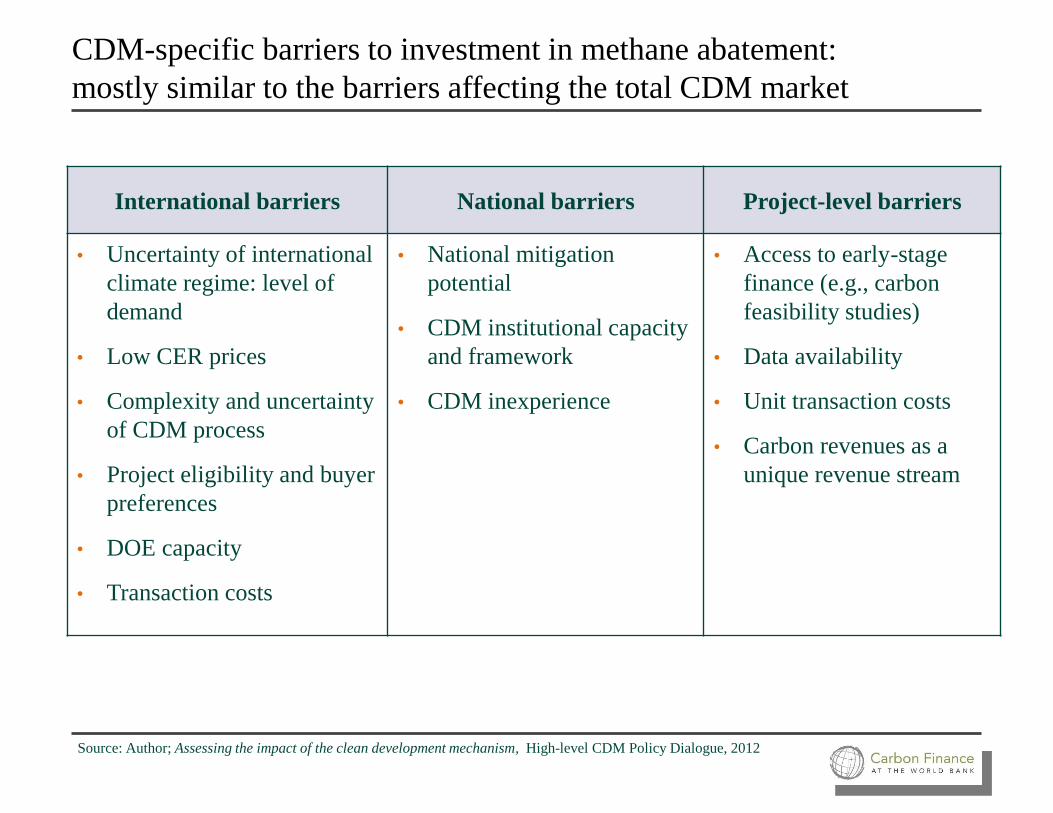
CDM-specific barriers to investment in methane abatement:
mostly similar to the barriers affecting the total CDM market
International barriers National barriers Project-level barriers
• Uncertainty of international
climate regime: level of
demand
• Low CER prices
• Complexity and uncertainty
of CDM process
• Project eligibility and buyer
preferences
• DOE capacity
• Transaction costs
• National mitigation
potential
• CDM institutional capacity
and framework
• CDM inexperience
• Access to early-stage
finance (e.g., carbon
feasibility studies)
• Data availability
• Unit transaction costs
• Carbon revenues as a
unique revenue stream
Source: Author; Assessing the impact of the clean development mechanism, High-level CDM Policy Dialogue, 2012

Non CDM-specific barriers to investment in methane abatement:
limited impact of the CDM
International barriers National barriers Project-level barriers
• Global economy-
financial markets
• General investment climate
(economic, technical and
regulatory)
• Host country preferences and
co-existence with national
policies
• Legal and regulatory barriers
(methane ownership, access
to the grid)
• Access to project finance
(domestic and foreign)
• High capital costs
• Information and institutional
barriers
Source: Author; Assessing the impact of the clean development mechanism, High-level CDM Policy Dialogue, 2012
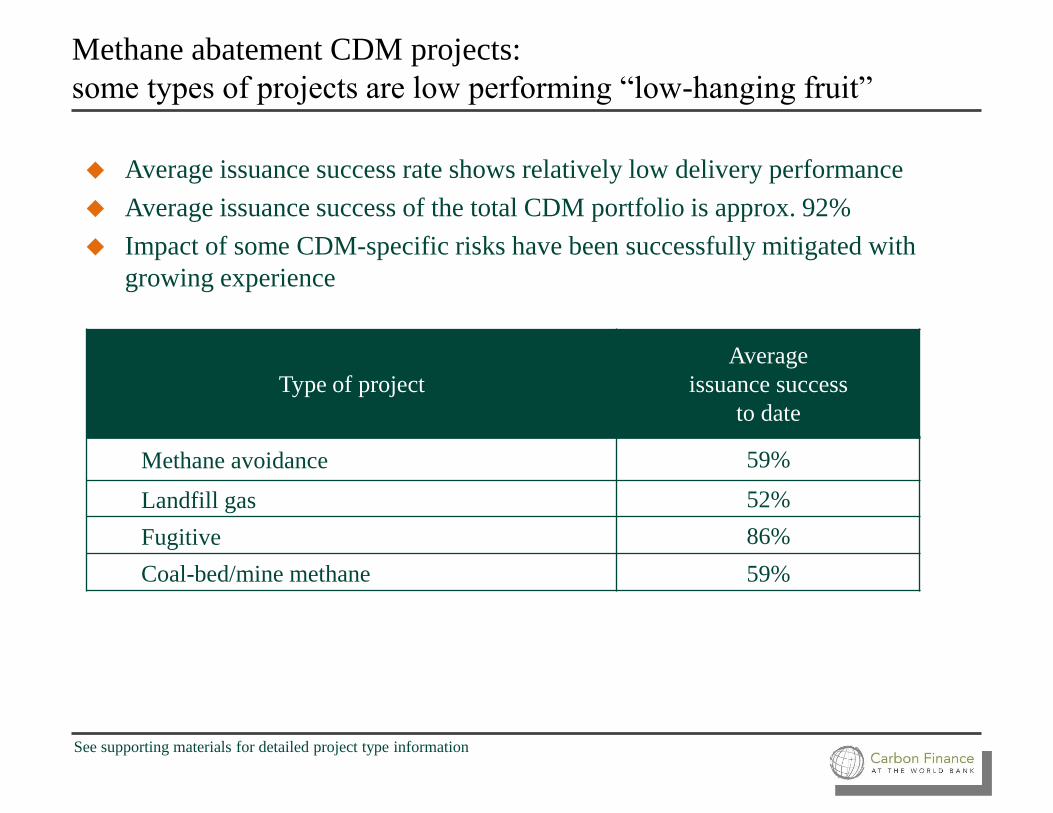
Methane abatement CDM projects:
some types of projects are low performing “low-hanging fruit”
Average issuance success rate shows relatively low delivery performance
Average issuance success of the total CDM portfolio is approx. 92%
Impact of some CDM-specific risks have been successfully mitigated with
growing experience
Type of project
Average
issuance success
to date
Methane avoidance 59%
Landfill gas 52%
Fugitive 86%
Coal-bed/mine methane 59%
See supporting materials for detailed project type information
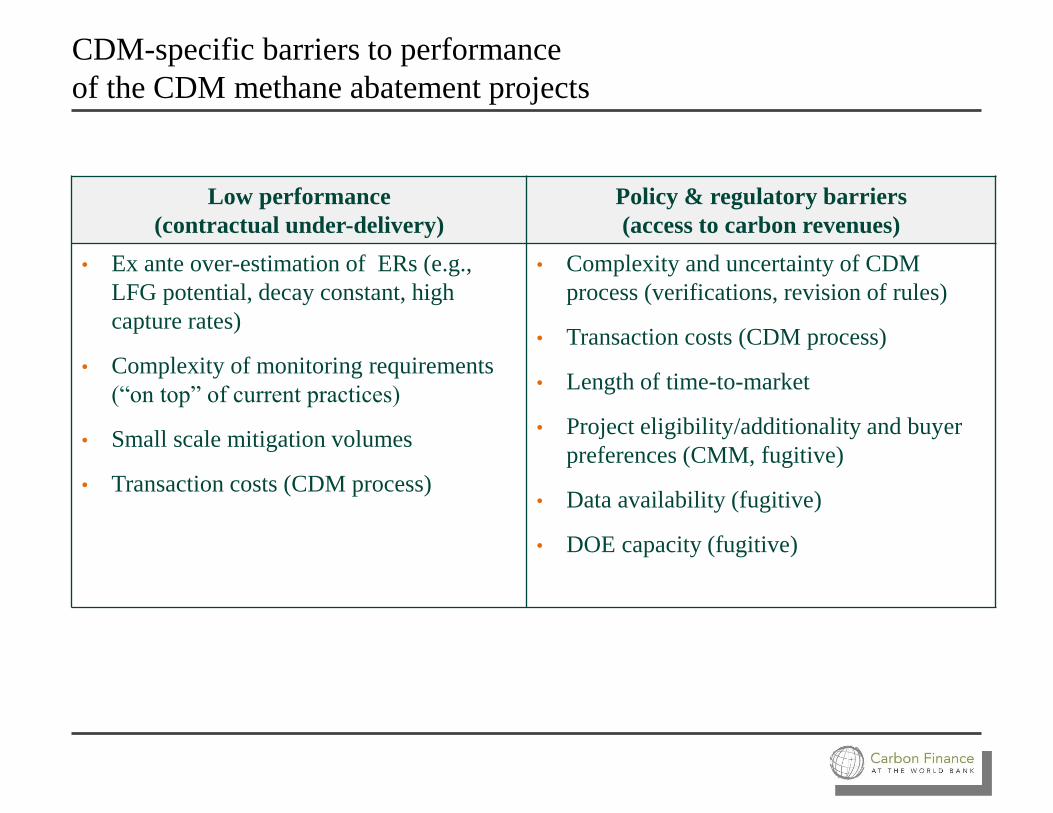
CDM-specific barriers to performance
of the CDM methane abatement projects
Low performance
(contractual under-delivery)
Policy & regulatory barriers
(access to carbon revenues)
• Ex ante over-estimation of ERs (e.g.,
LFG potential, decay constant, high
capture rates)
• Complexity of monitoring requirements
(“on top” of current practices)
• Small scale mitigation volumes
• Transaction costs (CDM process)
• Complexity and uncertainty of CDM
process (verifications, revision of rules)
• Transaction costs (CDM process)
• Length of time-to-market
• Project eligibility/additionality and buyer
preferences (CMM, fugitive)
• Data availability (fugitive)
• DOE capacity (fugitive)

Non CDM-specific barriers to performance
of the CDM methane abatement projects
Low performance
(contractual under-delivery)
Policy & regulatory barriers
(access to carbon revenues)
• Mismatching technology solutions
• Poor operation & maintenance practices
• Unsustainable business models (important
counterparts omitted, lack of testing
phase)
• Economic barriers (volatile energy prices,
economic downturn)
• Remaining policy/ regulatory/ legal
barriers to investment
• Unstable engagement of national/ local/
municipal authorities
• Information and institutional barriers (e.g.,
value attributed to wasted energy,
awareness of co-benefits)
Concluding remarks
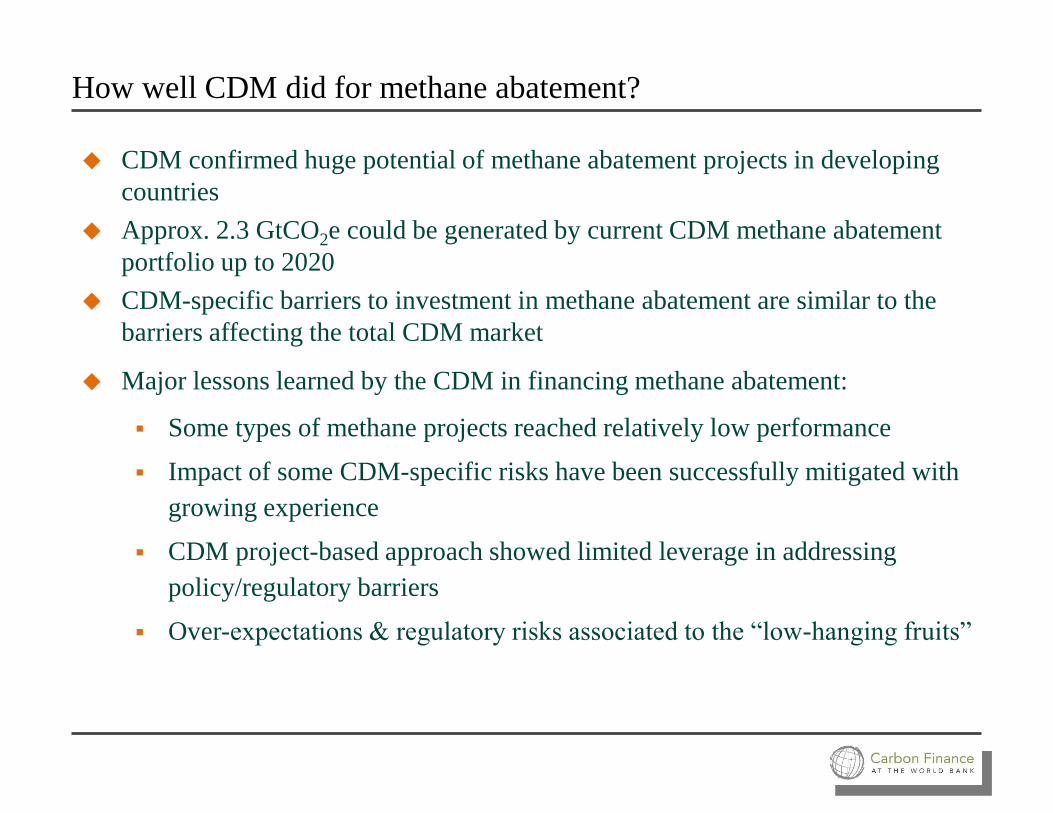
How well CDM did for methane abatement?
CDM confirmed huge potential of methane abatement projects in developing
countries
Approx. 2.3 GtCO2e could be generated by current CDM methane abatement
portfolio up to 2020
CDM-specific barriers to investment in methane abatement are similar to the
barriers affecting the total CDM market
Major lessons learned by the CDM in financing methane abatement:
Some types of methane projects reached relatively low performance
Impact of some CDM-specific risks have been successfully mitigated with
growing experience
CDM project-based approach showed limited leverage in addressing
policy/regulatory barriers
Over-expectations & regulatory risks associated to the “low-hanging fruits”
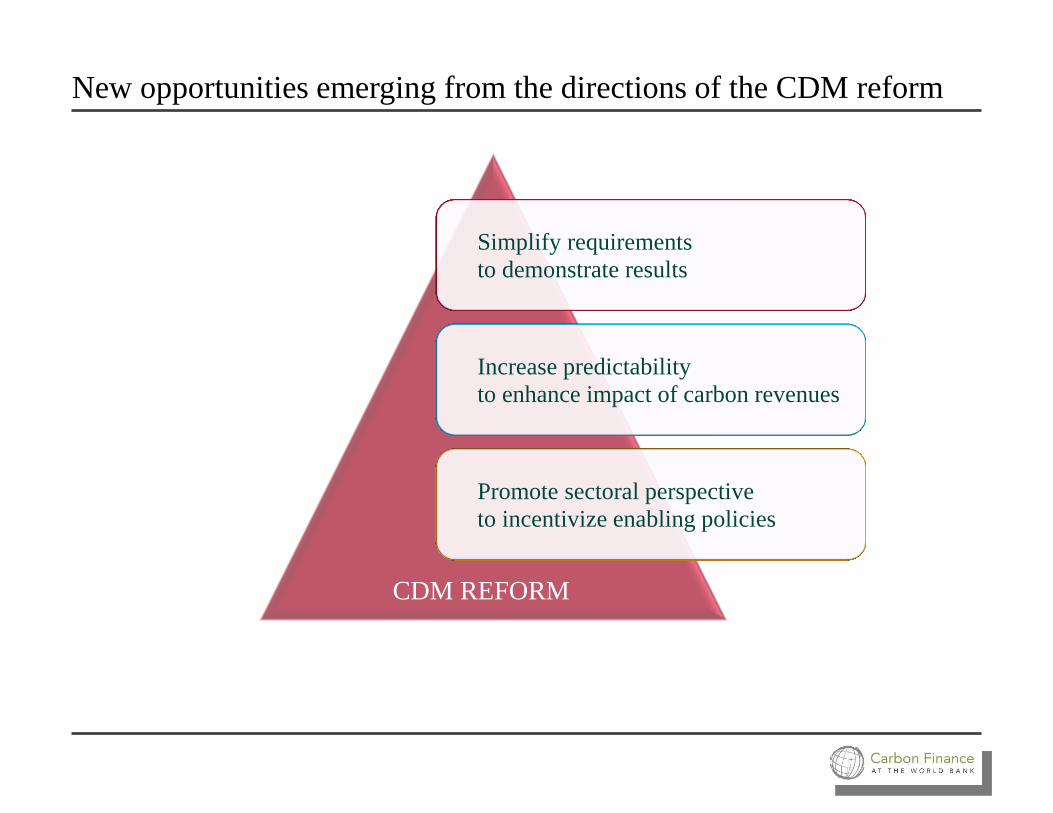
New opportunities emerging from the directions of the CDM reform
Simplify requirements
to demonstrate results
Increase predictability
to enhance impact of carbon revenues
Promote sectoral perspective
to incentivize enabling policies
CDM REFORM


Supporting slides
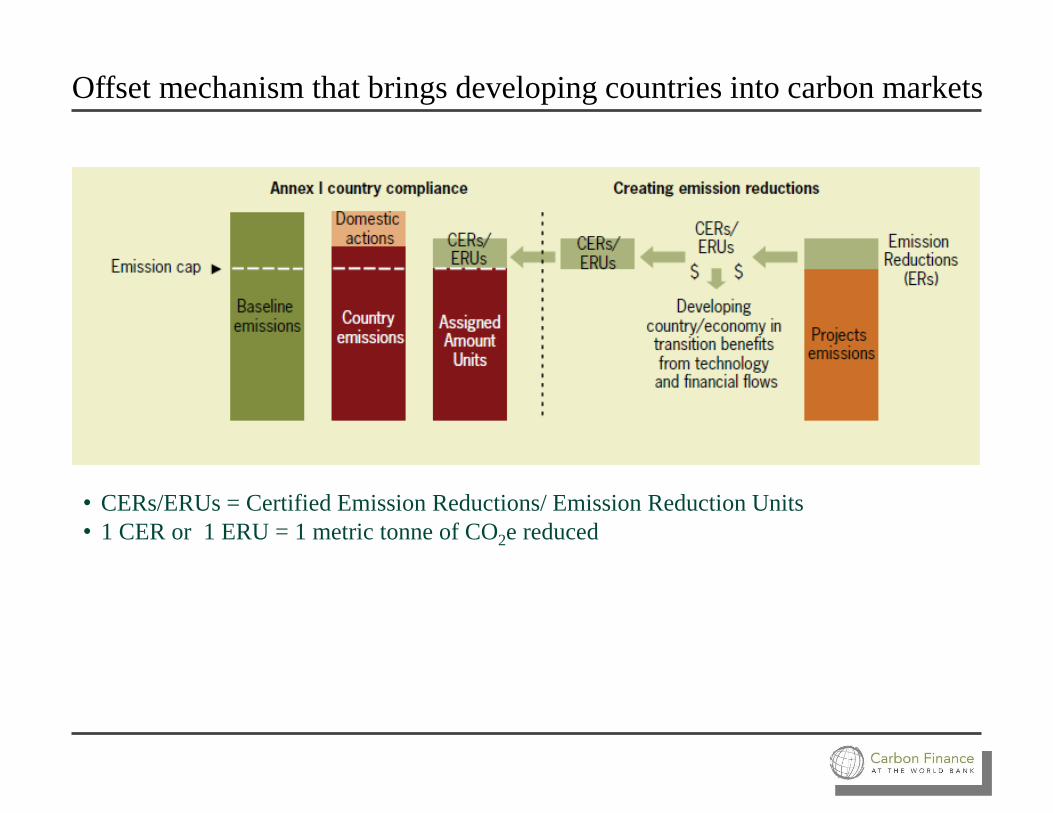
Offset mechanism that brings developing countries into carbon markets
• CERs/ERUs = Certified Emission Reductions/ Emission Reduction Units
• 1 CER or 1 ERU = 1 metric tonne of CO2e reduced
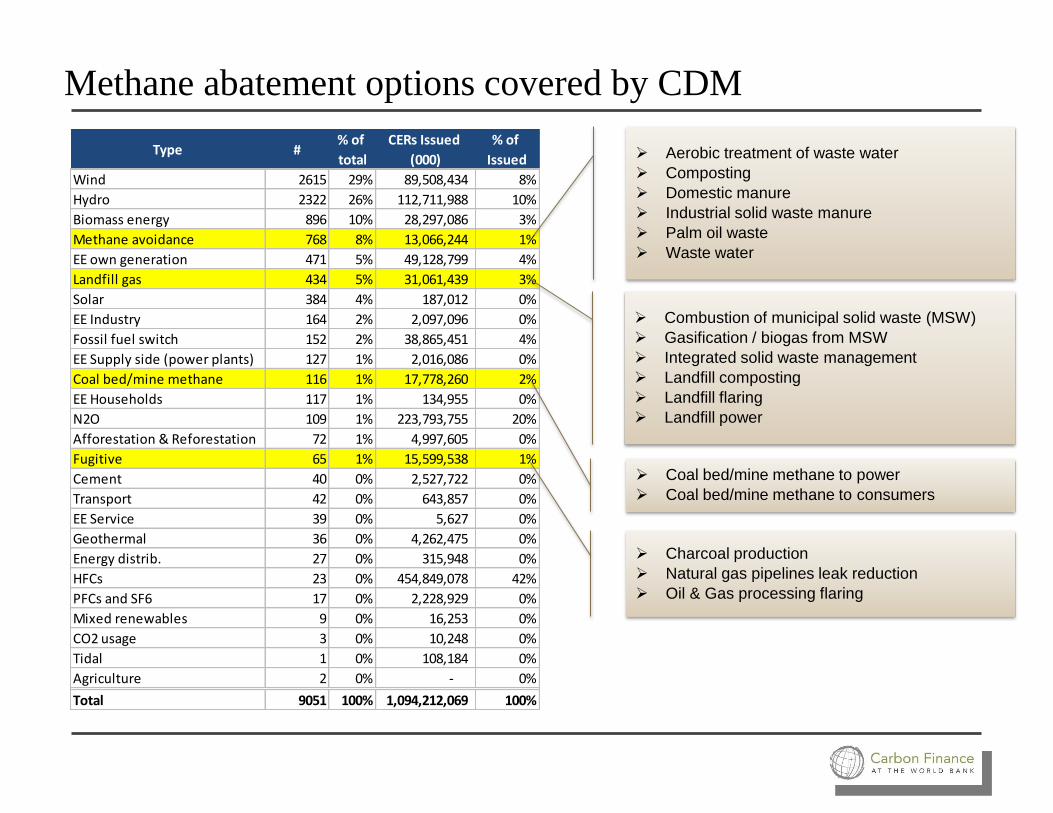
Methane abatement options covered by CDM
Type #% of
total
CERs Issued
(000)
% of
Issued
Wind 2615 29% 89,508,434 8%
Hydro 2322 26% 112,711,988 10%
Biomass energy 896 10% 28,297,086 3%
Methane avoidance 768 8% 13,066,244 1%
EE own generation 471 5% 49,128,799 4%
Landfill gas 434 5% 31,061,439 3%
Solar 384 4% 187,012 0%
EE Industry 164 2% 2,097,096 0%
Fossil fuel switch 152 2% 38,865,451 4%
EE Supply side (power plants) 127 1% 2,016,086 0%
Coal bed/mine methane 116 1% 17,778,260 2%
EE Households 117 1% 134,955 0%
N2O 109 1% 223,793,755 20%
Afforestation & Reforestation 72 1% 4,997,605 0%
Fugitive 65 1% 15,599,538 1%
Cement 40 0% 2,527,722 0%
Transport 42 0% 643,857 0%
EE Service 39 0% 5,627 0%
Geothermal 36 0% 4,262,475 0%
Energy distrib. 27 0% 315,948 0%
HFCs 23 0% 454,849,078 42%
PFCs and SF6 17 0% 2,228,929 0%
Mixed renewables 9 0% 16,253 0%
CO2 usage 3 0% 10,248 0%
Tidal 1 0% 108,184 0%
Agriculture 2 0% - 0%
Total 9051 100% 1,094,212,069 100%
Aerobic treatment of waste water
Composting
Domestic manure
Industrial solid waste manure
Palm oil waste
Waste water
Combustion of municipal solid waste (MSW)
Gasification / biogas from MSW
Integrated solid waste management
Landfill composting
Landfill flaring
Landfill power
Coal bed/mine methane to power
Coal bed/mine methane to consumers
Charcoal production
Natural gas pipelines leak reduction
Oil & Gas processing flaring
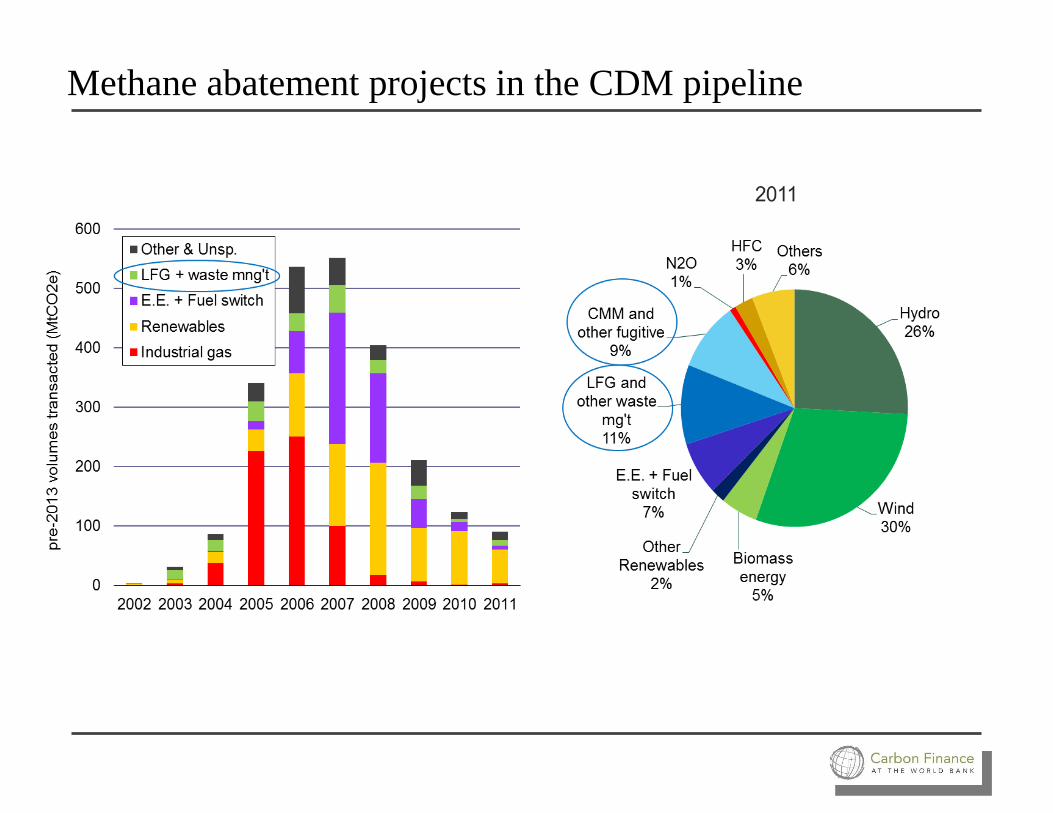
Methane abatement projects in the CDM pipeline

CDM methane abatement projects
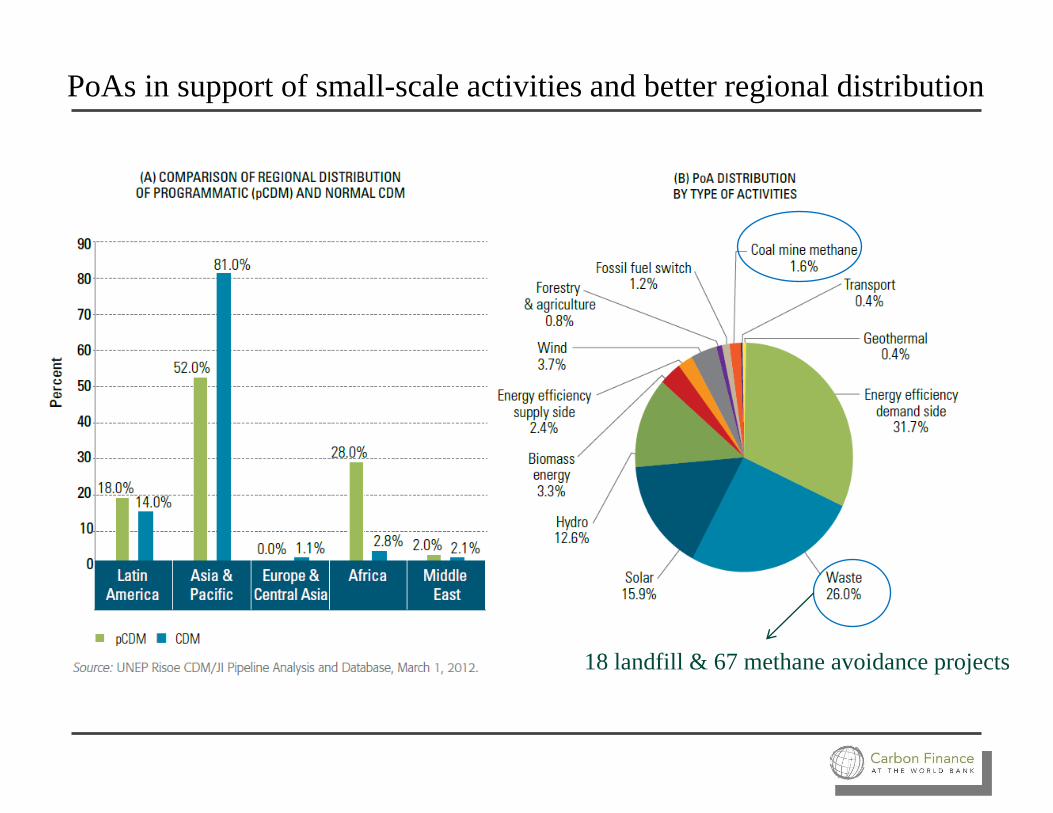
PoAs in support of small-scale activities and better regional distribution
18 landfill & 67 methane avoidance projects

CER Revenue
P.A. US$ M
Estimated
ERPA Revenue
US$ M*
Underlying
Investment
Million
US$ M
Ratio of Investment
to Net Present Value
of ERPA using UNEP
RISO Statistics
Coal Mine Methane 45 132 1,090 8.24
Oil field flaring reduction 247 729 2,187 3.00
Oil and gas processing flaring 154 453 16 0.04
Geothermal electricity 608 1,792 2,805 1.57
HFC134a 286 844 18 0.02
Run of river 456 1,345 42,590 31.66
New dam 413 1,217 26,356 21.65
Landfill flaring 30 89 1,031 11.57
Landfill power 70 205 1,741 8.50
Combustion of MSW 416 1,226 1,070 0.87
Landfill composting 276 814 447 0.55
Manure 50 148 358 2.42
Domestic manure 159 468 85 0.18
Waste water 108 319 990 3.10
Solar PV 2,092 6,170 5,152 0.84
*Assume 5 year purchase period and a purchasing 80% of PDD volumes and 10% discount rate
Ratio of investment to NPV of ERPA in the UNEP RISO statistics

Source: Kossoy and Guignon (2012), State and trends of the carbon markets.
Prices of EUAs, secondary CERs and primary CERs, 2008-2012

Methane abatement CDM projects:
low performing “low-hanging fruit”
From 1397 projects in the CDM pipeline only 20% are issuing CERs
Average issuance success rate shows low delivery performance
Type of project # of projects to date Average issuance
success to date
Expected credits to 2020
(MtCO2e, PDD)
Methane avoidance 768 59% 333.206
Waste water 314 77% 159.273
Manure 288 48% 112.409
Composting 59 43% 26.376
Landfill gas 434 52% 913.787
Landfill power 200 50% 333.248
Landfill flaring 133 53% 485.770
Combustion of MSW 48 73% 52.063
Fugitive 65 86% 453.244
Oil field flaring reduction 34 95% 350.931
Natural gas pipelines 15 97% 73.109
Charcoal production 8 12% 18.829
CBM/CMM 112 59% 672.999
TOTAL 1397 - 2,373.235
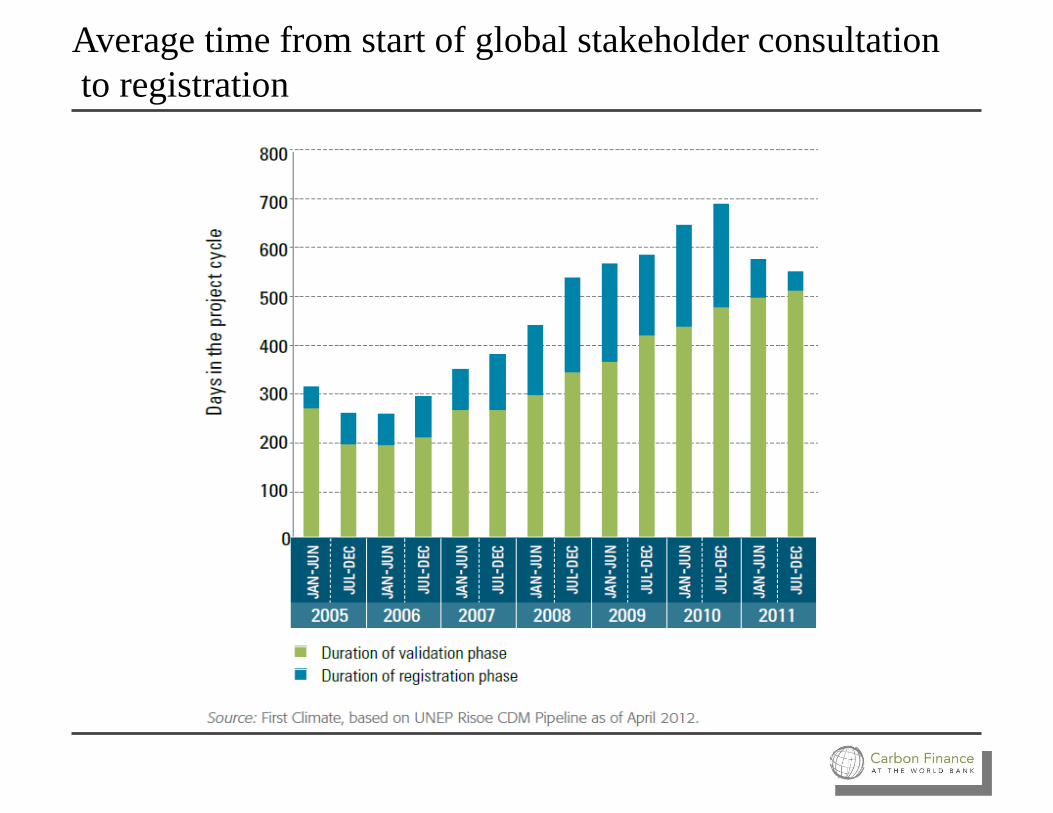
Average time from start of global stakeholder consultation
to registration

Accounting standards for methane emissions: taking stock of existing offset programs
Methane finance study group meeting Washington, DC February 7, 2013
Critical features for delivering results under
existing offset programs
Today’s main focus
Building blocks & typology of existing methodologies
Most used methane-related methodologies under CDM, VCS
and CAR
Main factors for MRV performance at project/program level
Topics to be covered today
Building blocks & typology of existing
methodologies
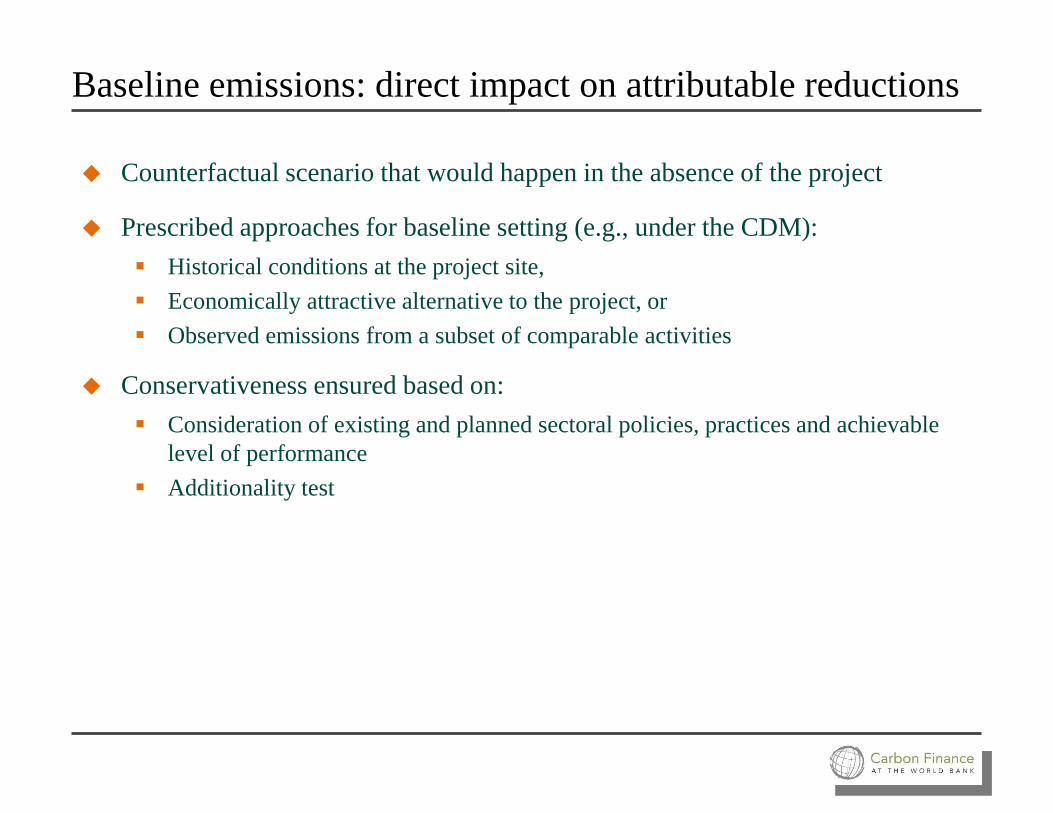
Counterfactual scenario that would happen in the absence of the project
Prescribed approaches for baseline setting (e.g., under the CDM):
Historical conditions at the project site,
Economically attractive alternative to the project, or
Observed emissions from a subset of comparable activities
Conservativeness ensured based on:
Consideration of existing and planned sectoral policies, practices and achievable
level of performance
Additionality test
Baseline emissions: direct impact on attributable reductions
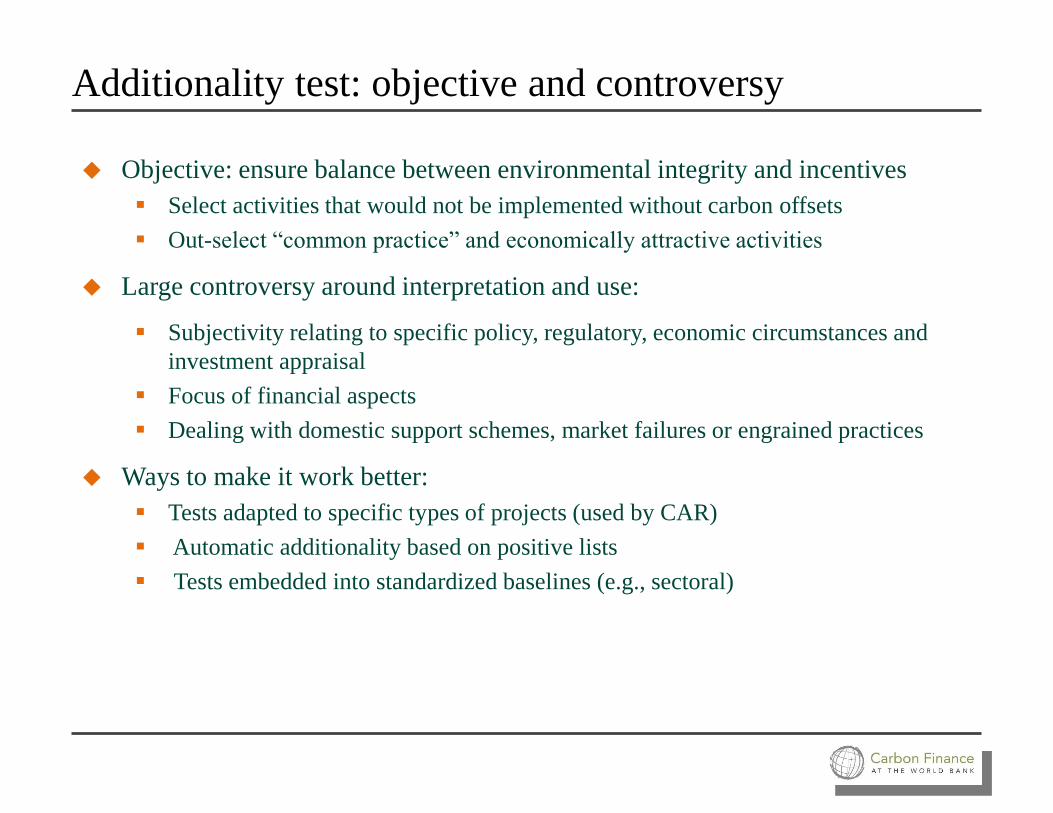
Additionality test: objective and controversy
Objective: ensure balance between environmental integrity and incentives
Select activities that would not be implemented without carbon offsets
Out-select “common practice” and economically attractive activities
Large controversy around interpretation and use:
Subjectivity relating to specific policy, regulatory, economic circumstances and
investment appraisal
Focus of financial aspects
Dealing with domestic support schemes, market failures or engrained practices
Ways to make it work better:
Tests adapted to specific types of projects (used by CAR)
Automatic additionality based on positive lists
Tests embedded into standardized baselines (e.g., sectoral)

Other building blocks of methodologies
Project emissions:
Scope & types of direct emissions by the project
Leakage emissions:
Indirect emissions influenced by the project
To be deducted from emissions reductions
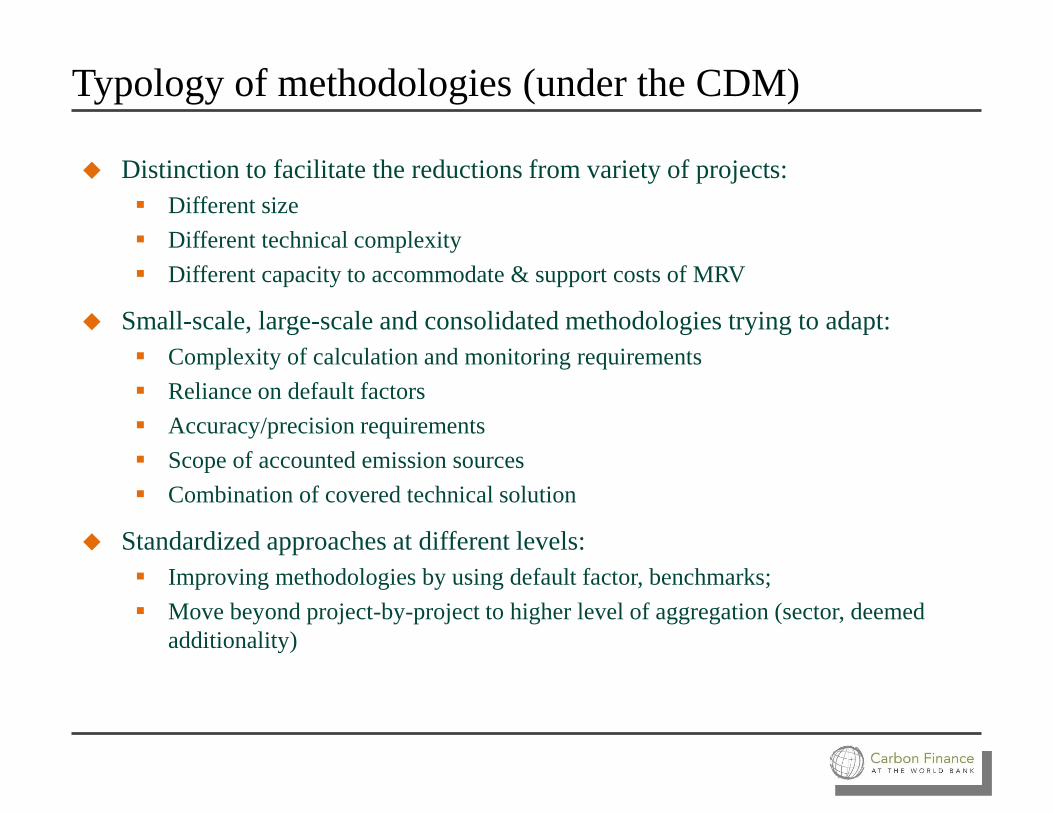
Typology of methodologies (under the CDM)
Distinction to facilitate the reductions from variety of projects:
Different size
Different technical complexity
Different capacity to accommodate & support costs of MRV
Small-scale, large-scale and consolidated methodologies trying to adapt:
Complexity of calculation and monitoring requirements
Reliance on default factors
Accuracy/precision requirements
Scope of accounted emission sources
Combination of covered technical solution
Standardized approaches at different levels:
Improving methodologies by using default factor, benchmarks;
Move beyond project-by-project to higher level of aggregation (sector, deemed
additionality)
Most used methane-related methodologies
under CDM, VCS and CAR
10 most used methane-related methodologies
More than 50 methane-related methodologies available under the CDM, VCS
and CAR
Only 10 methodologies cover about 80% of total 1,300 projects registered
Low uptake of bulk part of methodologies may be due to:
Narrow applicability to very specific technologies/practices
Over-conservativeness of resulting emission reductions
High transaction costs of applying MRV (data, equipment, scope)
A proxy of success of MRV for each methodology:
Per cent of projects that have issued carbon credits
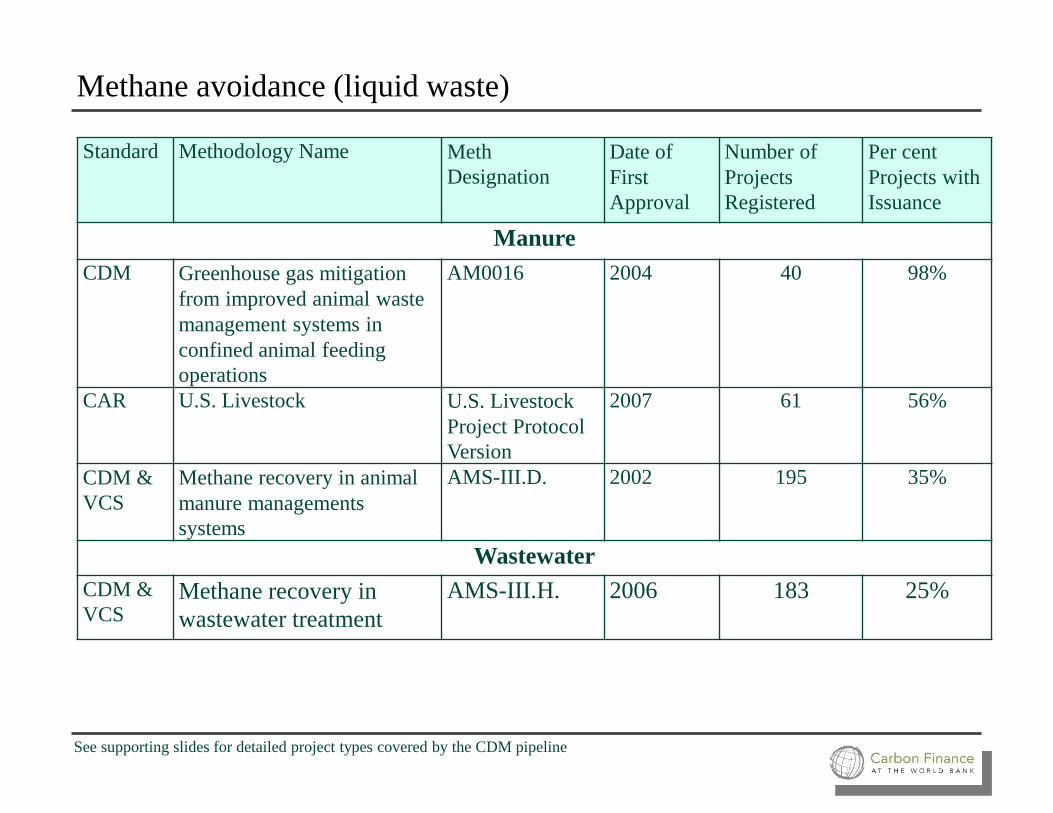
Methane avoidance (liquid waste)
See supporting slides for detailed project types covered by the CDM pipeline
Standard Methodology Name Meth
Designation Date of
First
Approval
Number of
Projects
Registered
Per cent
Projects with
Issuance
Manure
CDM Greenhouse gas mitigation
from improved animal waste
management systems in
confined animal feeding
operations
AM0016 2004 40 98%
CAR U.S. Livestock U.S. Livestock
Project Protocol
Version
2007 61 56%
CDM &
VCS Methane recovery in animal
manure managements
systems
AMS-III.D. 2002 195 35%
Wastewater
CDM &
VCS Methane recovery in
wastewater treatment AMS-III.H. 2006 183 25%
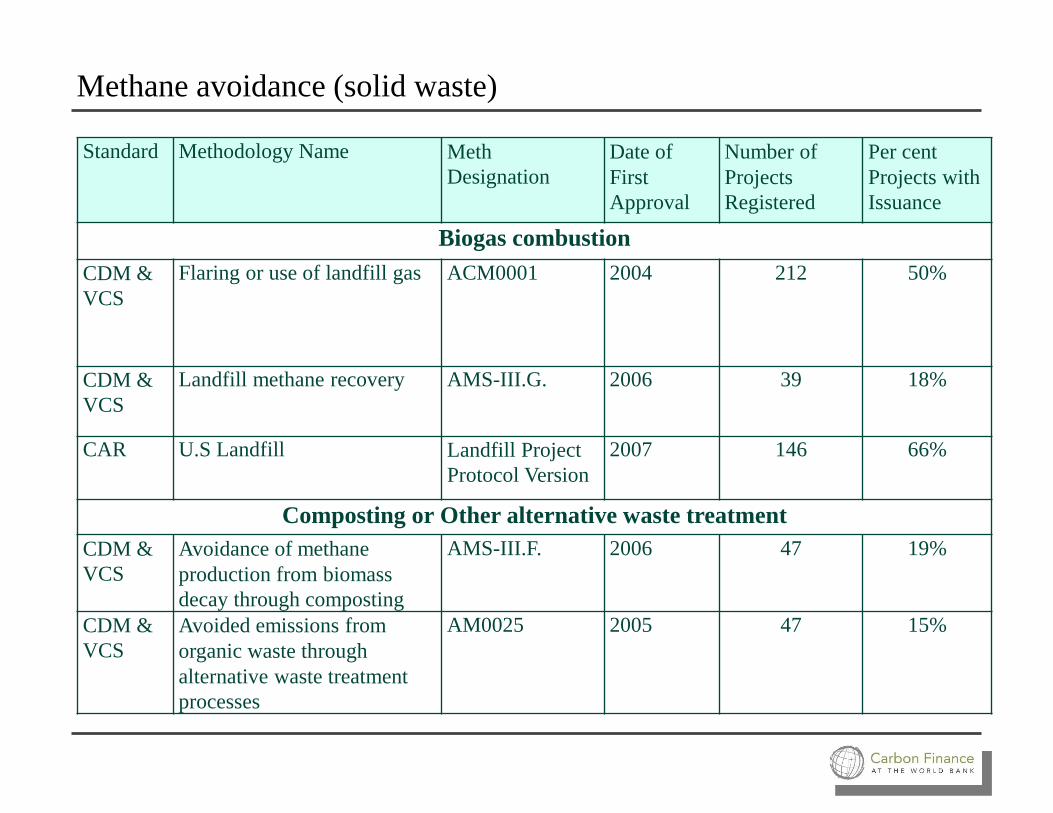
Methane avoidance (solid waste)
Standard Methodology Name Meth
Designation Date of
First
Approval
Number of
Projects
Registered
Per cent
Projects with
Issuance
Biogas combustion
CDM &
VCS Flaring or use of landfill gas ACM0001 2004 212 50%
CDM &
VCS Landfill methane recovery AMS-III.G. 2006 39 18%
CAR U.S Landfill Landfill Project
Protocol Version 2007 146 66%
Composting or Other alternative waste treatment
CDM &
VCS Avoidance of methane
production from biomass
decay through composting
AMS-III.F. 2006 47 19%
CDM &
VCS
Avoided emissions from
organic waste through
alternative waste treatment
processes
AM0025 2005 47 15%
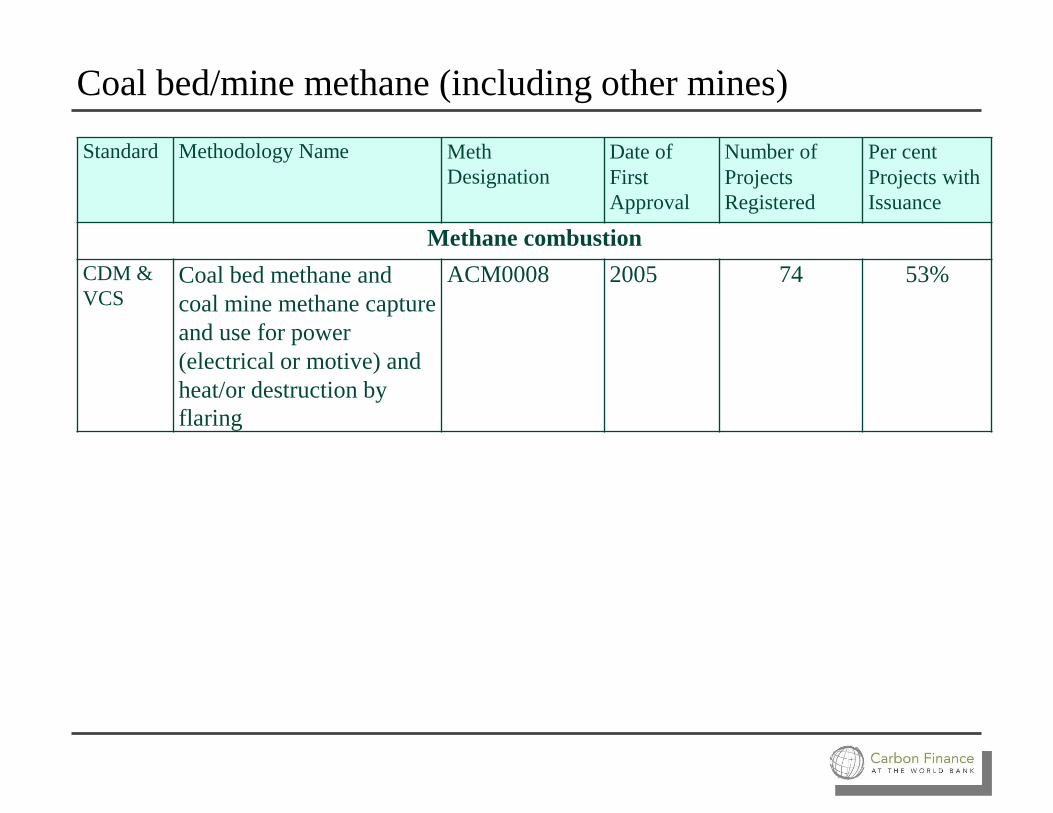
Coal bed/mine methane (including other mines)
Standard Methodology Name Meth
Designation Date of
First
Approval
Number of
Projects
Registered
Per cent
Projects with
Issuance
Methane combustion
CDM &
VCS Coal bed methane and
coal mine methane capture
and use for power
(electrical or motive) and
heat/or destruction by
flaring
ACM0008 2005 74 53%

Main features of most used methodologies
4 main sources of monitored parameters
60% of input parameters are directly monitored
Parameter Source Strengths Weaknesses
Direct monitoring Accurate Cost of equipment;
Capacity to operate equipment
Default factor Simple Not representative for individual
cases
Model Replicable Result only as accurate as the model
itself
Sector-wide indicator Representative for sector-
wide emissions levels Limited availability of data
Medium to high complexity of the MRV requirements:
Number and type of inputs parameters
Availability of default factors
Large (concentrated) sources or multiple (dispersed) small/micro-scale sources
Five main factors for MRV performance
at project/program level

Methodology-related factors of MRV performance
1. Balance between simplicity and adequacy of methodology requirements
Most successful methodologies contain neither very many, nor very few
monitorable parameters
Clear expectations are critical even for simpler methodologies:
Ensure consistency & predictability
Provide for suitable project design (reduce overall cost of compliance)
Avoid disagreements about the adequacy of monitoring at verification

Methodology-related factors of MRV performance
2. Scope of monitoring parameters relating to the significance of emission
sources
Extensive scope of monitoring parameters may lower MRV performance
Direct monitoring of project-related emissions from relatively minor sources
may be difficult & costly
Potentially major barrier for some types of abatement options:
Projects implemented by small or less sophisticated proponents
Projects addressing dispersed emission sources
- Special provisions relating to using sampling should be available

Methodology-related factors of MRV performance
3. Requirements for historical (monitored) data to define baseline emissions
Impracticable historical data requirements may become a major “entry barrier”
for projects:
Particularly for small or less sophisticated companies
Sector-wide indicators can be used as proxy for site-specific data:
Need to balance between conservativeness and incentive
Depend on national/sectoral capacities to define and maintain indicators
Other critical factors with impact on MRV performance
4. National and sectoral enabling infrastructure and capacities
Appropriate MRV requirements in context of limited infrastructure, regulations
or institutional capacities:
Reduce “entry barrier” through simplification
Incentivize and build in progressive improvements
The same may be relevant for the national/sector-wide data requirements
Other critical factors with impact on MRV performance
5. Timing of the result based finance & efficiency of MRV cycle
Bulk of MRV-related costs occur before the main inflow of carbon revenues
Predictability and efficiency of the MRV cycle have direct impact on project
risks and MRV success
Issuance success varies significantly between standards which may reflect:
Different structure of governance
Adequacy of oversight capacities to the scale of the standard
Approaches used to maintain integrity to the satisfaction of stakeholders

Concluding remarks
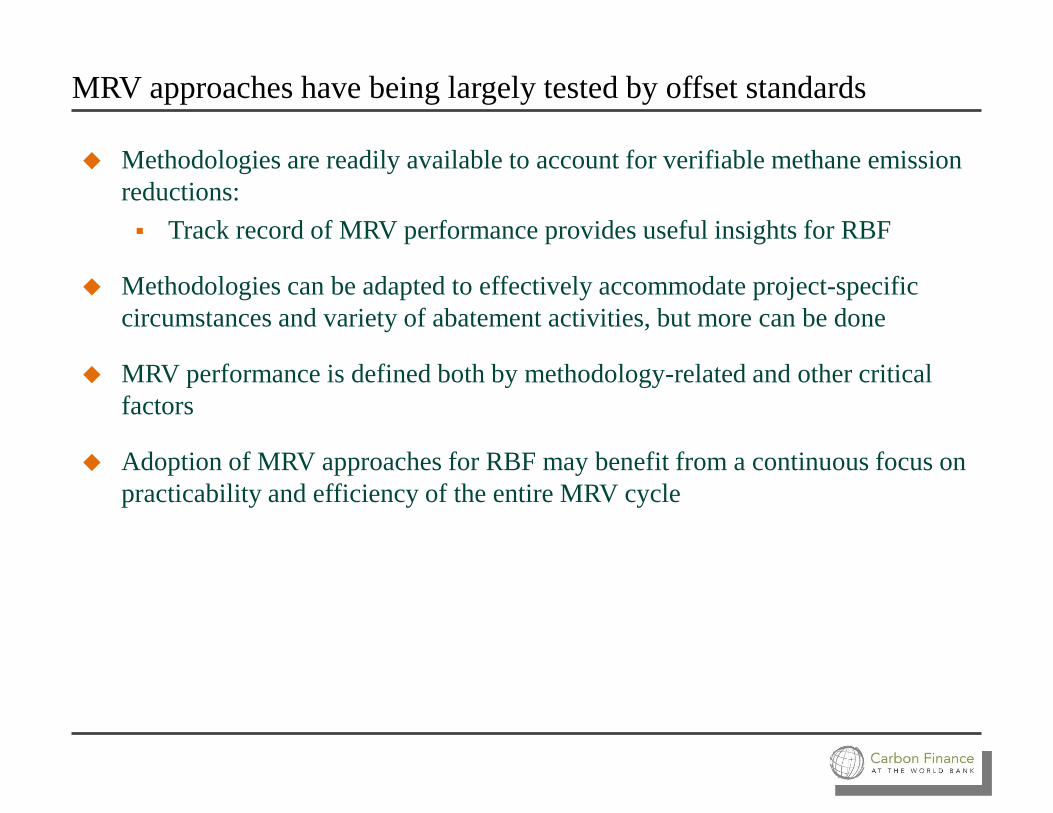
MRV approaches have being largely tested by offset standards
Methodologies are readily available to account for verifiable methane emission
reductions:
Track record of MRV performance provides useful insights for RBF
Methodologies can be adapted to effectively accommodate project-specific
circumstances and variety of abatement activities, but more can be done
MRV performance is defined both by methodology-related and other critical
factors
Adoption of MRV approaches for RBF may benefit from a continuous focus on
practicability and efficiency of the entire MRV cycle
Supporting slides
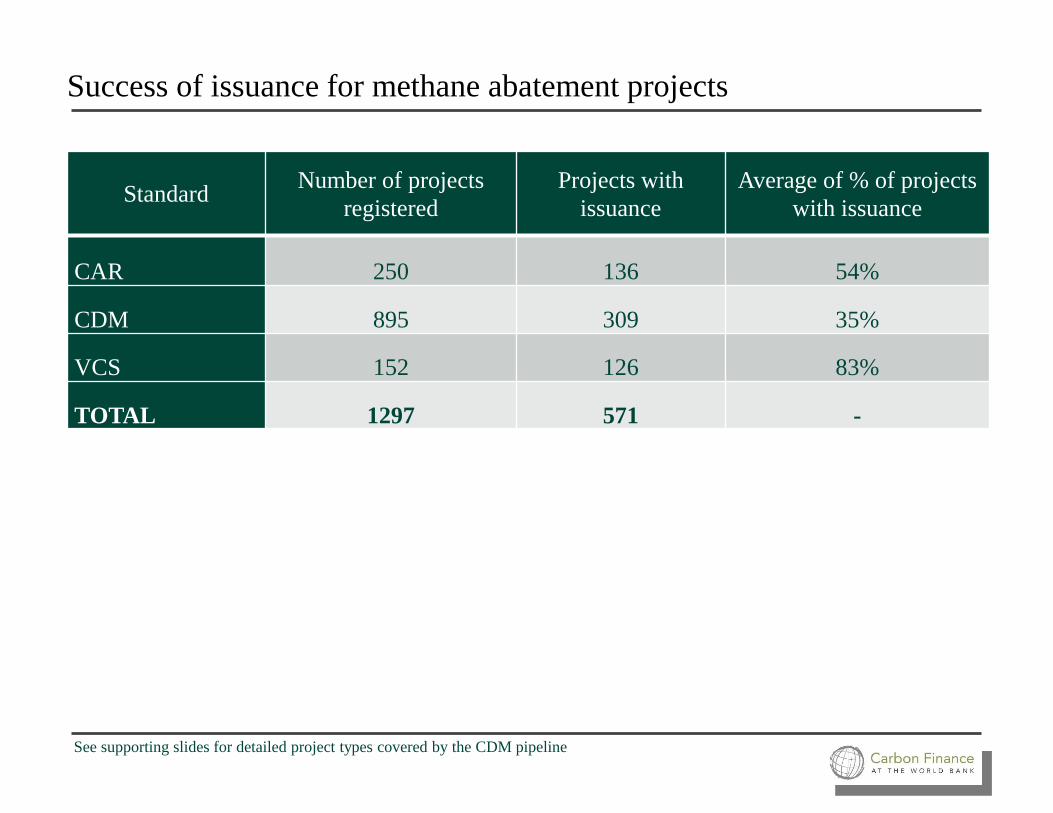
Success of issuance for methane abatement projects
See supporting slides for detailed project types covered by the CDM pipeline
Standard Number of projects
registered Projects with
issuance Average of % of projects
with issuance
CAR 250 136 54%
CDM 895 309 35%
VCS 152 126 83%
TOTAL 1297 571 -

Methane abatement options covered by CDM
Type #% of
total
CERs Issued
(000)
% of
Issued
Wind 2615 29% 89,508,434 8%
Hydro 2322 26% 112,711,988 10%
Biomass energy 896 10% 28,297,086 3%
Methane avoidance 768 8% 13,066,244 1%
EE own generation 471 5% 49,128,799 4%
Landfill gas 434 5% 31,061,439 3%
Solar 384 4% 187,012 0%
EE Industry 164 2% 2,097,096 0%
Fossil fuel switch 152 2% 38,865,451 4%
EE Supply side (power plants) 127 1% 2,016,086 0%
Coal bed/mine methane 116 1% 17,778,260 2%
EE Households 117 1% 134,955 0%
N2O 109 1% 223,793,755 20%
Afforestation & Reforestation 72 1% 4,997,605 0%
Fugitive 65 1% 15,599,538 1%
Cement 40 0% 2,527,722 0%
Transport 42 0% 643,857 0%
EE Service 39 0% 5,627 0%
Geothermal 36 0% 4,262,475 0%
Energy distrib. 27 0% 315,948 0%
HFCs 23 0% 454,849,078 42%
PFCs and SF6 17 0% 2,228,929 0%
Mixed renewables 9 0% 16,253 0%
CO2 usage 3 0% 10,248 0%
Tidal 1 0% 108,184 0%
Agriculture 2 0% - 0%
Total 9051 100% 1,094,212,069 100%
Aerobic treatment of waste water
Composting
Domestic manure
Industrial solid waste manure
Palm oil waste
Waste water
Combustion of municipal solid waste (MSW)
Gasification / biogas from MSW
Integrated solid waste management
Landfill composting
Landfill flaring
Landfill power
Coal bed/mine methane to power
Coal bed/mine methane to consumers
Charcoal production
Natural gas pipelines leak reduction
Oil & Gas processing flaring

Methane abatement projects in the CDM pipeline
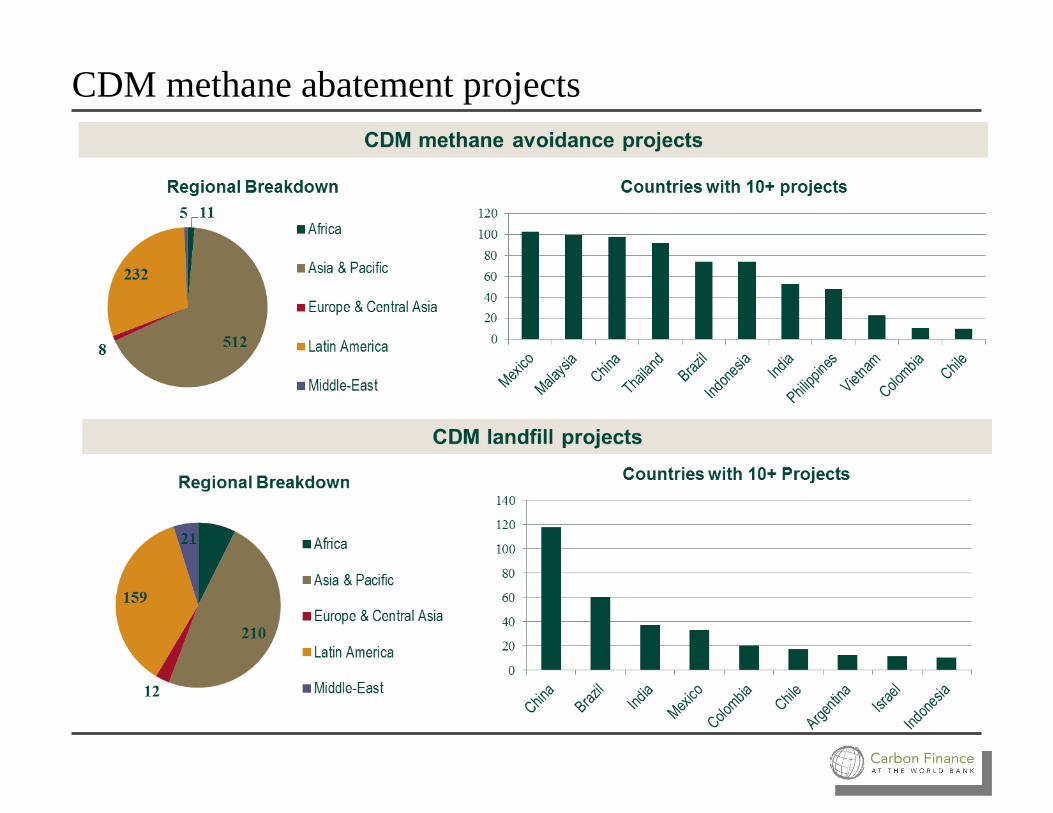
CDM methane abatement projects

Methane abatement CDM projects:
low performing “low-hanging fruit”
From 1397 projects in the CDM pipeline only 20% are issuing CERs
Average issuance success rate shows low delivery performance
Type of project # of projects to date Average issuance
success to date
Expected credits to 2020
(MtCO2e, PDD)
Methane avoidance 768 59% 333.206
Waste water 314 77% 159.273
Manure 288 48% 112.409
Composting 59 43% 26.376
Landfill gas 434 52% 913.787
Landfill power 200 50% 333.248
Landfill flaring 133 53% 485.770
Combustion of MSW 48 73% 52.063
Fugitive 65 86% 453.244
Oil field flaring reduction 34 95% 350.931
Natural gas pipelines 15 97% 73.109
Charcoal production 8 12% 18.829
CBM/CMM 112 59% 672.999
TOTAL 1397 - 2,373.235
1
Methane Project Development Cycles and the Role of Finance
World Bank Methane Finance Study Group: 2nd Meeting
U.S. Environmental Protection Agency

2 2
Agenda
Overview of Methane Project Cycle and
Related RBF Considerations
Agriculture
Coal Mining
Landfills
Oil and Natural Gas Systems
Wastewater

3 3
Livestock and Agro-Industrial Waste – Project Cycle
Project
Design,
Emissions
and
Financial
nalysis
Project
Construction
Project Start-up,
shake down,
and operational
training
Project
Identification
Key Activities (Cost) Thru program marketing
Screen project (L)
applications
Identify project type
Notify applicants (L)
Stakeholders
Industry
Facility owner/operators
GMI delegates
Barriers (Importance)
1. Financial access to
initial capital
2. Past technical
failures and/or
reluctance
3. Utility rates and inter-
ties
Key Activities (Cost)
Preliminary design (M)
Project Plan (M)
Identify costs and
revenues (L)
Develop C/B
analysis (L)
Verify commitment (L)
Stakeholders
Facility owners
Design technicians
GMI Delegates
Barriers (Importance)
1. Finance unavailable
2. Credible
design/service
industry missing
3. Owner may balk
4. Regulation adds
cost/burden
Key Activities (Cost) Construction/Operation
(H)
Secure material and
equipment (H)
Excavate (H)
Build (H)
Stakeholders
Facility owner
Designer/equipment
suppliers
Regulators
Barriers (Importance)
1. Credible
design/service/equip
ment industry missing
Key Activities (Cost) Start-up and Operation
(H)
Operation training and
support (L-M)
Stakeholders
Facility owner
Designer/equipment
suppliers
Regulators
Program/GMI
administration
Barriers (Importance)
Owner/operator insists
on design changes (M-
H)
Key Activities (Cost) O&M
General maintenance
(L)
Engine maintenance
(M)
Monitor; report; verify (L)
Stakeholders
Facility owner
Designer/equipment
suppliers
Regulators
Program/GMI
administration
Barriers (Importance)
Owner/operator changes
system operation (H)
Adds animals substrate
Does not meet regulatory
standard (m-H)
Equipment supplier and
developer unsupportive
(L-M)
Project
Maintenance
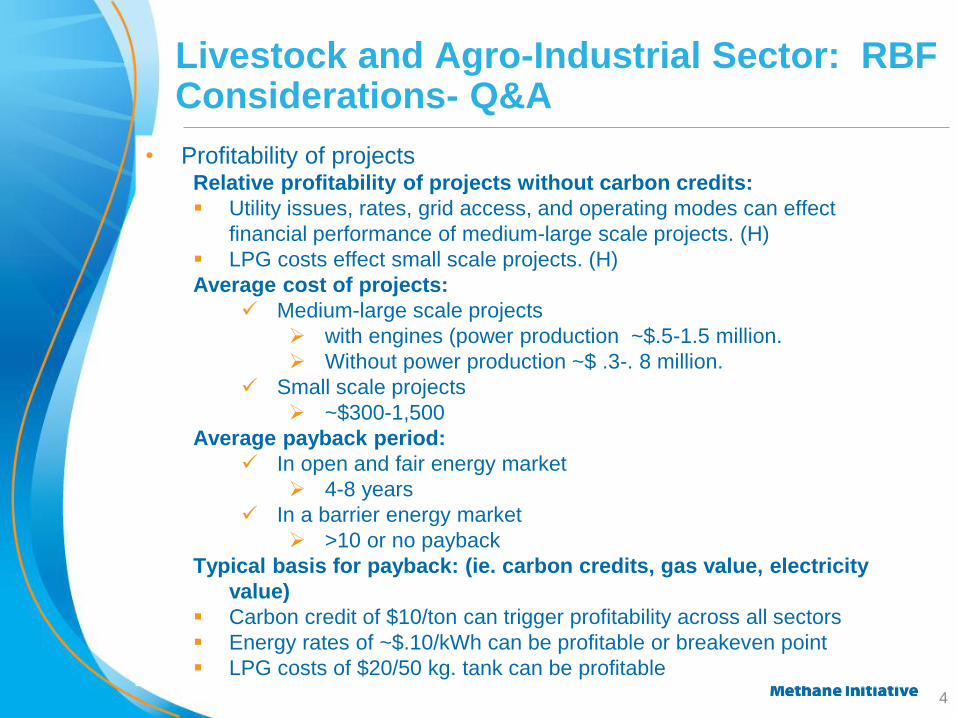
4 4
Livestock and Agro-Industrial Sector: RBF Considerations- Q&A
• Profitability of projects Relative profitability of projects without carbon credits:
Utility issues, rates, grid access, and operating modes can effect
financial performance of medium-large scale projects. (H)
LPG costs effect small scale projects. (H)
Average cost of projects:
Medium-large scale projects
with engines (power production ~$.5-1.5 million.
Without power production ~$ .3-. 8 million.
Small scale projects
~$300-1,500
Average payback period:
In open and fair energy market
4-8 years
In a barrier energy market
>10 or no payback
Typical basis for payback: (ie. carbon credits, gas value, electricity
value)
Carbon credit of $10/ton can trigger profitability across all sectors
Energy rates of ~$.10/kWh can be profitable or breakeven point
LPG costs of $20/50 kg. tank can be profitable
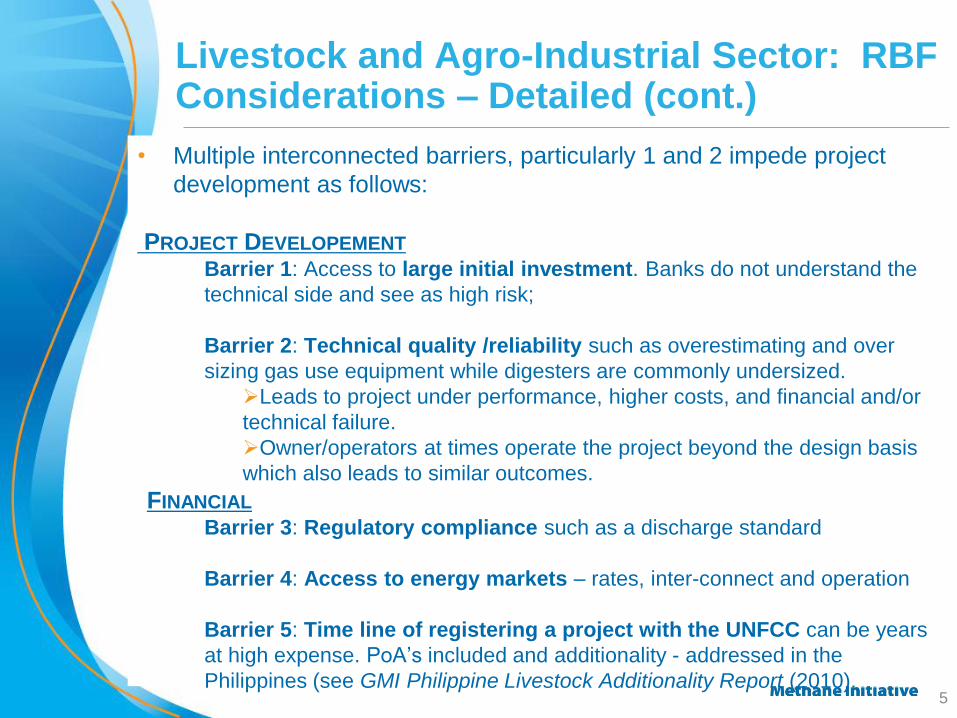
5 5
Livestock and Agro-Industrial Sector: RBF Considerations – Detailed (cont.)
• Multiple interconnected barriers, particularly 1 and 2 impede project
development as follows:
PROJECT DEVELOPEMENT Barrier 1: Access to large initial investment. Banks do not understand the
technical side and see as high risk;
Barrier 2: Technical quality /reliability such as overestimating and over
sizing gas use equipment while digesters are commonly undersized.
Leads to project under performance, higher costs, and financial and/or
technical failure.
Owner/operators at times operate the project beyond the design basis
which also leads to similar outcomes.
FINANCIAL Barrier 3: Regulatory compliance such as a discharge standard
Barrier 4: Access to energy markets – rates, inter-connect and operation
Barrier 5: Time line of registering a project with the UNFCC can be years
at high expense. PoA’s included and additionality - addressed in the
Philippines (see GMI Philippine Livestock Additionality Report (2010).
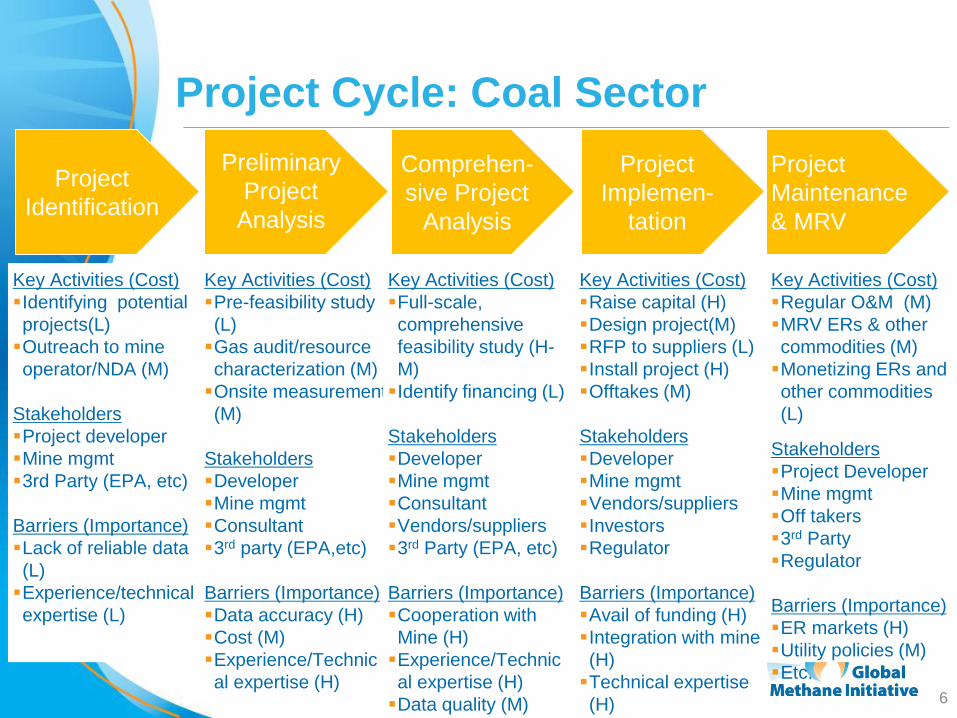
6 6
Project Cycle: Coal Sector
Preliminary
Project
Analysis
Comprehen-
sive Project
Analysis
Project
Implemen-
tation
Project
Maintenance
& MRV
Project
Identification
Key Activities (Cost)
Identifying potential
projects(L)
Outreach to mine
operator/NDA (M)
Stakeholders
Project developer
Mine mgmt
3rd Party (EPA, etc)
Barriers (Importance)
Lack of reliable data
(L)
Experience/technical
expertise (L)
Key Activities (Cost)
Pre-feasibility study
(L)
Gas audit/resource
characterization (M)
Onsite measurement
(M)
Stakeholders
Developer
Mine mgmt
Consultant
3rd party (EPA,etc)
Barriers (Importance)
Data accuracy (H)
Cost (M)
Experience/Technic
al expertise (H)
Key Activities (Cost)
Full-scale,
comprehensive
feasibility study (H-
M)
Identify financing (L)
Stakeholders
Developer
Mine mgmt
Consultant
Vendors/suppliers
3rd Party (EPA, etc)
Barriers (Importance)
Cooperation with
Mine (H)
Experience/Technic
al expertise (H)
Data quality (M)
Key Activities (Cost)
Raise capital (H)
Design project(M)
RFP to suppliers (L)
Install project (H)
Offtakes (M)
Stakeholders
Developer
Mine mgmt
Vendors/suppliers
Investors
Regulator
Barriers (Importance)
Avail of funding (H)
Integration with mine
(H)
Technical expertise
(H)
Key Activities (Cost)
Regular O&M (M)
MRV ERs & other
commodities (M)
Monetizing ERs and
other commodities
(L)
Stakeholders
Project Developer
Mine mgmt
Off takers
3rd Party
Regulator
Barriers (Importance)
ER markets (H)
Utility policies (M)
Etc.
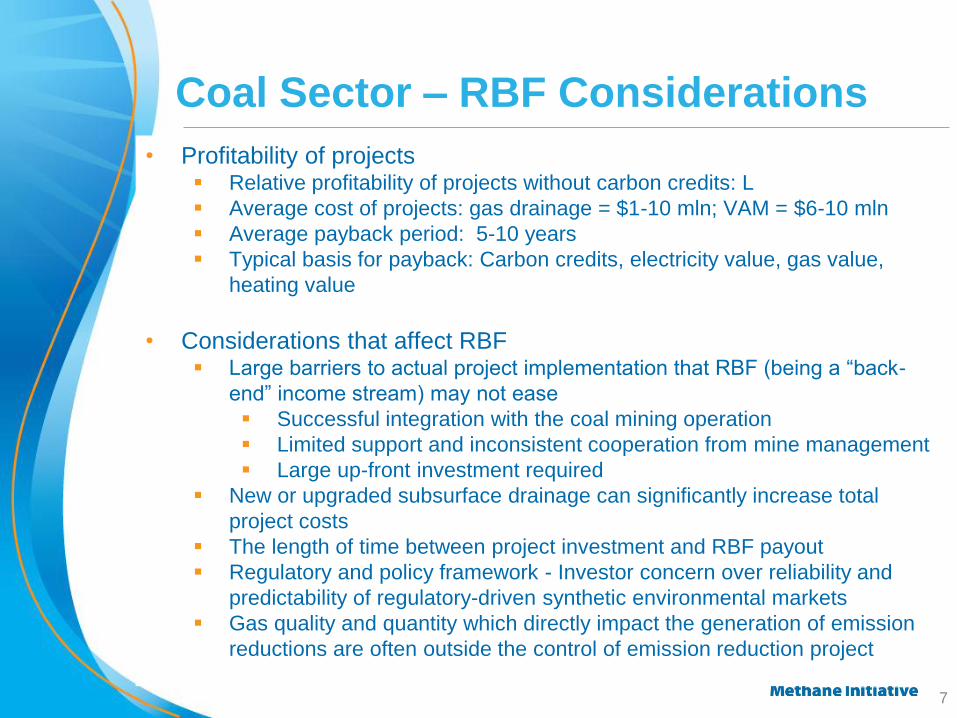
7 7
Coal Sector – RBF Considerations
• Profitability of projects Relative profitability of projects without carbon credits: L
Average cost of projects: gas drainage = $1-10 mln; VAM = $6-10 mln
Average payback period: 5-10 years
Typical basis for payback: Carbon credits, electricity value, gas value,
heating value
• Considerations that affect RBF Large barriers to actual project implementation that RBF (being a “back-
end” income stream) may not ease
Successful integration with the coal mining operation
Limited support and inconsistent cooperation from mine management
Large up-front investment required
New or upgraded subsurface drainage can significantly increase total
project costs
The length of time between project investment and RBF payout
Regulatory and policy framework - Investor concern over reliability and
predictability of regulatory-driven synthetic environmental markets
Gas quality and quantity which directly impact the generation of emission
reductions are often outside the control of emission reduction project

8 8
Project Cycle: Landfill Sector
Preliminary
Project
Analysis
Comprehen
sive Project
Analysis
Project
Implemen-
tation
Project
Maintenance
& MRV
Project
Identification
Key Activities (Cost)
Identify candidate sites
(L)
Obtain commitment of
site owner (L)
Stakeholders
Landfill owner
Third party (EPA,
project developer,
development bank)
Barriers (Importance)
Lack of reliable data (L)
Lack of technical
expertise/experience (L)
Key Activities (Cost)
Desktop evaluation (L)
Pre-feasibility study (M)
Onsite inspection/visit
(L)
Stakeholders
Landfill owner
Third party
Consultant
Barriers (Importance)
Historical and accurate
data (M)
PFS is a sunk cost (M)
Experience/technical
expertise (M)
Key Activities (Cost)
Full-scale,
comprehensive
feasibility study (H)
Identify roles and
financial responsibilities
of project partners (L)
Initial project design (M)
Stakeholders
Landfill owner/Gas
rights owner
Third party
Consultant
Barriers (Importance)
Determination of gas
rights owner (M-H)
Cost (H)
Experience/technical
expertise (M)
Key Activities (Cost)
Issue RFP (M)
Award contract (L)
Final project design (M)
Secure financing (M)
Install project (H)
Stakeholders
Landfill owner/Gas
rights owner
Project developer
Investors
Vendors
Offtakers
Barriers (Importance)
Success of RFP
process (H)
Costs/Avail of financing
(H)
Energy/Utility policies
(M)
Low carbon prices (H)
Key Activities (Cost)
Regular O&M (M)
Monitor, report, and
verify ERs (M)
Stakeholders
Project
developer/Vendors
Regulators
Offtakers
Landfill operator
Barriers (Importance)
Carbon markets (H)
Experience/technical
expertise (H)
Poor O&M of regular
landfill operations (H)
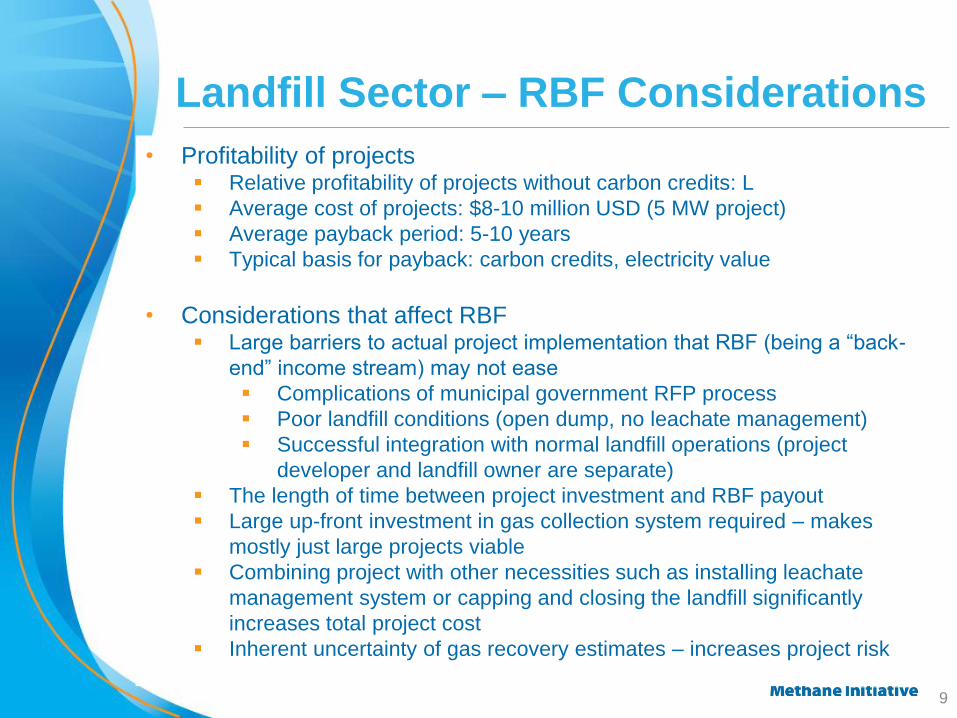
9 9
Landfill Sector – RBF Considerations
• Profitability of projects Relative profitability of projects without carbon credits: L
Average cost of projects: $8-10 million USD (5 MW project)
Average payback period: 5-10 years
Typical basis for payback: carbon credits, electricity value
• Considerations that affect RBF Large barriers to actual project implementation that RBF (being a “back-
end” income stream) may not ease
Complications of municipal government RFP process
Poor landfill conditions (open dump, no leachate management)
Successful integration with normal landfill operations (project
developer and landfill owner are separate)
The length of time between project investment and RBF payout
Large up-front investment in gas collection system required – makes
mostly just large projects viable
Combining project with other necessities such as installing leachate
management system or capping and closing the landfill significantly
increases total project cost
Inherent uncertainty of gas recovery estimates – increases project risk
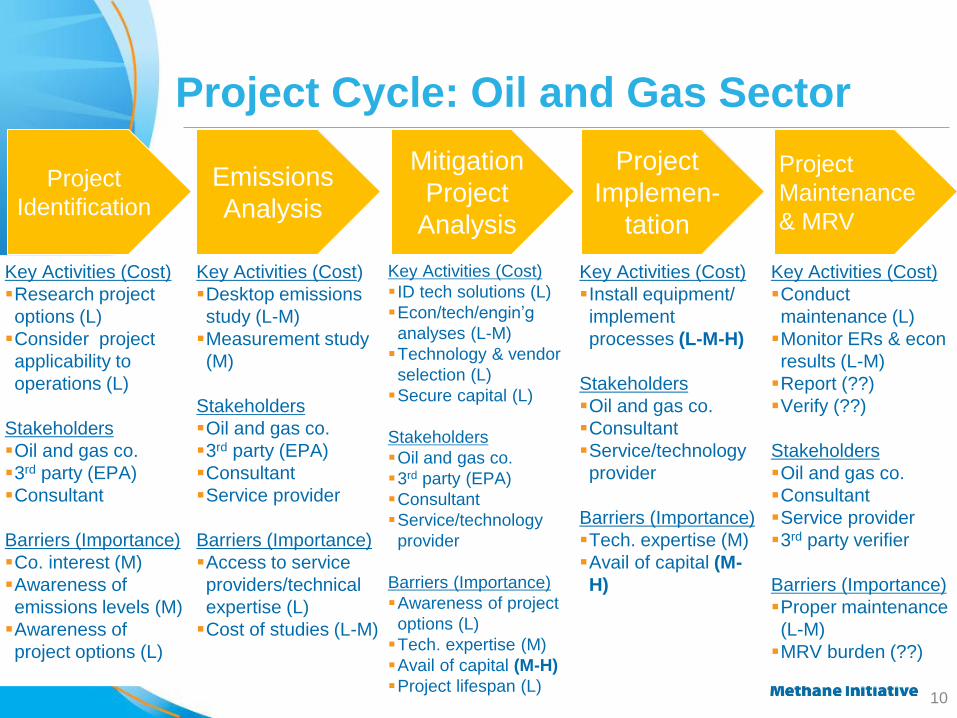
10 10
Project Cycle: Oil and Gas Sector
Emissions
Analysis
Mitigation
Project
Analysis
Project
Implemen-
tation
Project
Maintenance
& MRV
Project
Identification
Key Activities (Cost)
Research project
options (L)
Consider project
applicability to
operations (L)
Stakeholders
Oil and gas co.
3rd party (EPA)
Consultant
Barriers (Importance)
Co. interest (M)
Awareness of
emissions levels (M)
Awareness of
project options (L)
Key Activities (Cost)
Desktop emissions
study (L-M)
Measurement study
(M)
Stakeholders
Oil and gas co.
3rd party (EPA)
Consultant
Service provider
Barriers (Importance)
Access to service
providers/technical
expertise (L)
Cost of studies (L-M)
Key Activities (Cost)
ID tech solutions (L)
Econ/tech/engin’g
analyses (L-M)
Technology & vendor
selection (L)
Secure capital (L)
Stakeholders
Oil and gas co.
3rd party (EPA)
Consultant
Service/technology
provider
Barriers (Importance)
Awareness of project
options (L)
Tech. expertise (M)
Avail of capital (M-H)
Project lifespan (L)
Key Activities (Cost)
Install equipment/
implement
processes (L-M-H)
Stakeholders
Oil and gas co.
Consultant
Service/technology
provider
Barriers (Importance)
Tech. expertise (M)
Avail of capital (M-
H)
Key Activities (Cost)
Conduct
maintenance (L)
Monitor ERs & econ
results (L-M)
Report (??)
Verify (??)
Stakeholders
Oil and gas co.
Consultant
Service provider
3rd party verifier
Barriers (Importance)
Proper maintenance
(L-M)
MRV burden (??)
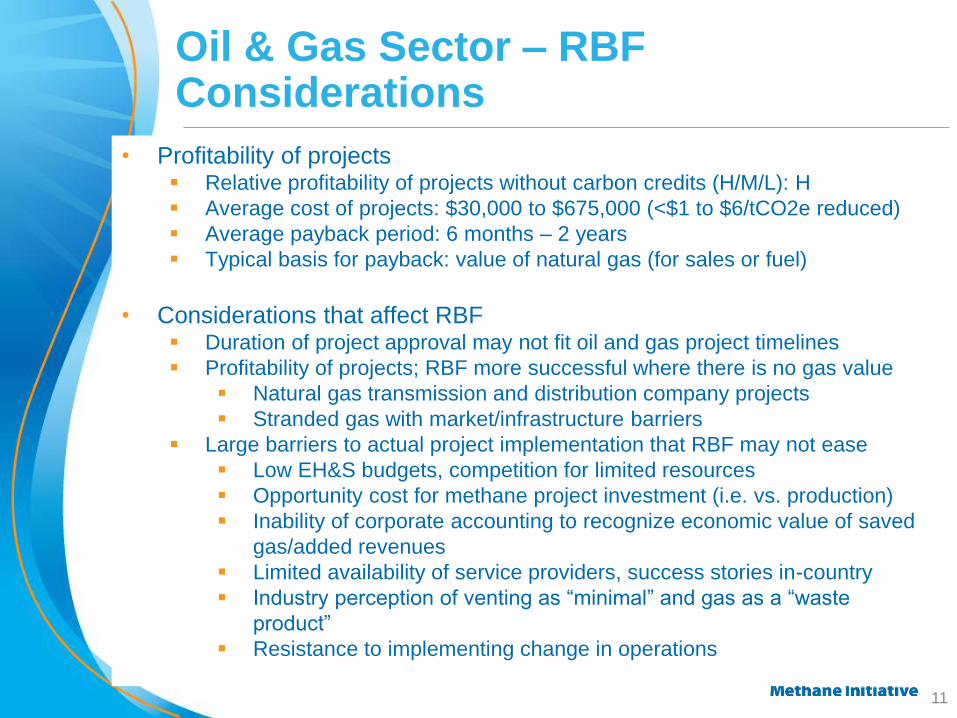
11 11
Oil & Gas Sector – RBF Considerations
• Profitability of projects Relative profitability of projects without carbon credits (H/M/L): H
Average cost of projects: $30,000 to $675,000 (<$1 to $6/tCO2e reduced)
Average payback period: 6 months – 2 years
Typical basis for payback: value of natural gas (for sales or fuel)
• Considerations that affect RBF Duration of project approval may not fit oil and gas project timelines
Profitability of projects; RBF more successful where there is no gas value
Natural gas transmission and distribution company projects
Stranded gas with market/infrastructure barriers
Large barriers to actual project implementation that RBF may not ease
Low EH&S budgets, competition for limited resources
Opportunity cost for methane project investment (i.e. vs. production)
Inability of corporate accounting to recognize economic value of saved
gas/added revenues
Limited availability of service providers, success stories in-country
Industry perception of venting as “minimal” and gas as a “waste
product”
Resistance to implementing change in operations

12 12
Project Cycle: Wastewater Sector
Preliminary
Project
Analysis
Comprehensive
Project Analysis
Project
Implementation
Project
Maintenance
& MRV
Project
Identification
Key Activities (Cost)
Outreach to WWTP
operators (L)
Screening of
WWTP(s) for project
viability (L)
Assess need for pre-
feasibility study
based on screening
(L)
Stakeholders
Professional
organization(s)
WW utility/utilities
Consultant(s)
Barriers (Importance)
1. Lack of reliable
data (M)
2. Awareness of
options (L)
Key Activities (Cost)
Pre-feasibility
assessment / gas
modeling / end-use
options (L)
Assess availability of
financing (L)
Preliminary design
based on analysis
(M)
Stakeholders
WW utility
Consultants
Barriers (Importance)
1. Financial (H)
2. Technical
feasibility (M)
3. Utility rates and
interconnects (H)
Key Activities (Cost)
Full-scale feasibility
study (M)
Identify financing (L)
Stakeholders
WW utility
Developer
Consultant(s)
Financial institutions
Barriers (Importance)
Communications
with WW utility (H)
Data (M)
Past tech.
experience (M)
Key Activities (Cost)
Raise capital (H)
Design project (M)
RFP to suppliers (L)
Construction (H)
Start-up and
Operation (H)
Stakeholders
WW utility
Developer
Consultant(s)
Financial institutions
Barriers (Importance)
Comm. with financial
community (M)
Tech. expertise (M)
Key Activities (Cost)
O&M training (L-M)
MRV ERs / other
commodities (M)
Monetizing ERs /
other commodities (L)
Stakeholders
WW utility
Developer
Consultant(s)
Barriers (Importance)
ER markets (H)
Utility policy (M)

13 13
Wastewater Sector – RBF Considerations
• Profitability of projects Relative profitability of projects without carbon credits: H/M
Average cost of projects: 20-60 million USD
Average payback period: 6 to 10 years
Typical basis for payback: Gas sales; offset energy costs to WW utility
through self-generation
• Considerations that affect RBF Large barriers to actual project implementation that RBF may not ease
Relatively large project risks and/or project risks outside the control
of project developers
Relatively large up-front investment required
Technical and policy and institutional barriers.

14
Contact Information – US EPA
Kurt Roos
Agricultural Methane Programs
202 343-9041, [email protected]
Felicia A. Ruiz
Coalbed Methane Outreach Program (CMOP)
(202) 343-9129, [email protected]
Victoria Ludwig
EPA Landfill Methane Outreach Program
Phone: (202) 343-9291, [email protected]
Carey Bylin
GMI Oil and Gas
+1-202-343-9669, [email protected]
Christopher Godlove
EPA Landfill Methane Outreach Program, GMI Waste Water Sector
Phone: (202) 343-9795, [email protected]
www.globalmethane.org 14

15
ANNEX
15

16 16
Livestock and Agro-Industrial Waste – Development of Country Plan
Detailed
Country
Resource
Assessment
Resource
Assessment
Analysis and
Findings
Program
Development
Program
implementation
Preliminary
Country
Assessment
Key Activity (Cost)
•Desk top analysis
of livestock and
agro-industrial data
identify potential
sectors for
mitigation (L)
•Used to make “go”
or “no go” decision
to conduct a
Resource
Assessment (RA)
All parts done with:
1. Industry 2. Government
3. Coordinating entities
(if programmatic)
4. GMI delegates
Key Activities (Cost)
Based on industry
visitation (statistically
based )
Characterizes waste
management processes
according to scale and
sector (swine, dairy,
cassava, potato etc) (H)
Conduct a simultaneous
capacity assessment to
identify technical
industry capacity
equipment/material
availability.
Barriers (all parts) Industry reluctance or
avoidance
Large countries are
typically more difficult
and expensive
Key Activities (Cost) Data analysis
estimates emissions by
sector, ranks sectors,
identifies target sector,
identifies appropriate
technologies (H)
When RA is cross-
walked with capacity
forms basis of an action
plan or program.
Large numbers of
projects need to
mobilized to have
measureable impact.
Random identification of
projects as a strategy
does not work in ag.
Sector.
Key Activities (Cost) • Based on RA and CA
findings. Two objective
requirements for a
sustainable program.
1. Mature and reliable AD
industry in place
(market supply) and a
driver to create market
demand for AD’s such
as program policy etc.
• Implement activities to
meet objectives.
Typically low term and
intensive.
• Phase out as country
demonstrates ability to
run on its own
• This environment
causes projects to come
to you.
•Key Activities (Cost) •Not all countries are the
same .
•Implementation is
based on cost and
reduction potential
and/or other co-
benefits; rural
sanitation and health;
rural development and
employment; energy,
odor management’
point and non-point
source pollution control
etc.
•Develop appropriate
commercial scale
demonstration. (H)
•Implementation
requires 1) targeted
program marketing
and 2.customozed
skills and technology
transfer activities.
PRUDENCIO E. CALADO III
Department Manager
Environmental Program & Management Department
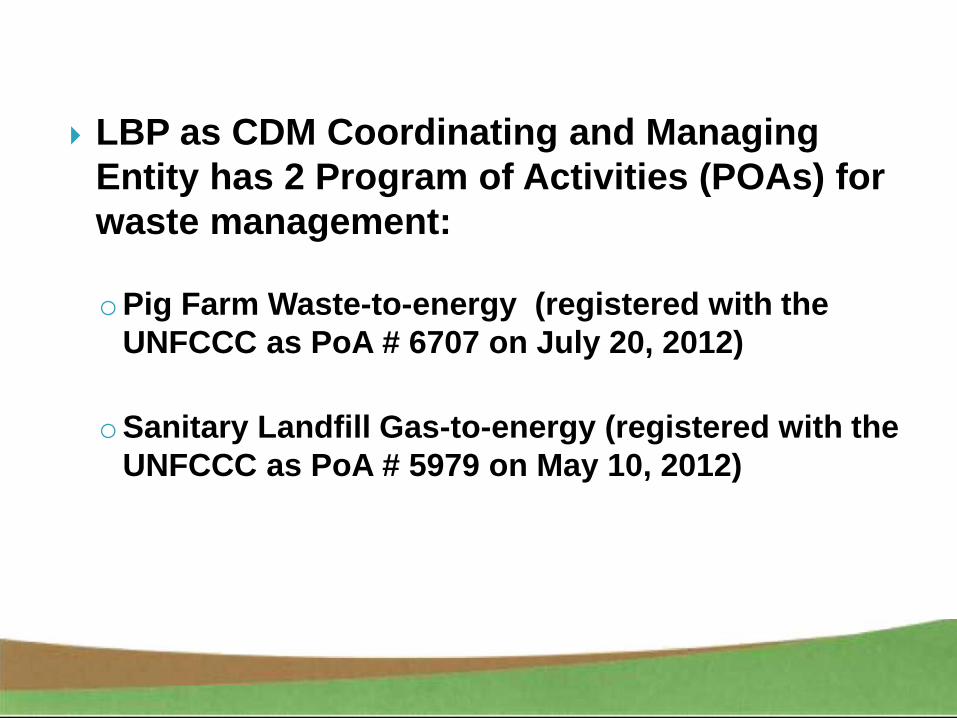
LBP as CDM Coordinating and Managing
Entity has 2 Program of Activities (POAs) for
waste management:
oPig Farm Waste-to-energy (registered with the
UNFCCC as PoA # 6707 on July 20, 2012)
oSanitary Landfill Gas-to-energy (registered with the
UNFCCC as PoA # 5979 on May 10, 2012)
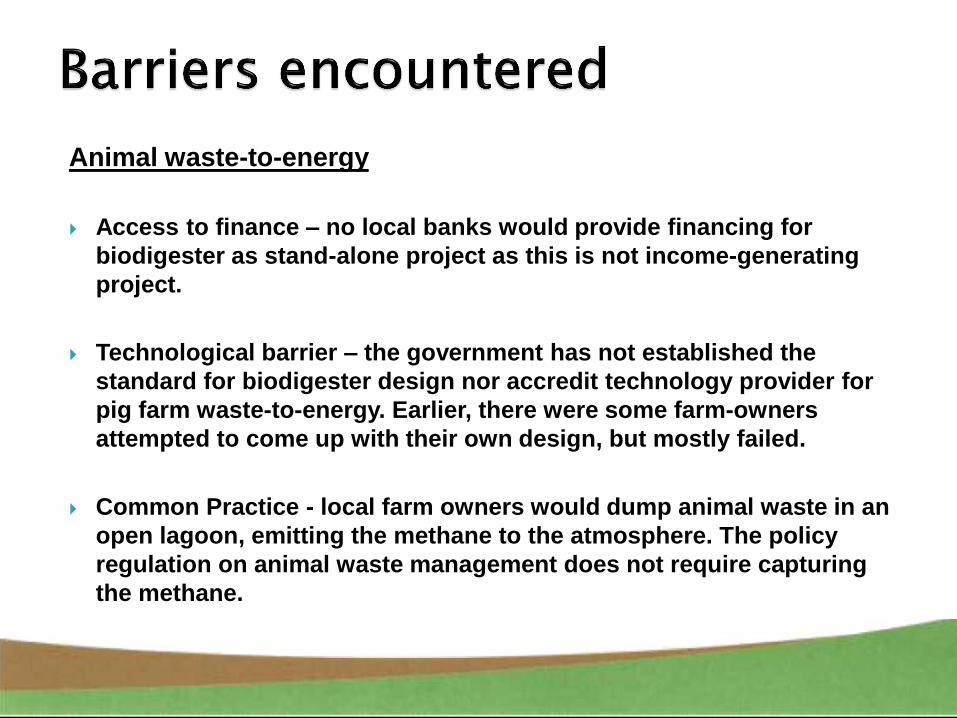
Animal waste-to-energy
Access to finance – no local banks would provide financing for
biodigester as stand-alone project as this is not income-generating
project.
Technological barrier – the government has not established the
standard for biodigester design nor accredit technology provider for
pig farm waste-to-energy. Earlier, there were some farm-owners
attempted to come up with their own design, but mostly failed.
Common Practice - local farm owners would dump animal waste in an
open lagoon, emitting the methane to the atmosphere. The policy
regulation on animal waste management does not require capturing
the methane.
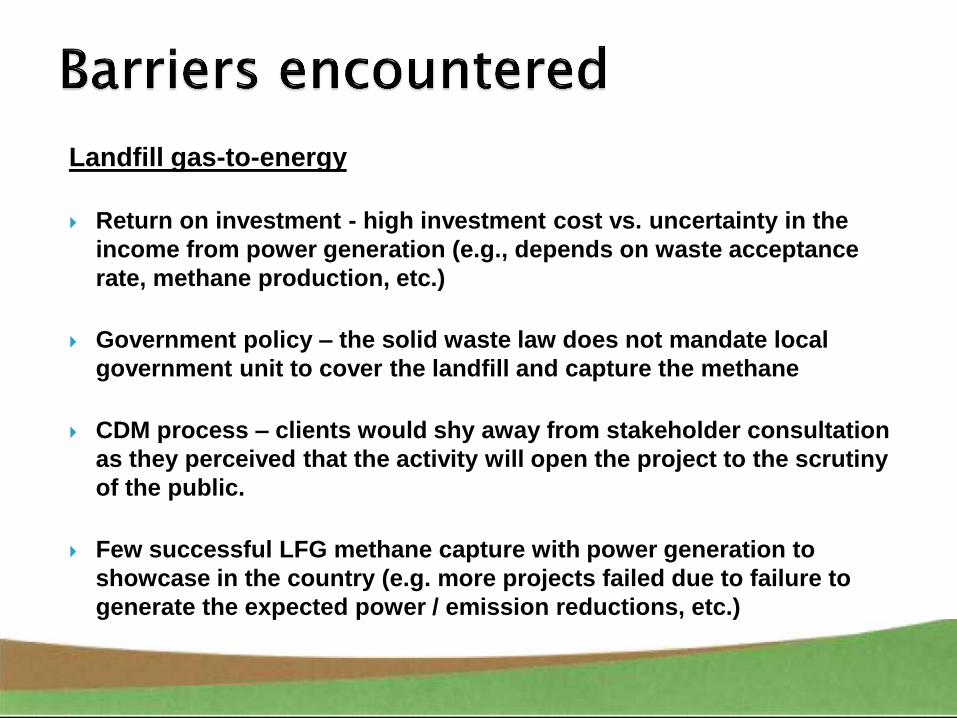
Landfill gas-to-energy
Return on investment - high investment cost vs. uncertainty in the
income from power generation (e.g., depends on waste acceptance
rate, methane production, etc.)
Government policy – the solid waste law does not mandate local
government unit to cover the landfill and capture the methane
CDM process – clients would shy away from stakeholder consultation
as they perceived that the activity will open the project to the scrutiny
of the public.
Few successful LFG methane capture with power generation to
showcase in the country (e.g. more projects failed due to failure to
generate the expected power / emission reductions, etc.)
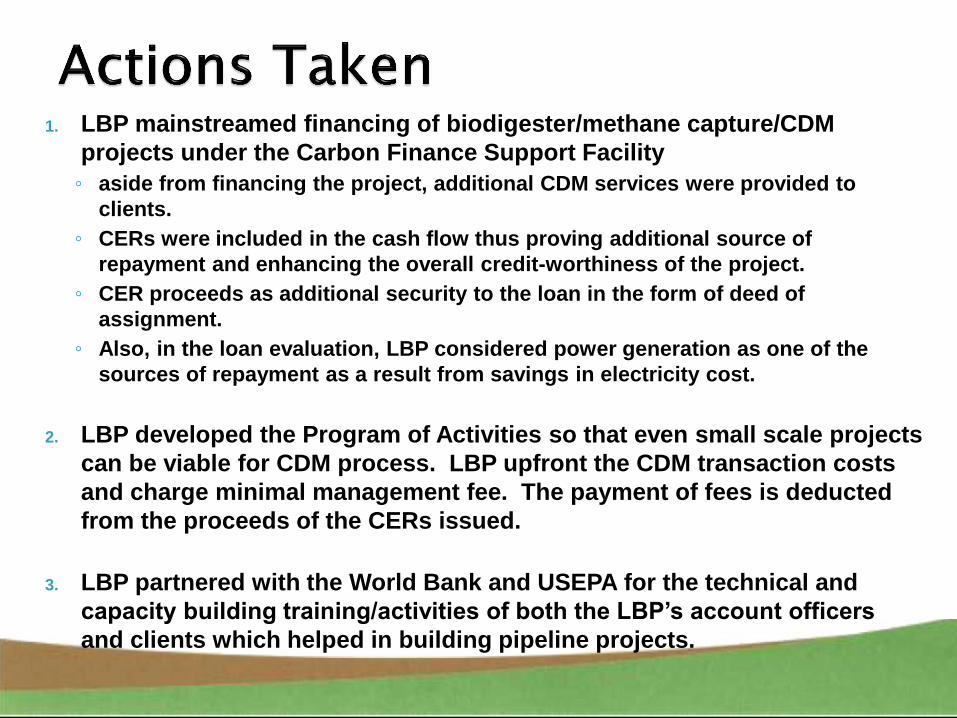
1. LBP mainstreamed financing of biodigester/methane capture/CDM
projects under the Carbon Finance Support Facility
◦ aside from financing the project, additional CDM services were provided to
clients.
◦ CERs were included in the cash flow thus proving additional source of
repayment and enhancing the overall credit-worthiness of the project.
◦ CER proceeds as additional security to the loan in the form of deed of
assignment.
◦ Also, in the loan evaluation, LBP considered power generation as one of the
sources of repayment as a result from savings in electricity cost.
2. LBP developed the Program of Activities so that even small scale projects
can be viable for CDM process. LBP upfront the CDM transaction costs
and charge minimal management fee. The payment of fees is deducted
from the proceeds of the CERs issued.
3. LBP partnered with the World Bank and USEPA for the technical and
capacity building training/activities of both the LBP’s account officers
and clients which helped in building pipeline projects.

Contact Persons: Mr. PRUDENCIO E. CALADO III or Ms. JOSEFINA A. RAMOS Environmental Program and Management Department LAND BANK OF THE PHILIPPINES 27th Floor, LANDBANK Plaza
1598 M.H. Del Pilar corner Dr. J. Quintos Streets Malate, Manila 1004 Philippines
www.landbank.com Telephone +632 405-7539 Fax +632 528-8484 E-mail [email protected] [email protected]
Methane Finance Study Group 2nd Meeting
Billy Pizer
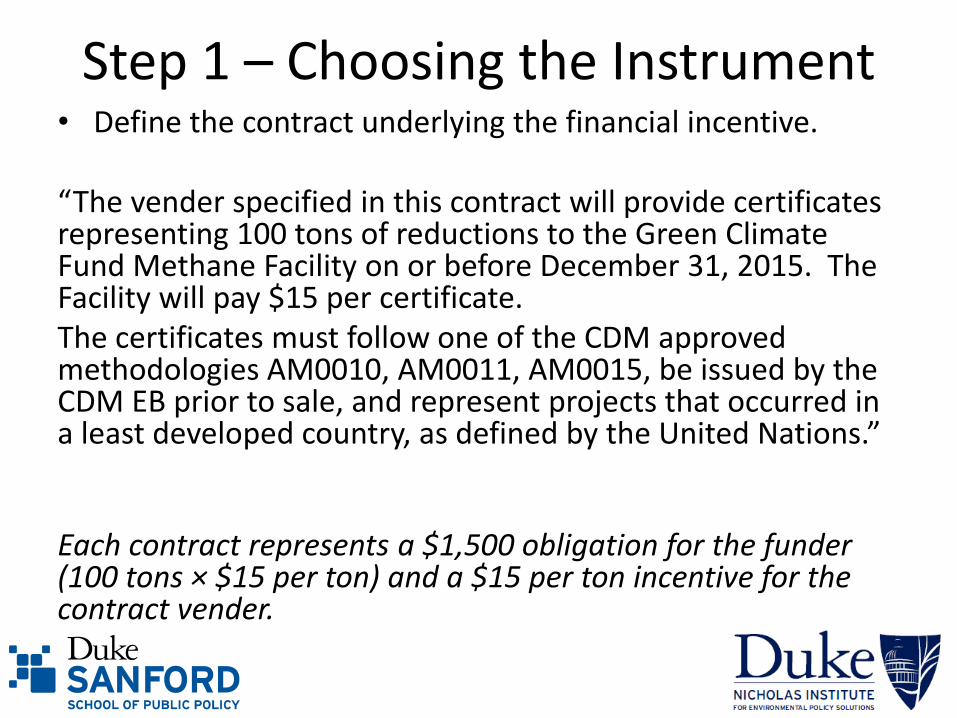
Step 1 – Choosing the Instrument • Define the contract underlying the financial incentive.
“The vender specified in this contract will provide certificates representing 100 tons of reductions to the Green Climate Fund Methane Facility on or before December 31, 2015. The Facility will pay $15 per certificate. The certificates must follow one of the CDM approved methodologies AM0010, AM0011, AM0015, be issued by the CDM EB prior to sale, and represent projects that occurred in a least developed country, as defined by the United Nations.” Each contract represents a $1,500 obligation for the funder (100 tons × $15 per ton) and a $15 per ton incentive for the contract vender.
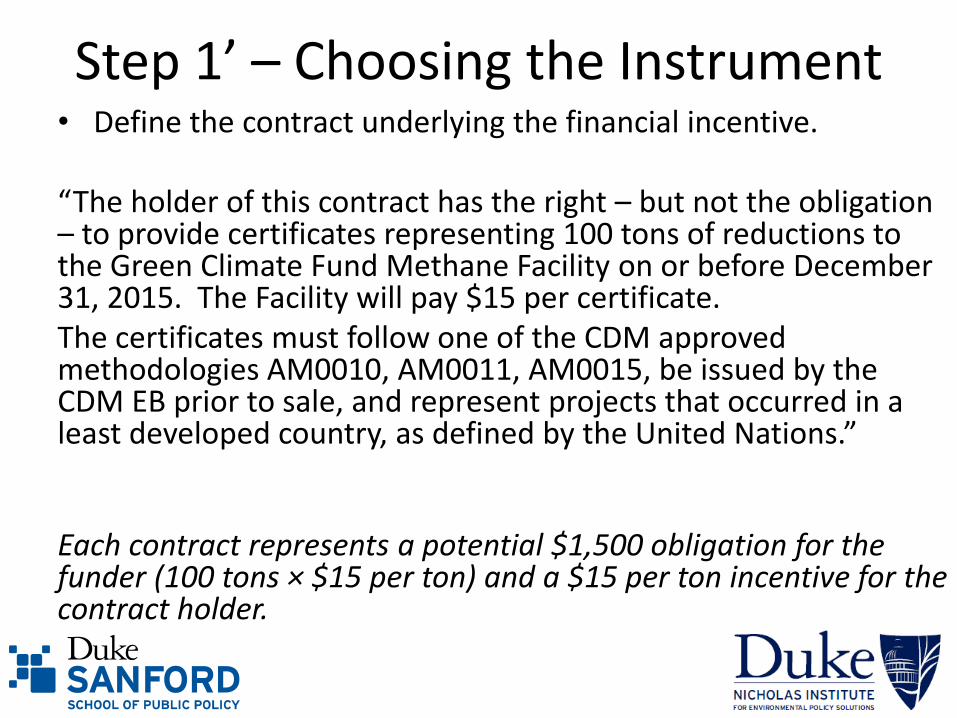
Step 1’ – Choosing the Instrument • Define the contract underlying the financial incentive.
“The holder of this contract has the right – but not the obligation – to provide certificates representing 100 tons of reductions to the Green Climate Fund Methane Facility on or before December 31, 2015. The Facility will pay $15 per certificate. The certificates must follow one of the CDM approved methodologies AM0010, AM0011, AM0015, be issued by the CDM EB prior to sale, and represent projects that occurred in a least developed country, as defined by the United Nations.” Each contract represents a potential $1,500 obligation for the funder (100 tons × $15 per ton) and a $15 per ton incentive for the contract holder.
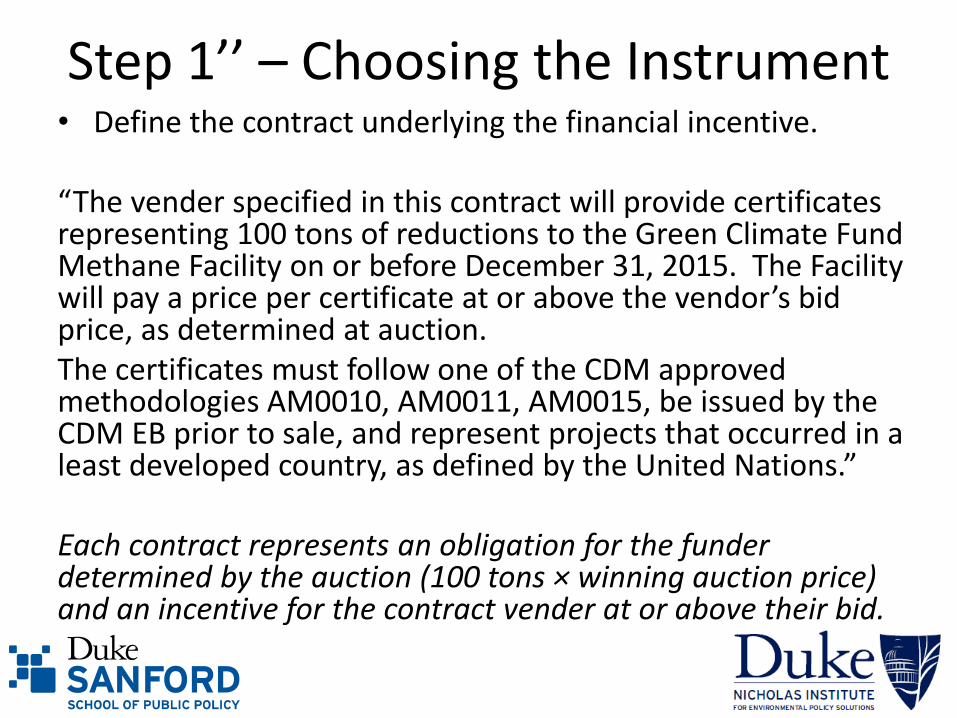
Step 1’’ – Choosing the Instrument • Define the contract underlying the financial incentive.
“The vender specified in this contract will provide certificates representing 100 tons of reductions to the Green Climate Fund Methane Facility on or before December 31, 2015. The Facility will pay a price per certificate at or above the vendor’s bid price, as determined at auction. The certificates must follow one of the CDM approved methodologies AM0010, AM0011, AM0015, be issued by the CDM EB prior to sale, and represent projects that occurred in a least developed country, as defined by the United Nations.” Each contract represents an obligation for the funder determined by the auction (100 tons × winning auction price) and an incentive for the contract vender at or above their bid.
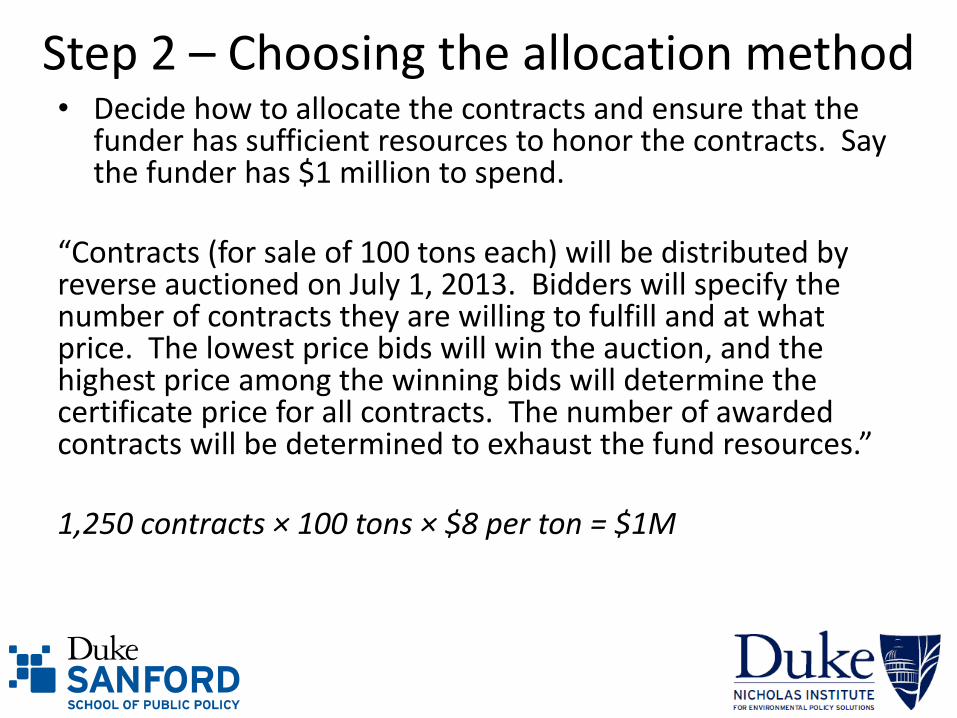
Step 2 – Choosing the allocation method • Decide how to allocate the contracts and ensure that the
funder has sufficient resources to honor the contracts. Say the funder has $1 million to spend.
“Contracts (for sale of 100 tons each) will be distributed by reverse auctioned on July 1, 2013. Bidders will specify the number of contracts they are willing to fulfill and at what price. The lowest price bids will win the auction, and the highest price among the winning bids will determine the certificate price for all contracts. The number of awarded contracts will be determined to exhaust the fund resources.” 1,250 contracts × 100 tons × $8 per ton = $1M
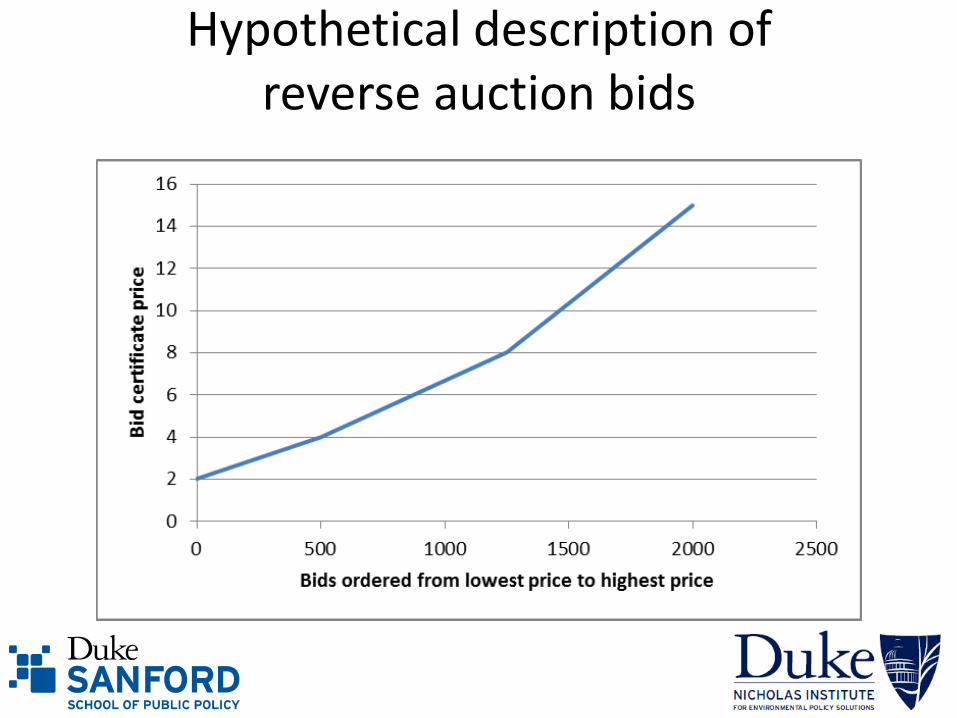
Hypothetical description of reverse auction bids
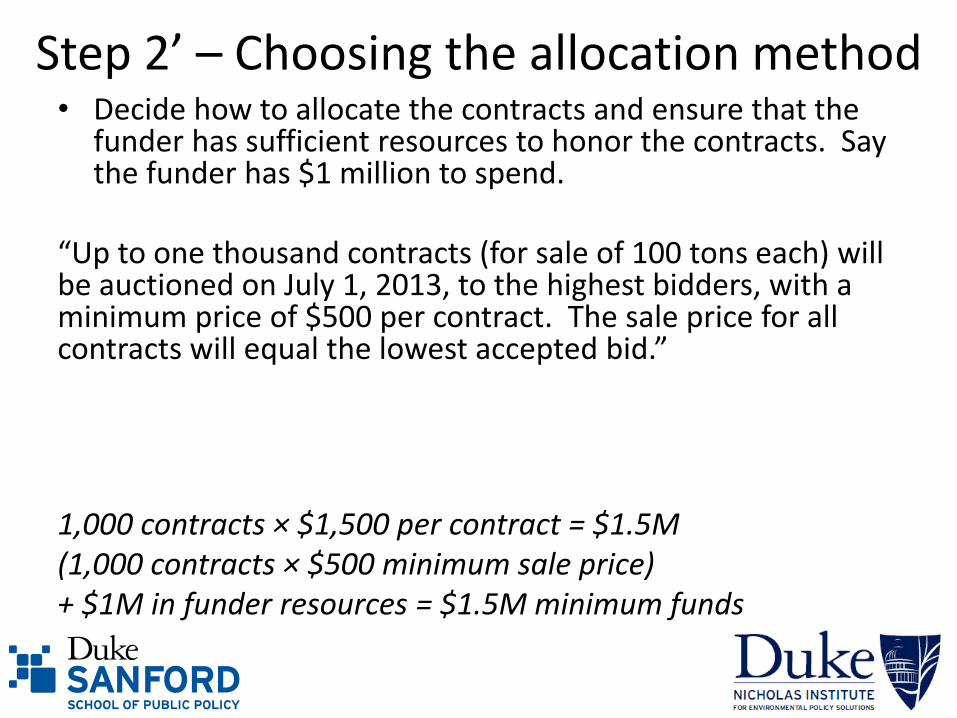
Step 2’ – Choosing the allocation method • Decide how to allocate the contracts and ensure that the
funder has sufficient resources to honor the contracts. Say the funder has $1 million to spend.
“Up to one thousand contracts (for sale of 100 tons each) will be auctioned on July 1, 2013, to the highest bidders, with a minimum price of $500 per contract. The sale price for all contracts will equal the lowest accepted bid.” 1,000 contracts × $1,500 per contract = $1.5M (1,000 contracts × $500 minimum sale price) + $1M in funder resources = $1.5M minimum funds
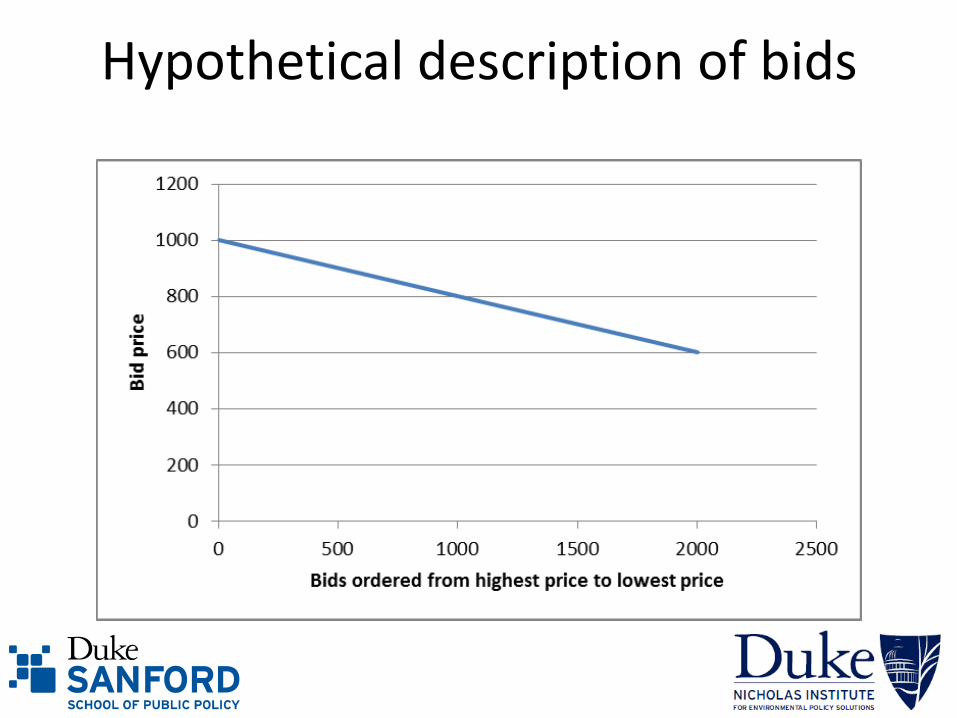
Hypothetical description of bids
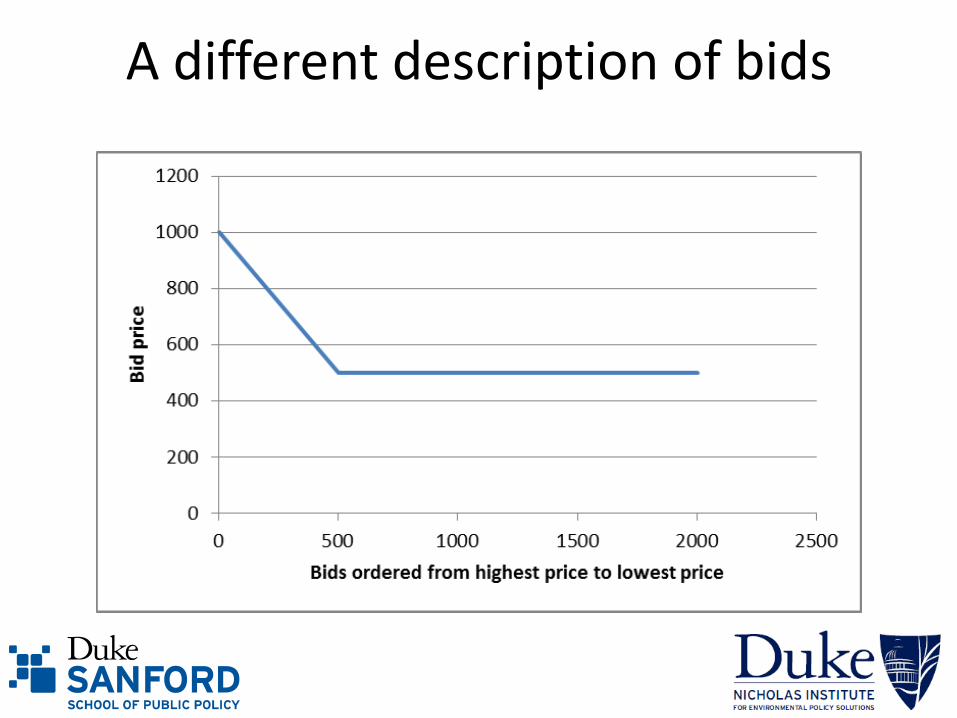
A different description of bids

Step 2’’ – Choosing the allocation method • Decide how to allocate the contracts and ensure that the
funder has sufficient resources to honor the contracts. Say the funder has $1 million to spend.
“Up to 666 contracts (for sale of 100 tons each) will be given on a first-come, first-serve basis to eligible applicants.” 666 contracts × $1,500 per contract = $1M

Step 3 – Establish eligibility
• Establish rules to ensure participation by appropriate and serious developers.
“Auction participants must submit a deposit equal to one-third of their bid value to the Green Climate Fund in advance of the auction. If the participant’s bid is accepted, the deposit will be applied towards payment for the purchased contracts. If the bid is not accepted, the deposit will be returned.”

Step 3’ – Establish eligibility
• Establish rules to ensure participation by appropriate and serious developers.
“Reverse auction participants must submit a deposit of $200 per contract bid to the Green Climate Fund in advance of the auction. If the participant’s bid is accepted, the deposit will be held until the contract is fulfilled, at which point it will be returned. If the bid is not accepted, the deposit will be returned immediately. If a participant’s bid is accept but fails to fulfill the contract, the deposit is forfeited.”

Step 4 – Encourage contract fulfillment
• Establish any rules for transfer and/or contract violations.
“There is no restriction on who may hold these contracts and they are fully transferable. If the contract is transferred, the Green Climate Fund should be notified to re-assign ownership and verify eligibility.”
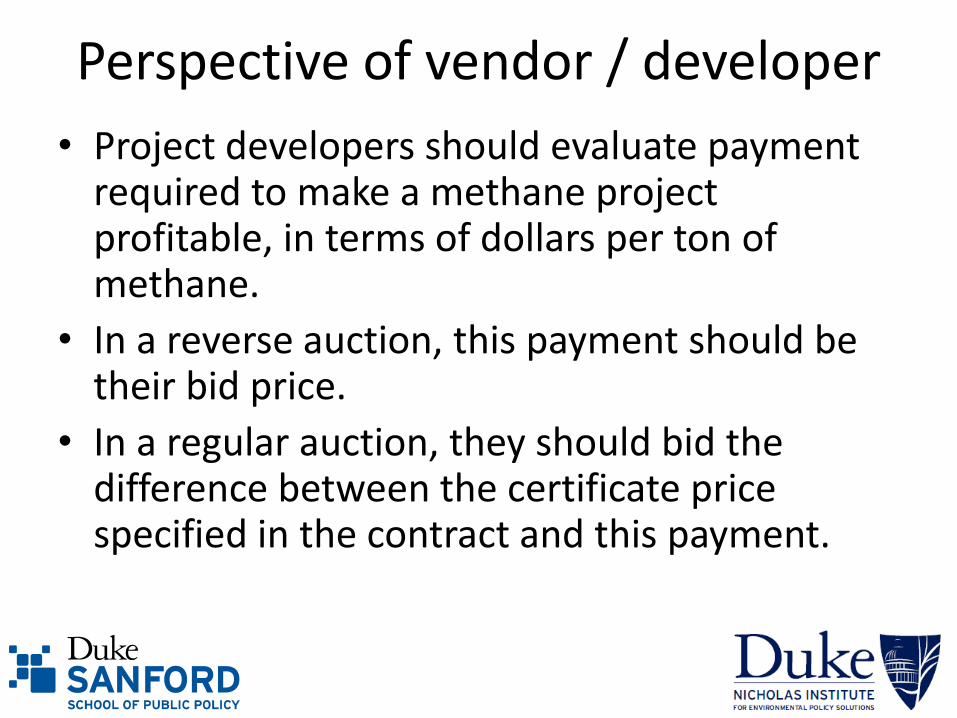
Perspective of vendor / developer
• Project developers should evaluate payment required to make a methane project profitable, in terms of dollars per ton of methane.
• In a reverse auction, this payment should be their bid price.
• In a regular auction, they should bid the difference between the certificate price specified in the contract and this payment.
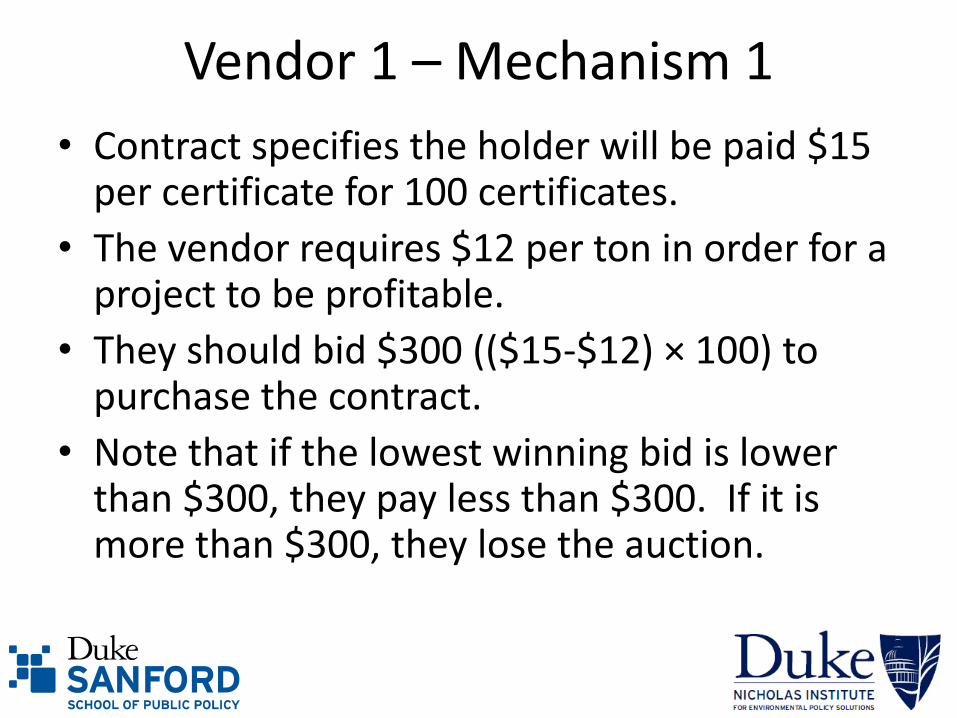
Vendor 1 – Mechanism 1
• Contract specifies the holder will be paid $15 per certificate for 100 certificates.
• The vendor requires $12 per ton in order for a project to be profitable.
• They should bid $300 (($15-$12) × 100) to purchase the contract.
• Note that if the lowest winning bid is lower than $300, they pay less than $300. If it is more than $300, they lose the auction.

Vendor 2 – Mechanism 1
• Contract specifies the holder will be paid $15 per certificate for 100 certificates.
• The vendor requires $9 per ton in order for a project to be profitable.
• They should bid $600 (($15-$9) × 100) to purchase the contract.
• Note that if the lowest winning bid is lower than $600, they pay less than $600. If it is more than $600, they lose the auction.

Vendor 1 – Mechanism 2
• Contract specifies the holder will deliver 100 certificates at a price determined by reverse auction.
• The vendor requires $12 per ton in order for a project to be profitable.
• They should bid $12 as the price at which they are willing to deliver certificates.
• Note that if the highest winning bid is higher than $12, they will be paid more than $12 per certificate. If it is less than $12, they lose the reverse auction.

Vendor 2 – Mechanism 2
• Contract specifies the holder will be paid $15 per certificate for 100 certificates.
• The vendor requires $9 per ton in order for a project to be profitable.
• They should bid $9 as the price at which they are willing to deliver certificates.
• Note that if the highest winning bid is higher than $9, they will be paid more than $9 per certificate. If it is less than $9, they lose the reverse auction.