april 2011 asia pacific conservation region marine program report 2011 final.pdfdaya alam (bbksda)...
TRANSCRIPT

Report Compiled By:
April 2011
Asia Pacific Conservation Region
Marine Program
Report No 3/11

April 2011
Asia Pacific Conservation Region
Marine Program
Report No 3/11
Report Compiled By:

Acknowledgements
We would like to thank the communities of Raja Ampat for sharing their knowledge and detailed information on how they use their marine resources. We are grateful to Meta Ancelino, Yohanes Goram Gaman, Ferry Liuw, and Paulus Thebu for providing field assistance and helping to conduct interviews. Peter Mous gave inputs into the original survey questionnaire and helped categorize the types of fishing gear. Alan White provided input on research questions and feedback on early drafts. This work was supported by the Dinas Kelautan dan Perikanan and Balai Besar Konservasi Sumber Daya Alam (BBKSDA) Papua Barat. This work was funded by AusAID, USAID, the David and Lucille Packard Foundation, the Schooner Foundation, and the HGH Foundation

Report on a Coastal Rural Appraisal in Raja Ampat Regency, West Papua, Indonesia
iii
Contents
Acknowledgements ........................................................................................................................................ ii
Contents ...............................................................................................................................................................iii
Executive Summary ....................................................................................................................................... iv
INTRODUCTION .............................................................................................................................................1
METHODS ............................................................................................................................................................. 2
RESULTS FROM VILLAGE SURVEY................................................................................................... 2
Occupations ........................................................................................................................................................ 2 Number ................................................................................................................................................................. 2 Percentage ............................................................................................................................................................ 2
RESULT FROM INDIVIDUAL SURVEY .......................................................................................... 4
STATISTICAL ANALYSIS RESULTS ..................................................................................................15
DISCUSSION ..................................................................................................................................................... 18
Outsiders and Destructive Fishing Practices............................................................................................... 18 A Shifting Baseline Syndrome Among Fishers In Raja Ampat .............................................................. 19 Diverse Livelihood Strategies ......................................................................................................................... 20
CONCLUSION ................................................................................................................................................. 21
REFERENCES ..................................................................................................................................................... 22
APPENDICES ..................................................................................................................................................... 24
Appendix 1: District Changes In Raja Ampat ............................................................................................. 24 Appendix 2: Map Of Raja Ampat .................................................................................................................. 26
Report on a Coastal Rural Appraisal in Raja Ampat Regency, West Papua, Indonesia
iv
Executive Summary The Raja Ampat archipelago in eastern Indonesia is a priority for national and international conservation initiatives as it contains some of the greatest known diversity of fish and coral species worldwide. It is also home to over 30,000 people, most of whom rely on marine resources for their livelihoods.
We present results from a survey of residents in 88 villages of Raja Ampat about their use of marine resources. We also examine conventional wisdoms concerning marine conservation using the survey data, finding that: (i) decreases in perceived fish catch are at least partially related to the threat of outside fishers; (ii) there is a shifting baseline syndrome among fishers, with those who have fished the longest more often reporting that fish catch has declined; (iii) farming and fishing are two key elements of a common livelihood strategy.
This study provides conservation managers and researchers interested in Raja Ampat with a baseline of conditions amongst the local population prior to the initiation of conservation activities in 2006. It is also relevant to wider research into marine conservation and marine resource use in coastal communities.

Report on a Coastal Rural Appraisal in Raja Ampat Regency, West Papua, Indonesia
1
INTRODUCTION Coral reefs are under threat worldwide from a number of anthropogenic factors and are a high priority for conservation organizations (Hughes et al. 2003, Roberts et al. 2002, Bellwood et al. 2004, Brooks et al. 2006). Coral reefs are a food and livelihood source for millions of people around the globe (UNEP 2006, FAO 2010), and in Indonesia, reefs support a significant proportion of the fish that contribute 53% of animal protein consumed (White 1986, Stobutzki et al. 2006).
Indonesia’s Raja Ampat archipelago is located on the northwestern tip of West Papua Province (Appendix 2). The Archipelago is comprised of four major islands, Waigeo, Batanta, Salawati, and Misool, along with hundreds of smaller islands, such as Kofiau and Ayau, spread out over 43,000 km2. Raja Ampat contains the greatest known concentrations of hard corals and reef fish species on the planet and is consequently a priority for marine biodiversity conservation (Allen 2008, Veron et al. 2009, Allen and Erdmann 2009) and fisheries management given that over 90% of the people in Raja Ampat live in a coastal area and rely on marine resources for their food and livelihood (Amarumollo and Farid 2002).
The Raja Ampat Islands became an autonomous maritime regency (kabupaten bahari) in 2003, bringing opportunities for greater local management of its rich marine resources (Varkey et al. 2010). To measure local perceptions of marine resources usage as an input to the site selection for a network of community co-managed marine protected areas, The Nature Conservancy surveyed local people in 88 of the 89 villages in Raja Ampat over 16 months beginning in November 2003. The omitted village was located inland, and the community did not directly depend on fishing.
Our analysis builds on previous studies from Raja Ampat that examined traditional marine tenure systems (McLeod et al. 2009), estimated the total illegal and underreported fish catch (Varkey et al. 2010), and identified a perceived decline in marine resources used by commercial and artisanal fishers (Ainsworth et al. 2008). Prior to these studies, Conservation International and The Nature Conservancy conducted marine rapid assessments in 2001 and 2002, respectively, providing a snapshot of the biological and socioeconomic conditions in Raja Ampat (McKenna et al. 2002, Donnelly et al. 2003). Our study adds to the growing body of literature on the coastal communities and how they perceive and use their marine resources.
Here we present results of the village survey and individual survey along with analysis to determine statistical relationships between key variables. We then discuss these results in the context of marine and coastal management in Raja Ampat.

Report on a Coastal Rural Appraisal in Raja Ampat Regency, West Papua, Indonesia
2
METHODS From November 2003 to March 2005, The Nature Conservancy conducted two concurrent surveys across the Raja Ampat regency: one for villages and one for individuals within villages.
The village survey was a structured interview with the head of the village or in a few cases another local leader. The survey gathered village demographics (population, family size, religions, ethnicities, and occupations), village infrastructure information, and marine resources patterns related to fishing activities and local livelihoods. A total of 88 villages were surveyed.
The individual survey was a structured interview targeting the most knowledgeable fishers in each village. Respondents were selected in consultation with the village head or another community leader. Sometimes, the most knowledgeable fishers in a village had other primary occupations such as farming or working for the government. A total of 495 people were interviewed. Questions in the survey covered respondents’ demographic information, use of marine resources, perceived threats to the marine environment, and knowledge of conservation.
Responses from the village and individual surveys were coded and combined into one dataset. The Confidence Interval is 95.6% (as per the population data from the village survey). To facilitate the analysis, the 21 fishing gear types in the individual survey were categorized independently by two fisheries experts into destructive or not destructive. While this division was somewhat subjective, it nonetheless provided a means to compare how destructive and non-destructive fishing gear related to other variables. To compare economic and livelihood variables with access to a major market, distance measurements by sea between each village and the major market town of Sorong, West Papua (125,000 residents) were calculated with GIS software and then divided into quintiles. Sigmaplot 11.2 was used to perform tests of statistical significance between variables in contingency tables.
RESULTS FROM VILLAGE SURVEY According to the village surveys, the total population of the regency was 31,293. The total number of households was 6,689, indicating an average household size of 4.6. This compares with the Indonesian average household size of 4.3. Village population averaged 356 and ranged from 60 in Yenwaopnor to 1,024 in Yefman. Seven main self-described ethnic groups were identified: Maya, Matbat, Biak, Buton, Bugis, Seram and Kei. 22% of the villages were ethnically homogenous, with the rest having two or more ethnicities present. 53% of the 88 villages were Christian, 9% were Muslim, and 38% were a mixture of Christian and Muslim.
Table 1 presents occupation data gathered during the village surveys. It shows that the two major occupations in Raja Ampat are fishing (45%) and farming (44%), though these distinctions may be somewhat arbitrary, as many households pursue a diverse livelihood strategy that combines fishing and growing food in garden plots.
Of the 88 villages, 81 had a primary school, but there were only 16 junior schools and 2 high schools throughout the regency. The number of teachers in the regency totaled 392, which averages out to 4.5
Table 1: Occupations reported in village survey
Occupations Number Percentage Fisher 3,881 44.9 Farmer 3,763 43.6 Government 396 4.6 Labor 304 3.5 Business 241 2.8 Armed forces 53 0.6 Total 8,638 100.0

Report on a Coastal Rural Appraisal in Raja Ampat Regency, West Papua, Indonesia
3
teachers per village, however, these were not uniformly spread throughout the regency. 60% of villages had a community medical facility, though many were of poor quality and lacked qualified staff.
The distances in Raja Ampat make transportation and communication challenging for residents. 49% of villages had access to a cargo vessel, 14% had access to a ferry, and 91% of villages had access to a private speedboat. Table 2 shows the number and percentage of villages with different forms of infrastructure. Only 32% of villages had access to a two-way radio, with many of these being located near private pearl farm businesses. Cellular telephone communication was not present at the time of the survey, though satellite phones were available in some areas. Only 4 police stations were present in the entire regency, an indication that law enforcement is very limited in Raja Ampat.
Table 3 displays key information from the village survey by district. Samate is the most populous district, while Waigeo Timur is the least. Most districts had a mix of both Christians and Muslims present, though Kofiau and Waigeo Timur appear to be comprised entirely of Christians. The percentage of fishers in each district varied considerably, with many districts in the 30-40% range, while in Kepulauan Ayau this figure jumped to 98% of occupations. The number of teachers ranged from as low as 15 in Waigeo Timur to as high as 87 in Samate, though these numbers reflect differences in district populations.
Table 3: Summary by District
District Households Population Household size Religion Fishers Teachers Misool Timur Selatan 787 3,557 4.52 Mixed 31% 31 Misool 725 3,456 4.77 Mixed 41% 39 Kofiau 420 1,983 4.72 Christian 32% 14 Kepulauan Ayau 530 2,261 4.27 Mixed 98% 29 Waigeo Utara 620 2,827 4.56 Mixed 37% 48 Waigeo Timur 245 1,241 5.07 Christian 44% 15 Teluk Mayalibit 280 1,706 6.09 Mixed 33% 23 Waigeo Selatan 797 4,069 5.11 Mixed 64% 80 Waigeo Barat 640 3,000 4.69 Mixed 40% 26 Samate 1,645 7,193 4.37 Mixed 39% 87 Raja Ampat Average -- -- 4.68 -- 45% 39
Table 2: Infrastructure in Raja Ampat
Infrastructure Villages with…
Percentage
Balai desa (village hall) 70 80% Village office 26 30% 2-way radio 28 32% Wartel (telecom kiosk) 28 32% Police station 4 5%
Report on a Coastal Rural Appraisal in Raja Ampat Regency, West Papua, Indonesia
4
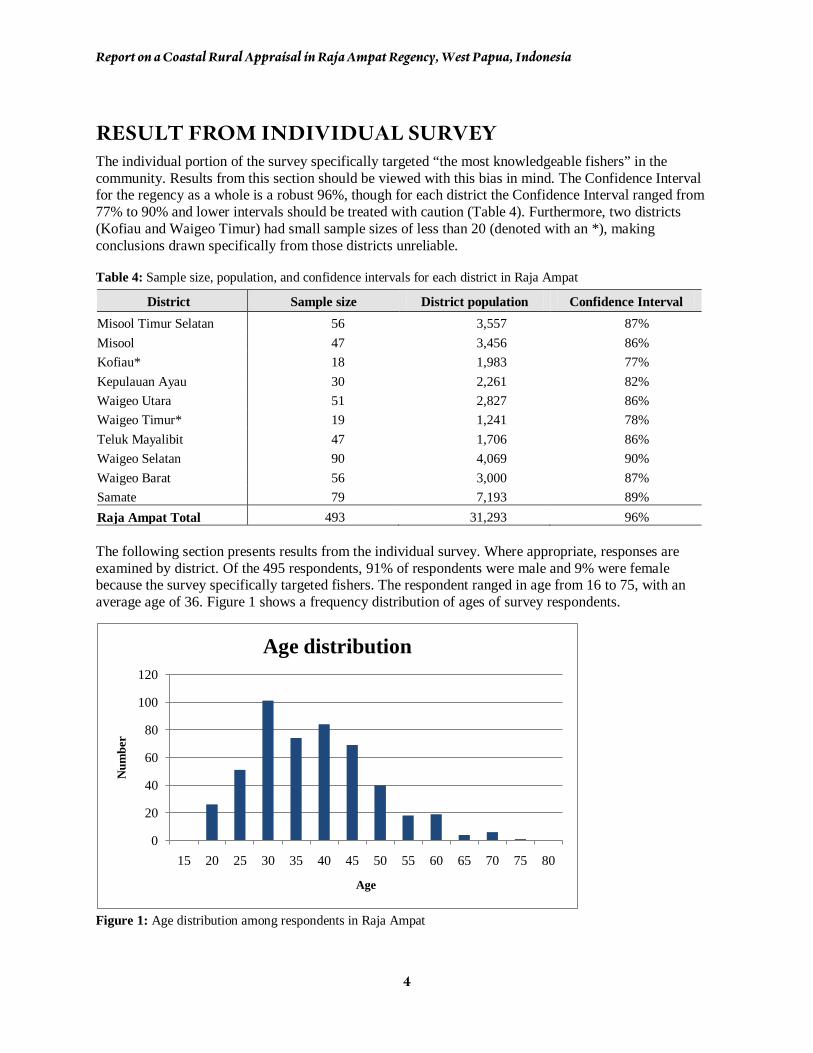
RESULT FROM INDIVIDUAL SURVEY The individual portion of the survey specifically targeted “the most knowledgeable fishers” in the community. Results from this section should be viewed with this bias in mind. The Confidence Interval for the regency as a whole is a robust 96%, though for each district the Confidence Interval ranged from 77% to 90% and lower intervals should be treated with caution (Table 4). Furthermore, two districts (Kofiau and Waigeo Timur) had small sample sizes of less than 20 (denoted with an *), making conclusions drawn specifically from those districts unreliable.
Table 4: Sample size, population, and confidence intervals for each district in Raja Ampat
District Sample size District population Confidence Interval Misool Timur Selatan 56 3,557 87% Misool 47 3,456 86% Kofiau* 18 1,983 77% Kepulauan Ayau 30 2,261 82% Waigeo Utara 51 2,827 86% Waigeo Timur* 19 1,241 78% Teluk Mayalibit 47 1,706 86% Waigeo Selatan 90 4,069 90% Waigeo Barat 56 3,000 87% Samate 79 7,193 89% Raja Ampat Total 493 31,293 96% The following section presents results from the individual survey. Where appropriate, responses are examined by district. Of the 495 respondents, 91% of respondents were male and 9% were female because the survey specifically targeted fishers. The respondent ranged in age from 16 to 75, with an average age of 36. Figure 1 shows a frequency distribution of ages of survey respondents.
Figure 1: Age distribution among respondents in Raja Ampat
0
20
40
60
80
100
120
15 20 25 30 35 40 45 50 55 60 65 70 75 80
Num
ber
Age
Age distribution
Report on a Coastal Rural Appraisal in Raja Ampat Regency, West Papua, Indonesia
5
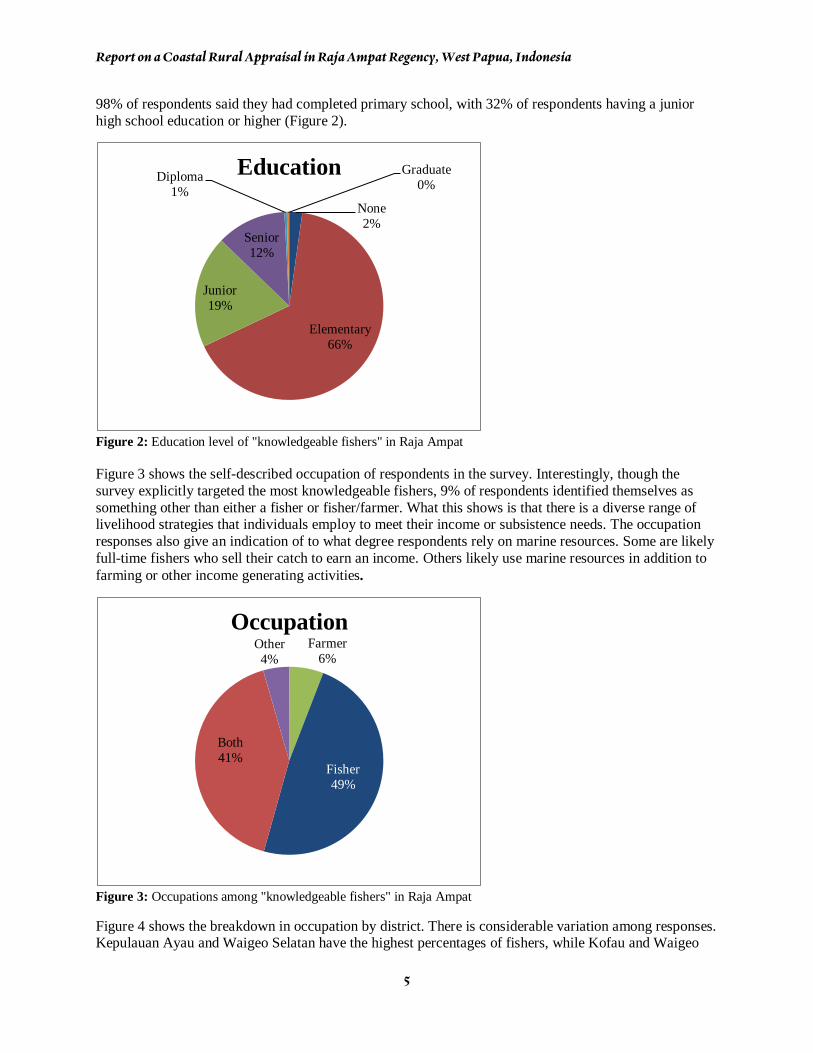
98% of respondents said they had completed primary school, with 32% of respondents having a junior high school education or higher (Figure 2).
Figure 2: Education level of "knowledgeable fishers" in Raja Ampat
Figure 3 shows the self-described occupation of respondents in the survey. Interestingly, though the survey explicitly targeted the most knowledgeable fishers, 9% of respondents identified themselves as something other than either a fisher or fisher/farmer. What this shows is that there is a diverse range of livelihood strategies that individuals employ to meet their income or subsistence needs. The occupation responses also give an indication of to what degree respondents rely on marine resources. Some are likely full-time fishers who sell their catch to earn an income. Others likely use marine resources in addition to farming or other income generating activities.
Figure 3: Occupations among "knowledgeable fishers" in Raja Ampat
Figure 4 shows the breakdown in occupation by district. There is considerable variation among responses. Kepulauan Ayau and Waigeo Selatan have the highest percentages of fishers, while Kofau and Waigeo
None2%
Elementary66%
Junior19%
Senior12%
Diploma1%
Graduate0%
Education
Farmer6%
Fisher49%
Both41%
Other4%
Occupation

Report on a Coastal Rural Appraisal in Raja Ampat Regency, West Papua, Indonesia
6
Timur have the lowest percentages of strictly fishers – though both of these districts have a very high percentage of fisher/farmers. Waigeo Utara and Teluk Mayalibit have a significant percentage of strictly farmers. Influencing this variation in reported occupation could be due to local differences in geography, in that certain districts may not have much arable land. Over 90% of the surveyed group has some explicit reliance on marine resources.
Figure 4: Respondent occupation by district
Figure 5 shows the number of years respondents have lived in their village. While the overwhelming majority have lived in their village for more than 15 years, nearly 20% had moved to the village in the past 15 years. This shows a modest level of migration (whether from within Raja Ampat or from elsewhere in Indonesia). It also indicates that the majority of respondents have been able to observe the status of the marine environment in and around their village for longer than 15 years, giving weight to their perceptions.
0%10%20%30%40%50%60%70%80%90%
100%Occupation by district
Other
Farmer
Both
Fisher

Report on a Coastal Rural Appraisal in Raja Ampat Regency, West Papua, Indonesia
7
Figure 5: Average number of years respondents have lived in their village
Figure 6 indicates the type of boat owned by respondents in each district. Nearly all of the respondents owned some sort of boat, with the distribution of outboard engines varying considerably between districts. In Waigeo Utara, no respondents owned a boat with an engine, while in Kepulauan Ayau, 40% of respondents did. Boat engine ownership could be a proxy for wealth, though the remoteness of Kepulauan Ayau likely necessitates engines in order to bring fish to the market as well as for transportation needs. Only three respondents had a boat with an inboard engine – these were consolidated with outboard engine into the “engine” category.
Figure 6: Boat ownership by respondents in each district
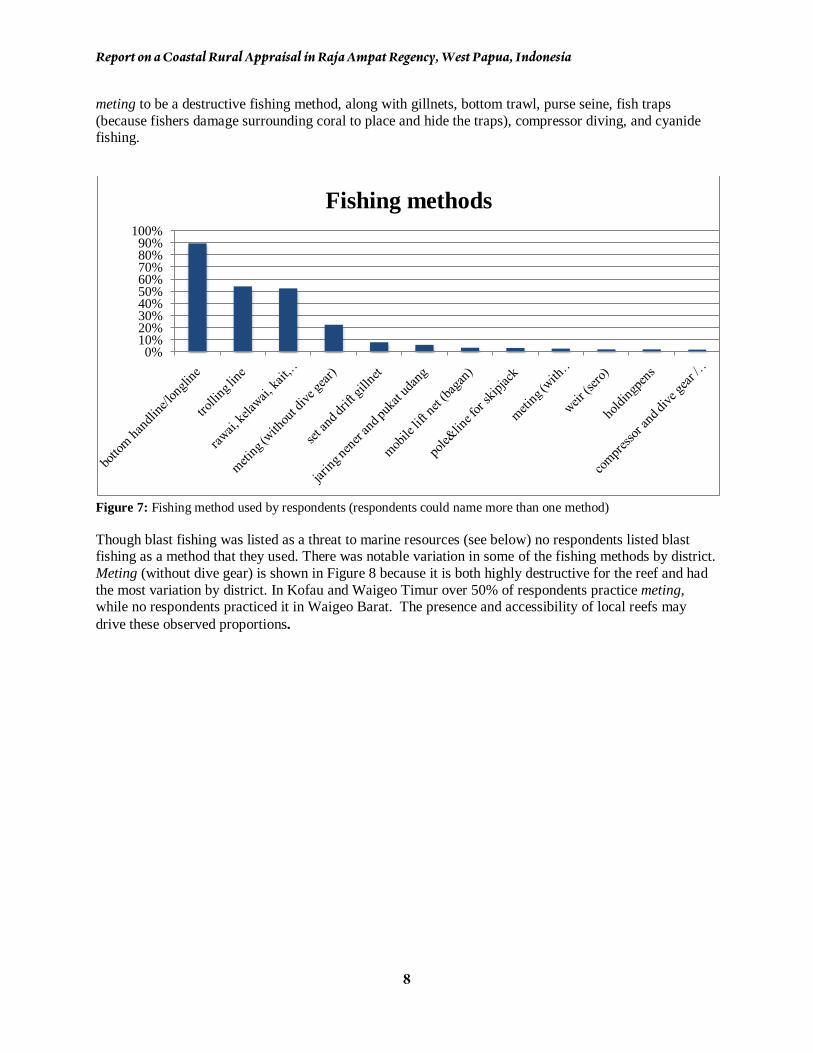
Figure 7 shows the fishing gears/methods used by respondents. The most common types of fishing gear/methods used by respondents were bottom handline/longline (88%), trolling line (54%), and meting (reef gleaning – a method of invertebrate harvesting that is damaging to corals) (22%). We considered
<2 years2% 2-5 years
4%
5-15 years13%
>15 years81%
Years lived in village
0%10%20%30%40%50%60%70%80%90%
100%
Boat type
no boat
no engine
engine
Report on a Coastal Rural Appraisal in Raja Ampat Regency, West Papua, Indonesia
8
meting to be a destructive fishing method, along with gillnets, bottom trawl, purse seine, fish traps (because fishers damage surrounding coral to place and hide the traps), compressor diving, and cyanide fishing.
Figure 7: Fishing method used by respondents (respondents could name more than one method)
Though blast fishing was listed as a threat to marine resources (see below) no respondents listed blast fishing as a method that they used. There was notable variation in some of the fishing methods by district. Meting (without dive gear) is shown in Figure 8 because it is both highly destructive for the reef and had the most variation by district. In Kofau and Waigeo Timur over 50% of respondents practice meting, while no respondents practiced it in Waigeo Barat. The presence and accessibility of local reefs may drive these observed proportions.
0%10%20%30%40%50%60%70%80%90%
100%
Fishing methods

Report on a Coastal Rural Appraisal in Raja Ampat Regency, West Papua, Indonesia
9
Figure 8: Percentage of respondents listing meting (without dive gear) as a fishing method
Figure 9: Marine resource target (respondents could name more than one resource)
Figure 9 shows the target of marine resources by respondents. Not surprising, nearly 100% of respondents fished for fish. Roughly half of respondents gathered sea cucumbers and caught Spanish mackerel, with only a third of respondents catching invertebrates like lobster and Trochus species.
0%10%20%30%40%50%60%70%80%90%
100%
Meting (without dive gear)
0%10%20%30%40%50%60%70%80%90%
100%
Marine resource target
Report on a Coastal Rural Appraisal in Raja Ampat Regency, West Papua, Indonesia
10
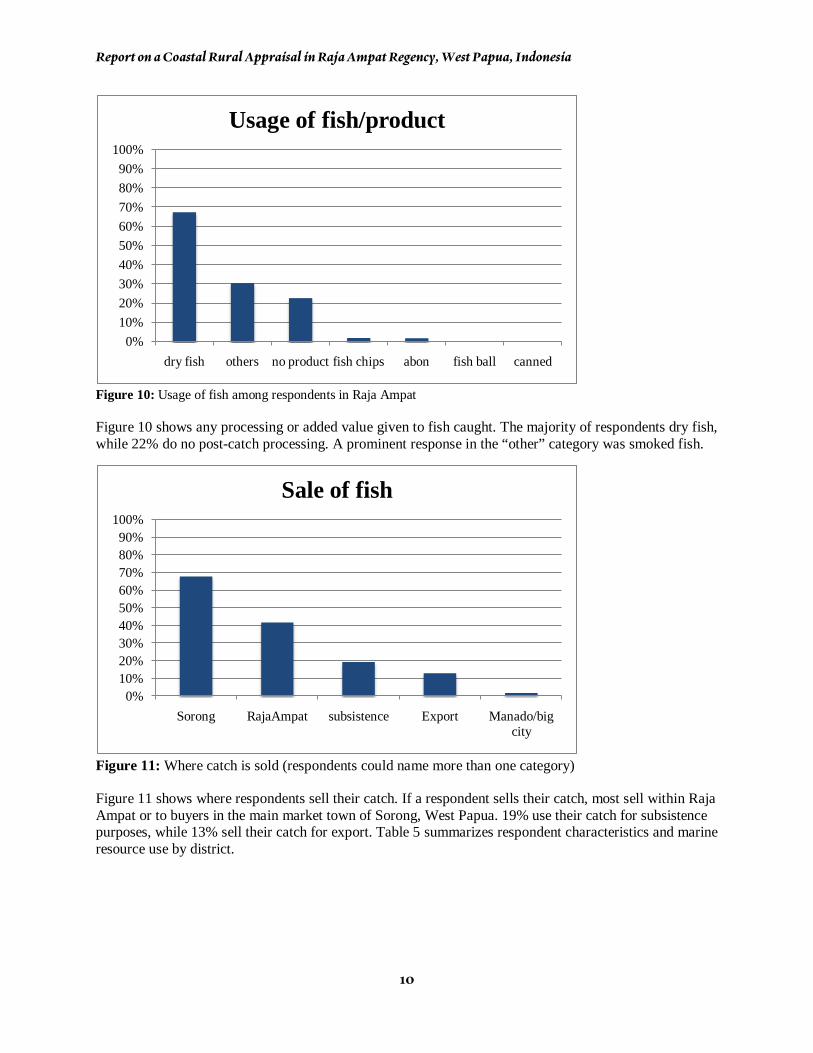
Figure 10: Usage of fish among respondents in Raja Ampat
Figure 10 shows any processing or added value given to fish caught. The majority of respondents dry fish, while 22% do no post-catch processing. A prominent response in the “other” category was smoked fish.
Figure 11: Where catch is sold (respondents could name more than one category)
Figure 11 shows where respondents sell their catch. If a respondent sells their catch, most sell within Raja Ampat or to buyers in the main market town of Sorong, West Papua. 19% use their catch for subsistence purposes, while 13% sell their catch for export. Table 5 summarizes respondent characteristics and marine resource use by district.
0%10%20%30%40%50%60%70%80%90%
100%
dry fish others no product fish chips abon fish ball canned
Usage of fish/product
0%10%20%30%40%50%60%70%80%90%
100%
Sorong RajaAmpat subsistence Export Manado/big city
Sale of fish

Report on a Coastal Rural Appraisal in Raja Ampat Regency, West Papua, Indonesia
11
Table 5: Fisher and marine resource use info by district
District % <15 years
residence % Boats with
engines % Meting
fishing % Production
dried % Subsistence
fishers Misool Timur Selatan 14% 23% 18% 36% 39% Misool 30% 19% 21% 55% 13% Kofiau* 0% 11% 50% 61% 11% Kepulauan Ayau 7% 40% 37% 100% 7% Waigeo Utara 6% 0% 29% 75% 51% Waigeo Timur* 11% 5% 74% 79% 26% Teluk Mayalibit 28% 6% 36% 55% 20% Waigeo Selatan 19% 10% 9% 97% 6% Waigeo Barat 32% 11% 0% 75% 5% Samate 25% 29% 22% 53% 16% Raja Ampat Average 24% 16% 23% 67% 19% Figure 12 shows the major threats to marine resources as reported by respondents. Blast fishing was listed by 80% of respondents, followed by cyanide fishing (59%) and outsiders (33%). Only 3% of respondents listed overfishing as a threat, but respondents may not have understood the term correctly according to one of the survey enumerators.
Figure 12: Major threats to marine resources (respondents could name more than one threat)
Figure 13, 14, and 15 show a breakdown by district on the three largest threats (blast fishing, cyanide fishing, and outsiders) in Raja Ampat. In nearly all of the districts, blast fishing was reported as being a threat to marine resources by 60-100% of respondents. Only 24% of respondents in Teluk Mayalibit reported blast fishing a threat. Cyanide fishing appears to be less of a threat than blast fishing, but is reported as a major threat by over 80% of respondents in Samate, Waigeo Barat, and Kofiau. Teluk Mayalibit again appears to be an outlier, with only 5% of respondents naming cyanide fishing a threat. Districts with over 50% of respondents naming outsiders as a threat are Misool, Waigeo Timur, and Kofiau. Outsiders do not appear to be a threat in Teluk Mayalibit, a statistic likely related to the low prevalence of blast fishing and cyanide fishing reported among respondents.
0%10%20%30%40%50%60%70%80%90%
100%
Threats to marine resources

Report on a Coastal Rural Appraisal in Raja Ampat Regency, West Papua, Indonesia
12
Figure 13: Percentage of respondents listing blast fishing as a threat in each district
Figure 14: Percentage of respondents listing cyanide fishing as a threat to marine resources
0%10%20%30%40%50%60%70%80%90%
100%
Blast fishing
0%10%20%30%40%50%60%70%80%90%
100%
Cyanide fishing

Report on a Coastal Rural Appraisal in Raja Ampat Regency, West Papua, Indonesia
13
Figure 15: Percentage of respondents who list outsiders as a threat to marine resources
A separate question on the survey explicitly asked respondents if they had “seen or heard outside fishers” (Figure 16). 78% of respondents answered yes, though this percentage drops to 43% and 10% in Kepulauan Ayau and Teluk Mayalibit, respectively. Respondents were also asked to name the activities in which outside fishers were engaged. 64% of respondents said that outside fishers were doing blast fishing, and 26% said they were engaged in cyanide fishing. It is important to note that respondents often named more than one activity. Other reported activities include shark fining, trawling, and using hookah compressors.
Figure 16: Percentage of respondents who have "seen or heard outside fishers
Table 6 summarizes by district respondents’ perceptions of changes in fish catch and major threats to marine resources. For Raja Ampat regency, 74% of respondents feel that fish catch is less, 23% say that
0%10%20%30%40%50%60%70%80%90%
100%
Outsiders as a threat
0%10%20%30%40%50%60%70%80%90%
100%
Seen or heard outside fishers

Report on a Coastal Rural Appraisal in Raja Ampat Regency, West Papua, Indonesia
14
fish catch is the same, and only 2% say that fish catch has improved. There is substantial variation in responses between each district, with indications that marine resources are in the best condition in Teluk Mayalibit. This could be due to the specific geography of the district (a bay), which may allow locals to restrict access to the local fishery.
Table 6: Fishing problems by District
District % Saying decline in
fish catch % Saying blast fishing a threat
% Saying cyanide a threat
% Saying outsider a threat
Misool Timur Selatan 61% 80% 59% 36% Misool 68% 94% 68% 53% Kofiau* 89% 100% 89% 72% Kepulauan Ayau 90% 100% 50% 33% Waigeo Utara 71% 86% 45% 27% Waigeo Timur* 95% 100% 53% 63% Teluk Mayalibit 49% 21% 4% 4% Waigeo Selatan 77% 60% 49% 29% Waigeo Barat 77% 96% 86% 38% Samate 87% 97% 85% 28% Raja Ampat Average 74% 80% 59% 33% Most respondents (71%) had no knowledge of what ‘nature conservation’ meant, 24% had some knowledge, and only 5% of respondents said they knew about nature conservation. Figure 17 shows that Kofiau and Waigeo Selatan appear to have the most number of respondents that have some familiarity with the term.
Figure 17: Conservation knowledge among respondents by district
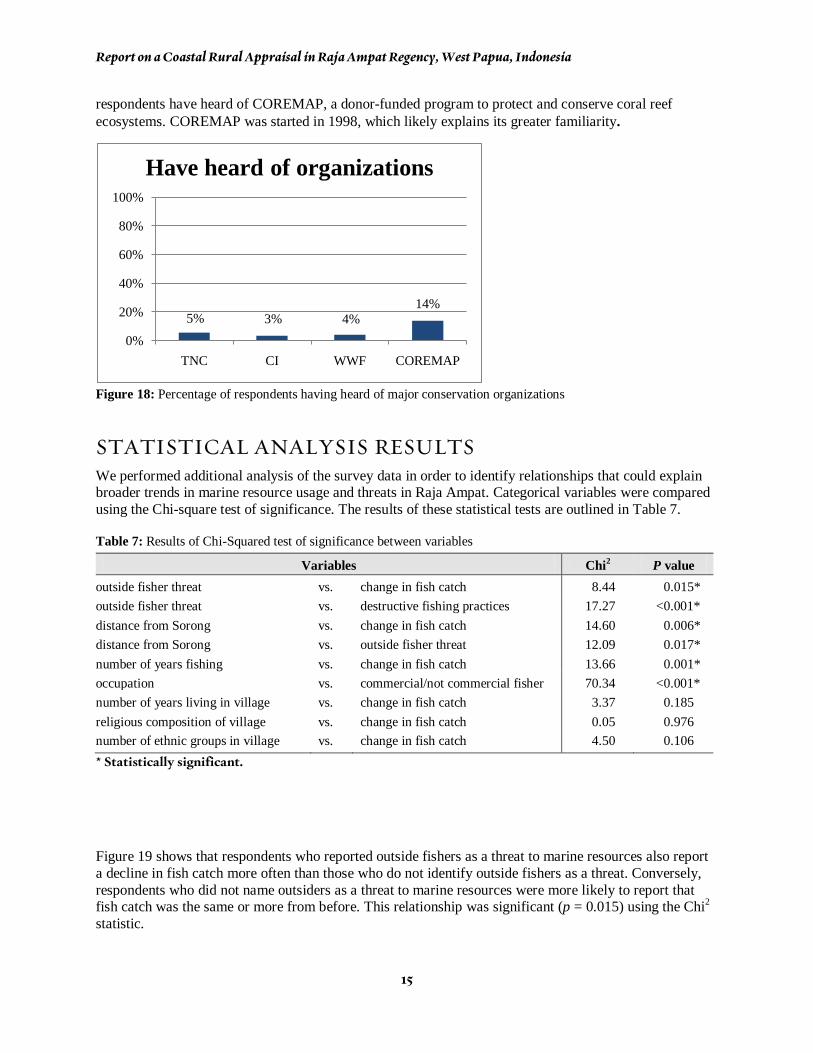
A final series of questions asked respondents of their familiarity with the major conservation organizations (Figure 18). 5% or less of respondents have heard of TNC, CI, and WWF. 14% of
0%10%20%30%40%50%60%70%80%90%
100%
Conservation knowledge
yes
little
no
Report on a Coastal Rural Appraisal in Raja Ampat Regency, West Papua, Indonesia
15
respondents have heard of COREMAP, a donor-funded program to protect and conserve coral reef ecosystems. COREMAP was started in 1998, which likely explains its greater familiarity.
Figure 18: Percentage of respondents having heard of major conservation organizations
STATISTICAL ANALYSIS RESULTS We performed additional analysis of the survey data in order to identify relationships that could explain broader trends in marine resource usage and threats in Raja Ampat. Categorical variables were compared using the Chi-square test of significance. The results of these statistical tests are outlined in Table 7.
Table 7: Results of Chi-Squared test of significance between variables
Variables Chi2 P value outside fisher threat vs. change in fish catch 8.44 0.015* outside fisher threat vs. destructive fishing practices 17.27 <0.001* distance from Sorong vs. change in fish catch 14.60 0.006* distance from Sorong vs. outside fisher threat 12.09 0.017* number of years fishing vs. change in fish catch 13.66 0.001* occupation vs. commercial/not commercial fisher 70.34 <0.001* number of years living in village vs. change in fish catch 3.37 0.185 religious composition of village vs. change in fish catch 0.05 0.976 number of ethnic groups in village vs. change in fish catch 4.50 0.106 * Statistically significant.
Figure 19 shows that respondents who reported outside fishers as a threat to marine resources also report a decline in fish catch more often than those who do not identify outside fishers as a threat. Conversely, respondents who did not name outsiders as a threat to marine resources were more likely to report that fish catch was the same or more from before. This relationship was significant (p = 0.015) using the Chi2 statistic.
5% 3% 4%14%
0%
20%
40%
60%
80%
100%
TNC CI WWF COREMAP
Have heard of organizations

Report on a Coastal Rural Appraisal in Raja Ampat Regency, West Papua, Indonesia
16
Figure 19: Graph showing the proportion of respondents’ answers to changes in fish catch and outsider fishers as a threat to marine resources.
Figure 20 shows that 73% of respondents who reported outsider as a threat to marine resources were more likely to use destructive fishing practices themselves (p < 0.001). Conversely, respondents who did not report outsiders as a threat were less likely to use destructive fishing practices.
Figure 20: Use of destructive fishing practices compared with outside fishers as a threat
Figure 21 shows that respondents living in villages closer to Sorong were more likely to report a decline in fish catch than those living farther away. Similarly, Figure 22 shows that respondents living in villages farthest away from Sorong were more likely to report outside fishers as a threat than those living in villages closer to Sorong.
81%
19%
0%
71%
25%
3%
0%10%20%30%40%50%60%70%80%90%
100%
Less Same More
Outsider threat and fish catch
Outsider threat
No outsider threat
27%47%
73%53%
0%10%20%30%40%50%60%70%80%90%
100%
Outside threat No outsider threat
Outsider threat and destructive fishing
Use destructive methods
Do not use destructive methods

Report on a Coastal Rural Appraisal in Raja Ampat Regency, West Papua, Indonesia
17
Figure 21: Distance from Sorong compared with perceived change in fish catch
Figure 22: Distance from Sorong compared with outsiders as a threat to marine resources
Figure 23 shows that the longer a respondent had fished, the more likely they were to report a decline in fish catch. Nearly 60% of respondents who had fished for less than five years said that fish catch was either the same or greater than before versus 40% who said that fish catch had decreased. For fishers who had fished for more than 15 years, nearly 80% of them reported a decline in fish catch.
95%74% 70% 70% 78%
5%26% 30% 30% 22%
0%10%20%30%40%50%60%70%80%90%
100%
<59 km 59-104 km 104-147 km 147-191 km >191 km
Distance from Sorong and fish catch
Same/more fish catch
Less fish catch
65% 71% 73%59% 50%
35% 29% 27%41% 50%
0%10%20%30%40%50%60%70%80%90%
100%
<59 km 59-104 km 104-147 km 147-191 km >191 km
Distance from Sorong and outsider threat
Outsider threat
No outsider threat

Report on a Coastal Rural Appraisal in Raja Ampat Regency, West Papua, Indonesia
18
Figure 23: The relationship between how long a survey respondent had fished and their answer to how fish catch has changed from before.
DISCUSSION Results from the village and individual surveys, along with statistical analysis of key variables, allow us to draw some conclusions relating to how marine resources are used in Raja Ampat.
OUTSIDERS AND DESTRUCTIVE FISHING PRACTICES Outsiders and the use of destructive fishing practices (by both outsiders and residents) are interrelated threats to the sustainability of marine resources in Raja Ampat. We compared data from the two outsider questions with respondents’ perception of how fish catch had changed, both of which showed a statistically significant relationship (Figure 19). A greater percentage (81%) of respondents who reported outside fishers as a threat to marine resources reported a decrease in fish catch from before, compared with those who did not report outside fishers as a threat but reported a decline in fish catch (71%). For respondents who reported the same catch as before, a smaller percentage (19%) of respondents did not cite outside fishers as a threat compared with respondents who did cite them as a threat (25%).
Further analysis adds nuance to the conclusion that outsiders are part of the reason for the decline in fish catch. Outsiders were the third most frequent threat to marine resources after blast and cyanide fishing. Blast fishing is particularly detrimental in areas with coral reef ecosystems. The cost to society from blast fishing is estimated at US$ 306,800 per km2 of coral reef over a 20-year span (Pet-Soede et al. 1999). Though some locals are involved in blast and cyanide fishing, outsider fishers working in collusion with authority figures are believed to be the primary perpetrators of these practices (Donnelly et al. 2003). Outside fishers are also entering into business arrangements with locals by providing destructive fishing materials and making purchasing agreements (Varkey et al. 2010). This suggests that the top three threats to marine resources in Raja Ampat are interrelated and linked to outsiders.
Respondents who listed outside fishers as a threat were more likely to use destructive fishing methods themselves. An explanation for this trend could be that respondents who live in close proximity to outside fishers face greater competition for marine resources and are therefore more likely to adopt methods that are perceived to be more effective at catching fish. Alternatively, outside fishers could be introducing these fishing methods, which are then adopted by local fishers.
41%
68%77%
59%
32%23%
0%
10%
20%
30%
40%
50%
60%
70%
80%
90%
100%
<5 years 5-15 years >15 years
Time fishing and fish catch
Same/more fish catch
Less fish catch

Report on a Coastal Rural Appraisal in Raja Ampat Regency, West Papua, Indonesia
19
To examine the spatial characteristics of outsiders and fish catches, we looked at distances to the city of Sorong. Respondents in the villages closest to Sorong perceived that fish catches have declined the most. Villages closest to Sorong likely have better access to buyers for fish and also face local competition from Sorong-based fishers. The villages where fish catch has decreased the second most are the ones farthest away from Sorong. These villages may face greater pressure from outside fishers, with half of respondents reporting outside fishers as a threat to marine resources (Figure 22). Fishers from other parts of Indonesia are known to travel to Raja Ampat to fish (Varkey et al. 2010, Donnelly et al. 2003, Bailey et al. 2008). Outsiders are also likely responsible for a disproportionate share of fish catches. Marine resource use monitoring surveys in Kofiau have shown that 26% of the fishers are outsiders and these outsiders are responsible for 83% of the catch volume (Muljadi 2009).
Interestingly, overfishing was cited as a threat by less than 1% of the respondents. Most of the respondents, however, may not have understood the term ‘overfishing’ and consequently failed to acknowledge it as a factor in the decline of marine resources. Even a relatively small amount of artisanal fishing pressure in an area can dramatically impact specific fish populations (Pinnegar and Engelhard 2008). But we found that in Raja Ampat artisanal fishers are less of a threat to marine resources than fishing pressures from outsiders. It is likely that a combination of both outside fishers and destructive fishing practices by residents and outsiders are leading to the perceived declines in fish catch. The ability to exclude outside fishers is a hallmark of many community-based marine resource management activities (Savina and White 1986, Johannes 2002) and supports the use of MPAs as a conservation strategy in Raja Ampat.
A SHIFTING BASELINE SYNDROME AMONG FISHERS IN RAJA AMPAT We looked for evidence of the ‘shifting baseline syndrome’ where successive generations of fishers accept a lower standard of marine resources as normal (Pauly 1995, Knowlton and Jackson 2008). Two criteria should be met for a shifting baseline syndrome to have occurred: (i) biological change has to have occurred in the system, and (ii) perceptions of this change by human populations have to match the biological observations (Papworth et al. 2009).
In the survey responses, we found a statistically significant relationship between respondents who reported a decline in fish catch and the number of years that they had spent fishing (p = 0.001). A clear trend emerged, with a greater percentage of respondents who had fished longer saying that catch has decreased, with the opposite being true for respondents who had spent less time fishing (Figure 23). Some have argued that the shifting baseline syndrome should be present at different levels of experience instead of simply different ages, a condition that was true in this analysis (Papworth et al. 2009). We found no statistical relationship between a change in the perception of catch and the number of years living in a village.
Our results confirm the findings of another study reporting that exploitation rates have increased and the population status of 44 different marine species groups have decreased by as much as an order of magnitude since 1970 in Raja Ampat (Ainsworth et al. 2008). Going back even farther in time, a review of historical sources from 1810 to the present notes that there has been a perceived decrease in the abundance of marine resources in Raja Ampat over the past 200 years (Palomares et al. 2007). There can be a shift in perception among fishers on the size and abundance of marine resources due to depletions from one generation to the next (Saenz-Arroyo et al. 2005).
Raja Ampat has a history of migration and population growth accompanied by increasing pressure on its marine resources from both local and outside fishers (Varkey et al. 2010). That there is a shifting baseline syndrome occurring in Raja Ampat comes as no surprise. The challenge for communities in Raja Ampat is how to stem this decline to ensure adequate resources for future generations.

Report on a Coastal Rural Appraisal in Raja Ampat Regency, West Papua, Indonesia
20
DIVERSE LIVELIHOOD STRATEGIES Several authors have noted that fishing can be a ‘sticky’ profession, and transitioning fishers to farmers in order to reduce fishing pressure may be unrealistic (Pollnac et al. 2001, Béné 2003). A review of alternative livelihood initiatives in the Philippines and Indonesia that have promoted seaweed farming with the hopes of improving fishers’ incomes and reducing fishing pressure concluded that while seaweed farming can provide significant income for coastal households, it rarely results in fishers abandoning fishing or reducing fishing effort (Sievanen et al. 2005). Surveys of job satisfaction among artisanal fishers in the Philippines, Indonesia, and Vietnam showed that most fishers were resistant to leaving their occupation for income and non-income reasons (Pollnac et al. 2001).
A previous assessment in Raja Ampat estimated that roughly 90% of the inhabitants rely on marine resources for some portion of their livelihoods (Amarumollo and Farid 2002). Our survey found that while fishing was the dominant livelihood strategy, almost half the respondents identified their occupation as something aside from exclusively ‘fisher’ (Figure 3). In Raja Ampat, we found that most people do not view fishing, farming, and other livelihoods as separate ‘sectors’. Rather people shift to whichever occupation is likely to be the most productive given the season and utilize marine resources opportunistically to meet their individual needs (Allison and Ellis 2001).
Further analysis of the survey data gives greater detail of how marine resources are used in Raja Ampat. 19% of respondents indicated that they used at least a portion of their catch for subsistence. 81% of respondents reported that they sold their catch exclusively. A greater percentage of respondents who listed themselves as ‘fisher’ sold their catch rather than consumed it for subsistence. One conclusion would be that most ‘fishers’ sell their catch for income, while self-described ‘fisher/farmers’ are more likely to use marine resources as an additional food source.
The utilization of marine resources is an essential part of most households’ livelihood strategy in Raja Ampat. While respondents in the survey were not asked whether they would give up fishing as a full or part-time occupation, evidence from similar communities in the region (Pollnac et al. 2001) suggests that few would be willing to forgo the benefits that fishing provides. In other words, marine resources range from supplemental to essential components of livelihoods for fishers and farmers alike in Raja Ampat. Potential conservation activities that seek to reduce fishing pressure by reducing the number of active local fishers in Raja Ampat may find limited success.

Report on a Coastal Rural Appraisal in Raja Ampat Regency, West Papua, Indonesia
21
CONCLUSION Since these surveys were conducted, The Nature Conservancy and Conservation International have worked with local communities to establish a network of multiple-use MPAs in Raja Ampat in 2006. This network was expanded in 2008 from 895,210 ha to 1,185,940 ha. The expectation is that MPAs and marine reserves will improve fisheries (Roberts et al. 2001, Gell and Roberts 2003), help prevent coral loss (Selig and Bruno 2010), and provide poverty reduction benefits for local communities (Leisher et al. 2007).
The surveys were designed to provide baseline information on the use of marine resources and the perceptions of residents in Raja Ampat. Moreover, the 493 individuals interviewed did not constitute a random sample due to the marine resource focus of the survey, and therefore extrapolating the conclusions presented here should be done with caution.
We were able to delve deeper into the dataset and draw some conclusions concerning marine conservation that can help inform the ongoing marine co-management efforts in Raja Ampat. We found that: (i) Decreases in the perception of how fish catch has changed is related to the presence of outside fishers. Outsiders are also linked to the use of destructive fishing practices, implying that conservation efforts should focus on addressing the threat of outside fishers to local marine resources. (ii) There is a shifting baseline syndrome in Raja Ampat, with the respondents who have fished the longest reporting more often that fish catch has declined. This evidence underscores the urgency of protecting Raja Ampat’s marine resources. (iii) Farming and fishing are not separate occupations in Raja Ampat, but rather two key elements of a common livelihood strategy. Therefore marine conservation activities that lead to greater fish catch will improve livelihoods and are likely to garner support from local residents.
Lastly, there were notable differences in responses between districts in Raja Ampat, though few general trends emerged. Marine resource managers working in different parts of the archipelago would find this information useful when deciding where and when to focus conservation efforts.

Report on a Coastal Rural Appraisal in Raja Ampat Regency, West Papua, Indonesia
22
REFERENCES Ainsworth CH, Pitcher TJ, Rotinsulu C (2008) Evidence of fishery depletions and shifting cognitive
baselines in Eastern Indonesia. Biological Conservation 141: 848-859. Allen GR (2008) Conservation hotspots of biodiversity and endemism for Indo-Pacific coral reef fishes.
Aquatic Conservation: Marine and Freshwater Ecosystems 18: 541-556. Allen GR, Erdmann MV (2009) Reef fishes of the Bird’s Head Peninsula, West Papua, Indonesia. Check
List 5: 587-628. Allison EH, Ellis F (2001) The livelihoods approach and management of small-scale fisheries. Marine
Policy 25: 377-388. Amarumollo J, Farid M (2002) Exploitation of marine resources on the Raja Ampat Islands, Papua
Province, Indonesia. In: McKenna SA, Allen GR, Suryadi S, editors. A marine rapid assessment of the Raja Ampat Islands, Papua Province, Indonesia. Washington, DC: Conservation International. pp. 79-86.
Bailey M, Rotinsulu C, Sumaila UR (2008) The migrant anchovy fishery in Kabui Bay, Raja Ampat, Indonesia: Catch, profitability, and income distribution. Marine Policy 32: 483-488.
Bellwood DR, Hughes TP, Folke C, Nyström M (2004) Confronting the coral reef crisis. Nature 429: 827–33.
Béné C (2003) When fishery rhymes with poverty: A first step beyond the old paradigm on poverty in small-scale fisheries. World Development 31: 949-975.
Brooks TM, Mittermeier RA, da Fonseca GAB, Gerlach J, Hoffmann M, et al. (2006) Global biodiversity conservation priorities. Science 313: 58–61.
Donnelly R, Neville D, Mous P (2003) Report on a rapid ecological assessment of the Raja Ampat Islands, Papua, Eastern Indonesia, held October 30 -- November 22, 2002. Bali, Indonesia: The Nature Conservancy - Southeast Asia Center for Marine Protected Areas.
FAO (2010) State of the world’s fisheries and aquaculture. Rome: FAO. 192 p. Gell F R, Roberts CM (2003) Benefits beyond boundaries: the fishery effects of marine reserves. Trends
in Ecology & Evolution 18: 448-455. Hughes TP, et al. (2003) Climate change, human impacts and the resilience of coral reefs. Science 301:
929-933. Johannes RE (2002) The renaissance of community-based marine resource management in Oceania.
Annual Review of Ecology and Systematics 33: 317-340. Knowlton N, Jackson JBC (2008) Shifting baselines, local impacts, and global change on coral reefs.
PLoS Biol 6: e54. doi:10.1371/journal.pbio.0060054. Leisher C, Van Beukering P, Scherl LM (2007) Nature’s investment bank: How marine protected areas
contribute to poverty reduction. Arlington: The Nature Conservancy. 46 pp. McKenna SA, Allen GR, Suryadi, editors (2002) A marine rapid assessment of the Raja Ampat Islands,
Papua Province, Indonesia. RAP Bulletin of Biological Assessment 22. Washington, DC: Conservation International. 191 p.
McLeod E, Szuster B, Salm R (2009) Sasi and marine conservation in Raja Ampat, Indonesia. Coastal Management 37: 656-676.
Muljadi AH (2009) Uses of marine resources in Kofiau marine protected area, Raja Ampat, Indonesia 2006-2008. Sorong, Indonesia Report for The Nature Conservancy, 37 pp.

Report on a Coastal Rural Appraisal in Raja Ampat Regency, West Papua, Indonesia
23
Palomares ML, Heymans JJ, Pauly D (2007) Historical ecology of the Raja Ampat Archipelago, Papua Province, Indonesia. Hist. Phil. Life. Sci. 29: 33-56.
Papworth SK, Rist J, Coad L, Milner-Gulland EJ (2009) Evidence for shifting baseline syndrome in conservation. Conservation Letters 2: 93-100.
Pauly D (1995) Anecdotes and the shifting baseline syndrome of fisheries. Trends in Ecology and Evolution 10: 430.
Pet-Soede C, Cesar HSJ, Pet JS (1999) An economic analysis of blast fishing on Indonesian coral reefs. Environmental Conservation 26: 83-93.
Pinnegar J, Engelhard G (2008) The ‘shifting baseline’ phenomenon: a global perspective. Reviews in Fish Biology and Fisheries 18: 1-16.
Pollnac RB, Pomeroy RS, Harkes IHT (2001) Fishery policy and job satisfaction in three Southeast Asian fisheries. Ocean & Coastal Management 44: 531-544.
Roberts CM, Bohnsack JA, Gell F, Hawkins JP, Goodridge R (2001) Effects of Marine Reserves on Adjacent Fisheries. Science 294: 1920-1923.
Roberts CM, McClean DJ, Veron JEN, Hawkins JP, Allen GR, et al. (2002) Marine biodiversity hotspots and conservation priorities for tropical reefs. Science 295: 1280–1284.
Saenz-Arroyo A, Roberts CM, Torre J, Cariño-Olvera M, Enríquez-Andrade RR (2005) Rapidly shifting environmental baselines among fishers of the Gulf of California. Proc Biol Sci. 272: 1957-1962.
Savina GC, White AT (1986) A tale of two islands: Some lessons for marine resource management. Environmental Conservation 13: 107-113,
Selig ER, Bruno JF (2010) A Global Analysis of the Effectiveness of Marine Protected Areas in Preventing Coral Loss. PLoS ONE 5: e9278.
Sievanen L, Crawford B, Pollnac RB, Lowe C (2005) Weeding through assumptions of livelihood approaches in ICM: Seaweed farming in the Philippines and Indonesia. Ocean & Coastal Management 48: 297-313.
Stobutzki IC, Silvestre GT, Garces LR (2006) Key issues in coastal fisheries in South and Southeast Asia, outcomes of a regional initiative. Fisheries Research 78: 109-118.
UNEP (2006) Marine and coastal ecosystems and human well-being: A synthesis report based on the findings of the Millennium Ecosystem Assessment. Nairobi: UNEP. 76 p.
Varkey DA, Ainsworth CH, Pitcher TJ, Goram Y, Sumaila R (2010) Illegal, unreported and unregulated fisheries catch in Raja Ampat Regency, Eastern Indonesia. Marine Policy 34: 228-236.
Veron JEN, Devantier LM, Turak E, Green AL, Kininmonth S et al. (2009) Delineating the Coral Triangle. Galaxea, Journal of Coral Reef Studies 11: 91-100.
White AT (1986) Marine reserves: How effective as management strategies for Philippine, Indonesian and Malaysian coral reef environments? Ocean Management 10: 137-159.

Report on a Coastal Rural Appraisal in Raja Ampat Regency, West Papua, Indonesia
24
APPENDICES
APPENDIX 1: DISTRICT CHANGES IN RAJA AMPAT Following the decentralization of central government authority in the early 2000s, the number of districts and sub-districts increased in Indonesia. The number of districts (kecamatan) in Raja Ampat increased from 10 to 17 after this survey was completed, detailed in the following table:
Village name Old district name New district name Salafen Misool Misool Utara Waigama Misool Misool Utara Solal Misool Misool Utara Atkari Misool Misool Utara Aduwei Misool Misool Utara Wejim Misool Kepulauan Sembilan Satukurano Misool Kepulauan Sembilan Limalas Misool Misool Timur Folley Misool Timur Selatan Misool Timur Usaha Jaya Misool Timur Selatan Misool Timur Tomolol Misool Timur Selatan Misool Timur Fafanlap Misool Timur Selatan Misool Selatan Yellu Misool Timur Selatan Misool Selatan Harapan Jaya Misool Timur Selatan Misool Selatan Kapatcol Misool Timur Selatan Misool Barat Lilinta Misool Timur Selatan Misool Barat Biga Misool Timur Selatan Misool Barat Gamta Misool Timur Selatan Misool Barat Magey Misool Timur Selatan Misool Barat Deer Kofiau Kofiau Dibalal Kofiau Kofiau Tolobi Kofiau Kofiau Rutum Kepulauan Ayau Kepulauan Ayau Reni Kepulauan Ayau Kepulauan Ayau Yenkawir Kepulauan Ayau Kepulauan Ayau Dorekar Kepulauan Ayau Kepulauan Ayau Miosbekwan Kepulauan Ayau Kepulauan Ayau Rauki Waigeo Utara Waigeo Utara Bonsayor Waigeo Utara Waigeo Utara Kabare Waigeo Utara Waigeo Utara Andei Waigeo Utara Waigeo Utara Asukweri Waigeo Utara Waigeo Utara Kapadiri Waigeo Utara Waigeo Utara Warwanai Waigeo Utara Wawarbomi Mnier Waigeo Utara Wawarbomi Boni Waigeo Utara Wawarbomi Puper Waigeo Timur Waigeo Timur Yembekaki Waigeo Timur Waigeo Timur Yensner Waigeo Timur Waigeo Timur Urbinasopen Waigeo Timur Waigeo Timur

Report on a Coastal Rural Appraisal in Raja Ampat Regency, West Papua, Indonesia
25
Village name Old district name New district name Lopintol Teluk Manyalibit Teluk Manyalibit Warsamdim Teluk Manyalibit Teluk Manyalibit Warimak Teluk Manyalibit Teluk Manyalibit Kalitoko Teluk Manyalibit Teluk Manyalibit Beo Teluk Manyalibit Teluk Manyalibit Araway Teluk Manyalibit Teluk Manyalibit Go Teluk Manyalibit Teluk Manyalibit Waifoy Teluk Manyalibit Teluk Manyalibit Kabilol Teluk Manyalibit Teluk Manyalibit Arborek Waigeo Selatan Miosmansar Saodarek Waigeo Selatan Miosmansar Yenbuba Waigeo Selatan Miosmansar Yenbekuan Waigeo Selatan Miosmansar Kurkapa Waigeo Selatan Miosmansar Yenwaopnor Waigeo Selatan Miosmansar Kapisawar Waigeo Selatan Miosmansar Sawingrai Waigeo Selatan Miosmansar Kabui Waigeo Selatan Miosmansar Saonek Waigeo Selatan Waigeo Selatan Wawiay Waigeo Selatan Waigeo Selatan Saporkren Waigeo Selatan Waigeo Selatan Yenbeser Waigeo Selatan Waigeo Selatan Friwin Waigeo Selatan Waigeo Selatan Waisai Waigeo Selatan Waigeo Selatan Salio Waigeo Barat Waigeo Barat Serpele Waigeo Barat Waigeo Barat Waisilip Waigeo Barat Waigeo Barat Biansi Waigeo Barat Waigeo Barat Mutus Waigeo Barat Waigeo Barat Saukabu Waigeo Barat Waigeo Barat Kepulauan Pam Waigeo Barat Waigeo Barat Kepulauan Gag Waigeo Barat Waigeo Barat Kepulauan Manyaifun Waigeo Barat Waigeo Barat Kepulauan Meos Manggara Waigeo Barat Waigeo Barat Kepulauan Jefman Samate Salawati Uatara Safkabu Samate Salawati Uatara Kalobo Samate Salawati Uatara Samate Samate Salawati Uatara Wamega Samate Salawati Uatara Kapatlap Samate Salawati Uatara Solol Samate Selat Sagawin Kalyam Samate Selat Sagawin Wailebet Samate Selat Sagawin Yenanas Samate Selat Sagawin Amdui Samate Selat Sagawin Marandanweser Samate Selat Sagawin Yensawai Samate Selat Sagawin Arefi Samate Selat Sagawin Waiweser Samate Selat Sagawin

Report on a Coastal Rural Appraisal in Raja Ampat Regency, West Papua, Indonesia
26
APPENDIX 2: MAP OF RAJA AMPAT
