apresentação 3q08 en
TRANSCRIPT

3Q08 Earnings
Disclaimer
This presentation contains statements that are forward-looking within the meaning of Section 27A of the Securities Act of 1933 and Section 21E of the Securities Exchange Act of 1934. Such forward-looking statements are only predictions and are not guarantees of future performance. Investors are cautioned that any such forward-looking statements are and will be, as the case may be, subject to many risks, uncertainties and factors relating to the operations and business environments of General Shopping and its subsidiaries that may cause the actual results of the companies to be materially different from any future results expressed or implied in such forward-looking statements.
This material is published solely for informational purposes and is not to be construed as a solicitation or an offer to buy or sell any securities or related financial instruments and should not be treated as giving investment advice. It is not targeted to the specific investment objectives, financial situation or particular needs of any recipient. No representation or warranty, either express or implied, is provided in relation to the accuracy, completeness or reliability of the information contained herein. This material should not be regarded by recipients as a substitute for the exercise of their own judgment.
Any opinions expressed in this material are expressed as of this date and subject to change without notice and General Shopping is not under the obligation to update or keep current the information contained herein. General Shopping and the respective affiliates, directors, partners and employees accept no liability whatsoever for any loss or damage of any kind arising out of the use of all or any part of this material. You should consult with your own legal, regulatory, tax, business, investment, financial and accounting advisers to the extent that you deem it necessary, and make your own investment, hedging and trading decision (including decisions regarding the suitability of this transaction) based upon your own judgment and advice from such advisers as you deem necessary and not upon any views expressed in this material.
1

Agenda
Financial Performance
Company Overview
Sector Overview
2

3Financial Performance

* Same Store 3Q08 – Includes Shopping Light, one year after it was acquired by GSB
Gross Revenue (R$ milion)
9.9 10.7
3.12.9
7.11.3
1.4
3Q07 3Q08Services - New PortfolioServices - Same Store*Rent - New PortfolioRent - Same Store*
Total Gross Revenue
Same Store 3Q07 3Q08* Chg.GLA (000) 86,699 93,791 8.2%GLA (%) 81.1% 54.7% -Rent (R$ / m²) 114.4 114.0 -0.3%Services (R$ / m²) 33.7 32.5 -3.3%
New Portfolio 3Q07 3Q08 Chg.GLA (000) 20,212 77,785 284.8%GLA (%) 18.9% 45.3% -Rent (R$ / m²) 65.2 91.9 40.9%Services (R$ / m²) 0.0 18.2 -
4
R$ Million % R$ Million % Chg.Rent 11.2 79.4% 17.8 80.0% 58.8%
Services 2.9 20.6% 4.5 20.0% 52.9%Total 14.1 100.0% 22.3 100.0% 57.6%
3Q07 3Q08*

Same Store Lease
9.1 9.8
27.525.3
3Q07 3Q08 9M07 9M08
Minimum x Exceeding Percentage of Sales
9.2
14.0
1.6
0.9
3Q07 3Q08
Minimum Exceeding Percentage of Sales
Revenue from Rent
Revenue from Rent - 3Q08
4.3%5.9%
89.8%
Rents Key Money Advertising
Vacancy
2.1% 2.5%
11.9%
5.1%3.9% 3.7%
3Q07 3Q08
Same Store New Shopping Centers GSB (Total)
6.9 %
8.6 %
51.5 %
69.9 %
5

Revenue from Services
Revenue from Services (R$ million)
1.7
3.1
1.1
0.90.2
0.1
0.3
3Q07 3Q08
Parking Energy Water Management
6
Services 3Q08 % 3Q08 X 3Q07Parking 3.1 70.2% 80.2%Energy 0.9 20.4% -15.1%Water 0.2 5.0% 68.1%Management 0.3 4.4% 621.1%Total 4.5 100.0% 52.9%

NOI x Adjusted EBITDA
R$ 8.6 MI
R$ 14.9 MI
3Q07 3Q08
NOI
+83.8%
EBITDA
+72.9%
EBITDAMg 72.5%
EBITDAMg 70.7%
NOI 3Q08R$ 17.1 MIMg 83.2%NOI 3Q07
R$ 9.3 MIMg 76.3%
* Excluding non recuring expenses
7
R$ MM % (Net Rev.) R$ MM % (Net Rev.)Cash Cogs 2.9 23.7% 3.5 16.8%Expenses* 0.7 5.6% 2.2 10.7%
3Q07 3Q08
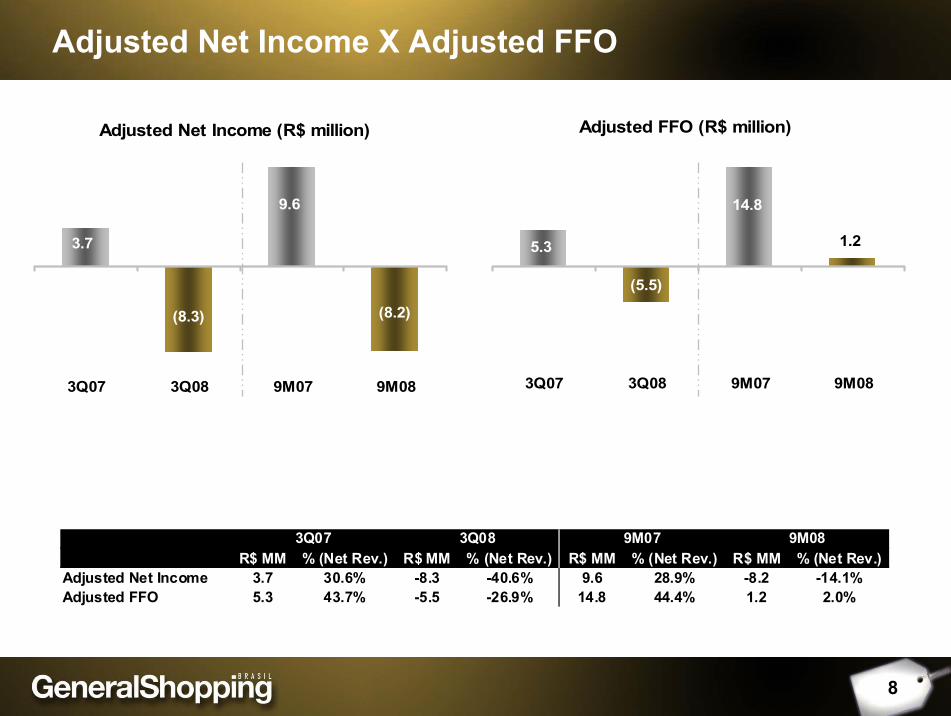
Adjusted Net Income X Adjusted FFO
Adjusted Net Income (R$ million)
(8.2)
9.6
(8.3)
3.7
3Q07 3Q08 9M07 9M08
Adjusted FFO (R$ million)
1.2
14.8
(5.5)
5.3
3Q07 3Q08 9M07 9M08
R$ MM % (Net Rev.) R$ MM % (Net Rev.) R$ MM % (Net Rev.) R$ MM % (Net Rev.)Adjusted Net Income 3.7 30.6% -8.3 -40.6% 9.6 28.9% -8.2 -14.1%Adjusted FFO 5.3 43.7% -5.5 -26.9% 14.8 44.4% 1.2 2.0%
9M07 9M083Q07 3Q08
8
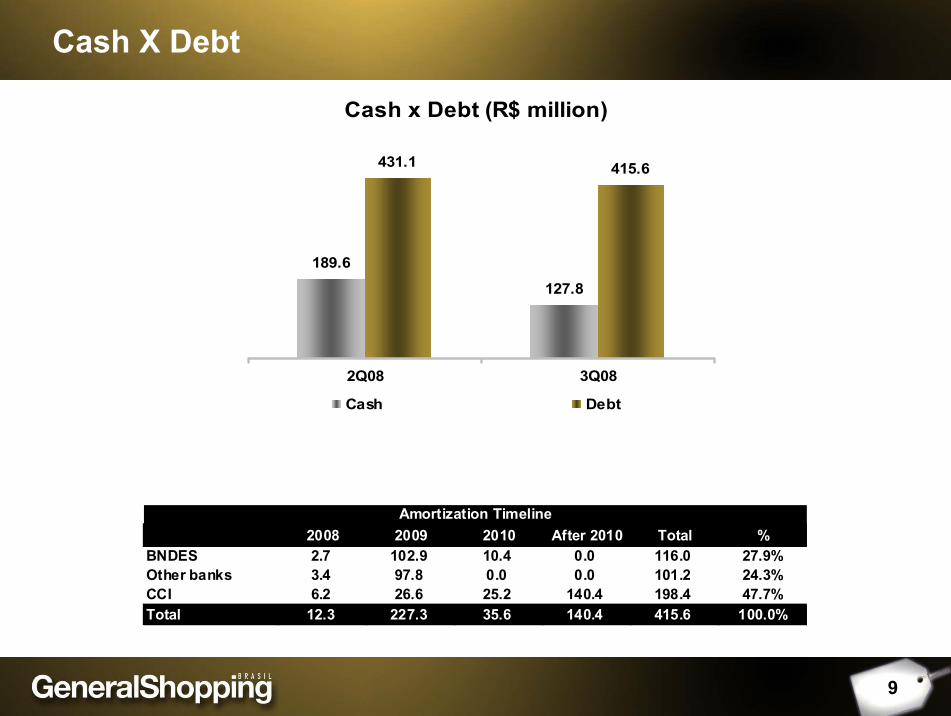
Cash X Debt
Cash x Debt (R$ million)
189.6
127.8
431.1 415.6
2Q08 3Q08
Cash Debt
9
2008 2009 2010 After 2010 Total %BNDES 2.7 102.9 10.4 0.0 116.0 27.9%Other banks 3.4 97.8 0.0 0.0 101.2 24.3%CCI 6.2 26.6 25.2 140.4 198.4 47.7%Total 12.3 227.3 35.6 140.4 415.6 100.0%
Amortization Timeline

NOI (R$ MM) and Margin
9.3
15.017.116.614.9
3Q07 4Q07 1Q08 2Q08 3Q08
Performance Indexes
Own GLA (thousand m²)
106.9
155.2171.6 171.6171.6
3Q07 4Q07 1Q08 2Q08 3Q08
Adjusted EBITDA (R$ MM) and Margin
8.6
13.114.914.6
12.8
3Q07 4Q07 1Q08 2Q08 3Q08
Net Revenue (R$ MM)
12.2
18.1 18.120.519.8
3Q07 4Q07 1Q08 2Q08 3Q08
76.3%
82.3% 82.8%84.2% 83.2%
70.8%
70.5% 72.4%73.9% 72.5%
10

11Company Overview

Differentials
Market-driven company with retail approachMarket-driven company with retail approach
B and C consumption classes as target marketB and C consumption classes as target market
Innovative complementary servicesInnovative complementary services
Majority ownership: 86.7% average interestMajority ownership: 86.7% average interest
12

Portfolio
77,485
13,120
26,5388,877
6,16610,276
3,21816,487
10,233 6,463 3,000 3,454
15,400
30,000
17,357
25,00032,000
25,730
14,14011,477
356,421
Total GLA Evolution (m2)
Growth : 360%
Oct06
2010
Jul07
Greenfields
Acquisitions
Expansions
Poli and Internacional
Shopping
Auto Shopping
Shopping Light
SuzanoShopping
Santana Parque
Shopping
Cascavel JL Shopping
Shopping Americanas
Pres. Prudente
Top Center Shopping São Paulo
Shopping Americanas
Osasco
Shopping do Vale
UnimartShopping
SuzanoShopping Expansion
InternacionalShopping Expansion
Cascavel JL Shopping Expansion
PoliShoppingExpansion
Convention Center
SulacapProject
BarueriProject
Outlet Project
São Bernardo do Campo
Project
TOTAL GLA
Dec07
13

Increasing Complementary Services Activities
Management
*
Parking Water EnergyAtlas
► Responsible for planning the energy supply and leasing of the equipment for its transmission and distribution
► Engaged in water supply planning and its treatment nadistribution
► Controls and manages parking lots
► Manages operations of shopping centers
► Manages the operations of Auto Shopping
Energy
Wass
I Park
ISG Adm
ASG Adm
Stake Held
100%
100%
100%
100%
100%
Complementary Services Companies
ISG
Auto
Poli
Light
Santana
Cascavel
Americ. PresPrudente
Americ.Osasco
Top Center
Do Vale
Unimart
Suzano
* PartialServices currently provided to the mall Potential services / currently being implemented
Complementary Service Activities
14

Shareholders
Market-making activities (through broker Ágora Senior) since October/07
40.59%
59.41%
Free float Controlling Stake
No. sharesControlling shareholder 29,990,000Free float 20,490,600Total 50,480,600
Listed since July 2007
15

16Sector Overview

Economic Indicators
17
(1) Source: PMC - IBGE;(2) Source: Centra l Bank;(3) Source: IBGE;(4) Source: PME - IBGE;Table prepared by: GSB;(* ) Sam e year-ago period

Economic Indicators
18
Unemployment rate in September (%)
11.512.9
10.99.6 10.0 9.0
7.6
Sep-02 Sep-03 Sep-04 Sep-05 Sep-06 Sep-07 Sep-08
Source: PME-IBGETable prepared by GSB
Economic Indicators
19
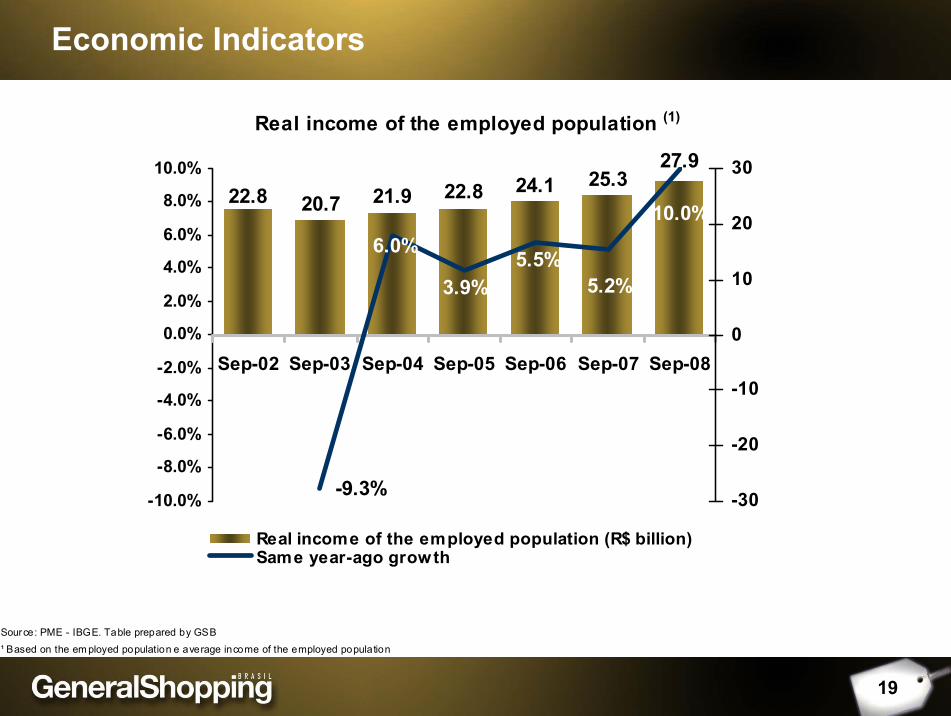
Real income of the employed population (1)
27.925.324.122.8 20.7 21.9 22.8
10.0%
-9.3%
6.0%
3.9%5.5%
5.2%
-10.0%
-8.0%
-6.0%
-4.0%
-2.0%
0.0%
2.0%
4.0%
6.0%
8.0%
10.0%
Sep-02 Sep-03 Sep-04 Sep-05 Sep-06 Sep-07 Sep-08
-30
-20
-10
0
10
20
30
Real income of the employed population (R$ billion)Same year-ago growth
Source: PME - IBGE. Table prepared by GSB¹ Based on the em ployed population e average income of the employed population

Economic Indicators
20
(1)Free loans as defined by the Circular 2.957, dated 12.30.1999. (2)Percentage of balance passed due over 90 days.(3) Rates, spread , average maturity and default were calculated based on the diference between the referred months.(4)I= Individuals; C= Corporations
Source: BACENTable prepared by: GSB
Family Income (R$) Sep/08 – Oct/082,100 a 4,800 -3.5%4,800 a 9,600 -12.9%
Over 9,600 -14.1%
Consumer Confidence Index (FGV)

GSB INVESTOR RELATIONS
Alessandro Poli VeroneziInvestor Relations Director
Marcio SniokaInvestor Relations Manager
55 11 3159-5100
www.generalshopping.com.br
Contacts
21