approaches to demand management: commissionig in a cold climate
TRANSCRIPT

© The King’s Fund 2010
Approaches to demand managementCommissioning in a cold climate
The King’s Fund 11–13 Cavendish SquareLondon W1G OANTel 020 7307 2400
Registered charity: 1126980www.kingsfund.org.uk
Seminar Highlights
EditorsCandace ImisonSarah Gregory

2 The King’s Fund 2010
Contents
Introduction 3
The challenges and opportunities presented by managing demand 4
Managing elective demand 7
Managing emergency demand 11
Conclusion 15
References 16

3 The King’s Fund 2010
Introduction
The NHS will face increased demand for health care in a climate of budgetary constrictions until at least 2014. By the end of this period the funding gap is estimated to be between £14 billion and £21 billion (Appleby et al 2010). Commissioners and providers of health care will need to strengthen their capacity to manage demand if they are to bridge this gap.
This paper summarises presentations made at a seminar held at The King’s Fund earlier this year. The seminar brought together commissioners, policy-makers, providers and others to summarise some of the available evidence about demand management. It aimed to provide practical, evidence-based advice to help commissioners and providers develop effective demand management strategies. The seminar was part of the Quality in a Cold Climate programme run by The King’s Fund, which is intended to help the NHS respond to the challenge of providing services in a financially constrained environment.
The paper begins with an overview of the different ways to manage demand and the challenges they present, in particular, to commissioners. The main messages include:
demand management should be seen as one element of a broader ■
commissioning strategy that maximises value from the NHS budget
benchmarking, use of patient-reported outcome measures and ■
utilisation reviews help commissioners target the area of spend most likely to generate savings and deliver value
procurement and use of IT are effective tools to support pathway ■
redesign.
The following commissioning strategies are then explored as a way to manage elective demand:
referral management – based on peer review and audit ■
commissioning strategies for low-value interventions – reducing ■
activity in areas of limited clinical value
encouraging shared decision-making – enabling patients to make ■
informed decisions about their care together with their clinicians.
The paper then goes on to explore the following commissioning strategies as a way to manage emergencies:
redesigning urgent care pathways in primary care to enable a more ■
rapid and effective response to those at risk of an admission
pro-active case management of patients in the community and risk ■
stratification tools for GPs to enable GPs and community services to focus on at-risk patients and help them manage their condition and avoid excessive cost to the NHS
providing more highly trained ambulance staff to reduce the number of ■
patients being taken to hospital.
The paper concludes with some key messages for commissioners and providers seeking to bridge the prospective funding gap.

4 The King’s Fund 2010
The challenges and opportunities presented by managing demand
Bob Ricketts, Director of System Management, Department of Health (DH)
The DH and primary care trusts (PCTs) have talked a lot about demand management over the last four years but have so far achieved little. Demand management should be seen as one element of a broader commissioning strategy that maximises value from the NHS budget. Benchmarking, using patient-reported outcome measures and utilisation reviews help commissioners target the area of spend most likely to generate savings and deliver value. Procurement and use of IT can then provide commissioners with effective tools to support pathway redesign.
Benchmarking
Jim Easton, National Director for Improvement for the DH, describes benchmarking as ‘mission critical’ to delivering the Quality, Innovation, Productivity and Prevention (QIPP) programme agenda. Benchmarking shows the size of the improvement opportunity in a system and helps strategic prioritisation by identifying the areas of spend most likely to generate savings.
There are a number of resources available to NHS organisations wishing to benchmark their services (see box below).
Resources to support benchmarking within the NHS
Better Care, Better Value indicators
The Better Care, Better Value indicators, published by the NHS Institute for Innovation and Improvement (2010a), reveal the potential to make significant cash or resource savings while improving quality. The NHS Institute has also introduced guides entitled Converting the Potential into Reality. The guides contain 10 steps that commissioners/providers can take to use the indicators to maximum effect to improve quality and increase productivity.
NHS Comparators
NHS Comparators (2010) is a free comparative analytical service that enables commissioners and providers to improve the quality of care delivered by benchmarking and comparing activity and costs on a local, regional and national level. The comparison includes activity and costed data through the payment by results (PbR) tariff from the Secondary Uses Service (SUS), quality and outcomes framework (QOF) information, GP practice demographic population profile data and prescribing data. Commissioners can use NHS Comparators to identify and investigate differences in referral and access rates to secondary care in terms of costs and activity.
NHS Benchmarking Network
For a small fee, the NHS Benchmarking Network (2010) provides NHS organisations, particularly commissioners, with the opportunity to benchmark themselves against other NHS organisations. The network promotes the use of benchmarking and the sharing of best practice amongst members, and also supports implementation.

5 The King’s Fund 2010
Conference highlights
The Better Care, Better Value indicators reveal substantial productivity opportunities. For example, five elective surgical procedures were assessed in PCTs in Essex and higher than average rates of surgery were identified. This equated to a productivity opportunity of approximately £1 million.
Utilisation reviews
Utilisation reviews involve an analysis of local admissions and A&E data to establish the number of inappropriate admissions. ‘Inappropriate admissions’ are defined as:
patients who could have been treated in the community but received ■
inadequate primary/community services
patients who did not need to be treated in hospital because alternative ■
services were available and/or their condition did not merit a hospital admission.
Utilisation reviews are generally under used by PCTs and trusts. The North West has adopted this approach in its acute trusts and has achieved a 9 per cent reduction in inappropriate admissions and a consequent reduction in bed days, total beds and length of hospital stay. The cost reinvestment opportunities are in excess of £1 million per annum at large acute hospital sites. An overview of the approach is provided by the DH (2006) in Care and Resource Utilisation: Ensuring appropriateness of care.
Patient-reported outcome measures
Patient-reported outcome measures (PROMs) provide NHS commissioners with a new insight into the value of what they are commissioning. PROMs are a tool for assessing patients’ perspectives on the effectiveness of their own care. PROMs questionnaires are administered to patients before and after an intervention or over time to provide a measure of the outcomes of care. In a recent report by The King’s Fund, Appleby and Devlin (2010) argue that PROMs have a potentially important role to play in helping PCTs make sure they get good value for money. The report suggests:
PROMs data is used alongside programme budgeting data to identify ■
gross disparities in value yielded from different areas
levels of spending are examined in relation to health outcomes for ■
patients in each programme budget area
particular services are assessed for value for money ■
investigating differences in the effects of treatments on different ■
patient sub-groups and the comparative effectiveness of different ways of delivering services.
Active procurement of services
PCT procurements can deliver big savings if informed by benchmarking and done as part of a wider service review. The DH (2010) has just issued new guidance to PCTs which encourages a much more rigorous approach to procurement. The guidance cautions: ‘Done well, procurement can be a powerful tool for stimulating innovation and enabling improvements in quality and value ... Nevertheless, procurement can be resource intensive

6 The King’s Fund 2010
Conference highlights
and if done badly can result in low quality and unsustainable services and poor value for money’ (Department of Health 2010, p2).
The department recommends a balanced approach (see Fig 1).
Figure 1: The procurement balance
Maximising the benefits from IT and assistive technologies
There is increasing evidence of the benefits of telehealth and telecare. Use of remote cardiac monitoring and interpretation of ECG data can significantly reduce elective and emergency referrals. For example, in Greater Manchester, use of a telemedical ECG service resulted in a 63 per cent reduction in referrals to secondary care (Broomwell Healthwatch 2010).
The Whole Systems Demonstrator Action Research Network (WSDAN) (The King’s Fund 2010a) was launched in July 2008. WSDAN is working with 12 member sites to examine the impact of telehealth and telecare in supporting the management of long-term conditions.

7 The King’s Fund 2010
Managing elective demand
There are three ways to manage elective demand:
schemes to manage GP referrals ■
reducing low-value interventions ■
support for shared decision-making with patients. ■
Referral management
Candace Imison, Deputy Director of Policy, The King’s Fund, presents a case study from Denis Gizzi, Director of System Reform, NHS Oldham
GPs make over 9 million referrals per year to hospitals. Referral management schemes attempt to influence and control patient referrals either directly or indirectly. The different approaches to referral management call for varying degrees of active intervention in the referral process (see Fig 2). At one extreme, referral management centres act as a conduit and triage for all referrals and may redirect or reject referrals. At the other extreme, GPs are given clinical guidelines to influence their referral behaviour. Between these two extremes are more targeted approaches to clinical triage (for example, focused on one specialty or condition) or the reinforcement of guidelines through peer review and audit.
Figure 2: Approaches to referral management
The King’s Fund has just completed research on referral management schemes and the impact they have had on PCTs’ capacity to manage demand as well as the quality of the referral process (see www.kingsfund.org.uk for further details). This research concluded that the most cost effective and clinically effective referral management strategies are those:
built around peer review and audit ■

8 The King’s Fund 2010
Conference highlights
supported by consultant feedback ■
with clear referral criteria and evidence-based guidelines. ■
The analysis suggests that the greater the degree of intervention, the greater the likelihood that the referral management approach will not represent value for money.
NHS Oldham provides information and feedback to GPs on their referral practice. They also offer incentives, provided through a locally enhanced service payment, for GPs to undertake peer review and audit. This process was developed by local clinicians and their ideas were then turned into a management process. It was envisaged that this would assist GPs to:
establish practice-based peer review of referral governance ■
analyse and assess their position compared to other practices in ■
Oldham
measure their referral rates against indicative fair share slot allocation, ■
under which each practice is allocated a set number of outpatient appointments
agree any action to be taken ■
discuss internally and compare outcomes against governance ■
objectives
complete governance self-assessment within a practice ■
share good practice related to referral governance at NHS Oldham ■
learning and educational events.
Fig 3 shows how GP referral rates in Oldham fell significantly after the introduction of the referral governance programme. Referrals reduced by nearly 10 per cent in two years. However, GPs in Oldham have not been able to continue to reduce referrals on an annual basis and NHS Oldham is currently working with local GPs to think about how they can re-energise this area of work.

9 The King’s Fund 2010
Conference highlights
Figure 3: GP Referrals in NHS Oldham
Commissioning strategies for low-value interventions
Candace Imison, Deputy Director of Policy, The King’s Fund, presents a case study from Denis Gizzi, Director of System Reform, NHS Oldham
There are still significant areas of clinical activity that have limited clinical value. Sir Muir Gray is leading the QIPP Programme ‘Right care’ work stream (Right Care 2010) which is devoted to identifying procedures of low value and sharing best practice. He argues that when faced with growing demands and limited resources, health services need to identify low-value interventions that can be reduced in number to free the resources to fund high-value interventions. Examples include:
an intervention for which there is proof of ineffectiveness or harm; for ■
example, prostate cancer screening
an intervention for which there is no evidence of effectiveness (except ■
when these interventions are being offered in the context of high-quality research); for example, transcutaneous aortic valve implantation
an intervention that produces less value than another intervention ■
which could be offered to a patient with the same condition; for example, prescribing domiciliary oxygen for patients when the same resources could be more appropriately used to provide rehabilitation therapy for people with chronic obstructive pulmonary disease
an intervention that produces less value than the same amount of ■
resources would produce if used to provide a service to patients with another disease within the same programme budget; for example, providing cataract operations for people with minimal visual impairment when the same resources could be used to treat people with diabetic retinopathy or macular degeneration
an intervention which the patient would not have accepted had they ■
been given clear and unbiased information about the probabilities of
10 The King’s Fund 2010
benefit and harm; for example, knee replacement surgery for people with minimal loss of function and levels of pain which are not severe, or over-prescribing for very elderly people with Alzheimer’s disease.
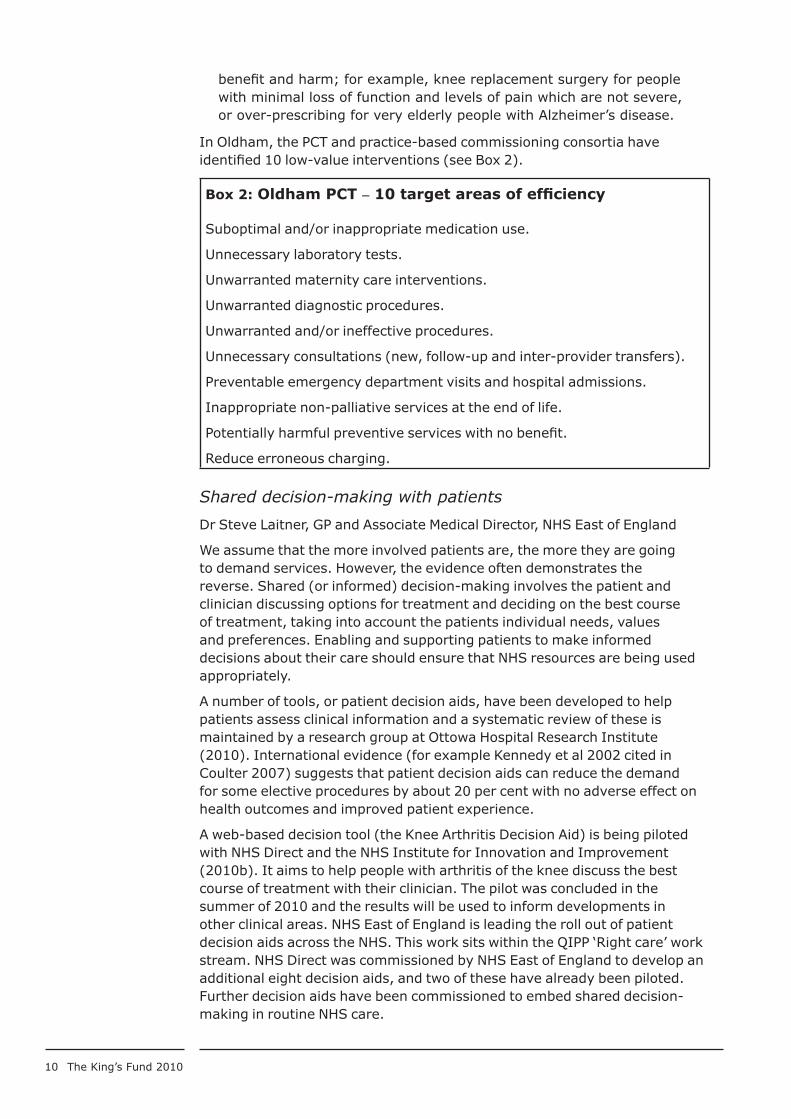
In Oldham, the PCT and practice-based commissioning consortia have identified 10 low-value interventions (see Box 2).
Box 2: Oldham PCT – 10 target areas of efficiency
Suboptimal and/or inappropriate medication use.
Unnecessary laboratory tests.
Unwarranted maternity care interventions.
Unwarranted diagnostic procedures.
Unwarranted and/or ineffective procedures.
Unnecessary consultations (new, follow-up and inter-provider transfers).
Preventable emergency department visits and hospital admissions.
Inappropriate non-palliative services at the end of life.
Potentially harmful preventive services with no benefit.
Reduce erroneous charging.
Shared decision-making with patients
Dr Steve Laitner, GP and Associate Medical Director, NHS East of England
We assume that the more involved patients are, the more they are going to demand services. However, the evidence often demonstrates the reverse. Shared (or informed) decision-making involves the patient and clinician discussing options for treatment and deciding on the best course of treatment, taking into account the patients individual needs, values and preferences. Enabling and supporting patients to make informed decisions about their care should ensure that NHS resources are being used appropriately.
A number of tools, or patient decision aids, have been developed to help patients assess clinical information and a systematic review of these is maintained by a research group at Ottowa Hospital Research Institute (2010). International evidence (for example Kennedy et al 2002 cited in Coulter 2007) suggests that patient decision aids can reduce the demand for some elective procedures by about 20 per cent with no adverse effect on health outcomes and improved patient experience.
A web-based decision tool (the Knee Arthritis Decision Aid) is being piloted with NHS Direct and the NHS Institute for Innovation and Improvement (2010b). It aims to help people with arthritis of the knee discuss the best course of treatment with their clinician. The pilot was concluded in the summer of 2010 and the results will be used to inform developments in other clinical areas. NHS East of England is leading the roll out of patient decision aids across the NHS. This work sits within the QIPP ‘Right care’ work stream. NHS Direct was commissioned by NHS East of England to develop an additional eight decision aids, and two of these have already been piloted. Further decision aids have been commissioned to embed shared decision-making in routine NHS care.

11 The King’s Fund 2010
Managing emergency demand
There are a number of ways to reduce emergency demand, including identifying and pro-actively managing those at greatest risk of admission and redesigning the way primary care is delivered. Ambulance services can also be examined with a view to reducing the demand on hospitals as well as the demand on the ambulance service itself.
An acute visiting scheme in general practice
Dr Shikha Pitalia, United League Commissioning
The Acute Visiting Scheme (AVS®) is a multi-award-winning scheme to reduce unscheduled admissions. The scheme has had such success that it has already been replicated in a number of other PCTs. The idea arose from a local utilisation review which showed that over 40 per cent of patients in local hospitals did not need to be there and 50 per cent of A&E attendances were unnecessary.
The normal work pattern of GPs results in waits of over two hours and sometimes up to six hours for many patients requiring a home visit. If the patient or their carer is anxious they will often not wait to see the GP and, instead, go straight to A&E. There, the lack of knowledge about the patient often results in the patient being admitted unnecessarily.
The Acute Visiting Scheme was implemented by a collection of 13 practices for 55,000 patients. Two community doctors were recruited to respond solely to patients in the community. This results in a more rapid response to patients and allows the doctor longer to assess the patient (see Table 1).
Table 1: Scheme response times versus normal care
Own GP ‘The scheme’ doctor
Visits done within 30
minutes of request
<5% 43%
Visits done within 60
minutes of request
<10% 76%
Average time spent
with patient
8 minutes 20 minutes
Under the scheme, a patient calls their GP as normal and speaks to them on the phone. The GP conducts an initial triage and, if they feel it is appropriate, refers the patient to the community doctor (see Fig 4).

12 The King’s Fund 2010
Conference highlights
Figure 4: Overview of acute visiting scheme
The scheme has resulted in reduced emergency referrals – the emergency referral rate is about 15 per cent less than in neighbouring practices. This indicates a clear potential to save money. The AVS only needs to avoid two complex elderly admissions per week to make the scheme self-funding.
Use of risk stratification data in general practice
Conor Burke, Borough Managing Director, Redbridge PCT
NHS Redbridge brings together hospital data, GP data and community data in a data warehouse (see Fig 5). These data are used to risk stratify their population of 250,000. At the touch of a button it is evident who in the borough is most at risk of a hospital admission.
Figure 5: Using data to identify patient risk
This model applies The King’s Fund’s combined model algorithm (The King’s Fund 2010b), which was further developed for the PCT by an independent company. GP data are extracted on a weekly basis from each practice to ensure the risk stratification remains fresh. The data have provided some

13 The King’s Fund 2010
Conference highlights
surprising results. For example, it was discovered that, on average, the 200 patients at highest risk displayed the following profile:
they saw their GP 16 times per year ■
they had six outpatient attendances ■
they had two hospital emergency admissions ■
none of them had accessed community services. ■
This project has highlighted how fragmented the current services are and that nobody is pro-actively managing the people at greatest risk. The PCT plans to include financial data for patients in the project to determine which patients have cost the most over the past two years and predict, using risk stratification, where this cost is likely to continue or escalate if nothing is done. This exercise should pinpoint potentially costly patient interventions and provide robust information to facilitate effective care planning and management.
Virtual wards in the community
Seth Rankin, GP
Virtual Ward is an award-winning initiative that aims to:
replicate the multidisciplinary approach of a hospital ward in the ■
community
pro-actively manage patients identified as being at risk of admission. ■
Wandsworth has four community virtual wards that draw from an average catchment population of 60,000 patients. There are currently 127 patients on the virtual wards in total; estimated capacity is 200–300 patients. Any patient over the age of 18 who is at high risk of admission to hospital is eligible. Potential patients are identified through: The King’s Fund’s PARR ++ tool (2010b); GP referrals; secondary care (A&E, MAU, geriatrics, sickle cell and so on); an intermediate care team; community nurses; and ambulance services.
Once a patient is admitted to a virtual ward a GP and community matron assess the patient at home. A care plan is prepared and the patient is given a direct access number to the ward, a ‘credit card’ with contact details on it and patient information leaflets. The patient is regularly followed-up at home – visiting schedules are co-ordinated by a ward clerk and information is entered directly onto GPs’ computers via remote access. One risk associated with the virtual ward is that patients are over-serviced and provided with more care than they actually need. Some PCTs are unable to differentiate between the role of ‘normal’ GPs and ‘virtual ward’ GPs and suggest that this work should be done by ‘normal’ GPs under the terms of their contract.
The patient is encouraged to contact the community virtual ward when unwell. Computerised alerts are sent if a patient contacts the local hospital or ambulance services. Should a patient be admitted to hospital, the virtual ward GP or community matron will assist with the discharge and ensure that there is prompt follow-up at home. Patients are discharged back to their own GP when they are no longer considered to be at risk of admission to hospital.
The total set-up cost for the four virtual wards was £600,000 and the ongoing costs are around £130,000 a year, which covers a GP, a ward clerk and IT administration. Qualitative data collected have been overwhelmingly positive. The Nuffield Trust (2010) is carrying out a formal evaluation of costs and

14 The King’s Fund 2010
Conference highlights
benefits to health and social care of three virtual wards, including those in Wandsworth, which will be available in November 2011. The forthcoming changes to the acute tariff could undermine the business case for virtual wards.
New approaches to the use of 999 and the ambulance service
Kathy Jones, Director of Service Development, London Ambulance Service NHS Trust
Workload analysis has shown that a significant proportion of the work of the London Ambulance Service (LAS) is not emergencies. Only 10 per cent of calls are for life-threatening emergencies and only 40 per cent of those conveyed to hospital are admitted. This highlights a significant opportunity to reduce demand or manage demand differently. However, current response time targets prevent alternatives to ambulance response being found, so a more flexible response target is needed.
There have been a number of attempts to change public behaviour and reduce demand on the ambulance service. For example, a great deal of money was invested in an advertising campaign to dissuade the public from calling 999 for non-urgent treatment and this proved unsuccessful. NHS Direct has not diverted activity from ambulances or A&E departments. Sweden went so far as to introduce a different number for their ambulance service, however it took approximately twenty years for the public to change their behaviour.
Changing the way the ambulance service operates can reduce conveyances to hospitals. The LAS and other ambulance services have begun to divert non-urgent ambulance calls to NHS Direct. They now handle 100,000 calls a year for LAS and, of these, only 14 per cent result in ambulance transfer to hospital. The LAS have also found that sending more skilled staff on an ambulance reduces the number of patients transferred to hospital. For example, the presence of a Band 6 emergency care practitioner can reduce the number of patients taken to hospital by an ambulance by one third. The DH has produced a useful toolkit describing similar initiatives (DH 2009a).
Changes in community services can also reduce demand on the ambulance service. The LAS has observed that where 24/7 community nursing services exist there is a reduction in out-of-hours calls for issues like blocked catheters.

15 The King’s Fund 2010
Conclusion
In the coming months, time will be one of the scarcest resources for leaders of both commissioner and provider organisations. If they are to address collectively the prospective funding gap it is imperative that they focus their time and management resources on areas and activities that will have the greatest impact.
This paper has focused on a variety of benchmarking tools available to health care organisations to help determine where the greatest scope for savings lie. As well as benchmarking activity across PCTs, performance within a health economy needs to be benchmarked. For example, information about referral practice should be provided to primary and secondary care clinicians. Furthermore, local clinical practice needs to be evaluated against the emerging evidence base from PROMS so that low-value interventions can be decommissioned and resources re-allocated. Supporting patients to take an active part in clinical decision-making and re-designing clinical pathways should be part of this. Emergency care consumes the greatest proportion of the NHS budget, but it is also an area where it can be hard to achieve real savings unless investment in alternatives to hospital care is accompanied by agreed non-investment in hospital services. Managing demand and bridging the funding gap requires shared clinical and managerial action across local health economies. Managing demand needs to be seen as a shared problem that requires shared solutions.

16 The King’s Fund 2010
References
Appleby J, Devlin N (2010). Getting the Most Out of PROMS. Putting health outcomes at the heart of NHS decision-making. London: The King’s Fund. Available at: www.kingsfund.org.uk/publications/proms.html (accessed on 6 October 2010).
Appleby J, Ham C, Imison C, Jennings M (2010). Improving NHS Productivity: More with the same, not more of the same.London: The King’s Fund. Available at: www.kingsfund.org.uk/publications/improving_nhs.html (accessed on 6 October 2010).
Broomwell Healthwatch (2010). ‘What is Telemedicine’. Broomwell Healthwatch website. Available at: www.broomwellhealthwatch.com/index.php?idy=149 (accessed on 12 July 2010).
Coulter A (2007). ‘When should you involve patients in treatment decisions?’. British Journal of General Practice, vol 57, no 543, pp 771–772.
Department of Health (2010). Primary Care Trust Procurement Guide for Health Services. London: Department of Health. Available at: www.dh.gov.uk/prod_consum_dh/groups/dh_digitalassets/@dh/@en/@ps/documents/digitalasset/dh_114740.pdf (accessed on 6 October 2010).
Department of Health (2009a). Tackling Demand Together: A toolkit for improving urgent and emergency care pathways by understanding increases in 999 demand. London: Department of Health. Available at: www.dh.gov.uk/prod_consum_dh/groups/dh_digitalassets/documents/digitalasset/dh_106924.pdf (accessed on 6 October 2010).
Department of Health (2009b). The Operating Framework for the NHS in England 2010/11. London: Department of Health. Available at: www.dh.gov.uk/prod_consum_dh/groups/dh_digitalassets/@dh/@en/@ps/@sta/@perf/documents/digitalasset/dh_110159.pdf (accessed on 6 October 2010).
Department of Health (2006). Care and Resource Utilisation: Ensuring appropriateness of care. London: Department of Health. Available at: www.dh.gov.uk/prod_consum_dh/groups/dh_digitalassets/@dh/@en/documents/digitalasset/dh_063264.pdf (accessed on 6 October 2010).
Kennedy A, Sculpher M, Coulter A, Dwyer N, Rees M, Abrams K, Horsley S, Cowley D, Kidson C, Kirwin C, Naish C, Stirrat G (2002). ‘Effects of decision aids for menorrhagia on treatment choices, health outcomes, and costs: a randomized controlled trial’. The Journal of the American Medical Association, vol 288, no 21, pp 2701–2708.
NHS Benchmarking Network (2010). ‘Benchmarking: Finding and implementing best practice’. NHS Benchmarking Network website. Available at: www.nhsbenchmarking.nhs.uk/benchmarking.asp?content=cases&sub=qipp (accessed on 6 October 2010).
NHS Comparators (2010). ‘Welcome to NHS Comparators’. NHS Comparators website. Available at: https://www.nhscomparators.nhs.uk/NHSComparators/Login.aspx (accessed on 6 October 2010).
NHS Institute for Innovation and Improvement (2010a). ‘NHS Better Care, Better Value Indicators’. NHS Institute for Innovation and Improvement website. Available at: www.productivity.nhs.uk/ (accessed on 6 October 2010).
NHS Institute for Innovation and Improvement (2010b). ‘Dr Steve Laitner, GP – East of England NHS’. NHS Institute for Innovation and Improvement website. Available at: www.institute.nhs.uk/building_capability/general/dr_steve_laitner%2c_gp_-_east_of_england_nhs.html (accessed on 6 October 2010).
Ottawa Hospital Research Institute (2010). ‘Systematic Review of Patient Decision Aids’. Ottawa Hospital Research Institute website. Available at: http://decisionaid.

17 The King’s Fund 2010
Conference highlights
ohri.ca/cochsystem.html (accessed on 6 October 2010).
Right Care (2010). ‘Right Care’. Right Care website. Available at: www.rightcare.nhs.uk (accessed on 13 July 2010).
The King’s Fund (2010a) ‘Whole Systems Demonstrator Action Network’. The King’s Fund website. Available at: www.kingsfund.org.uk/current_projects/whole_systems_demonstrator_action_research_network/index.html#inbrief (accessed on 6 October 2010).
The King’s Fund (2010b). ‘Predicting and Reducing Re-admission to Hospital’. The King’s Fund website. Available at: www.kingsfund.org.uk/current_projects/predicting_and_reducing_readmission_to_hospital/ (accessed on 6 October 2010).
The Nuffield Trust (2010) ‘Examining the Effectiveness of Virtual Wards’. The Nuffield Trust website. Available at: www.nuffieldtrust.org.uk/projects/index.aspx?id=1020 (accessed on 6 October 2010).