applying the 2010 asce 7 wind and ice requirements to
TRANSCRIPT

Applying the 2010 ASCE 7 Wind and Ice Requirements to Transmission Line Design
Adam J. Beyer, EIT, A.M.ASCE1
1Engineer, American Transmission Company, LLC, 2 Fen Oak Ct., Madison, WI 53718; email: [email protected] ABSTRACT ASCE/SEI 7-10 - Minimum Design Loads for Buildings and Other Structures introduced wind maps and a new way to evaluate wind loading compared to its predecessors (e.g. ASCE/SEI 7-05, ASCE/SEI 7-02, etc.). The changes will present challenges to current codes and manuals which utilize the previous maps and methodologies, specifically the National Electric Safety Code (NESC) and ASCE Manual No. 74. The purpose of this paper will be to show a comparison of the extreme wind loading and combined ice and wind for ASCE 7-10 to the ASCE 7-05 values as they apply to Transmission Lines. To begin that discussion, the author will look back on work previously done by others. The intention of this paper is to begin a public discussion of possible directions the NESC and ASCE Manual No. 74 should consider. 1 INTRODUCTION The ASCE-7 committee made the decision that it was better to assume a higher wind speed (longer return period) in their loads and reduce the load factor from 1.6 to 1.0 in the latest revision of Minimum Design Loads for Buildings and Other Structures (ASCE 7-10). NESC adopted the ASCE 7-05 maps except set all load factors at 1.0. As a result, the NESC loading requirements were below those in ASCE 7-05. If ASCE Manual No. 74 and the NESC decide to adopt the wind maps with the higher return period in their next revisions the wind pressures will increase by a ratio governed by the velocities squared for both structures and wires. This will certainly have an impact on the Extreme Wind load case. Not only did the Extreme Wind maps change, but the Extreme Ice with Concurrent Wind maps changed as well. This change will also have an impact on the Extreme Ice with Concurrent Wind case. The NESC and ASCE Manual No. 74 have a few courses of action:
• Use a factor to reduce the wind speed on ASCE 7-10 maps o How does an engineer justify the validity of using a factor to reduce or
modify the wind pressures to their previous values? • Adopt the new maps with increased wind speed and ice thicknesses.
o Does experience (failures) justify an increase in design loads? • Reference the 50-year occurrence wind map in the appendix.
o Can NESC justify using the 50-year occurrence ASCE maps?
427ELECTRICAL TRANSMISSION AND SUBSTATION STRUCTURES 2012 © ASCE 2013

The following examples will use structures and span configurations that will be included in the appendix. All hand calculations were performed using Microsoft Excel and all structural analysis calculations were performed using Powerline Systems’ PLS-CADD/POLE software. 2 EXTREME WIND LOADING REQUIREMENTS 2.1 Converting ASCE 7-05 to ASCE 7-10 Extreme Wind Speeds The values in the table below were tabulated using the Applied Technology Council’s “Wind Speed by Location” tool. This tool is used by entering the location of the building site (latitude-longitude) or manually clicking the location of the building site on the map. The results that are provided include the ASCE 7-05 and ASCE 7-10 wind speeds. Table 1 ASCE 7-05 (50 Year MRI) and ASCE 7-10 (700 Year MRI) Extreme Wind Speed Values
Area of Interest Latitude Longitude ASCE 7-05 (m/s)
ASCE 7-10 (m/s) Ratio
Eureka, CA 40.81 -124.17 38.0 49.2 1.675 Portland, OR 45.94 -122.71 38.0 49.2 1.675
Anchorage, AK 61.23 -149.82 46.0 59.0 1.642 American Samoa - - 55.9 71.5 1.638 Las Vegas, NV 36.10 -115.22 40.2 51.4 1.633 Madison, WI 43.06 -89.42 40.2 51.4 1.633
San Antonio, TX 29.51 -98.49 40.2 51.4 1.633 US Virgin Islands - - 58.1 73.8 1.611
Houston, TX 29.76 -95.40 48.3 60.4 1.563 Hawaii - - 46.9 58.1 1.533 Alaska 54.68 -164.15 58.1 71.5 1.515
Boston, MS 42.40 -71.40 46.9 57.2 1.486 Key West, FL 24.56 -81.79 67.1 80.5 1.440
Alaska 68.56 -166.26 55.9 66.6 1.421 Alaska 71.30 -156.68 53.6 63.0 1.381
Puerto Rico - - 64.8 76.0 1.375 Miami, FL 25.80 -80.23 64.4 75.1 1.361
Corpus Christi, TX 27.78 -97.40 55.9 64.4 1.327 Guam - - 76.0 87.2 1.316
The ratio column in the table above shows: =
Where: = 7 − 10 = 7 − 05 This ratio serves as a conversion between the ASCE Standards because the velocities of the wind are the only change in the wind speed pressure equation. The largest ratio from the tabulated values is 1.675 which is from Eureka, CA and Portland, OR. The ratio from Madison, WI is 1.633. All three areas will be examined because each area represents an NESC Loading District (Light, Medium, and Heavy respectively).
428ELECTRICAL TRANSMISSION AND SUBSTATION STRUCTURES 2012 © ASCE 2013

Themapare
F 2.2
TabGuibasslig ForwilAloThethe EH
ese three areps were adopnot governe
Figure 1 Extre
Results o
GoBody/Gu
ASAS
NESC ASCE M
ble 2 above side, or Stand
sed on the strghtly modifie
r the purposel be looked a
ong with the e first will beother will b
HS).
eas would alspted. One ined by areas o
me Wind Spe
of Load Cal
Tab
overning uide/StandardSCE 7-10 SCE 7-05 – Rule 250C
Manual No. 74
shows what dard. The Gructure heighed.
es of this papat with 336.4different sp
e a double cie a 90° dead
so see the mnteresting thof high wind
ed Map (ASC
culations
ble 2 Wind PrEurek
(NESC
d Wind
(P14888
the differentGRF and KZ fa
ht and span l
per a span of4 kcmil “Linan lengths, tircuit tangen
d-end single
ost drastic ching to note id speed but in
CE 7-10) mph-
essures for Exka, CAC Light) (Nd Load Pa) 480
890 890 890
t wind pressuactors will mlength so the
f 122 m (Shonnet” and 10two differentnt pole with tcircuit struc
hange to desis that the larnstead areas
(m/s) (MRI =
xtreme WindPortland, OR
NESC MediumWind Load
(Pa) 1480 890 890 890
ures are for modify the bae numbers in
ort Span) an033.5 kcmil “t structure tytwo shield w
cture with on
sign if the Arger values o of lower wi
700 Years, Ca
Rm)
Madiso(NESC
Wind (P16999999
each Governase wind pren Table 2 wi
d 274 m (Lo“Curlew” coypes will be wires (3/8” Ene shield wir
ASCE 7-10 of this ratio ind speed.
ategory II)
on, WI Heavy) Load
Pa) 20 90 90 90
ning Body, essures ill be
ong Span) onductor. looked at.
EHS) and re (3/8”
429ELECTRICAL TRANSMISSION AND SUBSTATION STRUCTURES 2012 © ASCE 2013

2.3 PLS-CADD Analysis NESC District Load cases will be evaluated as well to compare against the wind loading.
Table 3 PLS-CADD Analysis of Different Loading Scenarios for Tangent Example Ground-Line Reaction (N-m)
Load Case Wind (m/s)
Load Factor(s)
Short Span (122 m) Long Span (274 m) Linnet Curlew Linnet Curlew
NESC Heavy1 17.9
(1.27 cm ice)
NESC 475 580 1020 1300
Extreme Wind - 20051
40.2 1.0 390 550 680 1020
Extreme Wind - 20101
51.4 1.0 640 900 1100 1660
NESC Medium2 17.9
(0.64 cm ice)
NESC 340 440 710 960
Extreme Wind - 20052
38.0 1.0 350 495 600 910
Extreme Wind - 20102
49.2 1.0 590 830 1010 1520
NESC Light3 26.8 NESC 490 700 930 1440
Extreme Wind - 20053
38.0 1.0 350 500 600 910
Extreme Wind - 20103
49.2 1.0 590 830 1010 1520
Notes: 1 Stringing Condition is NESC Heavy at 40% of ultimate tension (Creep) 2 Stringing Condition is NESC Medium at 40% of ultimate tension (Creep) 3 Stringing Condition is NESC Light at 40% of ultimate tension (Creep) The analysis in table 3 shows that the only change was the wind speed and removal of the load factor. It should be noted that table 3 shows the ASCE 7-2010 Extreme Wind Loads do govern when compared to the NESC District Loads.
430ELECTRICAL TRANSMISSION AND SUBSTATION STRUCTURES 2012 © ASCE 2013

Table 4 PLS-CADD Analysis of Different Loading Scenarios for Dead-End (90°) Example Ground-Line Reaction (N-m)
Load Case Wind (m/s)
Load Factor(s)
Short Span (122 m) Long Span (274 m) Linnet Curlew Linnet Curlew
NESC Heavy1 17.9
(1.27 cm ice)
NESC 4240 8480 4410 8730
Extreme Wind - 20051
40.2 1.0 1920 4300 2000 4430
Extreme Wind - 20101
51.4 1.0 1590 5000 2600 5210
NESC Medium2 17.9
(0.64 cm ice)
NESC 4320 8930 4440 9120
Extreme Wind - 20052
38.0 1.0 2320 5090 2390 5220
Extreme Wind - 20102 49.2 1.0 2790 5610 2910 5810
NESC Light3 26.8 NESC 4570 9390 4690 9600
Extreme Wind - 20053
38.0 1.0 2620 5670 2690 5800
Extreme Wind - 20103 49.2 1.0 3030 6100 3150 6300
Notes: 1 Stringing Condition is NESC Heavy at 40% of ultimate tension (Creep) 2 Stringing Condition is NESC Medium at 40% of ultimate tension (Creep) 3 Stringing Condition is NESC Light at 40% of ultimate tension (Creep) Table 4 above for the 90° dead-end case shows even with the increased wind speed on a dead-end type structure the NESC district loads (Heavy, Medium, and Light) will still govern the design of the pole. This is true for other angles in the dead-end case. It is important to note that large angle and dead-end structures are typically the most expensive structures on a transmission line and would not be affected if the ASCE 7-10 maps were adopted by ASCE Manual No. 74 and the NESC. 2.4 Turning the 700-year Mean Recurrence Interval (MRI) map into a 50-year
MRI map Turning the 700-year MRI map values into lower MRI values is necessary since Transmission Lines are traditionally designed for a 50 year life. An equation similar to C26.5-2 in the ASCE 7-10 commentary can be derived from known values. Take for example the Midwestern United States in Table 5 below:
431ELECTRICAL TRANSMISSION AND SUBSTATION STRUCTURES 2012 © ASCE 2013

Table 5 Return Period Values for the Midwestern United States
Midwestern United StatesReturn Period, T
(yrs) Wind Velocity, VT
(m/s) VT/V700
50 40.2 0.783 100 42.9 0.835 300 46.9 0.913 700 51.4 1.000
1700 53.6 1.043
Figure 2 Graph of Return Period vs. Velocity Ratio
The equation below can be used to determine the velocity of wind based on a desired return period. In the case of Transmission Line Design, 50 years is often the desired value. = × (0.484 + 0.0763 ( )) It should be noted that a 50-year MRI map is published in the ASCE 7-10 standard however it is not exactly the same as the 50-year MRI map from ASCE 7-05 (the ASCE 7-10 50-year MRI map is intended to be used for serviceability analysis). The reason for the difference is that the ASCE 7-05 maps were actually a 700-year MRI map divided by √1.6 (1.6 was the wind load factor). The commentary of ASCE 7-10 states “The task committee (Wind Load Subcommittee) reasoned that the annual probability of exceeding the strength design wind load in the hurricane and non-hurricane regions of the United States should be the same” (p. 509). In table C6-7 (p. 318) of ASCE 7-05 there is a footnote that states in reference to hurricane velocities, “For the MRI = 50 as shown, the actual return period, as represented by the design wind speed map in Fig. 6-1, varies from 50 to approximately 90 years.” The result was that the ASCE 7-05 maps resulted in a true 50-year event for non-hurricane regions, but in hurricane regions the event was slightly larger than a 50-year event. This means that current transmission line designs involving extreme wind events are not designed based on a consistent recurrence
y = 0.0763ln(x) + 0.4841
0.50
0.60
0.70
0.80
0.90
1.00
1.10
0 500 1000 1500 2000
V T/V 70
0
Return Period, T (yrs)
Return Period vs. Velocity Ratio
432ELECTRICAL TRANSMISSION AND SUBSTATION STRUCTURES 2012 © ASCE 2013

interval because the ASCE 74 and the NESC reference the ASCE 7-05 maps without the load factor. This adds to the complexity of the decision for the ASCE 74 and the NESC committees. If ASCE 74 and the NESC want to continue using the same variable recurrence interval then they will need to continue using the ASCE 7-05 maps, however trying to justify this approach may not agree with good engineering practice. The author believes the most logical choice is to specify a minimum recurrence interval and use the appropriate map from ASCE 7-10. The MRI maps available in ASCE 7-10 are 10, 25, 50, 100, 300, 700, and 1700. Depending on which map is chosen to be referenced the committees could choose to include a formula based on that map to adjust the wind speed to a desired recurrence interval. 2.5 Conclusion of Extreme Wind It is at this point that the author would like to propose a change (in bold) to the wind pressure formula so that the ASCE 7-10 maps could be adopted into ASCE Manual No. 74 and eventually the NESC. : = 0.613 × × × × × : = 0.613 × × × × × ℎ : = = = − = = = ℎ : = = (700 ) = = × (0.484 + 0.0763 ( )) : 50 700 : = 51.4 / × (0.484 + 0.0763 (50))~40.2 / By introducing the VRI term the new ASCE 7-10 maps will be able to be used by ASCE Manual No. 74 and the NESC. With these changes, the NESC for example would be able to dictate what minimum recurrence interval Transmission Lines should be designed to. Currently a minimum of 50 years for most of the United States is the recurrence interval in the NESC. If the ASCE 7-10 700-year MRI maps are adopted as is then the increased wind loads would govern the design of the tangent structures. It is possible that ASCE Manual No. 74 could adopt the ASCE 7-10 maps and methodology with modifications after benchmarking across the United States. The NESC would then be encouraged to follow as their maps are traditionally adopted from ASCE 7. By using the modified
433ELECTRICAL TRANSMISSION AND SUBSTATION STRUCTURES 2012 © ASCE 2013

winperremmet 3
3.1
TheExt
W
M
TheASWincasice bot(chSup
Fig
nd pressure fiod/reliabilit
main at 1.0 anthodology w
EXTREMREQUIRE
CompariWind
e values in thtreme Ice an
Table 6 AS
Area of Interest
Northern Wisconsin
Eastern Montana
Lake Superior,
Minnesota Northern Missouri
e new ExtremCE 7-10 alsond loading ces will use thon the wiresh. Four areaanged wind perior area in
gure 3 Extrem
formula, desty need of thnd this woul
with the ASC
ME ICE WITEMENTS
ison of ASC
he table belod Concurren
SCE 7-05 and A
NESC Zone
Heavy
Medium
Heavy
Medium
me Ice and Co introduced
condition. The new temps while otheras have beenspeed), East
n Minnesota
me Ice and Conin
igners may bhe line more ld align the A
CE 7-10 stand
TH CONCU
CE 7-05 to A
ow were tabunt Wind map
ASCE 7-10 Ex
ASCE 7-0
Ice (cm)
W(m
1.27 1
0.64 2
3.18 2
2.54 1
Concurrent Wd a temperatu
The ASCE 7-perature maprs have adju
n chosen for tern Montan
a (changed bo
ncurrent Windterest for this
be encouragso than befo
ASCE Manudard (use a c
URRENT W
ASCE 7-10 E
ulated using ps.
xtreme Ice an
05
Wind m/s)
Ic(cm
7.9 1.2
22.4 1.2
26.8 1.9
3.4 2.5
Wind Speed ure map for -05 cases wilp. Some arested the winanalysis wh
na (changed aoth), and No
d Map (ASCEpaper (MRI =
ed to think aore. The oveual No. 74 anconsistent re
WIND LOAD
Extreme Ice
the ASCE 7
d Concurrent
ASC
ce m)
Wind(m/s)
27 22.4
27 22.4
91 22.4
54 13.4
maps have cthe Extremell use -9.4°C
eas have incrnd speed andhich are Nortamount of raorthern Miss
E 7-10); Figure= 50 Years)
about the reterload factornd the NESCecurrence int
DING
e and Concu
7-05 and AS
t Wind Speed
CE 7-10
d )
Tempe(°C
4 -20
4 -26
4 -20
4 -15
changed slige Ice and CoC and the ASreased the amd some have thern Wisconadial ice), Lasouri (no cha
e 10-3 of ASCE
turn rs could C terval).
urrent
CE 7-10
Values
erature C)
0.6
6.1
0.6
5.0
ghtly. ncurrent
SCE 7-10 mount of adjusted nsin ake ange).
E 7 is also of
434ELECTRICAL TRANSMISSION AND SUBSTATION STRUCTURES 2012 © ASCE 2013

3.2 PLS-CADD Analysis NESC District Load cases will be evaluated as well to compare against the Extreme Ice and Concurrent Wind loading.
Table 7 PLS-CADD Analysis of Different Loading Scenarios for Tangent Example Ground-Line Reaction (N-m)
Load Case Wind (m/s)
Ice (cm)
Load Factor(s)
Short Span (122 m) Long Span (274 m) Linnet Curlew Linnet Curlew
NESC Heavy1 17.9 1.27 NESC 475 580 1020 1300
Extreme Ice and Wind – Wisconsin – 2005 1
17.9 1.27 1.0 190 230 400 500
Extreme Ice and Wind – Wisconsin – 2010 1
22.4 1.27 1.0 290 350 620 770
NESC Heavy1 17.9 1.27 NESC 475 580 1020 1300
Extreme Ice and Wind – Lake Superior – 2005 1
26.8 3.18 1.0 790 890 1820 2130
Extreme Ice and Wind – Lake Superior – 2010 1
22.4 1.91 1.0 370 440 820 990
NESC Medium2 17.9 0.64 NESC 340 440 710 960
Extreme Ice and Wind – Montana – 2005 2
22.4 0.64 1.0 210 270 430 580
Extreme Ice and Wind – Montana – 2010 2
22.4 1.27 1.0 290 350 620 770
NESC Medium2 17.9 0.64 NESC 340 440 710 960
Extreme Ice and Wind – Missouri – 2005 2
13.4 2.54 1.0 160 190 370 440
Extreme Ice and Wind – Missouri – 2010 2
13.4 2.54 1.0 160 190 370 440
Notes: 1 Stringing Condition is NESC Heavy at 40% of ultimate tension (Creep RS) 2 Stringing Condition is NESC Medium at 40% of ultimate tension (Creep RS) In table 6 above, the calculations show that the 2010 Extreme Ice and Wind ground-line reactions increased from the 2005 Extreme Ice and Wind in Wisconsin and Montana, but the NESC District Loads still continue to govern the design. However, one area of interest is the Lake Superior region where the loads actually decreased along some parts of the lake. There was no change in ground-line moment for the region in Northern Missouri.
435ELECTRICAL TRANSMISSION AND SUBSTATION STRUCTURES 2012 © ASCE 2013

Table 8 PLS-CADD Analysis of Different Loading Scenarios for Dead-End (90°) Example Ground-Line Reaction (N-m)
Load Case Wind (m/s)
Ice (cm)
Load Factor(s)
Short Span (122 m) Long Span (274 m) Linnet Curlew Linnet Curlew
NESC Heavy1 17.9 1.27 NESC 3130 6260 3250 6440
Extreme Ice and Wind – Wisconsin – 2005 1 17.9 1.27 1.0 1660 3650 1710 3730
Extreme Ice and Wind – Wisconsin – 2010 1 22.4 1.27 1.0 1840 3910 1920 4020
NESC Heavy1 17.9 1.27 NESC 3130 6260 3250 6440
Extreme Ice and Wind – Lake Superior – 2005 1
26.8 3.18 1.0 3140 5210 3390 5520
Extreme Ice and Wind – Lake Superior – 2010 1
22.4 1.91 1.0 2210 4280 2310 4810
NESC Medium2 17.9 0.64 NESC 3370 6930 3460 7080
Extreme Ice and Wind – Montana – 2005 2
22.4 0.64 1.0 1850 4110 1900 4190
Extreme Ice and Wind – Montana – 2010 2
22.4 1.27 1.0 2220 4580 2300 4700
NESC Medium2 17.9 0.64 NESC 3370 6930 3460 7080
Extreme Ice and Wind – Missouri – 2005 2
13.4 2.54 1.0 3530 6560 3630 6740
Extreme Ice and Wind – Missouri – 2010 2
13.4 2.54 1.0 3560 6640 3660 6820
Notes: 1 Stringing Condition is NESC Heavy at 40% of ultimate tension (Creep RS) 2 Stringing Condition is NESC Medium at 40% of ultimate tension (Creep RS) Table 7 above for the 90° dead-end case shows that even with the increased ice and wind speed on a dead-end type structure the district loads will still govern the design of the pole except in Missouri for small conductor sizes. 3.3 Conclusion of Extreme Ice and Concurrent Wind The analysis for Extreme Ice and Concurrent Wind shows that even though the loadings for some cases have increased, the NESC District loads still govern (a few special areas will still dictate the design but there was no increase in ice and wind loads in those areas). ASCE Manual No. 74 and the NESC can adopt the Extreme Ice and Concurrent Wind loading maps without a drastic change to current design practice. The temperature maps from ASCE 7-10 do not necessarily need to be
436ELECTRICAL TRANSMISSION AND SUBSTATION STRUCTURES 2012 © ASCE 2013

adopted by ASCE Manual No. 74 and the NESC because the calculations show the differences to be negligible – Less than 1.5% increase in the analysis for Missouri. 4 CONCLUSIONS Currently, there is a lot of dialogue in the construction industry to create infrastructure that is more sustainable and exhibits a longer life. Transmission lines are no exception and are just as important as a road or a building is to our everyday lives. As mentioned in this paper, the NESC (2007 and 2012) currently requires a 50 year return period (minimum) on extreme events in most areas of the United States. The author is aware of several transmission lines that have been in service for well over 50 years, so maybe it is time to examine increasing the return period on extreme events if we intend to keep these lines in service for longer periods. The author believes that overall the ASCE 7-10 maps could be adopted by ASCE Manual No. 74 and eventually the NESC if modifications are implemented to use a more applicable return period for transmission line design. In some areas the loadings have increased and structures may need to be designed to be more robust. Since the data shows that the loading conditions for different areas of the United States have changed, or we have refined our methods, then we as engineers should not be hesitant to adjust either. In the end, ensuring our electric grid is more structurally reliable based on new data as it becomes available is a step in the right direction. REFERENCES
1. ASCE/SEI 7-05. (2006). Minimum Design Loads for Buildings and Other Structures Wind Loads.
2. ASCE/SEI 7-10. (2011). Minimum Design Loads for Buildings and Other Structures Wind Loads.
3. National Electric Safety Code. (2012). Section 25 – Loadings for Grades B and C.
4. ASCE Manual No. 74 (3rd Edition). Guidelines for Electrical Transmission Line Structural Loading, Reston, VA, USA, 2006.
5. PLS-CADD, A Computer Program for the Analysis and Design of Overhead Electric Lines. Power Line Systems, Madison, WI, USA.
6. Microsoft Excel 2010. Microsoft Corp. 7. Applied Technology Council. (2011). Windspeed by Location. Retrieved
from http://www.atcouncil.org/windspeed/
437ELECTRICAL TRANSMISSION AND SUBSTATION STRUCTURES 2012 © ASCE 2013
AP TanStruandRulMinMaWinShiShiCon336103Lin1SaDis2SaDis3SaLoa
PPENDIX
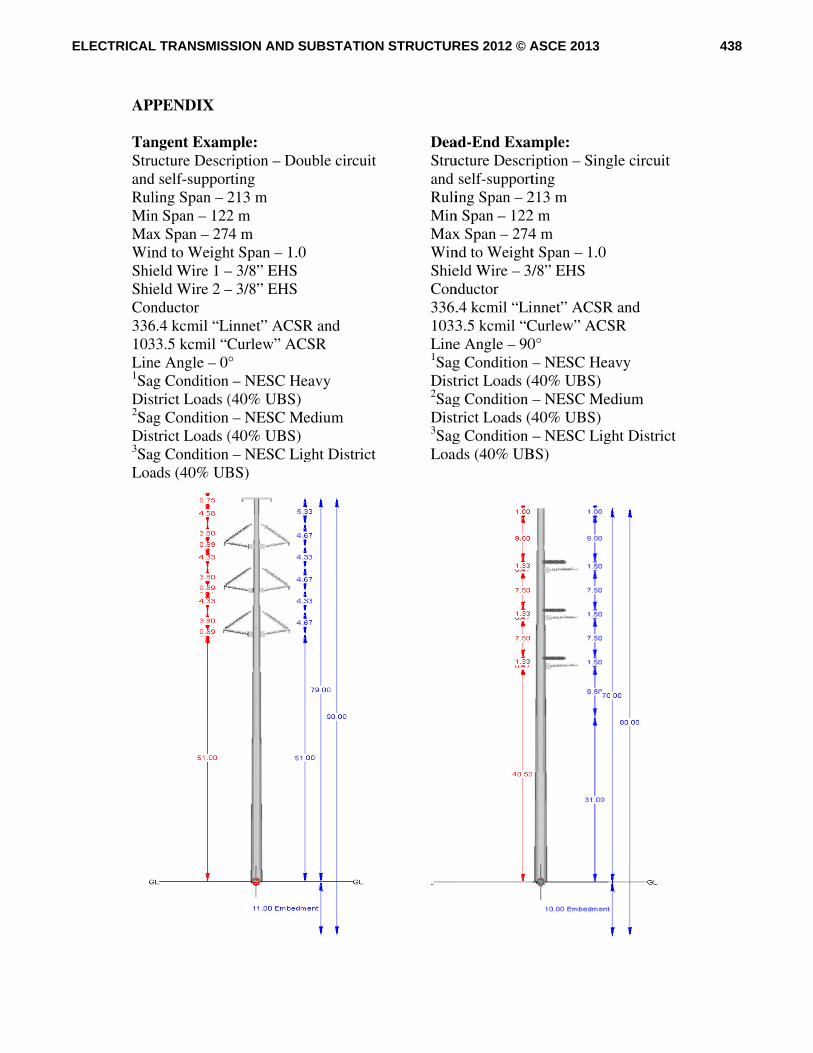
ngent Examucture Descrd self-supporling Span – 2n Span – 122
ax Span – 27nd to Weighield Wire 1 –ield Wire 2 –nductor 6.4 kcmil “L33.5 kcmil “Cne Angle – 0ag Conditionstrict Loads (ag Conditionstrict Loads (ag Conditionads (40% UB
mple: ription – Dourting 213 m 2 m 4 m
ht Span – 1.0– 3/8” EHS – 3/8” EHS
Linnet” ACSRCurlew” AC°
n – NESC He(40% UBS)
n – NESC Me(40% UBS)
n – NESC LigBS)
uble circuit
0
R and CSR
eavy
edium
ght District
DeaStruand RuliMinMaxWinShieCon336.1033Line1SagDist2SagDist3SagLoad
ad-End Examucture Descri
self-supporting Span – 2
n Span – 122x Span – 274nd to Weighteld Wire – 3/nductor .4 kcmil “Li3.5 kcmil “Ce Angle – 90g Condition –trict Loads (4g Condition –trict Loads (4g Condition –ds (40% UB
mple: iption – Singting 213 m 2 m 4 m t Span – 1.0 /8” EHS
innet” ACSRCurlew” ACS0° – NESC He40% UBS) – NESC Me40% UBS) – NESC Lig
BS)
gle circuit
R and SR
avy
edium
ght District
438ELECTRICAL TRANSMISSION AND SUBSTATION STRUCTURES 2012 © ASCE 2013