applying profilers to mysql from pmp to perf, and why ... · start data collection ... head -20...
TRANSCRIPT

Applying profilers to MySQLFrom PMP to perf, and why Performance Schema is not a
replacement in all cases
Valerii Kravchuk, Principal Support [email protected]
1

www.percona.com
Who am I?Valerii (aka Valeriy) Kravchuk:● MySQL Support Engineer in MySQL AB, Sun and Oracle, 2005 - 2012● Principal Support Engineer in Percona, 2012 - 2016● Principal Support Engineer in MariaDB Corporation since March 2016● http://mysqlentomologist.blogspot.com - my blog about MySQL (a lot about
MySQL bugs, but some HowTos as well)● https://www.facebook.com/valerii.kravchuk - my Facebook page, a lot about
MySQL (mostly bugs…)● http://bugs.mysql.com - my personal playground. 308 bugs reported in total,
20 since February, 2016● I like FOSDEM, see slides from my previous talks:
○ http://www.slideshare.net/valeriikravchuk1/fosdem2015-gdb-tips-and-tricks-for-my-sql-db-as○ http://www.slideshare.net/ValeriyKravchuk/more-on-gdb-for-my-sql-db-as-fosdem-2016
2

www.percona.com
What is this session about?
● It’s about profiling MySQL and some tools (“profilers”) MySQL DBA can use for profiling in production on Linux:○ Oprofile (including opcontrol, opreport and operf)○ perf (I think it’s the best and easiest to use now)○ Few words on PMP (pt-pmp)
● Some real life use case, along the lines of Bug #39630, Bug #68079 (including studying similar use case with MyRocks), Bug #83912 and maybe more...
● Why not about gprof, Callgrind, Massif, dtrace, SystemTap?● Why not about Performance Schema?● Performance impact of profiling
3
www.percona.com
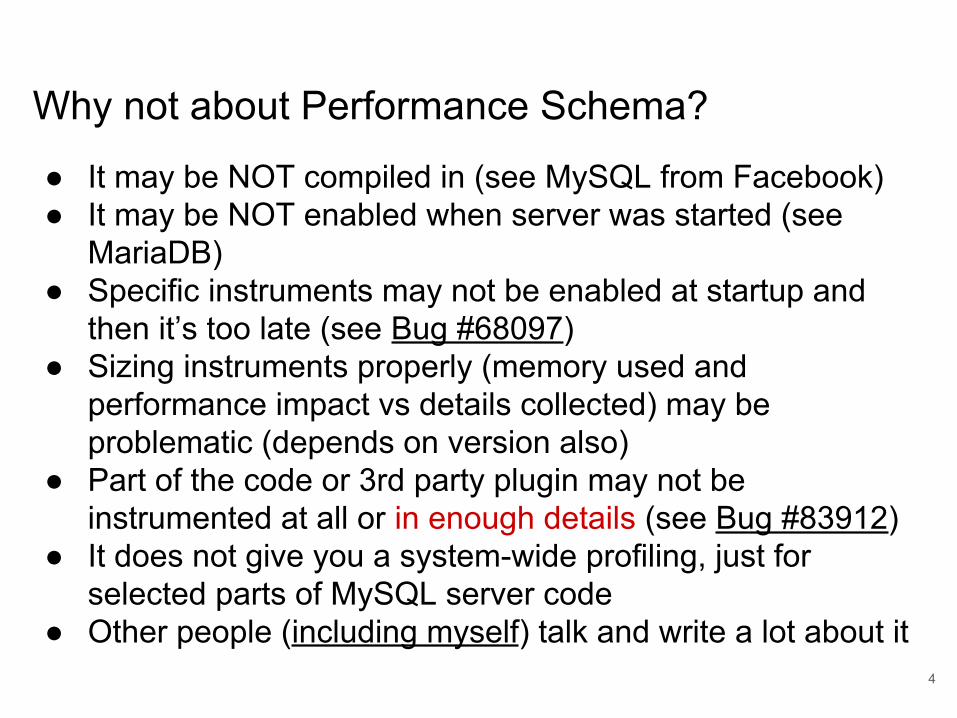
Why not about Performance Schema?
● It may be NOT compiled in (see MySQL from Facebook)● It may be NOT enabled when server was started (see
MariaDB)● Specific instruments may not be enabled at startup and
then it’s too late (see Bug #68097)● Sizing instruments properly (memory used and
performance impact vs details collected) may be problematic (depends on version also)
● Part of the code or 3rd party plugin may not be instrumented at all or in enough details (see Bug #83912)
● It does not give you a system-wide profiling, just for selected parts of MySQL server code
● Other people (including myself) talk and write a lot about it4

www.percona.com
Not Enough Details in Performance Schema
Samples: 52K of event 'cpu-clock', Event count (approx.): 13037500000Overhead Command Shared Object Symbol 43.75% mysqld mysqld [.] Item_func_mul::int_op 16.97% mysqld mysqld [.] Item_func_benchmark::val_int 14.10% mysqld mysqld [.] Item_int::val_int 13.50% mysqld mysqld [.] Item_func_numhybrid::val_int... 2.58% mysqld mysqld [.] Item_func_numhybrid::result_type...
30 SELECT `benchmark` ( ?, ... * ? ) (13055172.39?)30 stage/sql/init (51.56?)30 stage/sql/checking permissions (2.27?)30 stage/sql/Opening tables (1.00?)30 stage/sql/After opening tables (0.62?)30 stage/sql/init (9.32?)30 stage/sql/optimizing (7.41?)30 stage/sql/executing (13055061.32?)30 stage/sql/end (3.98?)30 stage/sql/query end (2.34?)30 stage/sql/closing tables (1.73?)30 stage/sql/freeing items (4.22?)30 stage/sql/cleaning up (1.13?)
● Yes, this is for primitive select benchmark(500000000,2*2) from Bug #39630● Performance Schema query is like 25 lines long to make it readable
5

www.percona.com
Not Enough Details in Performance Schema
● Now, where the time is spent on “statistics” stage in case presented in Bug #83912?
| 26 | 379 | NULL | SELECT * FROM `t0` WHERE ID = ? (13072.50ms)| 26 | 380 | 379 | stage/sql/init (0.05ms)| 26 | 383 | 379 | stage/sql/checking permissions (0.00ms)| 26 | 384 | 379 | stage/sql/Opening tables (0.02ms)| 26 | 386 | 379 | stage/sql/After opening tables (0.00ms) | 26 | 387 | 379 | stage/sql/System lock (0.00ms)| 26 | 389 | 379 | stage/sql/Table lock (0.00ms)| 26 | 391 | 379 | stage/sql/init (0.02ms)| 26 | 392 | 379 | stage/sql/optimizing (0.01ms)| 26 | 393 | 379 | stage/sql/statistics (13072.32ms)| 26 | 396 | 379 | stage/sql/preparing (0.00ms)| 26 | 397 | 379 | stage/sql/Unlocking tables (0.02ms)| 26 | 398 | 379 | stage/sql/executing (0.00ms)| 26 | 399 | 379 | stage/sql/Sending data (0.01ms)| 26 | 400 | 379 | stage/sql/end (0.00ms)| 26 | 401 | 379 | stage/sql/query end (0.00ms)
6
www.percona.com
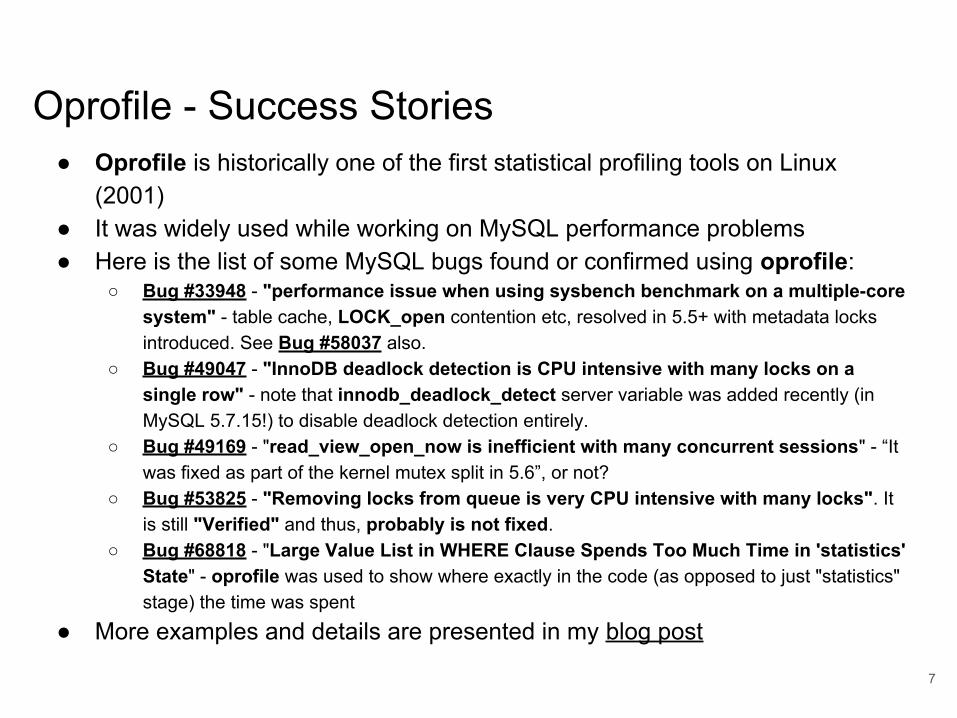
Oprofile - Success Stories ● Oprofile is historically one of the first statistical profiling tools on Linux
(2001)● It was widely used while working on MySQL performance problems● Here is the list of some MySQL bugs found or confirmed using oprofile:
○ Bug #33948 - "performance issue when using sysbench benchmark on a multiple-core system" - table cache, LOCK_open contention etc, resolved in 5.5+ with metadata locks introduced. See Bug #58037 also.
○ Bug #49047 - "InnoDB deadlock detection is CPU intensive with many locks on a single row" - note that innodb_deadlock_detect server variable was added recently (in MySQL 5.7.15!) to disable deadlock detection entirely.
○ Bug #49169 - "read_view_open_now is inefficient with many concurrent sessions" - “It was fixed as part of the kernel mutex split in 5.6”, or not?
○ Bug #53825 - "Removing locks from queue is very CPU intensive with many locks". It is still "Verified" and thus, probably is not fixed.
○ Bug #68818 - "Large Value List in WHERE Clause Spends Too Much Time in 'statistics' State" - oprofile was used to show where exactly in the code (as opposed to just "statistics" stage) the time was spent
● More examples and details are presented in my blog post
7

www.percona.com
Oprofile - Basic Usage of Versions < 1.0.0
● Check my post, “Oprofile Basics for MySQL Profiling”, for details and references, but basic minimal steps are:
○ Make sure oprofile package is installed: dpkg -l | grep oprofile○ Load the OProfile module if required and make the OProfile driver interface available:
sudo opcontrol --init○ Start data collection (daemon is started if was not running):
sudo opcontrol --start --no-vmlinux○ Run your problematic load against MySQL server○ Samples are collected in --session-dir (if it was set), or `pwd`/oprofile_data, or, if that
directory does not exist, the standard session-dir of /var/lib/oprofile is used○ Stop data collection:
sudo opcontrol --stop○ Flush collected daemon data:
sudo opcontrol --dump○ Run opreport to see the data collected:
sudo opreport --demangle=smart --symbols --merge tgid path_to_mysqld○ Check pt-stalk source code for the way --collect-oprofile option is implemented
8

www.percona.com
Oprofile - Basic Usage of Versions >= 1.0.0
● No need for daemon (since 0.9.8), no opcontrol. operf allows to profile a single process (--pid, may work for normal user) or every currently running process (--system-wide). operf interfaces with the kernel to collect samples via the Linux Kernel Performance Events Subsystem (see perf).
● Less steps needed:○ Start system-wide data collection :
sudo operf -s○ Run your problematic load against MySQL server○ Interrupt the operf process (Ctrl-C works if it was foreground):
sudo kill -SIGINT pid_of_operf○ Run opreport to see the data collected:
sudo opreport --demangle=smart --symbols --merge tgid path_to_mysqld
● My naive experience with --pid `pidof mysqld` option on Ubuntu 14.04 and Fedora 25 was negative, use system-wide profiling
● Check this pull request for pt-stalk (one day it will work with oprofile 1.0.0+)
9
www.percona.com
Oprofile - Results You Get (Primitive Example)
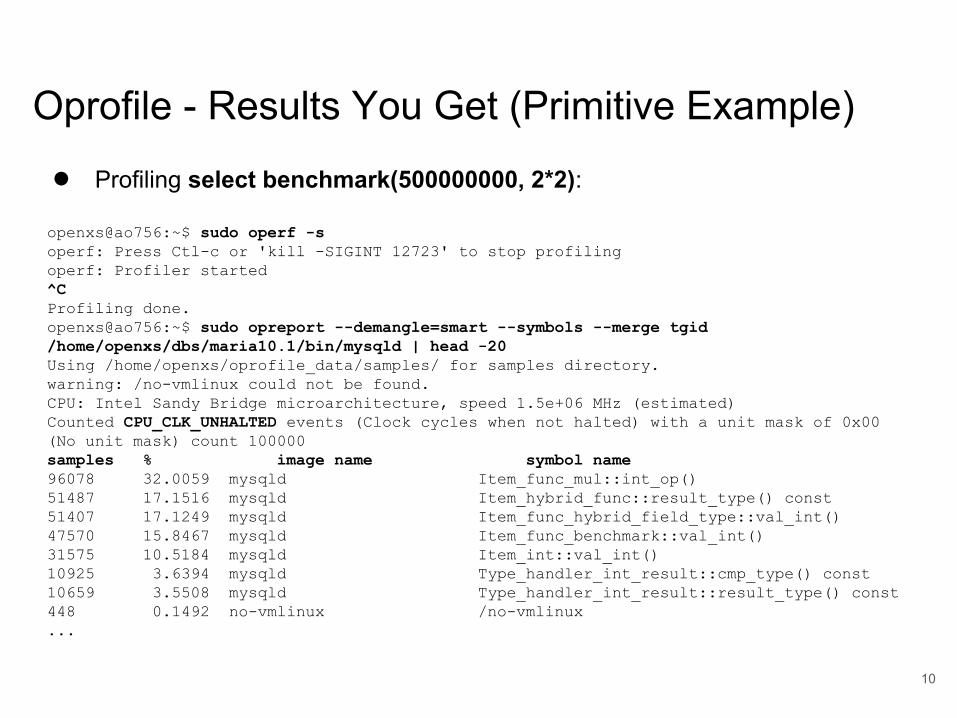
● Profiling select benchmark(500000000, 2*2):
openxs@ao756:~$ sudo operf -soperf: Press Ctl-c or 'kill -SIGINT 12723' to stop profilingoperf: Profiler started^CProfiling done.openxs@ao756:~$ sudo opreport --demangle=smart --symbols --merge tgid /home/openxs/dbs/maria10.1/bin/mysqld | head -20Using /home/openxs/oprofile_data/samples/ for samples directory.warning: /no-vmlinux could not be found.CPU: Intel Sandy Bridge microarchitecture, speed 1.5e+06 MHz (estimated)Counted CPU_CLK_UNHALTED events (Clock cycles when not halted) with a unit mask of 0x00 (No unit mask) count 100000samples % image name symbol name96078 32.0059 mysqld Item_func_mul::int_op()51487 17.1516 mysqld Item_hybrid_func::result_type() const51407 17.1249 mysqld Item_func_hybrid_field_type::val_int()47570 15.8467 mysqld Item_func_benchmark::val_int()31575 10.5184 mysqld Item_int::val_int()10925 3.6394 mysqld Type_handler_int_result::cmp_type() const10659 3.5508 mysqld Type_handler_int_result::result_type() const448 0.1492 no-vmlinux /no-vmlinux...
10

www.percona.com
pt-pmp (Poor Man’s Profiler)● http://www.percona.com/doc/percona-toolkit/2.2/pt-pmp.html
pt-pmp [-i 1] [-s 0] [-b mysqld] [-p pidofmysqld] [-l 0] [-k file] [--version]
● It is based on original idea by Domas, http://poormansprofiler.org/ ● One of the recent examples how it is used: Bug #78277 - InnoDB deadlock,
thread stuck on kernel calls from transparent page compression, “Open”● When mysqld hangs or is slow, you can get some insight quickly: for
example, Bug #75028 (HandlerSocket “hangs” on shutdown)● When there are stalls, use pt-pmp to find out why (or what threads mostly
do at the moment): Bug #69810● Use in production as a last resort (may hang mysqld, --SIGCONT)● pt-pmp surely slows server down :) Hints:
○ https://bugs.launchpad.net/percona-toolkit/+bug/1320168 - partial workaround
○ Use quickstack instead of gdb (check this discussion)
11
www.percona.com
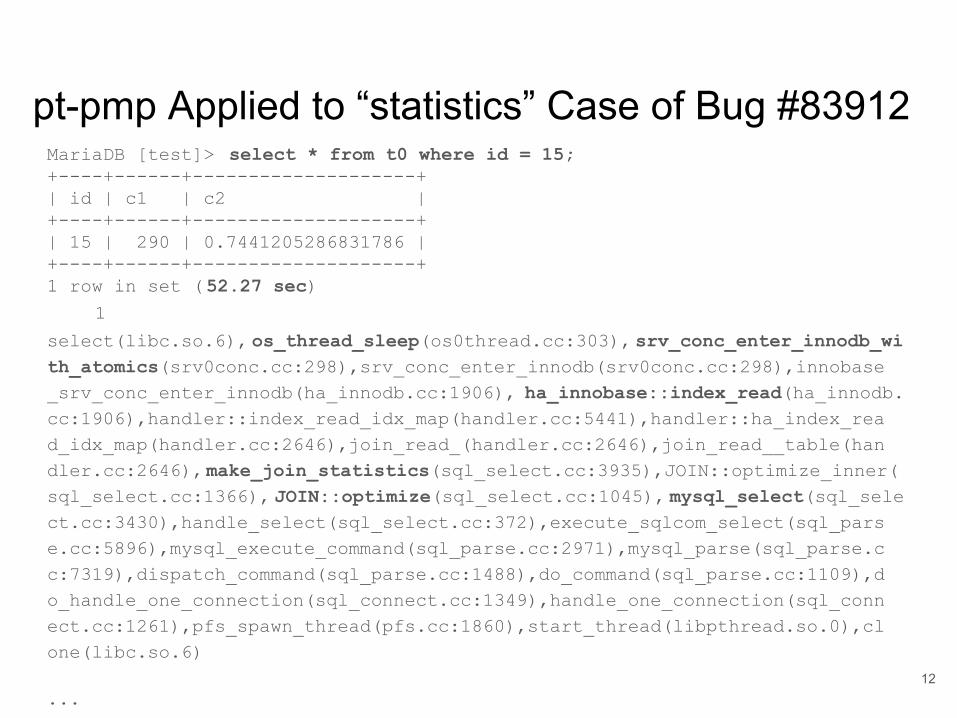
pt-pmp Applied to “statistics” Case of Bug #83912MariaDB [test]> select * from t0 where id = 15;+----+------+--------------------+| id | c1 | c2 |+----+------+--------------------+| 15 | 290 | 0.7441205286831786 |+----+------+--------------------+1 row in set (52.27 sec) 1
select(libc.so.6), os_thread_sleep(os0thread.cc:303), srv_conc_enter_innodb_with_atomics(srv0conc.cc:298),srv_conc_enter_innodb(srv0conc.cc:298),innobase_srv_conc_enter_innodb(ha_innodb.cc:1906), ha_innobase::index_read(ha_innodb.cc:1906),handler::index_read_idx_map(handler.cc:5441),handler::ha_index_read_idx_map(handler.cc:2646),join_read_(handler.cc:2646),join_read__table(handler.cc:2646),make_join_statistics(sql_select.cc:3935),JOIN::optimize_inner(sql_select.cc:1366), JOIN::optimize(sql_select.cc:1045), mysql_select(sql_select.cc:3430),handle_select(sql_select.cc:372),execute_sqlcom_select(sql_parse.cc:5896),mysql_execute_command(sql_parse.cc:2971),mysql_parse(sql_parse.cc:7319),dispatch_command(sql_parse.cc:1488),do_command(sql_parse.cc:1109),do_handle_one_connection(sql_connect.cc:1349),handle_one_connection(sql_connect.cc:1261),pfs_spawn_thread(pfs.cc:1860),start_thread(libpthread.so.0),clone(libc.so.6)
...12

www.percona.com
Is PMP Always Useful?[openxs@fc23 ~]$ pt-pmpFri Jan 27 10:53:28 EET 2017 10 __io_getevents_0_4(libaio.so.1),os_aio_linux_collect(os0file.cc:5432),os_aio_linux_handle(os0file.cc:5432),fil_aio_wait(fil0fil.cc:6231),io_handler_thread(srv0start.cc:546),start_thread(libpthread.so.0),clone(libc.so.6) 1 Type_handler_hybrid_field_type::cmp_type,Item_hybrid_func::cmp_type, Item_func_hybrid_field_type::val_int,Item_func_benchmark::val_int(item_func.cc:4482),Item::send(item.cc:6561),Protocol::send_result_set_row(protocol.cc:914),select_send::send_data(sql_class.cc:2830),JOIN::exec_inner(sql_select.cc:2589),JOIN::exec(sql_select.cc:2510),mysql_select(sql_select.cc:3444),handle_select(sql_select.cc:372),execute_sqlcom_select(sql_parse.cc:5896),mysql_execute_command(sql_parse.cc:2971),mysql_parse(sql_parse.cc:7319),dispatch_command(sql_parse.cc:1488),do_command(sql_parse.cc:1109),do_handle_one_connection(sql_connect.cc:1349),handle_one_connection(sql_connect.cc:1261),pfs_spawn_thread(pfs.cc:1860),start_thread(libpthread.so.0),clone(libc.so.6)... 1 select(libc.so.6),os_thread_sleep(os0thread.cc:303),srv_master_sleep(srv0srv.cc:3139),srv_master_thread(srv0srv.cc:3139),start_thread(libpthread.so.0),clone(libc.so.6)...
13
www.percona.com
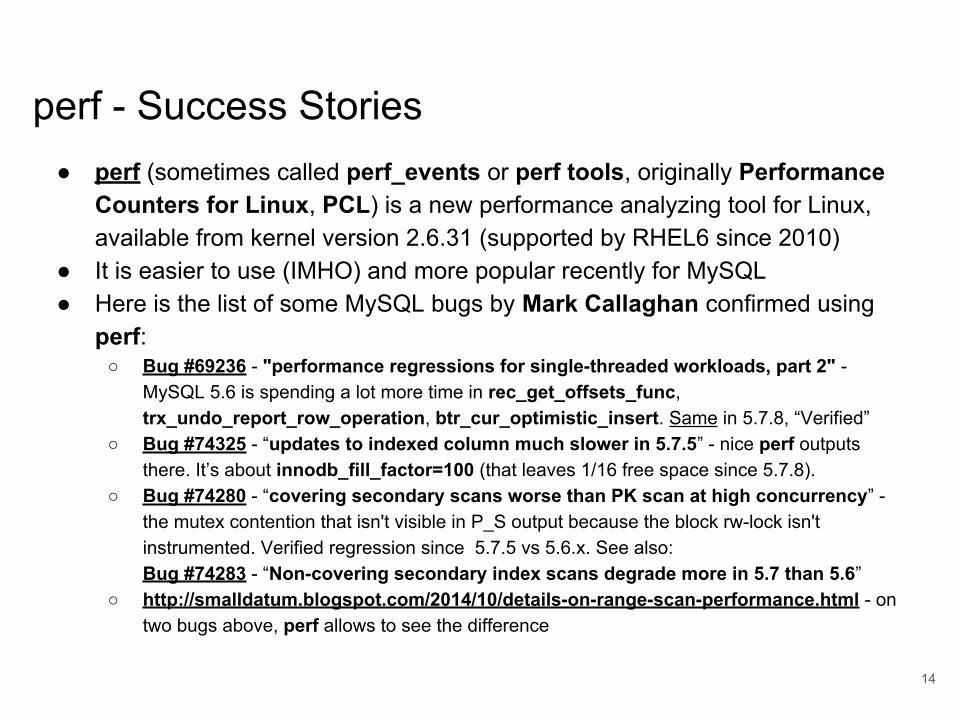
perf - Success Stories ● perf (sometimes called perf_events or perf tools, originally Performance
Counters for Linux, PCL) is a new performance analyzing tool for Linux, available from kernel version 2.6.31 (supported by RHEL6 since 2010)
● It is easier to use (IMHO) and more popular recently for MySQL● Here is the list of some MySQL bugs by Mark Callaghan confirmed using
perf:○ Bug #69236 - "performance regressions for single-threaded workloads, part 2" -
MySQL 5.6 is spending a lot more time in rec_get_offsets_func, trx_undo_report_row_operation, btr_cur_optimistic_insert. Same in 5.7.8, “Verified”
○ Bug #74325 - “updates to indexed column much slower in 5.7.5” - nice perf outputs there. It’s about innodb_fill_factor=100 (that leaves 1/16 free space since 5.7.8).
○ Bug #74280 - “covering secondary scans worse than PK scan at high concurrency” - the mutex contention that isn't visible in P_S output because the block rw-lock isn't instrumented. Verified regression since 5.7.5 vs 5.6.x. See also: Bug #74283 - “Non-covering secondary index scans degrade more in 5.7 than 5.6”
○ http://smalldatum.blogspot.com/2014/10/details-on-range-scan-performance.html - on two bugs above, perf allows to see the difference
14
www.percona.com
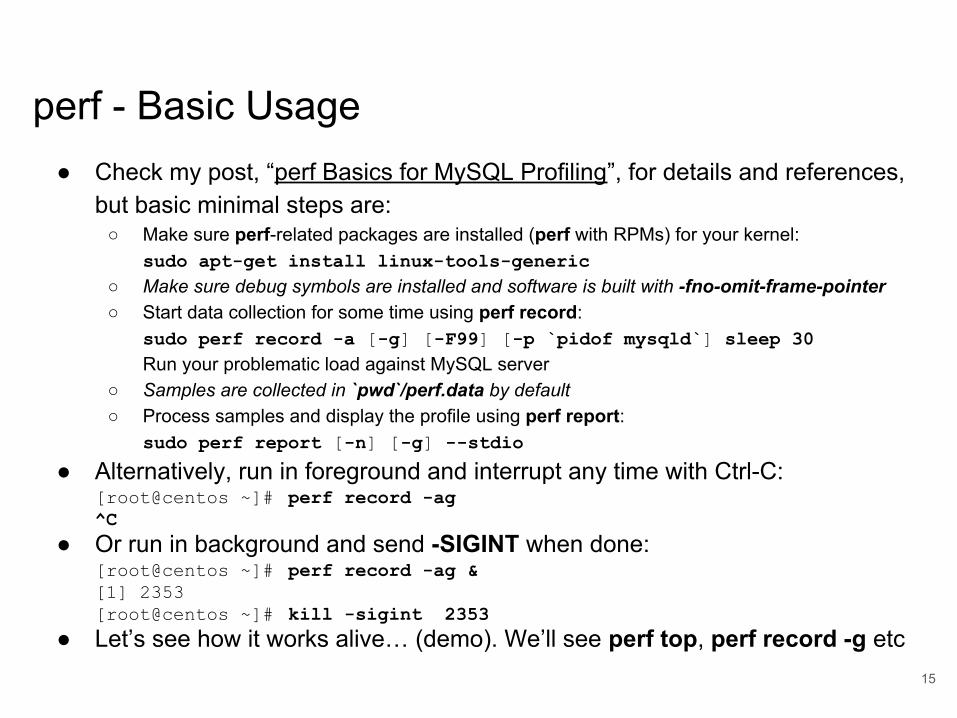
perf - Basic Usage● Check my post, “perf Basics for MySQL Profiling”, for details and references,
but basic minimal steps are:○ Make sure perf-related packages are installed (perf with RPMs) for your kernel:
sudo apt-get install linux-tools-generic○ Make sure debug symbols are installed and software is built with -fno-omit-frame-pointer ○ Start data collection for some time using perf record:
sudo perf record -a [-g] [-F99] [-p `pidof mysqld`] sleep 30Run your problematic load against MySQL server
○ Samples are collected in `pwd`/perf.data by default○ Process samples and display the profile using perf report:
sudo perf report [-n] [-g] --stdio
● Alternatively, run in foreground and interrupt any time with Ctrl-C:[root@centos ~]# perf record -ag^C
● Or run in background and send -SIGINT when done:[root@centos ~]# perf record -ag &[1] 2353[root@centos ~]# kill -sigint 2353
● Let’s see how it works alive… (demo). We’ll see perf top, perf record -g etc15

www.percona.com
perf - Call GraphsUse -g option of perf record to get call graphs/backtraces with perf, then:
openxs@ao756:~/dbs/maria10.1$ sudo perf report --stdio...
31.02% mysqld mysqld [.] Item_func_mul::int_op() | --- Item_func_mul::int_op() | |--94.56%-- Item_func_hybrid_field_type::val_int() | Item_func_benchmark::val_int() | Item::send(Protocol*, String*) | Protocol::send_result_set_row(List<Item>*) | select_send::send_data(List<Item>&) | JOIN::exec_inner() | JOIN::exec() | mysql_select(THD*, Item***, TABLE_LIST*, ... | handle_select(THD*, LEX*, select_result*, unsigned long) | execute_sqlcom_select(THD*, TABLE_LIST*) | mysql_execute_command(THD*) | mysql_parse(THD*, char*, unsigned int, Parser_state*) | dispatch_command(enum_server_command, THD*, char*, ...) | do_command(THD*)...
16

www.percona.com
On perf vs Oprofile● These days perf is, IMHO, better than oprofile/operf for MySQL profiling:
○ perf has a lot of features and requires less steps for basic usage
○ Call graphs are easier to get and more useful with perf
○ Classical oprofile (with daemon etc) has more severe impact on performance
○ In some environments operf just doesn’t work (while perf does):
[root@centos ~]# operf --versionYour kernel's Performance Events Subsystem does not support your processor type.Please use the opcontrol command instead of operf.
● Check the following blog post and discussion:○ “perf: the good, the bad, the ugly”, by Robert Haas
○ Oprofile vs Perf from [email protected]
● --collect-oprofile in pt-stalk may not work well for Galera (see lp:1152571)
● Time to add --collect-perf to pt-stalk!
● PMP is special (ease of use for specific tasks vs performance impact/hangs)17

www.percona.com
Studying Hanging in “statistics” Case(s)● See my blog post for details and full outputs:
| |--71.70%-- srv_conc_enter_innodb(trx_t*) | | ha_innobase::index_read(...) | | handler::index_read_idx_map(...) | | handler::ha_index_read_idx_map(...) | | join_read_const(st_join_table*) | | join_read_const_table(THD*, ...) | | make_join_statistics(JOIN*, ...) | | JOIN::optimize_inner() | | JOIN::optimize() | | mysql_select(THD*, ...) ...
● We can see that time to do SELECT is mostly spent waiting to enter InnoDB queue while reading data via index (dive) to get statistics for the optimizer
● We can also see what UPDATEs are doing at the moment (-g caller ?)● We can see where the time is spent by kernel and other processes (-a)
18

www.percona.com
Studying MyRocks Performance - Test Case● See my blog post “Profiling MyRocks with perf: Good Old Bug #68079
Use Case” for details● Essentially, why this query:
mysql> explain select count(*), category from task straight_join incident on task.sys_id=incident.sys_id group by incident.category;...| 1 | SIMPLE | task | index | PRIMARY | PRIMARY | 96
| NULL | 8292 | Using index; Using temporary; Using filesort || 1 | SIMPLE | incident | eq_ref | PRIMARY,incident_category | PRIMARY | 96
| test.task.sys_id | 1 | NULL |
runs faster (scales better?) than this one with MyRocks (unlike with InnoDB):
mysql> explain select count(*), category from task inner join incident on task.sys_id=incident.sys_id group by incident.category;... | 1 | SIMPLE | incident | index | PRIMARY,incident_category | incident_category | 123 | NULL | 8192 | Using index || 1 | SIMPLE | task | eq_ref | PRIMARY | PRIMARY
| 96 | test.incident.sys_id | 1 | Using index |
19

www.percona.com
Studying MyRocks Performance - Results● See my blog post “Profiling MyRocks...” for details
20

www.percona.com
Studying MyRocks Performance - Profiling...Top functions for STRAIGHT_JOIN:
5.32% ... __memcmp_sse4_14.68% ... __memcpy_ssse34.04% ... rocksdb::BlockIter::Seek3.33% ... my_strnxfrm_unicode3.11% ... rocksdb::BlockBasedTable::Get2.96% ... myrocks::Rdb_pk_comp..::Compare2.54% ... rocksdb::BlockIter::BinarySeek2.14% ... rocksdb::Int.KeyComp.::Compare2.00% ... rocksdb::Stat.Impl::recordTick1.99% ... rocksdb::MergingIterator::Next1.95% ... rocksdb::HistogramStat::Add1.51% ... join_read_key1.51% ... myrocks::rdb_unpack_utf8_str1.41% ... myrocks::Rdb_key_def::unp._rec.1.36% ... sub_select1.32% ... my_uni_utf81.29% ... rocksdb::Version::Get1.22% ... _int_malloc1.22% ... rocksdb::TableCache::Get1.22% ... rocksdb::BlockIter::Next
21
Top functions INNER JOIN:
5.90% ... __memcpy_ssse34.38% ... pthread_mutex_lock3.69% ... __memcmp_sse4_13.58% ... rocksdb::BlockIter::Seek2.53% ... pthread_mutex_unlock2.47% ... rocksdb::Stat.Impl::recordTick2.35% ... rocksdb::BlockBasedTable::Get2.28% ... my_strnxfrm_unicode2.08% ... rocksdb::BlockIter::BinarySeek1.84% ... rocksdb::HistogramStat::Add1.84% ... rocksdb::Version::Get1.71% ... myrocks::rdb_unpack._or_utf8_var.1.69% ... rocksdb::LRUCacheShard::Lookup1.67% ... my_uni_utf81.61% ... rocksdb::Int.KeyComp.::Compare1.52% ... myrocks::Rdb_pk_comp.::Compare1.47% ... rocksdb::.FilePicker::GetNextFile1.23% ... rocksdb::BlockIter::Next1.15% ... rocksdb::MergingIterator::Next1.10% ... join_read_key

www.percona.com
Some More on Performance Impact of Profiling● Check this doc. for the details of primitive single threaded test (Bug #39630)
22

www.percona.com
Thank you!Questions and Answers?
Please, report bugs at:
http://bugs.mysql.com
https://jira.mariadb.org
23