applying mw scale energy storage solutions for continuous
TRANSCRIPT

John Wood
Applying MW Scale Energy Storage Solutions for Continuous Variability Management

RETURN

Separator
PbPbO2
Lead-Acid Cell
+ -Separator
PbO2CarbonElectrode
Ultracapacitor
-+
UltraBattery® Technology
i i1i2+ -
i
UltraBattery Carbon Electrode
Pb

Market Size: $3.5B
Motive Battery
Market Size: $6B
Standby Battery
New Lead-Acid Market
PSOC UltraBattery
Market Size: $15B
Starter Battery
State of Charge
1881
0%
100%80%
20%
1960 1980 Today
The New Dimension in a Lead Acid World
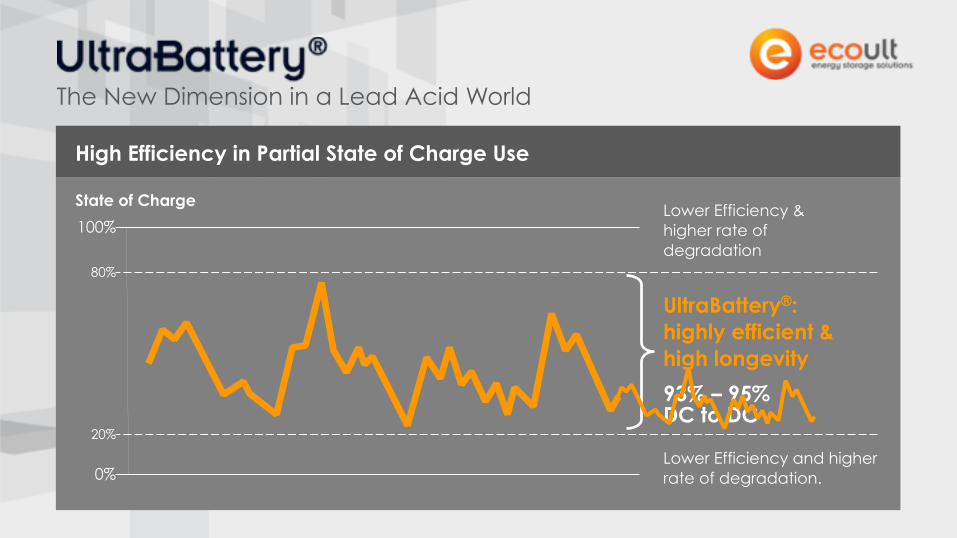
State of Charge
The New Dimension in a Lead Acid World
High Efficiency in Partial State of Charge Use
UltraBattery®: highly efficient & high longevity
Lower Efficiency & higher rate of degradation
Lower Efficiency and higher rate of degradation.
20%
80%
93% – 95% DC to DC
100%
0%


Wind Smoothing

Power Smoothing –Containerized VRLA UltraBattery Cells (2 x CUBS)
1MW DC Converter with Power Regulator
1MW Grid-Tied Inverter
BESSMaster
Controller
BES SYSTEM SUPPLIED BY EPM/ECOULT
660 kW WIND TURBINE
11 kV
Of Hampton Wind Farm Energy Storage System
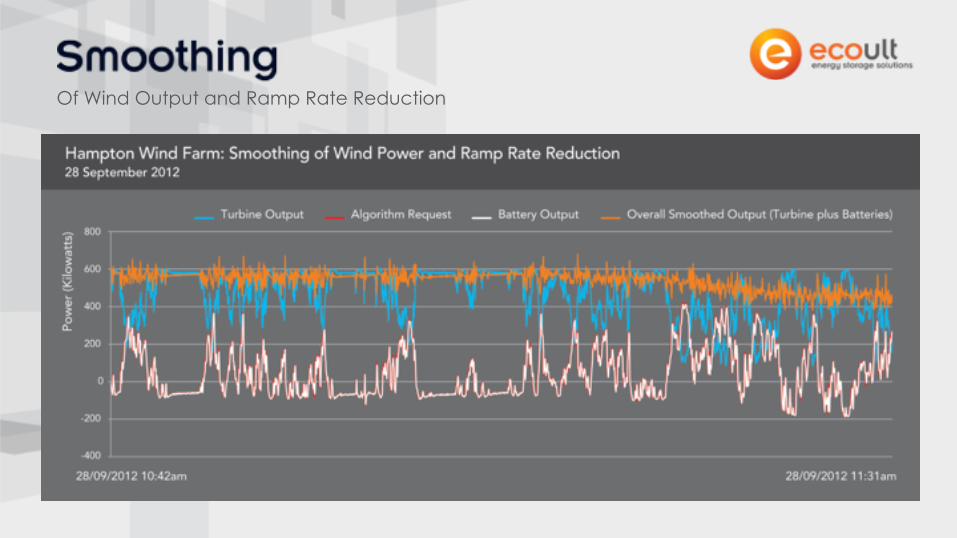
Of Wind Output and Ramp Rate Reduction

Solar Smoothing & Shifting/Firming

2 Clear Days & 1 Cloudy Day
4 Hour Window
15 Minute Window
PV Output
Battery Output
System Output
Cloudy Day

Clear DayBlue – PV Yellow – Battery Red – Primary Meter
Magnified
Cloudy Day - Altocumulus
Stored PV Energy
Firm PM Energy OutputFirm AM Output
Manual Shifting
Firm PM Energy Output
Automated Shifting Service Starts
Firmed PV - Clear Days Firmed PV - Cloudy Days with Simultaneous Smoothing
Refined Automated Shifting Service Starts
Stored PV Energy
PV Output
Battery Output
System Output


Typical Diesel Generator Efficiency Curve
Source: XXX

24 hours
Fuel Efficiency Curve
Load
24 hours
Fuel Efficiency Curve
Load
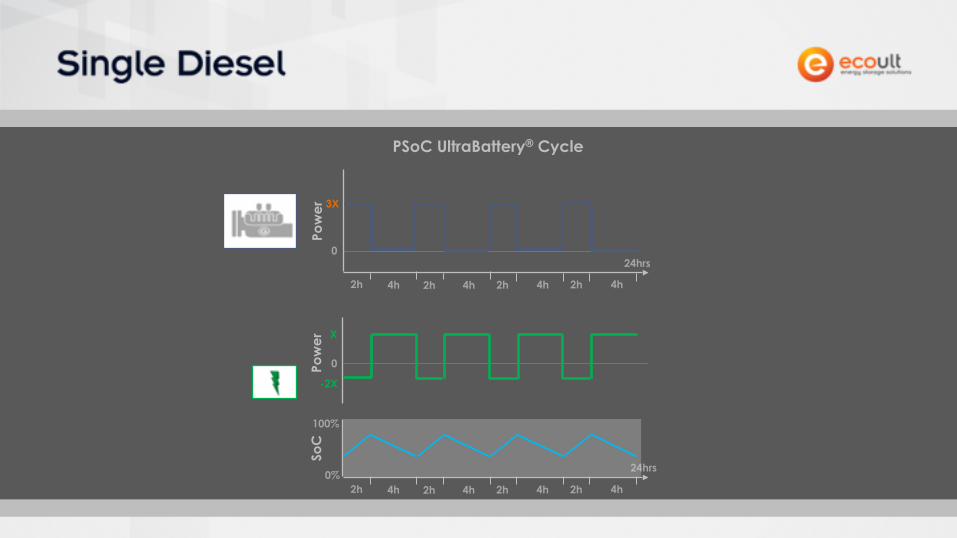
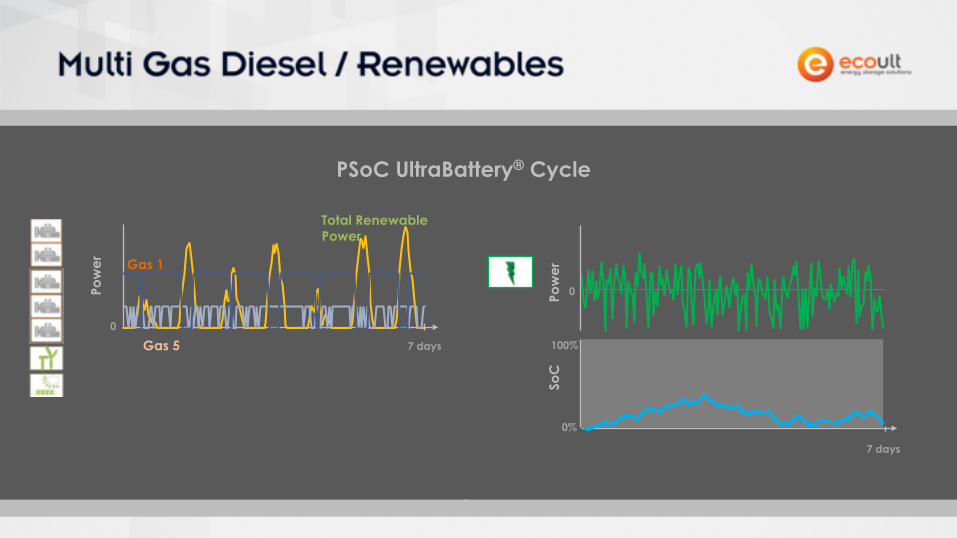
PSoC UltraBattery® Cycle
Pow
erPo
wer
0
3X
2h
24hrs
24hrs
0
X
-2X
SoC
4h 2h 4h 2h 4h 2h 4h
2h 4h 2h 4h 2h 4h 2h 4h0%
100%

24 hours
Fuel Efficiency Curve
LoadDiesel Efficiency – Using Diesel in the Efficient Band
Diesel Consumption
LCOE
CO2
PSoC Cycle
- 10% to - 50%
- 10% to – 30%
- 10% to - 50%
Diesel Longevity 2.0X
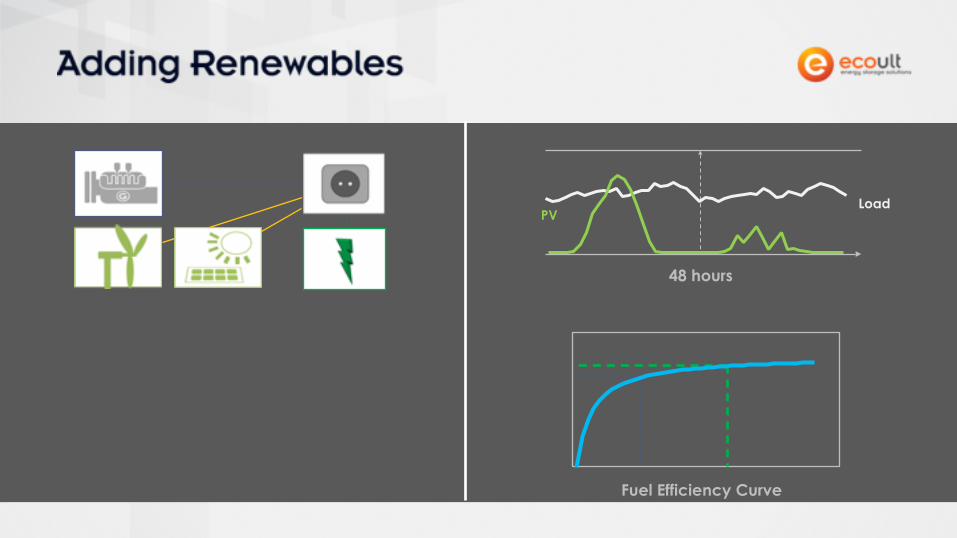
48 hours
Fuel Efficiency Curve
PVLoad

48 hours
Fuel Efficiency Curve
PVLoadPo
wer
Pow
er
048hrs
0
SoC
DieselPV
24hrs
48hrs24hrs
PSoC UltraBattery® Cycle
0%
100%

Fuel Efficiency Curve
48 hours
VRLA Cycle PSoC CyclePV
Load
Match Renewable Power
Diesel Consumption
LCOE
CO2
- 50%+
- 30%
- 50%+
Manage Renewable Variability
Diesel Longevity 2.5X
Battery Replacement 2.5X
PSoC Cycle
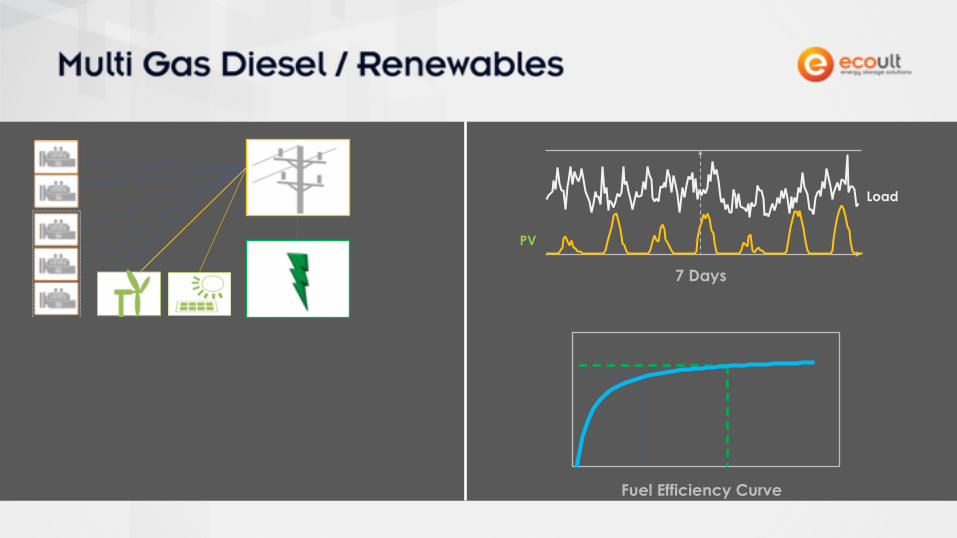
7 Days
Fuel Efficiency Curve
PV
Load
7 Days
Fuel Efficiency Curve
PV
Load
Pow
er
Pow
er
0
7 days
0
SoC
PSoC UltraBattery® Cycle
7 days
Gas 1
Gas 5
Total Renewable Power
0%
100%

7 Days
Fuel Efficiency Curve
PV
LoadDiesel Efficiency – Using Diesel in the Efficient Band
Diesel Consumption
LCOE
CO2
- 20%+
- 5% to – 25%
- 20%+
PSoC Cycle

Frequency Regulation
VAR Correction
Spinning Reserve

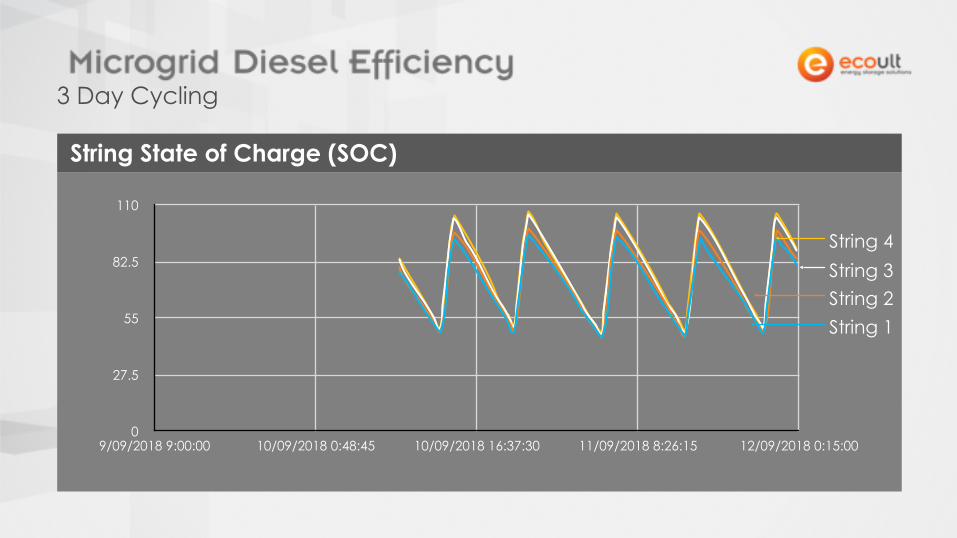
0
27.5
55
82.5
110
9/09/2018 9:00:00 10/09/2018 0:48:45 10/09/2018 16:37:30 11/09/2018 8:26:15 12/09/2018 0:15:00
String 1
3 Day Cycling
String State of Charge (SOC)
String 2String 3String 4

45
48
51
54
57
9/09/2018 9:00:00 10/09/2018 0:48:45 10/09/2018 16:37:30 11/09/2018 8:26:15 12/09/2018 0:15:00
String 1, 2, 3, 4 Voltage
3 Day Cycling
String Voltage

-50
-37.5
-25
-12.5
0
12.5
9/09/2018 9:00:00 10/09/2018 0:48:45 10/09/2018 16:37:30 11/09/2018 8:26:15 12/09/2018 0:15:00
String 1
3 Day Cycling
String Current
String 2
String 3
String 4

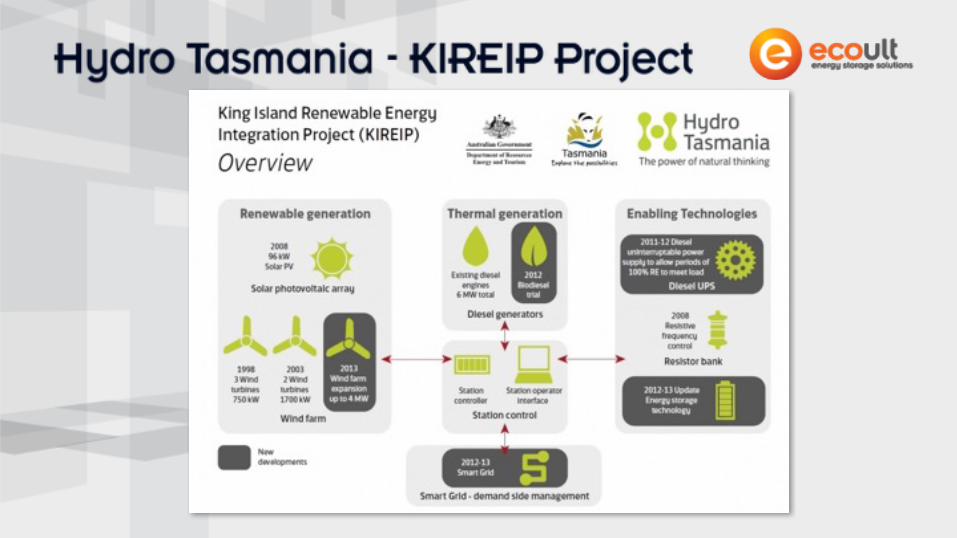
Renewables Integration and Diesel Reduction
Hydro Tasmania – King Island Renewable Integration Project (KIREIP)


Regulation Services
* The project is supported by funding from the U.S. Department of Energy under the Smart Grid Storage Demonstration Program.RETURN
Pow
er (M
W)
Neg
ativ
e fo
r Cha
rge
& P
ositi
ve fo
r Disc
harg
e
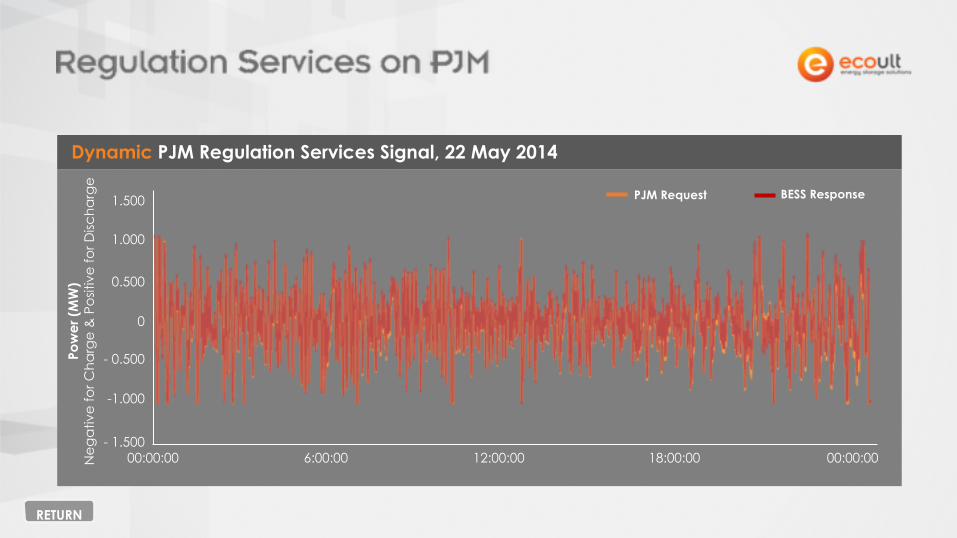
00:00:00 6:00:00 12:00:00 18:00:00 00:00:00
1.500
1.000
0.500
0
- 0.500
-1.000
- 1.500
Dynamic PJM Regulation Services Signal, 22 May 2014
BESS ResponsePJM Request
RETURN

Dynamic Regulation
Traditional Regulation 141.7
MW
Daily Mileage
434.3MW
Daily Mileage
3.1Mileage Ratio
1.0Mileage Ratio
RETURN

00
$ 30,000.00
$ 60,000.00
$ 90,000.00
$ 120,000.00
Jul-16 Sept-16 Nov-16 Jan-17 Mar-17 May-17 Jul-17 Sept-17 Nov-17 Jan-18 Mar-18
Regulation Market Performance Clearing Price (RMPCP)
Regulation Market Capability Clearing Price (RMCCP)
Revenue of 1MW Regulation Plant Operated Continuously With 100% PJM Performance Score
PJM introduces performance payments
PJM introduces performance mileage modifier
RETURN


E FE F
on FloatConventional Battery in Partial State
of Charge
Battery
Reserve Event Reserve Event

Storage Facility #1:
3MWFrequency Regulation
2x Power
Regulation Services
RETURN
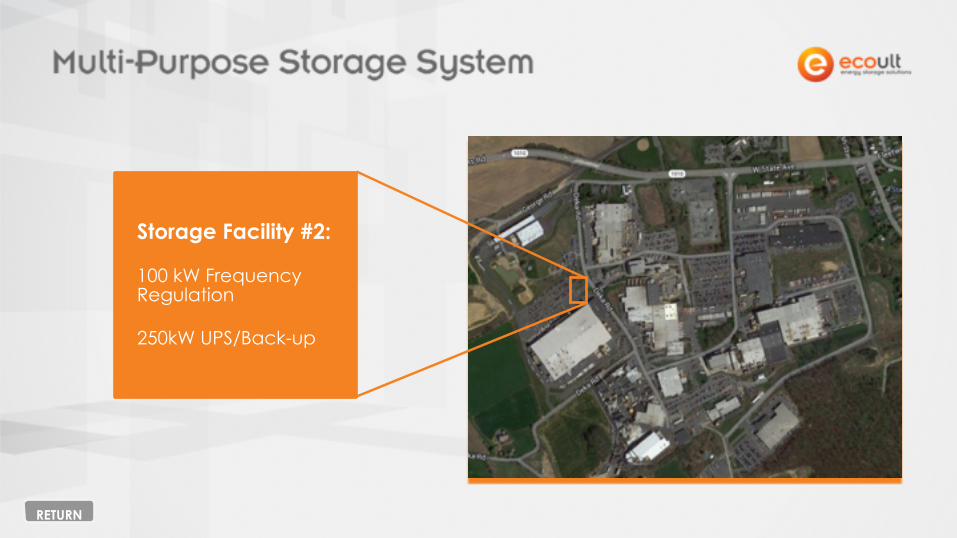
Storage Facility #2:
100 kW Frequency Regulation
250kW UPS/Back-up
RETURN
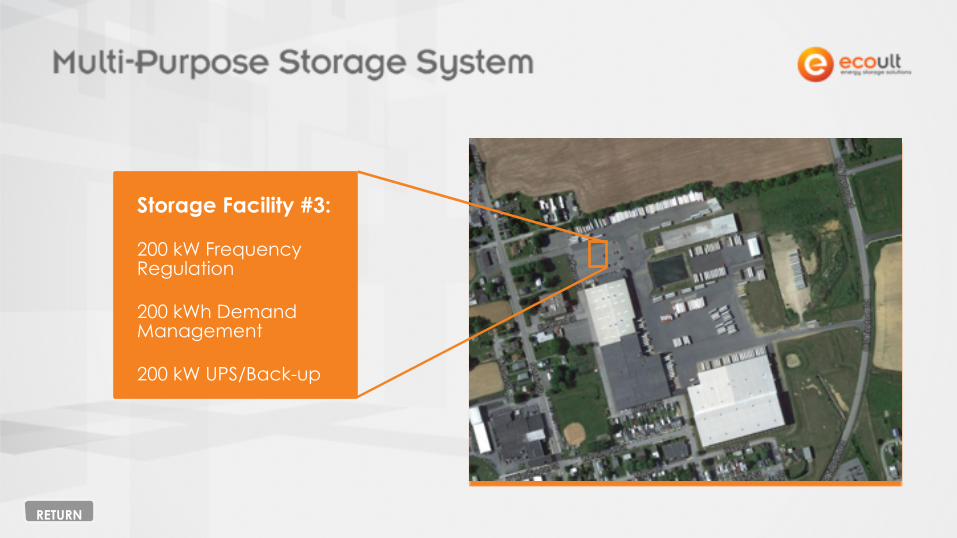
Storage Facility #3:
200 kW Frequency Regulation
200 kWh Demand Management
200 kW UPS/Back-up
RETURN
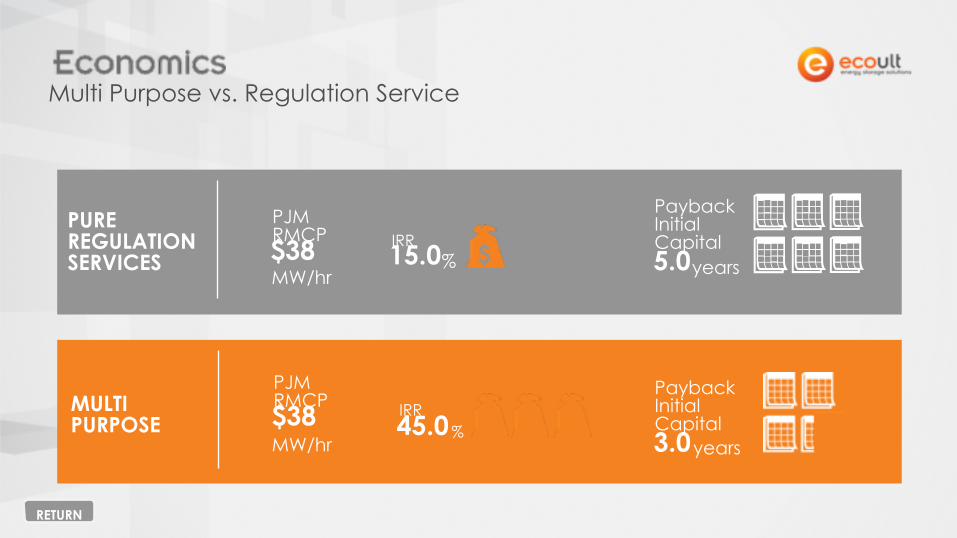
PURE REGULATION SERVICES
MULTI PURPOSE $ $ $
PJM RMCP$38MW/hr
PJM RMCP$38MW/hr
15.0%IRR
45.0%IRR
Multi Purpose vs. Regulation Service
$
Payback Initial Capital5.0years
Payback Initial Capital3.0years
RETURN

MULTI PURPOSE
Marginal cost to increase size of battery store + slightly larger footprint2IRR based on marginal cost of UltraBatteries and additional space required3
1 Infrastructure and connection costs in place
RETURN

Partners
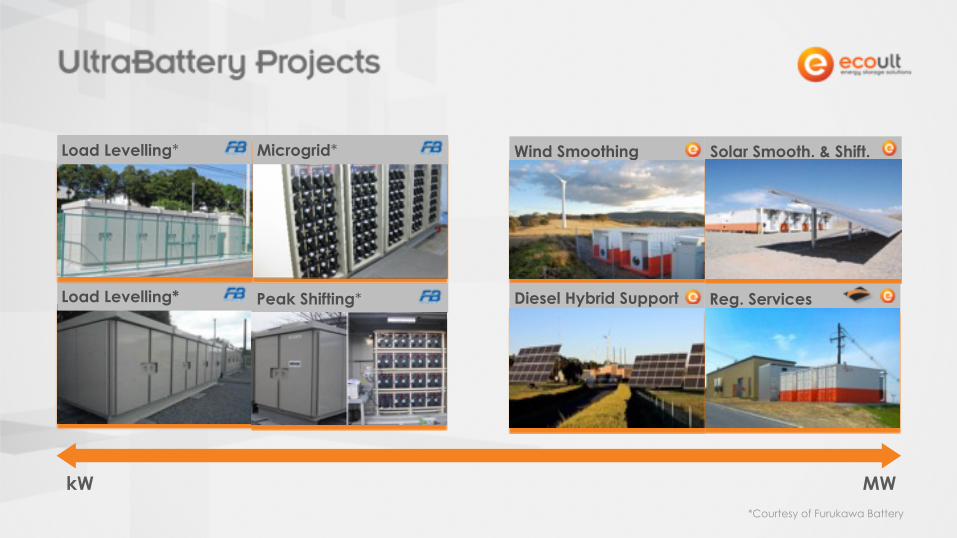
Load Levelling*
Load Levelling*
Peak Shifting*
Wind Smoothing Solar Smooth. & Shift.
Diesel Hybrid Support Reg. Services
MWkW
Microgrid*
*Courtesy of Furukawa Battery

MWkWIndoor
Outdoor

John Wood, CEOwww.ecoult.com www.ultrabattery.com

John Wood
Applying MW Scale Energy Storage Solutions for Continuous Variability Management