applied multivariate analysis - vaasan...
TRANSCRIPT

Applied Multivariate Analysis
Seppo Pynnonen
Department of Mathematics and Statistics, University of Vaasa, Finland
Spring 2017
Seppo Pynnonen Applied Multivariate Analysis
Cluster analysis
Cluster Analysis
Seppo Pynnonen Applied Multivariate Analysis
Cluster analysis
Background
1 Cluster analysis
Background
Distance data
Hierarchical clustering
Seppo Pynnonen Applied Multivariate Analysis
Cluster analysis
Background
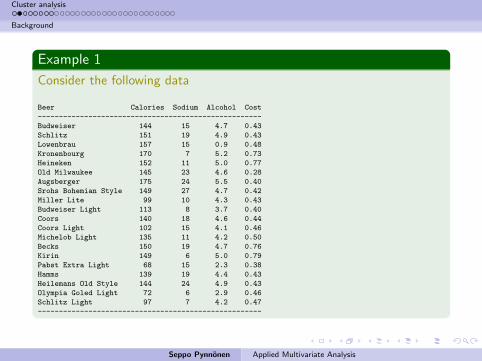
Example 1
Consider the following data
Beer Calories Sodium Alcohol Cost
-----------------------------------------------------
Budweiser 144 15 4.7 0.43
Schlitz 151 19 4.9 0.43
Lowenbrau 157 15 0.9 0.48
Kronenbourg 170 7 5.2 0.73
Heineken 152 11 5.0 0.77
Old Milwaukee 145 23 4.6 0.28
Augsberger 175 24 5.5 0.40
Srohs Bohemian Style 149 27 4.7 0.42
Miller Lite 99 10 4.3 0.43
Budweiser Light 113 8 3.7 0.40
Coors 140 18 4.6 0.44
Coors Light 102 15 4.1 0.46
Michelob Light 135 11 4.2 0.50
Becks 150 19 4.7 0.76
Kirin 149 6 5.0 0.79
Pabst Extra Light 68 15 2.3 0.38
Hamms 139 19 4.4 0.43
Heilemans Old Style 144 24 4.9 0.43
Olympia Goled Light 72 6 2.9 0.46
Schlitz Light 97 7 4.2 0.47
-----------------------------------------------------
Seppo Pynnonen Applied Multivariate Analysis
Cluster analysis
Background
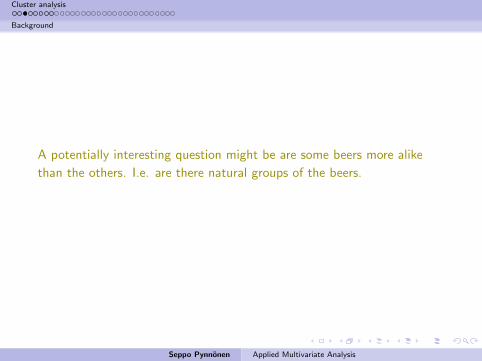
A potentially interesting question might be are some beers more alike
than the others. I.e. are there natural groups of the beers.
Seppo Pynnonen Applied Multivariate Analysis
Cluster analysis
Background
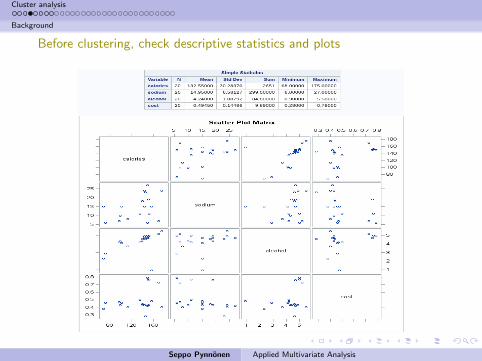
Before clustering, check descriptive statistics and plots
Seppo Pynnonen Applied Multivariate Analysis
Cluster analysis
Background
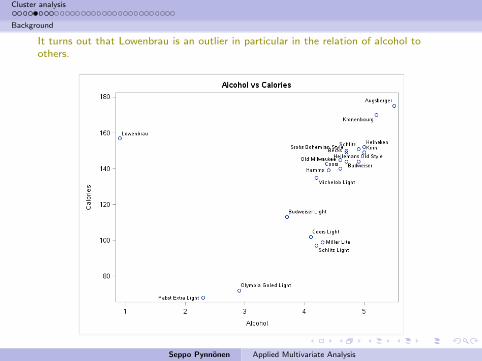
It turns out that Lowenbrau is an outlier in particular in the relation of alcohol toothers.
Seppo Pynnonen Applied Multivariate Analysis
Cluster analysis
Background
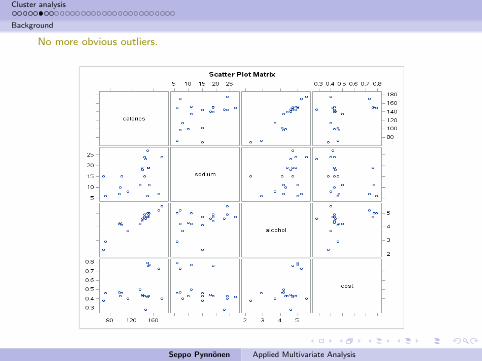
No more obvious outliers.
Seppo Pynnonen Applied Multivariate Analysis
Cluster analysis
Background
Problem problem: Group sample units into homogeneoussub-groups on the basis of a given data set.
Synonyms:
clustering
morphometrics
pattern regognition
classification
taxonomy
Seppo Pynnonen Applied Multivariate Analysis
Cluster analysis
Background
The main difference to discriminant analysis is that in classificationanalysis the number of groups is not known in advance.
Data:
1 Observations on variables xi1, . . . , xip,i = 1, . . . , n.
2 n × n distance matrix, which describes how apart from eachother the observations are.
Seppo Pynnonen Applied Multivariate Analysis
Cluster analysis
Distance data
1 Cluster analysis
Background
Distance data
Hierarchical clustering
Seppo Pynnonen Applied Multivariate Analysis
Cluster analysis
Distance data
Dissimilarity:
Let xi = (xi1, . . . , xip)′ denote observations on the variables forsample unit i . Dissimilarity between sample units i and j aremeasured by a suitable distance measure
dij = d(xi , xj), (1)
that has the following properties
1 d(x, y) ≥ 0
2 d(x, y) = 0⇔ x = y
3 d(x, y) = d(y, x)
4 d(x, y) ≤ d(x, z) + d(y, z)
Seppo Pynnonen Applied Multivariate Analysis
Cluster analysis
Distance data
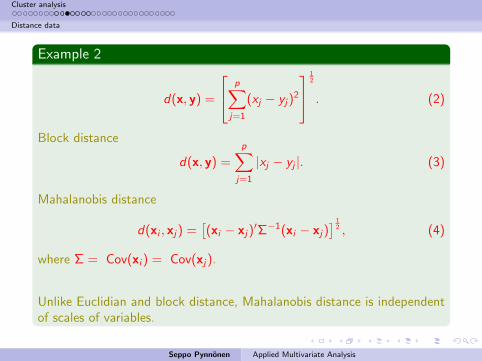
Example 2
d(x, y) =
p∑j=1
(xj − yj)2
12
. (2)
Block distance
d(x, y) =
p∑j=1
|xj − yj |. (3)
Mahalanobis distance
d(xi , xj) =[(xi − xj)
′Σ−1(xi − xj)] 1
2 , (4)
where Σ = Cov(xi ) = Cov(xj).
Unlike Euclidian and block distance, Mahalanobis distance is independentof scales of variables.
Seppo Pynnonen Applied Multivariate Analysis
Cluster analysis
Distance data
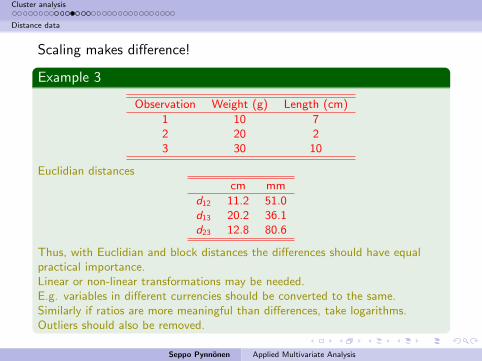
Scaling makes difference!
Example 3
Observation Weight (g) Length (cm)
1 10 72 20 23 30 10
Euclidian distancescm mm
d12 11.2 51.0d13 20.2 36.1d23 12.8 80.6
Thus, with Euclidian and block distances the differences should have equalpractical importance.Linear or non-linear transformations may be needed.E.g. variables in different currencies should be converted to the same.Similarly if ratios are more meaningful than differences, take logarithms.Outliers should also be removed.
Seppo Pynnonen Applied Multivariate Analysis
Cluster analysis
Distance data
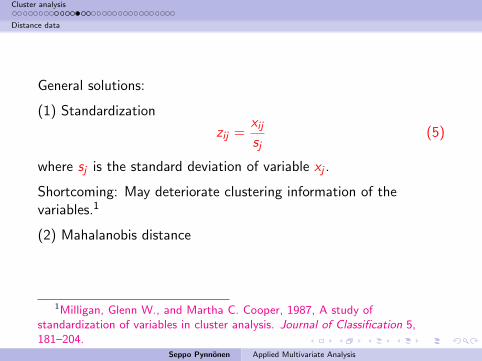
General solutions:
(1) Standardization
zij =xijsj
(5)
where sj is the standard deviation of variable xj .
Shortcoming: May deteriorate clustering information of thevariables.1
(2) Mahalanobis distance
1Milligan, Glenn W., and Martha C. Cooper, 1987, A study ofstandardization of variables in cluster analysis. Journal of Classification 5,181–204.
Seppo Pynnonen Applied Multivariate Analysis
Cluster analysis
Distance data
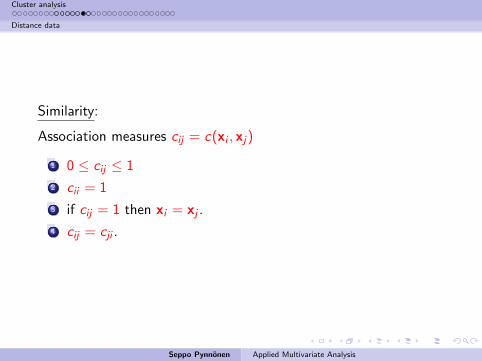
Similarity:
Association measures cij = c(xi , xj)
1 0 ≤ cij ≤ 1
2 cii = 1
3 if cij = 1 then xi = xj .
4 cij = cji .
Seppo Pynnonen Applied Multivariate Analysis
Cluster analysis
Distance data
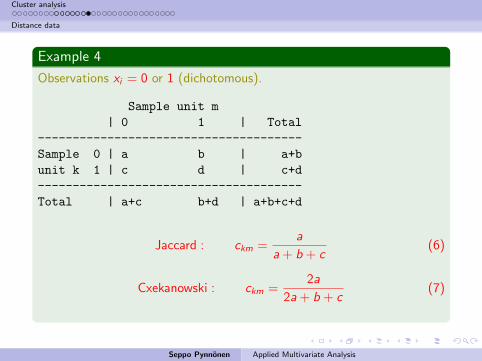
Example 4
Observations xi = 0 or 1 (dichotomous).
Sample unit m
| 0 1 | Total
--------------------------------------
Sample 0 | a b | a+b
unit k 1 | c d | c+d
--------------------------------------
Total | a+c b+d | a+b+c+d
Jaccard : ckm =a
a + b + c(6)
Cxekanowski : ckm =2a
2a + b + c(7)
Seppo Pynnonen Applied Multivariate Analysis
Cluster analysis
Hierarchical clustering
1 Cluster analysis
Background
Distance data
Hierarchical clustering
Seppo Pynnonen Applied Multivariate Analysis
Cluster analysis
Hierarchical clustering
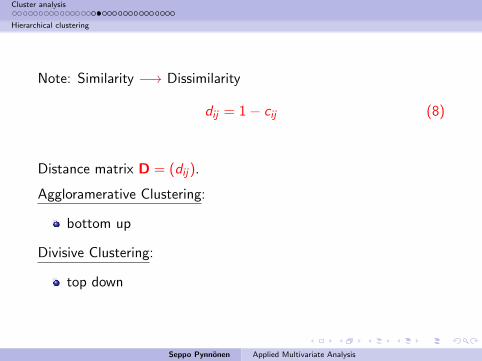
Note: Similarity −→ Dissimilarity
dij = 1− cij (8)
Distance matrix D = (dij).
Aggloramerative Clustering:
bottom up
Divisive Clustering:
top down
Seppo Pynnonen Applied Multivariate Analysis
Cluster analysis
Hierarchical clustering
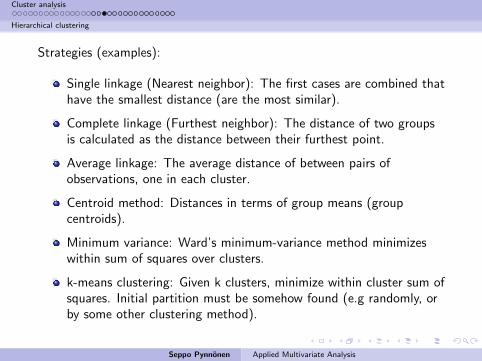
Strategies (examples):
Single linkage (Nearest neighbor): The first cases are combined thathave the smallest distance (are the most similar).
Complete linkage (Furthest neighbor): The distance of two groupsis calculated as the distance between their furthest point.
Average linkage: The average distance of between pairs ofobservations, one in each cluster.
Centroid method: Distances in terms of group means (groupcentroids).
Minimum variance: Ward’s minimum-variance method minimizeswithin sum of squares over clusters.
k-means clustering: Given k clusters, minimize within cluster sum ofsquares. Initial partition must be somehow found (e.g randomly, orby some other clustering method).
Seppo Pynnonen Applied Multivariate Analysis
Cluster analysis
Hierarchical clustering
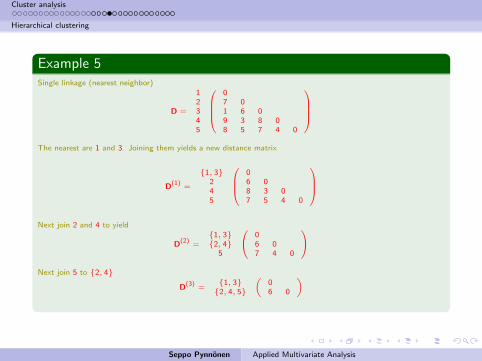
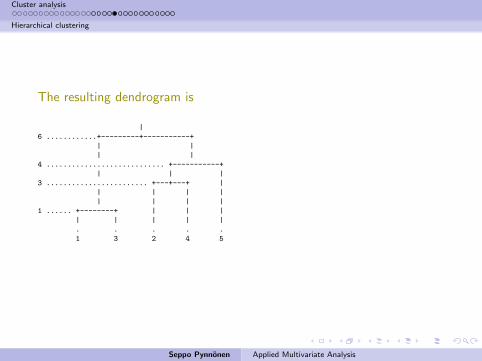
Example 5Single linkage (nearest neighbor)
D =
12345
07 01 6 09 3 8 08 5 7 4 0
The nearest are 1 and 3. Joining them yields a new distance matrix
D(1) =
{1, 3}245
06 08 3 07 5 4 0
Next join 2 and 4 to yield
D(2) ={1, 3}{2, 4}
5
06 07 4 0
Next join 5 to {2, 4}
D(3) ={1, 3}
{2, 4, 5}
(06 0
)
Seppo Pynnonen Applied Multivariate Analysis
Cluster analysis
Hierarchical clustering
The resulting dendrogram is
|
6 ............+---------+-----------+
| |
| |
4 ............................ +-----------+
| | |
3 ........................ +---+---+ |
| | | |
| | | |
1 ...... +--------+ | | |
| | | | |
. . . . .
1 3 2 4 5
Seppo Pynnonen Applied Multivariate Analysis
Cluster analysis
Hierarchical clustering
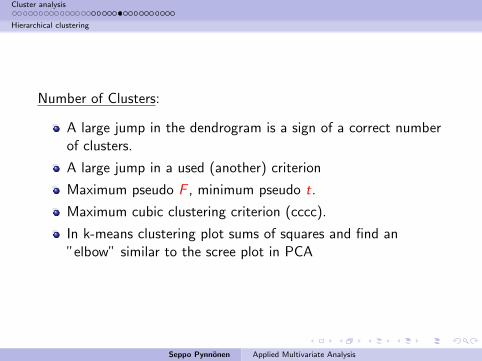
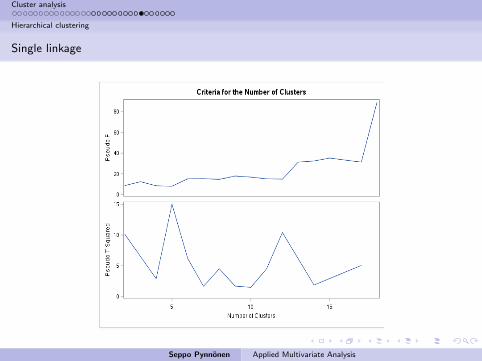
Number of Clusters:
A large jump in the dendrogram is a sign of a correct numberof clusters.
A large jump in a used (another) criterion
Maximum pseudo F , minimum pseudo t.
Maximum cubic clustering criterion (cccc).
In k-means clustering plot sums of squares and find an”elbow” similar to the scree plot in PCA
Seppo Pynnonen Applied Multivariate Analysis
Cluster analysis
Hierarchical clustering
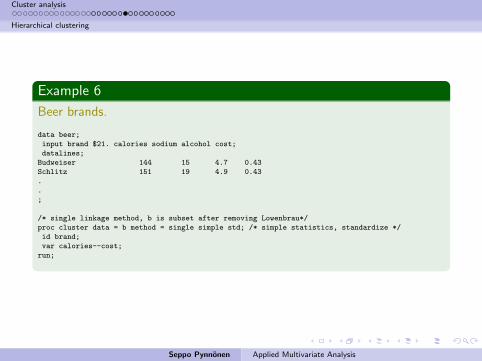
Example 6
Beer brands.
data beer;
input brand $21. calories sodium alcohol cost;
datalines;
Budweiser 144 15 4.7 0.43
Schlitz 151 19 4.9 0.43
.
.
;
/* single linkage method, b is subset after removing Lowenbrau*/
proc cluster data = b method = single simple std; /* simple statistics, standardize */
id brand;
var calories--cost;
run;
Seppo Pynnonen Applied Multivariate Analysis
Cluster analysis
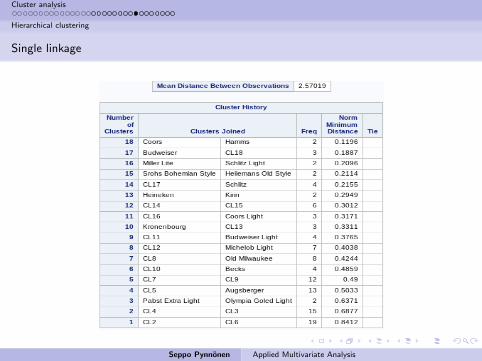
Hierarchical clustering
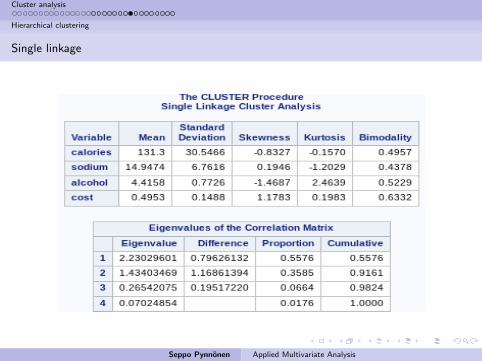
Single linkage
Seppo Pynnonen Applied Multivariate Analysis
Cluster analysis
Hierarchical clustering
Single linkage
Seppo Pynnonen Applied Multivariate Analysis
Cluster analysis
Hierarchical clustering
Single linkage
Seppo Pynnonen Applied Multivariate Analysis
Cluster analysis
Hierarchical clustering
Single linkage
Seppo Pynnonen Applied Multivariate Analysis
Cluster analysis
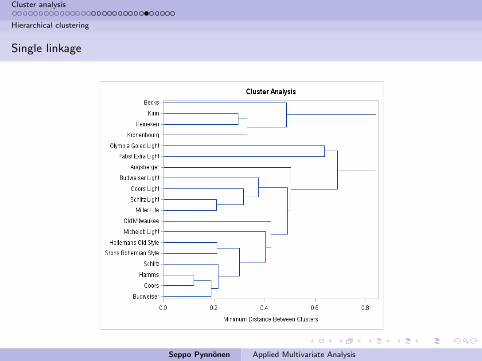
Hierarchical clustering
Single linkage
No obvious break biggest jump after joining Becks, Kirin, Heineken, andKronenburg to the rest.
Psudo t drops at 4 clusters and is lowest at 7, 9, and 10.
Pseudo F does not seem to work.
Thus, on the basis of this the beers cluster to American and Europeanbrands.
Within the Americans a distinction seems to be between lite and the
others (Michelob differs from this picture).
Seppo Pynnonen Applied Multivariate Analysis
Cluster analysis
Hierarchical clustering
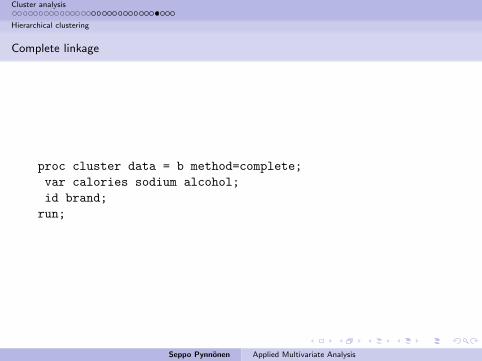
Complete linkage
proc cluster data = b method=complete;
var calories sodium alcohol;
id brand;
run;
Seppo Pynnonen Applied Multivariate Analysis
Cluster analysis
Hierarchical clustering
Complete linkage
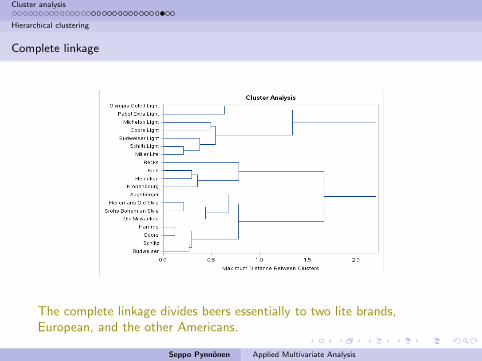
The complete linkage divides beers essentially to two lite brands,European, and the other Americans.
Seppo Pynnonen Applied Multivariate Analysis
Cluster analysis
Hierarchical clustering
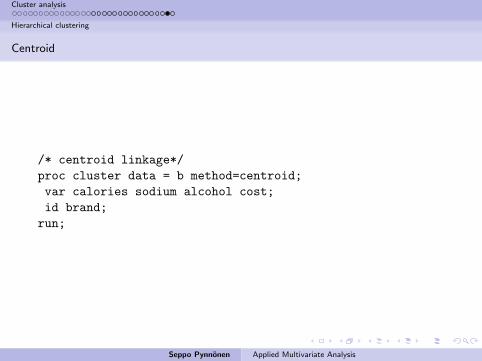
Centroid
/* centroid linkage*/
proc cluster data = b method=centroid;
var calories sodium alcohol cost;
id brand;
run;
Seppo Pynnonen Applied Multivariate Analysis
Cluster analysis
Hierarchical clustering
Centroid
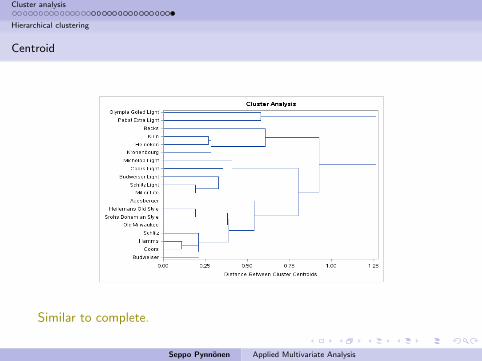
Similar to complete.
Seppo Pynnonen Applied Multivariate Analysis