application of simplified layered systems to pavement...
TRANSCRIPT

Transportation Research Record 1022
After Construction. Proc., First International Conference on the Structural Oesign of Asphalt Pavements, Ann Arbor, Mich., 1975.
5. W.R. Barker and W.N. Brabston. Development of a Structural Design Procedure for Flexible Airport Pavements. Report FAA-RD-74-199. Federal Aviation Administration, U.S. Department of Transportation, 1975.
6, J,W. Hall, Jr. Comparative Study of Nondestructive Pavement Testing--MacDill Air Force Base. U.S. Air Force Engineering and Services Center, Tyndall AFB, Florida, 1984.
7. J.W. Hall, Jr. Flexible Airfield Pavement Evalu-
ation. TM 5-827-2/AFM 88-24, Chapter 2. u.s. Air Force, Washington, D.c., April 1981.
8. w. Uddin, A.H. Meyer, W.R. Hudson, and K.H. Stokoe II. Project-Level Structural Evaluation for Pavements Based on Dynamic Deflections. !.!2. Transportation Research Record 1007, TRB, National Research Council, Washington, n.c., 1985, pp. 37-45.
Publication of the paper sponsored by Committee on Mechanics of Earth Masses and Layered Systems.
Application of Simplified Layered Systems to
NDT Pavement Evaluation
GDALYAH WISEMAN, JACOB GREENSTEIN, and JACOB UZAN
ABSTRACT
Presented are nondestructive testing (NDT) deflection measurements on flexible, rigid, and composite pavements obtained with two vibratory devices, the Pavement Profiler and the WES 16-kip vibrator, and one impulse loading device, the falling weight deflectometer (FWD) • The deflection bowls are analyzed in terms of the elastic parameters of layers using the Hogg, the Burmister, and the Odemark-Ullidtz approximation to linear layered elastic system models. The results are compared with those obtained using more exact solutions and are found to be satisfactory. The evaluated elastic parameters were found to he similar for all three NDT devices for the subgrade and the surface layers of the pavement. Lower elastic moduli were found for the base course with deflection howls produced by the FWD than for those produced by the other two vibratory devices. Most pavement evaluation is done on pavements that have been in service for many years and have a varied history of maintenance and overlaying. The resulting lack of homogeneity must be considered in developing a strategy for meaningful pavement evaluation, It is therefore necessary to examine a large number of test points. The use of simplified layered system models for NDT pavement evaluation is, therefore, recommended. This makes it economically feasible to analyze each test point with respect to the relative contribution of the strength of the subgrade and the condition of the pavement structure to the overall performance of the pavement. It is also possible to examine material variability for each of the layers. Results of such computations given in this paper show higher variability in the asphaltic concrete and the hase course layers than in the concrete or the subgrade.
Pavement evaluation is most frequently done on pavements that have been in service for many years and have a varied history of maintenance and overlaying. The resulting lack of homogeneity must be considered in developing a strategy for meaningful pavement evaluation. A large number of test points are therefore mandatory, so that the responsible engineer can make intelligent decisions with due regard to the statistical nature of the problems of pavement evaluation and rehabilitation.
Nondestructive testing (NDT) and deflection mea-
surements are now universally recognized methods for the structural evaluation of road and airfield pavements. In many cases use is still made of empirical correlations between deflection under a test load and pavement performance, There is, however, general recognition that the maximum benefit is derived from NDT deflection measurements if the deflection bowl is interpreted in terms of the material parameters of the various component layers of pavement structure and subgrade.
The results of NDT deflection measurements on

30
flexible, rigid, and comp9site pavements obtained with both impulse and vibratory loading are presented here. The deflection bowls are analyzed in terms of the elastic parameters of layers using simplified approximations of the more exact linear layered elastic models. The results are compared with those obtained using the more exact solutions. The deflection bowls for the various pavements were measured with three different NOT devices and the computed moduli are compared and examined for var iabili ty;
Variability in deflection measurements has been extensively documented in the technical literature. Here an attempt is made to examine the variability in the evaluated moduli of elastic layers on the basis of measured deflections.
The use of simplified layered system models for NOT pavement evaluation makes it feasible to analyze each test point with respect to the relative contribution of the strength of the subgrade and the condition of the pavement structure to the overall performance of the pavement.
TESTING PROGRAM
The pavements tested were two rig id pavements 10. 5 in. and 20 in. thick, two flexible pavements, and one composite pavement at MacDill Air Force Base in Tampa, Florida. The pavement elevations were from 5 to 10 ft above sea level and the water table was about 4 ft below ground surface. The subqrade soils were poorly graded sand with in situ California bearing ratio (CBR) values that ranged from 10 to 45. The two flexible pavements had base courses of Florida limerock with less than 30 percent retained on the No. 4 sieve, which classifies as a silty sand. This material is nonplastic but quite sensitive to moisture. It is customarily assigned a CBR of 80. The concrete pavements were placed directly on the poorly graded sand subgrade. The pavements tested were in five different areas and are numbered 1 to 5. Pavement types and thicknesses for each test area are shown in Figure 1.
Three different NDT devices were used. They are well known and will be only briefly described:
• A model 2000 Pavement Profiler (PP) applying a peak-to-peak force of 4, 500 lb at a frequency of 25 Hz on an 18-in.-diameter plate.
• The Waterways Experiment Station (WES) 16-kip vibrator applying a peak-to-peak force of 29,200 lb at a frequency of 15 Hz on an 18-in.-diameter plate.
• A falling weight deflectometer (FWD) applying a peak impulse force of 14,200 lb on a 12-in.-diameter plate.
Testing with the 16-kip vibrator and the FWD was performed by WES and the field test records were made available.
Overall structural condition of pavement is sometimes described by the dynamic load required to produce a unit deflection and is termed stiffness. In the case of the Pavement Profiler and the 16-kip vibrator, stiffness is the peak-to-peak vibratory force (P) on an 18-in.-diameter plate divided by the peak-to-peak displacement of the pavement at the center of load application (~ 0). In the case of the falling we°ight deflectometer, stiffness is the transient peak impulse force on a 12-in.-diameter plate divided by the maximum transient deflection at the center of load application.
The average pavement stiffness for each of the three NDT devices for all five test areas is shown in Figure 1. The lower pavement stiffness for FWD test results on the flexible pavements in Test Areas 2 and 3 is possibly due in part to the smaller diam-
Transportation Research Record 1022
TEST
AREA THICK .
(IN)
EJr=l kd
21 EJI B.c. FLEX , 15 BASE
SP
COMPOS~TEU
5
RIGID
~~-C. ~ BASE
SP
r7\~.c. II] P. C.C,
SP
8~ 1---s;-i
STIFFNESS P/4o (KIP/IN PP VIB FWD
12930 l229ol21so I
FIGURE 1 Description of five test pavements.
eter plate (12 in.) than that used for both the Pavement Profiler and the 16-kip vibrator (18 in.). This matter will be clarified further when the evaluated layer moduli are examined.
DEFLECTION BOWLS
With each of the NDT devices, in addition to measurements of the center deflection (~ 0), measurements were made of the offset deflections <~rl
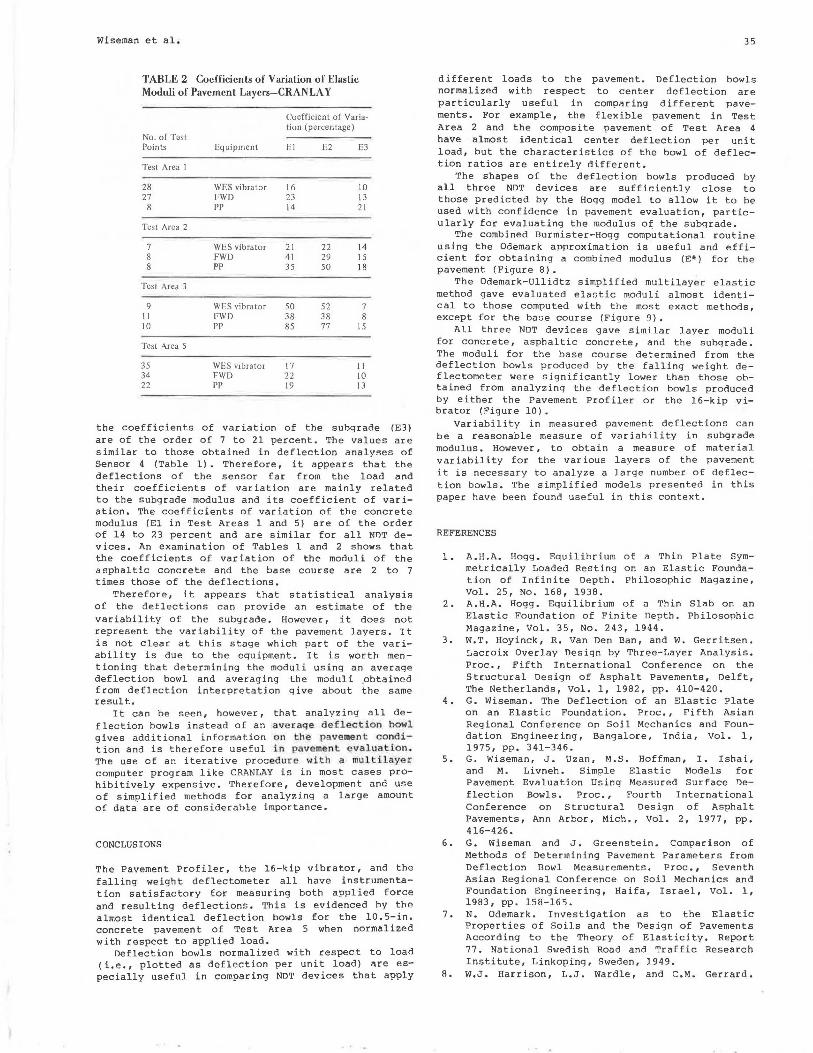
at various distances (r) from the center of load application. After examination of the measured deflection bowls, 15 sets of deflection bowl measurements (three NOT devices at each of five test areas) were created for subsequent analysis. For each test area care was taken to include only data from test points that had known pavement layer thicknesses. For the flexible pavements of Test Areas 2 and 3 it was therefore necessary to exclude test data from outer portions of the pavement close to the pavement edge, which apparently had layer thicknesses less than those given in Table 1. In Test Areas 1, 4, and 5 all the measured data were used. The average measured deflection per unit load as a function of offset distance for each of the three NOT devices for the 10.5-in. rigid pavement of Test Area 5 is shown in Figure 2.
Because, at least in the first approximation, pavement systems are linear, this presentation of the data (deflection per unit load) for three devices with applied loads of 4.5, 14.2, and 29.2 kips, respectively, allows an easier comparison of the deflection howls than does a direct comparison of the actual measured deflections.
It should be noted that, for Test Area 5 with the l 0. 5-in. concrete pavement, all three devices had almost identical average deflection bowls when normalized with respect to load. (This pavement would
Wiseman et al.
TABLE 1 Coefficients of Variation of Deflection Measurements
Coefficient of Variation (per-cent age) for Sensor
~
"' .... ~
No. of Test Points
Test Area I
28 27
8
Test Area 2
8 8 8
Test Area 3
11 II II
Test Area 4
12 11 10
Test Area 5
35 34 22
0 0
10
'? 20 Q
z ~ 30
Equipment 2
WES vibrator 11 8 FWD 9 pp 12 12
WES vibrator ID 13 FWD 13 12 pp 11 13
WES vibrator 9 9 FWD 14 12 pp 13 13
WES vibrator 13 14 FWD 14 PP 28 28
WES vibrator 7 8 FWD 7 pp 11 13
OFFSET DISTANCE (INCHES)
12 24 36
~ y-
_.....-:
u ... ...J IL ... 0
r--~~x ---.........- )( PP
b. VIB FWD + ' 40
50
FIGURE 2 Deflection bowls, Test Area 5.
4
8 9 9 7
14 18
14 12 12 15 16 19
9 9 11 11 15 15
16 21 10 9 38 38
9 10 7 8
13 14
48
..-. -
60
)(
be expected to exhibit the most linear behavior of all the pavements tested.) The comparative results for this pavement establish a high degree of confidence in both the load and the deflection measuring instrumentation for all three NDT devices.
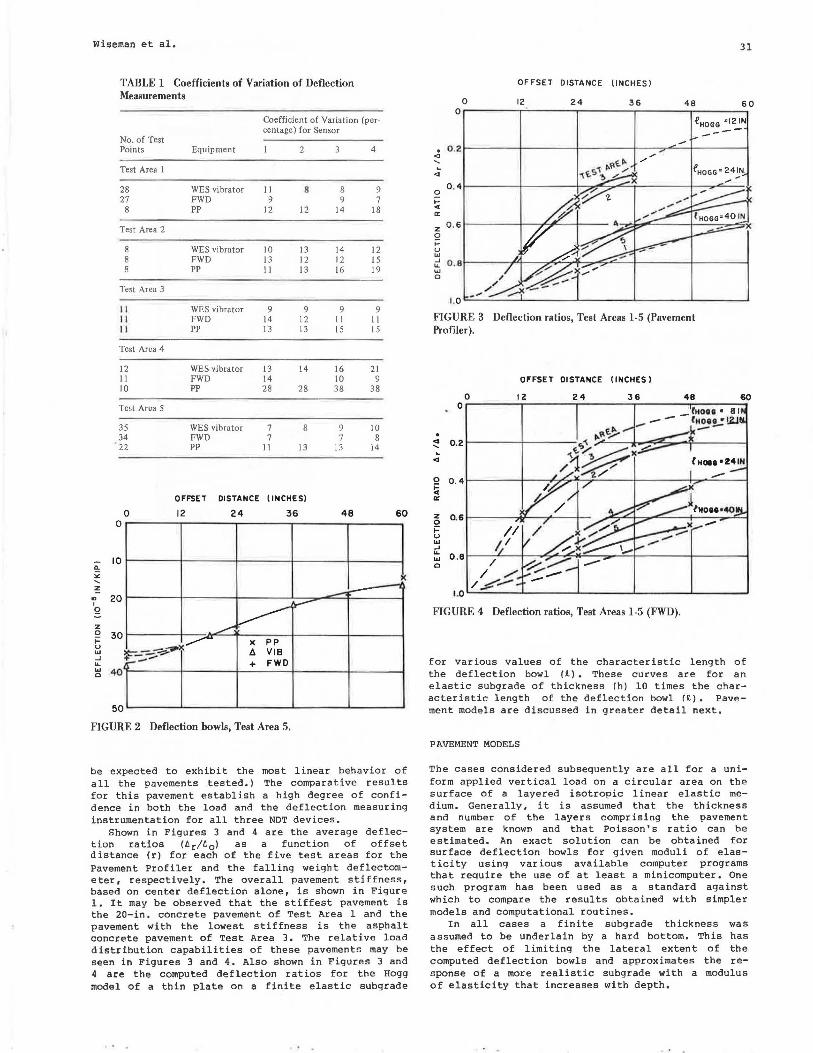
Shown in Figures 3 and 4 are the average def lection ratios (ll.r/t. 0 ) as a function of offset distance (r) for each of the five test areas for the Pavement Profiler and the falling weight deflectometer, respectively. The overall pavement stiffness, based on center deflection alone, is shown in Figure 1. It may be observed that the stiffest pavement is the 20-in. concrete pavement of Test Area l and the pavement with the lowest stiffness is the asphalt concrete pavement of Test Area 3. The relative load distribution capabilities of these pavements may be seen in Figures 3 and 4. Also shown in Figures 3 and 4 are the computed deflection ratios for the Hogg model of a thin plate on a finite elastic subgrade
31
OFFSET DISTANCE (INCHES)
0 12 24 36 48 60 0
!'HOGG =12 IN ----. 0 .2 <l
~ 0 , 4
0 j:: .. a::
z 0 . 6 0 j:: u ... ...J 0. 8 IL w c
1.0 c;.;;..__;:...__-L. ___ __J _ ___ ...L. ___ -.1, _ _ _ _J
FIGURE 3 Deflection ratios, Test Areas 1-5 (Pavement Profiler).
OFFSET DISTANCE (INCHES)
0 12 24 36 48 60 0
_fHOH • 81 -- t11ou •!ZJ . "'~~ k--<l 0.2 ,,,~ ~ " .... ~ /1~x !HOH •241N
0 0.4 ?./
~ a::
z 0 .6 0 j:: u ... ...J ...
0.8 ... 0
1.0-----'-----.._ ___ -1. ____ _,_ ___ __,
FIGURE 4 Deflection ratios, Test Areas 1-5 (FWD).
for various values of the characteristic length of the deflection bowl (.2.). These curves are for an elastic subgrade of thickness (h) 10 times the characteristic length of the deflection bowl (l). Pavement models are discussed in greater detail next.
PAVEMENT MODELS
The cases considered subsequently are all for a uniform applied vertical load on a circular area on the surface of a layered isotropic linear elastic medium. Generally, it is assumed that the thickness and number of the layers comprising the pavement system are known and that Poisson's ratio can be estimated. An exact solution can be obtained for surface deflection bowls for given moduli of elasticity using various available computer programs that require the use of at least a minicomputer. One such program has been used as a standard against which to compare the results obtained with simpler models and computational routines.
In all cases a finite subgrade thickness was assumed to be underlain by a hard bottom. This has the effect of limiting the lateral extent of the computed deflection bowls and approximates the response of a more realistic subgrade with a modulus of elasticity that increases with depth.

32
Hogg Model
The authors have been using the Hogg model (1,2) of a thin plate on an elastic foundation for intE;rpreting deflection measurements on road and airfield pavements for 10 years. Extensive use of the Hogg model has shown it to yield satisfactory results for the modulus of elasticity of the subgrade (E 0 )
compared with values obtained from in situ testing, In addition to its simplicity, one of the advantages of thin plate theory is that E0 can be computed from the deflection bowl measurements without prior knowledge of the thickness or other characteristics of the pavement layers above the subgrade. Others have also found the Hogg model to be useful in pavement evaluation studies (3).
The background and computational routines for the use of the Hogg model in pavement evaluation have been described elsewhere (_!-!l and will not be repeated here.
Burmister Model Ctwo layer)
When the Hogg model, which is that of a thin plate on an elastic subgrade, is used for interpreting surface deflection measurements, it is assumed that vertical strains within the pavement structure are small and can be ignored. For conventional flexible pavements the measured value of t. 0 , which is measured at the center of load application at the surface of the pavement, obviously includes vertical strains in the pavement. Thus the measured t. 0 is greater than that assumed for the mathematical model and t.r/t. 0 is therefore smaller than assumed. This leads to an underestimate of the characteristic length of the deflection bowl (£). It can be shown that if tor is measured at a distance (r) where t.rlt. 0 is about 0.5, these errors are compensatory and therefore have a negligible influence on the computed value of E0 •
When E0 and the characteristic length of the deflection bowl (2) have been computed, the flexural rigidity (D) of the pavement structure is easily computed. If the combined thickness (h*) of the pavement structure is known, the combined modulus (E*) of the pavement can be computed. This procedure can be used for rigid pavements and sometimes gives reasonable results for flexible pavements (3).
The use of Burmister two-layer theory appears to be a more promising approach for determininq the combined modulus (E*) of the pavement structure (5). Assume that the subgrade modulus (Eal I the combined thickness of the pavement (h*) , and the radius of the loaded area (a) are known. Using only the measured center deflection (to 0 ) , the computation of E*/E 0 and hence of E* is easily performed using Odemark's approximation to the Burmister solution (&_, 1.l •
Computations have been performed for E* /E0 for various values of F (i.e., the ratio of the center deflection for the two-layer system to the computed deflection for the Boussinesq case) and for h*/a using both the Hogg model and the Burmister model. The results are shown in Figure 5. It may be observed that only for strong thin pavements do the two models give similar results. It should also he noted that the Burmister model, which accounts correctly for the vertical strain in the pavement structure, is not sensitive to inaccuracy in the total pavement thickness (h*) for thicker flexible pavements.
Three-Layer Elastic Model
Several computer codes are available for obtaining an exact solution for surface deflections for layered linear elastic media of given elastic material
0
~ a:
U) :::> ..J :::> c 0 :IE
200
Transportation Research Record 1022
- BURMISTER
---HOGG hit •INFINITY
µ."•µ.:0.5
h•/a FIGURE 5 Comparison of E*/E0
computed by the Hogg and Burmister models.
parameters and layer thicknesses. The computer code used here is called CRANLAY (! 1 p.131). The analytical solutions for displacement are found by integral transform methods and are evaluated by numerical integration. To obtain the three unknown elastic moduli from measured deflection bowls, the following procedure was developed.
For each test area with known pavement thicknesses the CRANLAY computer code was used to compute surface deflections at the required offset distances for a range of modular ratios. The moduli of elasticity of the three pavement layers were then computed by solving a system of three equations that relate the surface deflections at the given offset distances to the moduli of elasticity. In this procedure the number of measured deflections used must equal the number of unknown moduli. The method is not iterative and the three equations are solved by direct numerical methods,
As a check on the method several computations were done using the evaluated elastic moduli obtained as input in the CRANLAY program. The computed surface deflections were then compared to the measured deflections used for computing the elastic moduli. In all cases the difference between the measured and and the computed deflections was found to be less than 0.5 percent.
Simplified Multilayer Model
This model is based on Odemark's method of "equivalent thicknesses" (&_,ll and has been further devel-

Wiseman et al.
oped and described in detail hy Ullidtz and Peattie (9,10). The computations for surface deflection are performed for a transformed section using the Boussinesq equation for circular loading for the center deflection (II 0 ) and the equations for point loading for offset deflections (t.r). The pavement is assumed to be made up of layers of known thickness and Poisson's ratio is assumed to he known; however, the moduli of elasticity are unknown. It is further assumed that the center deflection (11 0 ) and the deflection (lrl at several offset distances (r) have been measured with an NDT device applying a known load (P) on a circular plate of radius a.
The procedure followed is iterative, First, the unknown moduli of elasticity are "guessed" for the various pavement layers and then the resulting deflections at the center of load application and at offset distances (r) at which measurements were made are computed. The modulus of elasticity values are then modified until an "acceptable" match is obtained between the computed and the measured deflect ions.
The method can be used for two or more pavement layers and is known to give computed surface deflections quite close to those computed by the most exact methods. It will be demonstrated that, when used in the reverse mode as described earlier, it also yields evaluated layer elastic parameters similar to those obtained with the most exact methods,
The computations were done using a personal computer in the interactive mode. The match between measured and computed deflections was considered to be acceptable when the center deflections matched within 3 percent and the remaining deflections matched within 10 percent. For the two concrete pavements the center deflection and the furthest measured deflection matched to less than 0.5 percent.
COMPUTED ELASTIC PARAMETERS--A COMPARISON OF MODELS
The various pavement models and computational routines that have been presented have been used to analyze the 15 average deflection bowls . For a known pavement section and e lastic moduli , each of the pavement models would produce slightly different deflection bowls. However, it was of considerably more interest to compare the evaluated elastic parameters.
The subgrade modulus values for all three pavement types computed with the Odemark-Ullidtz simplified multilayer elastic model showed excellent agreement with those values computed with the "exact" CRANLAY computer program (Figure 6). The simpler Hogg model also showed good agreement with the CRANLAY computations for the subgrade modulus (Figure 7).
Figure B shows the combined modulus (E*) for a two-layer system for all pavements tested using Odemark-Ullidtz compared with the Hogg model for determining the subgrade modulus (E0 ) and Odemark' s approximation for the Burmister solution, for center deflection only, for determining E* /E0 and hence E*, For the ri<Jid pavement, h* is the thickness of concrete, for the flexible pavements the combined thickness of asphaltic concrete and base, and for the composite pavement the combined thickness of asphalt concrete overlay and the old concrete pavement. The agreement is excellent.
llhown in Figure 9 are the subgrade, base course, asphalt concrete, and portland cement concrete moduli for the rigid and flexible pavements, The values were computed using the same deflection bowls with the Odemark-Ullidtz simplified method of computation and the CRANLAY computer program. It should be noted that the scales in Figure 9 are log-log. The agree-
.. .,,.,. Q ~
N .... Q _, _, :::> I
" a: ... ::E
"' c 3
VJ :::> _, :::> c 0 ::E ..., c ... a:
" al
7
6
5
4
3 PAVEMENT TYPES
fJ. RIGID
2 )( FLEXIBILE o COMPOSITE
2 ~ 4 5 6 7 :::> VJ
SUBGRADE MODULUS - CRAN LAY ,1104p1i
FIGURE 6 Compariimn of subgrade modulus computed using Hogg and CRANLAY.
. "' ... 0
"· _, ..., c 0 :I!
" " 0 :i:
I VJ :::> _, :::> c 0 ::E ..., c ... a:
" al
7
6
5
3
2
x/ 6
x /'""' "'" ;( :AV~IGID X FLEXIBLE O COMPOSITE
:::> VJ o,._~_._~ ....... ~~.._~ ...... ~~'-~-'-~--'~
0 2 4 5 6
SUBGRADE MODULUS - CRA NLAY, x I 04
psi
FIGURE 7 Comparison of suhgrade modulus using Odemark-Ullidtz and CRANLA Y.
6
4
2
7
. "' " " 10
1 0 :i: B
a: 6 ..., .... VJ 4 ::E a: :::> al
* 2 w
10' 10°
x
2
PAVEMENT TYPE
fJ. RIGID (E1) x FLEXIBLE (E") o COMPOSITE(EMJ
COMBINED 4 6 8 10
1 2 * 4 6
PAVEMENT MODULUS E (ODEMARK-ULLIDTZ) TWO LAYER, p1i
FIGURE 8 Comparison of combined modulus (E*) computed using Burmister-Hogg and Odemark-Ullidtz.
33

34
.. Q.
N ... ~ -' -' :> I
>< a: ct :IE
"' 0 0
1cJ
101
•
PAVEMENT TYPE
6 RIGID
X FLEXIBLE
io10 ...... ~~~~~-,~o-5~~~~~--',0~5~~~~~-',01
MODULUS VALUES - CRANLAY, psi
FIGURE 9 Comparison of E1 , E2 , and Eg using Odemark-Ullidtz and CRANLA Y.
Transportation Research Record 1022
E p•i
101i==------------------!~
2
2
5
2
P.C. C. Concrete A.C. A1phalt Coner B .C. Ball Coune S Sub9rade
P.C.C.
s s s
ment between the two methods of computation is again remarkably good. 104 '--+-+..-io..--f--1--+l--++-+-+-++--+l-l~l--l+--++--+--+-+l--++-...µ.::L..J
COMPARISON OF LAYER MODULI COMPUTED FOR AVERAGE DEFLECTION BOWLS OBTAINED WITH THE VARIOUS NDT DEVICES
For the purposes of this comparison, the discussion will be limited to the layer modulus values computed by the approximation to the layered elastic model used in the method of equivalent thicknesses. These moduli for the five test areas and the three NDT devices are shown graphically on a logarithmic scale in Figure 10.
The first and most striking observation is that, on the basis of knowledge of materials in the pavement sections at the five test areas, almost all of the layer modulus values obtained with the three NDT devices are reasonable. The two exceptions rout of a total of 39 determinations of layer moduli) were 6.6 million psi for the 20-in. concrete determined in Test Area 1 and the 8 million psi for the 6-in. overlaid concrete determined in Test Area 4, both with the Pavement Profiler.
The modulus values for the subgrade ranged from 20,000 to 26,000 psi for Areas 3, 4, and 5 and from 3 4, 000 to 54, 000 psi for Areas 1 and 2, for all three NDT devices. There was a consistent pattern for all areas (except Test Area 4) with the heavier load device giving the lower evaluated subqrade modulus. It should be pointed out, however, that the maximum difference between NDT devices for the subg rade modulus is about 25 percent.
In general, the modular values for portland cement concrete and for asphalt concrete are reasonable and do not differ significantly with the various NOT devices. The one exception as mentioned previously is the Pavement Profiler on the 20-in. concrete pavement.
The modulus values for the base course ranged for the Pavement Profiler and the 16-kip vibrator from 135,000 to 270,000 psi and were about 65,000 psi for the FWD. The 16-kip vibrator gave higher values for Test Area 3 and lower values for Test Area 2 than did the Pavement Profiler.
The lower evaluated moduli for the base course in Test Areas 2 and 3, based on an interpretation of the deflection bowls measured with the FWD, require further study that is beyond the scope of this
PP Pavement Profiler V 16KipVibrotor F F.W. D.
FIGURE 10 Comparison of layer moduli for Test Areas 1-5 for three NDT devices.
paper. Refer to Figure 1 and the overall stiffnesses based on center deflection alone. It is now evident that the lower stiffnesses measured in Test Areas 2 and 3 with the FWD are due to the response of the base course to impulse loading and not just to the smaller diameter plate.
MATERIAL VARIABILITY
Material variability and its effect on design have been and will continue to be of prime importance in all qeotechnical problems (11). Pavement design, evaluation, and rehabilitatio;:;- involve the determination of parameters that possess natural var iabili ty. For each problem the appropriate percentile level of the distribution can be selected on the basis of reliability considerations. For example, in overlay design based on center deflection measurements, the BOth and 97th percentiles are sometimes used (12,11,l. When the deflection bowl is measured at several offset distances from the load, and its interpretation is expressed in terms of moduli of elasticity of the pavement layers, the statistical analysis of the results and its implications are not yet clear. It is the purpose of this section to discuss the problem. The test sections are those reported previously, and the results of analysis refer to the deflection bowl interpretation using multilayer elastic theory.
Table 1 gives the coefficients of variation (CV) of the deflections measured at four distances with three different NDT devices. It is seen that the coefficient of variation lies between 8 and 19 percent, with the higher values obtained using the Pavement Profiler.
Table 2 gives the coefficients of variation of the moduli derived for all tests. It is seen that
..
Wiseman et al.
TABLE 2 Coefficients of Variation of Elastic Moduli of Pavement Layers-CRAN LAY
Coefficient of Varia-tion (percentage)
No. of Test Points Equipment El E2 E3
Test Area I
28 WES vibrator 16 10 27 FWD 23 13 8 pp 14 21
Test Area 2
7 WES vi bra tor 21 22 14 8 FWD 41 29 15 8 pp 35 50 18
Test At ea 3
9 WES vibrator 50 52 7 11 FWD 38 38 8 10 pp 85 77 15
Test Area 5
35 WES vibrator 17 LI 34 FWD 22 IO 22 pp 19 13
the coefficients of variation of the subgrade (E3) are of the order of 7 to 21 percent. The values are similar to those obtained in deflection analyses of Sensor 4 (Table 1). Therefore, it appears that the deflections of the sensor far from the load and their coefficients of variation are mainly related to the subgrade modulus and its coefficient of variation. The coefficients of variation of the concrete modulus (El in Test Areas 1 and 5) are of the order of 14 to 23 percent and are similar for all NOT devices. An examination of Tables 1 and 2 shows that the coefficients of variation of the moduli of the asphaltic concrete and the base course are 2 to 7 times those of the deflections.
Therefore, it appears that statistical analysis of the deflections can provide an estimate of the variability of the subgrade. However, it does not represent the variability of the pavement layers. It is not clear at this stage which part of the variability is due to the equipment. It is worth mentioning that determining the moduli using an average deflection bowl and averaging the moduli obtained from deflection interpretation give about the same result.
It can be seen, however, that analyzing all deflection bowls instead of an average defl ection howl gives additional information o n t he pave men t condition and is therefore useful i n pave me n t eva uation . The use of an iterative proced ure with a multilaye r computer program like CRANLAY is in most cases prohibitively expensive. Therefore, development and use of simplified methods for analyzing a large amount of data are of considerable importance.
CONCLUSIONS
The Pavement Profiler, the 16-kip vibrator, and the falling weight deflectometer all have instrumentation satisfactory for measuring both applied force and resulting deflections. This is evidenced hy the almost identical deflection bowls for the 10. 5-in. concrete pavement of Test l\rea 5 when normalized with respect to applied load.
Deflection bowls normalized with respect to load (i.e., plotted as deflection per unit load) are especially useful in comparing NDT devices that apply
35
different loads to the pavement. Deflection bowls normalized with respect to center deflection are particularly useful in comparing different pavements. For example, the flexible pavement in Test Area 2 and the composite pavement of Test Area 4 have almost identical center deflection per unit load, but the characteristics of the bowl of deflection ratios are entirely different.
The shapes of the deflection bowls produced by all three NDT devices are sufficiently close to those predicted by the Hogg model to allow it to be used with confidence in pavement evaluation, particularly for evaluating the modulus of the subgrade.
The combined Burmister-Hogg computational routine using the Odemark approximation is useful and efficient for obtaining a combined modulus (E*) for the pavement (Figure 8).
The Odemark-Ullidtz simplified multilayer elastic method gave evaluated elastic moduli almost identical to those computed with the most exact methods, except for the base course (Figure 9) •
All three NDT devices gave similar layer moduli for concrete, asphaltic concrete, and the subqrade. The moduli for the base course determined from the deflection bowl s produced by the falling weight def lectometer were significantly lower than those obtained from analyzing the deflection bowls produced by either the Pavement Profiler or the 16-kip vibrator (Figure 10).
Variability in measured pavement deflections can be a reasonable measure of variability in subgrade modulus. However, to obtain a measure of material variability for the various layers of the pavement it is necessary to analyze a large number of deflection bowls. The simplified models presented in this paper have been found useful in this context.
REFERENCES
1. A.H.A. Hogg. Equilibrium of a Thin Plate Symmetrically Loaded Resting on an Elastic Foundation of Infinite Depth. Philosophic Magazine, Vol. 25, No. 168, 1938.
2. A.H.A. Hogg. Equilibrium of a Thin Slab on an Elastic Foundation of Finite Depth. Philosophic Magazine, Vol. 35, No. 243, 1944.
3. W.T. Hoyinck, R. Van Den Ban, and W. Gerritsen. Lacroix Overlay Design by Three-Layer Analysis. Proc., Fifth International Conference on the Structural Design of Asphalt Pavements, Delft, The Netherlands, Vol. 1, 1982 , pp. 410-420.
4. G. Wiseman. The Deflection of an Elastic Plate on an Elastic Foundation. Proc., Fifth Asian Regional Conference on Soil Mechanics and Foundation Engineering, Bangalore, India, Vol. 1, 1975, pp. 341-346.
5. G. Wiseman, J. Uzan, M.S. Hoffman, I. Ishai, and M. Livneh. Simple Elastic Models for Pavement Evaluation Using Measured Surface Deflection Bowls. Proc., Fourth International Conference on Structural Design of Asphalt Pavements, Ann Arbor, Mich., Vol. 2, 1977, pp. 416-426.
6. G. Wiseman and J. Greenstein. Comparison of Methods of Determining Pavement Parameters from Deflection Bowl Measurements. Proc., Seventh Asian Regional Conference on Soil Mechanics and Foundation Engineering, Haifa, Israel, Vol. 1, 1983, pp. 158-165.
7. N. Odemark. Investigation as to the Elastic Properties of Soils and the Design of Pavements According to the Theory of Elasticity. Report 77. National Swedish Road and Traffic Research Institute, Linkoping, Sweden, 1949 .
8. W.J. Harrison, L.J. Wardle, and C.M. Gerrard.

36
Computer Programmes for Circle and Strip Loads on Layered Anisotropic Media. Division of Applied Geomechanics, Commonwealth Scientific and Industrial Research Organisation (Australia), 1972.
9. P. Ullidtz and K.R. Peattie. Pavement Analysis by Programmable Calculators. Journal of the Transportation Engineering Division, ASCE, Vol. 106, No. TE5 1 1980, pp. 581-597.
10. K.R. Peattie and P. Ullidtz. Simplified Computing Techniques for Analysing Flexible Pavements. Proc., Institute of Civil Engineers, Part 2, Vol. 71, London, England, March 1981, pp. 185-196.
11. E.J. Yoder and M.W. Witczak. Principles of
Transportation Research Record 1022
Pavement Design, 2nd ed. John Wiley and Sons, Inc., New York, N.Y., 1975, Chapter 13, Material Variability, pp. 413-442.
12. J .A. Mattew. Pavement Evaluation Using Nondestructive Testing. Proc., Twenty-Ninth California Transportation and Public Works Conference, San Diego, Calif., 1977, pp. 278-295.
13. Asphalt Overlays and Pavement Rehabilitation. MS-17. The Asphalt Institute, College Park, Md., 1977.
Publication of this paper sponsored by Committee on Mechanics of Earth Masses and Layered Systems.
Analytical-Empirical Pavement Evaluation Using the
Falling Weight Deflectometer P. ULLIDTZ and R. N. STUBSTAD
ABSTRACT
Because of the rapid development of hardware and software during the past 10 years, it is now possible to use an analytical-empirical (or mechanistic) method of structural pavement evaluation on a routine basis. The Dynatest 8000 falling weight deflectometer that, when used with the ELMOn program, determines the modulus of each structural layer in a pavement system is described. The moduli are determined nondestructively and in situ under conditions that closely resemble those under the influence of heavy traffic. Some practical examples illustrating the use of the method are presented, and its empirical components are discussed. These empirical components are also programmed into the ELMOD program so an overlay design may be carried out concurrently with the analytical determination of layered elastic moduli. The method may be used for both flexible and rigid pavements, where joint evaluation is not needed. The evaluation of joint or corner conditions in jointed portland cement concrete pavements is not addressed in this paper.
Structural design of pavement systems should be based on an "analytical-empirical" approach. Often, such an approach is referred to as an "analytical method" or a "mechanistic method," but because it still contains an important empirical component (see the fourth section), the term "analytical-empirical" is more correct. The desirability of an analyticalempir ical approach appears to be a universally agreed-on prec·ept among pavement engineers, particularly as a result of the Fifth International Conference on the Structural Design of Asphalt Pavements held in Delft, The Netherlands, in 1982.
The analytical-empirical method presented here makes use of the same approach that is used in most other structural engineering design, that is:
1. The loadings and environmental conditions are determined;
2. The elastic modulus (Young's modulus) is determined for each material in the structure;
3. The critical stresses or strains, as a result of loadings, are calculated in each material; an~
4. The thicknesses (or the materials) are modified until the critical stresses or strains do not exceed permissible values.
One reason (of many) for using this approach is the increased need for pavement maintenance and rehabilitation. To make the right choice from many potentially feasible maintenance and rehabilitation measures, the engineer must base his decision on a rational evaluation of the mechanical properties of the materials in the existing pavement structure. To accomplish this, existing empirical methods of · pavement design are inadequate. Instead, a combined analytical-empirical evaluation procedure should be followed.