railroad electrification: an alternative for petroleum...
TRANSCRIPT
Transportation Research Record 802
proved that it will be practical to increase the axle loading of coal cars to 26 tons and that of electric locomotives to 28 tons. The trailing mass will then be 20 800 tons.
Tests have already been carried out that approximate the performance of a 200-car train on a regraded line, and measurements indicate that a specific energy consumption of about 7 W•h/ton-km for the loaded train and 34 W•h/ton for the empty one can be expected. These reductions are due not only to better use of momentum with a heavy train 2.5 km long, but also to a better ratio of trailing mass to locomotive mass, in which a 130 percent improvement over the present ratio by using 84-car trains is effected.
CONCLUSION
After the first year of full electric operation and two major fuel price increases, the first of which in 1973 led to the decision to electrify this line, the figures given fully justify this decision and confirm the economical use of electric traction in a heavy main-line operation of this nature. An annual saving of 120 million L of diesel fuel is now being effected on this line alone.
33
In the future in South Africa, it is foreseen that most diesel and other fuel oils will be obtained by conversion from the abundant coal resources. However, to convert coal to electricity and use this for an electrified railway is a 100 percent more-efficient use of this natural resource. This fact and the economic advantages illustrated in this paper have led to a decision to proceed with a further 2700 km of electrification on four major routes by 1985. This will result in a total of 16 000 km of electrified track in the republic.
Already 70 percent of all traffic on a ton-kilometer basis is hauled electrically on the South African Railways, and with these extensions and other traffic increases the target is to increase this figure by 85 percent.
ACKNOWLEDGMENT
I wish to thank the director general of the South African Railways and Harbours for permission to present and publish this paper.
Publication of this paper sponsored by Committee on Rail Electrification Systems.
Railroad Electrification: An Alternative for
Petroleum Savings
ROBERT K. WHITFORD
Evaluation of various scenarios of construction rates, freight growth, and fuel· price escalation shows that electrification of the nation's high-density railroad routes is a cost-effective alternative when compared with the cost and output of synthetic-fuel plants. If 15 000 miles of the existing rail routes, which handle more than 30 percent of the nation's freight, were electrified today, the cost of the diesel fuel saved would be equivalent to $1.00/gal or less. After a 30-year period of construction and with a reasonable freight growth, the resulting 25 600 miles of electrified rail network would save more than 300 000 bbl of oil per day over the amount that would have been used by not electrifying. The investment per fuel equivalent produced or saved is approximately the same for the two alternatives. However. the fuel plant has a specific and limited output, whereas the growth in freight traffic that can accrue on electrified rail will generate increasing substantial returns on the investment, an in· vestment that has the potential to last 50 years. The principal barrier to electrification is the large investment required relative to the railroad's financial condition. Preliminary analyses of costs and returns, however. indicate that rail electrification is a feasible energy-conservation opportunity. A mature technology, as shown by more than 60 000 route miles worldwide, it would provide substantial returns on investment and improve productivity. Given the escalation of fuel prices and a national desire for energy independence, electrification should be of high priority on the list of energy policies.
The use of electricity in railroads offers an option to diversify fuel sources by replacing a system now dependent on petroleum with energy generated from other basic resources such as coal, hydroelectric power, or nuclear reactors. Nurtured on inexpensive fuels such as wood and coal, railroads currently derive more than 97 percent of their energy from petroleum products. In the 1940s and 1950s, the switchover from steam to diesel-electric locomotives brought considerable improvement in energy productivity because of the low cost of oil then and the increase in propulsive efficiency. Now soaring
diesel fuel costs indicate that it may be time for another switchover, this time to the electrification of the high-density portions of the U.S. railroad network. In addition to fuel conservation, electrification offers other advantages to the railroad, namely, an increased return on investment [generally well above 15 percent (1,2)] and improved productivity, mainly through reduced consist weight and lower maintenance costs.
This paper combines cost and planning data from several existing electrification and synthetic-fuel studies in order to compare investment in railroad electrification as a fuel-conserving option with an alternative investment in liquid-coal plants to produce an equivalent amount of fuel oil. Resulting cost analyses reveal that railroad electrification is both competitive as an energy-saving investment and efficient in the use of coal. This study treats total national costs, borne either by the railroad or by the electric utility, according to a systems perspective. Ultimately, of course, decisions about investments in electrification must be made on the basis of individual route segments, although differences among individual segments should not be significant enough to invalidate the general results.
INVESTMENT SCENARIOS
The Railroad Revitalization and Regulatory Reform Act of 1976 (4R Act) required that the Federal Railroad Administration (FRA) perform a study of the potential costs and benefits to be derived from electrification of the high-density lines. Forty
34
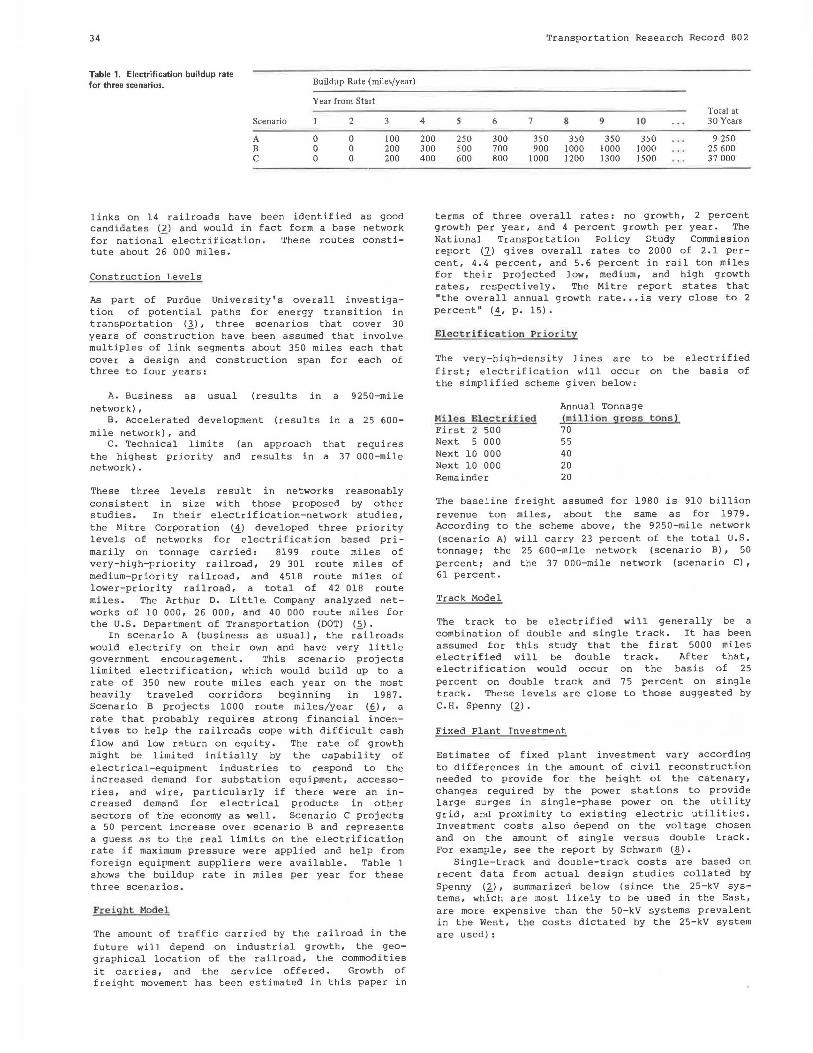
Table 1. Electrification buildup rate for three scenarios.
Scenario
A B c
Buildup Rate (miles/year)
Year from Start
2 3
0 0 100 0 0 200 0 0 200
links on 14 railroads have been identified as good candidates (ll and would in fact form a base network for national electrification. ~hese routes constitute about 26 000 miles.
Construction Levels
As part of Purdue University's overall investigation of potential paths for energy transition in transportation (}), three scenarios that cover 30 years of construction have been assumed that involve multiples of link segments about 350 miles each that cover a design and construction span for each of three to four years:
A. Business as usual (results in a 9250-mile network) ,
B. Accelerated development (results in a 25 600-mile network), and
C. Technical limits (an approach that requires the highest priority and results in a 37 000-mile network).
These three levels result in networks reasonably consistent in size with those proposed by other studies. In their electrification-network studies, the Mitre Corporation (_!) developed three priority levels of networks for electrification based primarily on tonnage carried: 8199 route miles of very-high-priority railroad, 29 301 route miles of medium-priority railroad, and 4518 route miles of lower-priority railroad, a total of 42 018 route miles. The Arthur D. Little. Company analyzed networks of 10 000, 26 000, and 40 000 route miles for the U.S. Department of Transportation (DOT) (5).
In scenario A (business as usual), the riilroads would electrify on their own and have very little government encouragement. This scenario projects limited electrification, which would build up to a rate of 350 new route miles each year on the most heavily traveled corridors beginning in 1987. Scenario B projects 1000 route miles/year (§), a rate that probably requires strong financial incentives to help the railroads cope with difficult cash flow and low return on equity. The rate of growth might be limited initially by the capability of electrical-equipment industries to respond to the increased demand for substation equipment, accessories, and wire, particularly if there were an increased demand for electrical products in other sectors of the economy as well. Scenario C projects a 50 percent increase over scenario B and represents a guess as to the real limits on the electrification rate if maximum pressure were applied and help from foreign equipment suppliers were available. Table l shows the buildup rate in miles per year for these three scenarios.
Freight Model
The amount of traffic carried by the railroad in the future will depend on industrial growth, the geographical location of the railroad, the commodities it carries, and the service offered. Growth of freight movement has been estimated in this paper in
Transportation Research Record 802
Total at 4 s 6 7 8 !) 10 30 Years
200 250 300 350 350 350 350 9 250 300 500 700 900 1000 1000 1000 25 600 400 600 800 1000 1200 1300 1500 37 000
terms of three overall rates: no growth, 2 percent growth per year, and 4 percent growth per year. The Natiunal Transportation Policy Study Commission report (1) gives overall rates to 2000 of 2.1 per-cent, 4.4 percent, and 5.6 for their projected low, rates, respectively. The "the overall annual growth percent" (_!, p. 15) .
Electrification Priority
percent in rail ton miles medium, and high growth Mitre report states that rate ••• is very close to 2
The very-high-density lines are to be electrified first; electrification will occur on the basis of the simplified scheme given below:
Miles Electrified First 2 500 Next 5 000 Next 10 000 Next 10 000 Remainder
Annual Tonnage (million gross tons) 70 55 40 20 20
The baseline freight assumed for 1980 is 910 billion revenue ton miles, about the same as for 1979. According to the scheme above, the 9250-mile network (scenario A) will carry 23 percent of the total U.S. tonnage; the 25 600-mile network (scenario B), 50 percent; and the 37 ODO-mile network (scenario C) , 61 percent.
Track Model
The track to be electrified will generally be a combination of double and single track. It has been assumed for this study that the first 5000 miles electrified will be double track. After that, electrification would occur on the basis of 25 percent on double track and 75 percent on single track. These levels are close to those suggested by C.H. Spenny (1).
Fixed Plant Investment
Estimates of fixed plant investment vary according to differences in the amount of civil reconstruction needed to provide for the height of the catenary, changes required by the power stations to provide large surges in single-phase power on the utility grid, and proximity to existing electric utilities. Investment costs also depend on the voltage chosen and on the amount of single versus double track. For example, see the report by Schwarm (~).
Single-track and double-track costs are based on recent data from actual design studies collated by Spenny (1), summarized below (since the 25-kV systems, which are most likely to be used in the East, are more expensive than the 50-kV systems prevalent in the West, the costs dictated by the 25-kV system are used) :

Transportation Research Record 802
~ Catenary Substation Utility connection Signaling and communication Civil reconstruction Engineering Total
Cost ($000s/track mile) Single Double Track ~
160 280 80 140 15 20
130 50
___§_2. 500
190 70
100 800
Locomotive Investment and System Maintenance
Diesel locomotives, which have an 18-year life, will be replaced with more-powerful, more-efficient electric locomotives that have a 30-year life. Displaced diesel locomotives not worn out will continue to be used in the nonelectrif ied portion of the system. Maintenance costs for the electric locomotive are $0.65/unit mile as opposed to $1.33/ unit mile for diesel locomotives. Catenary maintenance rates of $2500 and $4400/route mile of single and double track, respectively, are included in the electric operating system. As electrification occurs, diesel locomotives will still be needed in other parts of the system and will be transferred or sold for alternative service.
Due to higher availability and increased horsepower, 12 electric locomotives rated at 5100 hp that have a 75 percent availability should replace 35 diesel electrics rated at 3000 hp that have a 50 percent availability. According to information from General Electric and General Motors, diesel-electric locomotives cost about $300/hp, whereas electrics when ordered in quantity will cost from $240 to $300/hp. Our present-value analysis indicates that electric-locomotive costs, which include locomotive and catenary maintenance, are about 2. 5 times less than the cost of a comparable diesel-locomotive capability, including the maintenance.
ESTIMATING FUEL SAVINGS
A realistic value for the fuel saved for each ton mile that is shifted from diesel-electric to pure electric locomotion depends on many variables, particularly on the type of service offered, the terrain of the route, and the composition of the consist. Table 2 indicates the wide range of values that could be considered. For most of this analysis an average of 1.8 gal/1000 gross ton miles is used. This value is also varied to show the sensitivity of results to electrification of high-density routes that operate on either high-speed manifest service (2.4 gal/1000 gross ton miles) or drag service (1.2 gal/1000 gross ton miles) .
Table 2. Fuel-use factor from simulations and other data sources.
Variable
197 8 average" Mixed freight (I) High-speed freight (I) Unit coal train (I) -I 0 000-mile net ;;;ark (I ) Drag or general freight-;ervice
[(±,Table 37)] Manifest service[ (!, T"ble 37)] Trniler-on-flatcar scrvicnb
Tonnage (billion gross ton miles)
2092 38 68 30
502
Fuel Used (million gal)
3718 47
124 22
950
Use Factor (gal/1000 gross ton miles)
1.77 1.24 1.82 0.74 1.88 0.94-2.29
1.24-2.61 3.88
3Computed from 197B Association of American Railroads Yearbook of Railroad Facts by combining average data on fuel used, revenue ton miles, and car miles (tare weight
bof 32 tons/car). Computed from data found in DOT publication on intermodal freight program (2)·
35
There is also a difference between the gross ton miles moved per horsepower of diesel locomotion and electric locomotion. The ratio of locomotive to consist weight for diesel electrics can vary from 11 percent (at 1.5 hp/ton) to 25 percent (at 3 hp/ton), depending on service and ruling grades, whereas electrics may vary from 7 to 14 percent for the same consist. This paper uses 17 percent for the diesel electric and 7 percent for the electric. To convert revenue tons to trailing tons, a factor of 2.1 [consistent with Association of American Railroads (AAR) data] is used.
The amount of electricity consumed by the electrified system, measured at the rail substation meter, will vary from 10 to 14 kW •h/gal of diesel fuel needed · to pull the same trailing tons. The value used in this paper is 12 kW•h/gal. [The conversion from gallons to kilowatt-hours at the meter considers factors of the efficiency of the diesel at 30 percent, the fact that no electricity is used when trains are stopped, and losses of 20 percent from the meter to the rail. At 136 000 Btu/gal and 3412 Btu/kW•h, this factor is 10.46 (10, pp. A-12, 14) .]
COMPARISON OF RAILROAD ELECTRIFICATION BY USING SYNTHETIC FUELS
A major reason for this investigation is to compare diesel fuel savings from railroad electrification with the cost of providing the equivalent amount of freight movement by using diesel fuel produced from coal. National averages are used for the investment time line and the related output levels for the coal-liquefaction plants.
Investment in Place
For a variety of reasons, which include geography and the availability of other resources such as labor and water, the output in barrels per day per dollar invested for liquid-coal plants ranges from $36 000 to $50 000 of investment (11).
Figure 1 shows the average number of barrels of diesel fuel saved per day when the assumed railroad investment is in place. Even with no growth, scenario B saves about one-half the diesel fuel u.sed by railroads today. With 2 percent freight growth, the saving on the 25 600-mile network grows from about 220 000 bbl/day on completion to almost 350 000 bbl/day in year 50. Figure 2 shows the investment in dollars (total made in years 1-30) divided by the average number of barrels per day saved in years 31-50 for six different railroad-electrification cases: (a) the three scenario levels that have average service (1. 8 gal/1000 gross ton miles) and 2 percent annual freight growth; (b) case a when the marginal cost of the electric utility investment is added; (c) manifest service (2. 4 gal/1000 gross ton miles) operating on the 9250-mile network with annual freight growth rates of 0, 1, 2, and 3 percent; (d) the 25 600-mile network with 2 percent annual freight growth and various service levels from drag to manifest; (e) the savings on the 9250-mile network at completion and 10 and 20 years later with 2 percent freight growth; and (f) the Southern Railroad route from Cincinnati to Atlanta, based on a 20-year average with 0, 1, and 2 percent annual growth in traffic. [For the Southern Railroad, data were obtained verbally from the Tennessee Valley Authority. Briefly, the route is 500 miles long, consists of 750 track miles, and carries 80 million gross tons annually. The ratio of horsepower to gross tons averages 1. 63. When the equivalent work of 1 gal of diesel fuel is done, 14.2 kW•h are consumed. Electricity prices for 1980 were

36 Transportation Research Record 802
Figure 1. Fuel saved as function of traffic on electrified routes.
400
350
"' w-> :>.
"' "' Ul "' 300 .., '" QJ QJ
" 0.
"' Ill 250 .., .., QJ QJ
Ill'" QJ'" ..... "'
2% growth (year 30) A - 9250 route miles
Cl "' 200 .µ "' <:: <:: QJ"'
c B - 25,600 route miles .., Ill
"' " lSO > 0 ..... .c oi growth (year 30)
C - 37,000 route miles
"E-< tr·-·
"' 100
so 0% growth (year 30)
0
500 1000 1500 2000 2500 3000
Traffic on Electrified Rail (Billion Electric Gross Ton Miles Per Year)
3500
Figure 2. Investment per barrel of oil equivalent produced or saved.
COAL LIQUEFACTION
RAILROAD ELECTRIFICATION
Average Service 2% growth (in year '40)
Adds marginal investment
in Electric Utility
Manifest Service, 9250 Network (in year 1 40)
25,600 Network, 2% growth (in year '40)
9250 Network, 2% growth Average Service
Southern RR - Cincy to Atl
(20 year average)
3%
0
1.BB 2.SB
9250 25,600 37,000 Route miles
W~- ----.. ------l/?2?7/~
2% 1% Freight Growth 0%
Manifest Average Service Drag
20 10 0 (Years after Investment Completion 2010)
2% 1% 0 % (Freight Growth)
........ FZ.....,....2....,,....<l .......... 6__,,2___,,.2~:!
10 20 30 40 50 60
Investment per Barrel of Oil Produced or Saved (Thousands of 1980 dollars)

Transportation Research Record 802
$0. 29/kW•h. Fixed plant investments are estimated to be $176. 5 million, whereas $82 million is required for new locomotives. This analysis also provides cost reimbursement for diesel-electric locomotives that will be replaced and moved to nonelectrified service.]
The marginal power plant investment is calculated to be about $15 000-$20 000/bbl/day. This amount would have to be added to the other investment cases shown to cover the full national investment. In the analysis below, the average electricity rate of $0.04/kW•h includes about $0.13 to cover the capital charge rate of the electric utility investment (1) .
Present Value of Time-Phased Investment
An alternative method for comparing investment in electrified railroad construction with investment in liquid-coal fuel-plant construction is to calculate the present value of the stream of investments for equal fuel saved or produced over time. The railroad investment, for example, will be made over many years as more miles are electrified and as the freight traffic grows. If synthetic-fuel plants are built on a schedule to produce diesel fuel {equivalent British thermal units) in amounts identical to the savings attributed to rail electrification, the two streams of time-phased investments can be compared on an equivalent economic basis. The money rate that was used for the analysis is the July 1980 U.S. Treasury Note Redemption Quoted Rates for 2005-2010 (10. 27 percent). Table 3 shows the net present value of investments for a 50 000-bbl/day synthetic-fuel plant--in the range of $1.8-$2.5 billion--and the values for two electric locomotives, $240/hp and $300/hp.
The model used for each synthetic-fuel plant was six to eight years from start of construction to full production and construction investments of 20 percent in the fourth year, 60 percent in the fifth year, and 20 percent in the sixth year (12). This comparison also indicates that, as energy alternatives, the present values of investment in railroad electrification and coal liquefaction are reasonably close.
Total Price per Barrel of Oil Saved
It is also possible to compare the total cost per barrel of oil equivalent by adding the variable costs and feedstock costs to the capital payments on debt. This comparison would be equivalent to the railroad's having a pool of oil that they could use for their diesel-electric system or sell if the economics are favorable to electrifying the track and purchasing electricity for fuel.
In the scenario suggested here, the amount of variable or operating cost for the synthetic liq-
Table 3. Present value of railroad electrification compared with that for liquid· coal plants.
Net Present Value (billions of dollars)
2% Freight 2% Freight 4% Freight Growth in Growth in Growth in
Type of Investment 30 Years 50 Years 50 Years
Railroad electrification (scenario B) With locomotives at $240/hp 3.19 3.95 2.01 With locomotives at $300/hp 3.41 3.20 2.41
Liquid-coal plants (50 000 bbl/day) At $1.8 billion/plant (20-year life) 2.65 2.92 4.47 At $2.5 billion/plant (20-year life) 3.69 4.05 6.22 At $2.5 billion/plant (40-year life) 3.42 3.58 5.05
37
uid-coal plant is relatively constant over time. However, the estimates vary in value from $7. 60/bbl {.?_) to costs well above $10. OD/bbl <.U.I. For electrification, the operating or variable cost applied will be the difference between the maintenance of the diesel locomotive and that of the electric locomotive plus its catenary. Because of the lower maintenance costs of the electric locomotive, this element of variable cost for the railroad is negative. It is assumed that all other variable railroad costs remain the same as those for the baseline diesel system.
The feedstock for the synthetic-fuel plant is coal; for the electrified rail, it is the electricity delivered to the railroad substation. Data from liquid-coal plants indicate that about 22 000 tons/day are required to produce 51 000 bbl/day of fuel oil equivalent <.U.I. As previously indicated, about 12 kW•h are needed to produce the same effect at the rail as 1 gal of fuel; thus 1 bbl/day is equivalent to 504 kW•h/day. At $0.04/kW•h, the electricity to save one barrel of oil costs $20.52/bbl, whereas by using coal at $22.50/ton, it costs $9. 70 to produce one barrel of oil. To compare the write-off of the capital investment over time, identical capital cha·rge rates are used for both the liquid-coal plants and the railroad. They are based on 45 percent debt at 15 percent interest and 55 percent equity funding at 20 percent return on equity.
Table 4 shows that the minimum pr ice per barrel of oil produced by an operating mature synthetic-fuel plant is about $42. Estimates of the delivered price range from $48 to $55/bbl. The price of fuel saved from operating a 1000-mile segment of electrified single or double track varies according to the gross tonnage carried. With no future growth, the pr ice per bar rel for a doublet rack road carrying 80 million gross tons is $35.
Figure 3 shows the equivalent price of diesel fuel saved for varying annual tonnage. Figure 4 compares several fuel options and clearly indicates that electrification is already competitive (14-16). Also shown is the estimate of cost per barrel of petroleum that would be saved by electrifying the Southern Railway route from Cincinnati to Atlanta. For traffic of 80 million gross tons with an 11 percent annual capital charge rate, that cost appears to be about $26/bbl of oil saved.
Energy Efficiency
The comparison of alternatives is not complete without a review of anticipated efficiencies. The relative efficiencies for supplying refined fuels from crude oil, shale oil, and the several coal liquefaction processes range from about 0.9 to 0.7. As technologies develop, that efficiency may improve; however, compared with that of petroleum {0.85-0.95), efficiency of synfuel technologies will always be considerably less <.U.1 .
Figure 5 shows that an electrified rail system that uses electricity from a utility fueled by coal has about the same efficiency for energy delivered to the track as does a diesel-electric locomotive that operates on diesel fuel from crude petroleum (16). When coal is turned into synthetic crude, hD;ever, there is a sizable reduction in energy efficiency. Furthe~ efficiency benefits accrue to the electric system from reduced locomotive weights {provided there is adequate adhesion) and from the potential of relatively easily obtained regeneration for start-stop operation and travel on hilly terrain. A study by Carnegie-Mellon University {.!21 shows a possible 9 percent improvement on the Harrisburg-Pittsburgh route of the Consolidated Rail

38 Transportation Research Record 802
Table 4. Technology specifications.
Capital Cost ($) Operating Cost($)
Coal Liquids (Mature Liquid-Coal Plant)
2.5 billion per 50 000-bbl/day capacity
Railroad Electrification
800 000/double-track mile 500 000/single-track miled
IO/bbl
800/million trailing ton miles savings 4400/double-track mile catenary maintenance cost 2500/single-track mile catenary maintenance cost
Feedstock Cost ($/bbl)
20.16°
Construction Time (years)
3<
3/segment
Debt Life (years)
16c
20
Useful Life (years)
20
30+
Minimum Price per Barrel of Oil"($)
42 (48-55)
~Amortization r.uo fU 0.163 (45 porccinl debt at l 5 percent interest and SS percent equity at 20 percent return on equity), Coal at $22.50/10 11 :: 0.43 lOn/bl>I of .synthetic diesel fu~I.
c Backus, Gr~cttC, tmtl MM-.,vic:c ~ p. 51).
dLess locomotive copltal savings. e 504 kW·h at $0.04/kW·h.
Figure 3. Price of fuel saved versus annual traffic.
10 0
80
60
40
20
40 60 80 100
Annual Diesel Gross Tons (millions)
Figure 4. Costs of oil saved or produced by various fuel options.
Average
Domestic Crude Oil
Imported Crude Oil (Landed Price)
Oil Shale
Coal Liquids
Biomass Liquids
Rail Electrification
Single Track
t ($6.35-+ $39.0B May 19BO) 11.fil
Saudi llrabia
t ~ay 1980\'I
~~" \\\\\] (19_)
~~~'\\\\\\\)(HJ
= 7~\\\ss~\\\\•o"\\ \\\\\\\\Jo~ MGT 1i&.>
Double Track )10'\\:lo \&.~o\'§\~\\ ss\\\~\\\\\\\\40\\.'\..\\\\_ "~~\\\~\"4~ =.~GT <lfil
Southern
( Cincy-Atl) A (BO MGT/year)
20 30 40 50 60 70
Dollars per Barrel (1980 dollars)
BO
MGT million gross tons per day
90 100

Transpor tat i o n Re s ea rch Reco rd 802 3 9
Figure 5. Relative efficiencies of fre ight movement by using petroleum and coal.
CRUDE OIL COAL
Recovery & Transport Recovery & Transport
I
' + i IJ[IJ Refining, DistributiDn
Liquefaction of Coal
Generate Electricity
10.s-o. 11
+ + Refining, Distribution Transmission 1
Distribution of Die sel Fuel
I .-~ Diesc I Engine ~
+ Substation,
Caten3ry
~ + Electric Generator
Power De] i vered to Tr eck
Trai l ing/Gross Ton Ratio
IQ.871 ~
lo.13- o.18 1
+ Tr[lction Motor, Controls
i----Power Delivered ~
to Track
+ Trailing/Gross
lo. Bo* I Ton Ratio
' Gain due to [@! Regeneration - - -- - - --Overall 0.21 0.11-0.15 0 . 24 Efficiency for Trailin g Tons Pulled
P resent Diesel
Corporation (Conrail) . If we discount somewhat for. national average, 5 percent is assumed for regeneration improvement.
In addition, the energy lost from the diesel is lost to the outside air. However, for the electric-generating plant it is possible to improve efficiency by using the lost heat for cogeneration. Although the diesel-electric locomotive efficiency is now being improved, the theoretical limits on the efficiency of the internal-combustion engine would still place it well below an electric-generation plant with known cogeneration potential.
Technological and Environmental Risks
With more than 62 000 route miles of electrified railway in the world today, there is no apparent technological risk. However, there are no commercial-scale processes that now exist to provide coal liquids directly. (The Exxon Donor-Solvent SCRII, catalytic hydrogenation, and several other processes have been developed, but only on a pilot scale.) Low-efficiency indirect liquefaction techniques, such as the Fischer-Tropsch process, have been developed and are in use in South Africa (SASOL plants). Methanol can also be produced from coal gases by using known technologies; however, the conversion of methanol to transportation fuel has only been accomplished on a small-scale basis with the Mobil zeolite process (13) •
Environmental and societal impacts exist for all the options; however, most electrification effects are known and are not severe when compared with those from synthetic-fuel development. New liquid-coal plants and above-ground retorting of shale require significant amounts of water from a limited or distant supply. The influx of workers to staff
Synthetic Fuel Electrification
*Manifest Service
new synfuel plants in the West will create the need for new towns, which will require both services and land. There are potential health hazards to workers in coal-liquefaction plants from handling the toxic and carcinogenic products and byproducts.
Although the additional electricity needed to power locomotives will increase power-plant pollutants, the pollution source is stationary rather than mobile, which makes environmental control much easier. As far as noise and emissions are concerned, electrified railroads are much quieter than their diesel-powered counterparts. Deterrents to rail electrification may be the aesthetic effect (disruption of the landscape by the catenary), the increased number of transmission lines, or the minor (but real) safety hazard represented by the miles of exposed catenary.
SOME FINANCIAL CONSIDERATIONS
The intent of a financial discussion is to briefly examine the investment in its relationship to the energy question. A present-value analysis has been performed by using the weighted cost of capital in 1980 dollars. This approach, which accounts directly for the percentage of equity in electrification, the desired return on equity, the interest rate on commercial loans for electrification, and the tax rate (which reduces the interest cost) , is used to evaluate the cost-effectiveness of the present worth of the investment.
Analysis shows that the average annual rate of return, even with no growth in freight and with minimum anticipated increase in fuel prices of 1 percent per year, is more than 13 percent even for the most ambitious sce nario (C), which earns the lowest amount. The average annual pretax rate of

40
return, shown in Figure 6, is sensitivP to freight growth and fuel-escalation approaches but relatively insensitive to the network scenarios. One tuel-escalation rate, reflective of some current views of t he fuel-price incre ase, predicts the increase in the real price of fuel to $3. 00/gal in 10 years followed by a slow growth to $4.00 in 50 years. In each case, electricity price growth is held constant at 1 percent in real terms.
For the annual freight growth of 2 percent, there is a general and substantially significant high average rate of return over the 50-year period. The difficulty is time phasing the investment and return. At the investment cos ts given, electrification of the Los Angele s -Chicago route, on which fuel savings can be very great, can take up to 6 years and will cost from $1. 5 to $2 billion. This significant sum is the equivalent of the 1978 sales and about 15-20 times the 1978 profit of the Santa Fe
Figure 6. Rate of return versus freight growth for three fuel-escalation scenarios.
Transportation Research Record 802
Railroad (one of the more economically healthy railroads in the nation) .
One financing approach would be to set up an investment company, which might be called the Corporation for Rail Electrification (CORE). CORE would provide the investment for the fixed plant and then lease it to the railroad at a predetermined rate, perhaps based on a computed value of fuel saved or electricity used. The railroad would buy the electric locomotives as well as operate and maintain the system once built. Figure 7 plots the equivalent return to the railroad and cost to CORE as a function of fuel saved for the assumptions indicated. If CORE adds a charge of 20 percent of total expense for management plus profits and a lease charge of $45/ bbl of fuel saved, or about $0.09/kW•h used, the net present value becomes positive about the middle of the 17th year.
Diesel Fuel Price Escalation
9250-mile network 37000-mile network
45
40 E-< z µ:) :<: E-< 35 Ul µ:) .µ > c z QJ H U
z H 30 QJ 0
"" z "' ::i 25 E-< µ:)
"' 20
15
---
0 2
ANNUAL FREIGHT GROWTH
I To $3(1 0 yr.)
- - the n t o $4 ---- (50 yr.)
3 %/yr .
1%/yr.
Figure 7. Cost per barrel to CORE versus railroad savings per barrel .
140
120 .... QJ 100 .. H
"' "' 80 ' Ul ... "' 60 ... ... 0 0 40
20
0 10 15 20
Year
/\ssumptions: • Scenario B • 2% annual freight growth • 3% annua 1 diese 1 fue 1
price growth • 20% Equity (20% return) • 80% Debt (15 % interest)
Railroad Savi11gs per Barrel
~~ CORE'S Charge per Barrel
CORE's Cost per Barrel (includes management fee of 20% total expense)
25 30

Transportation Research Record 802
SUMMARY
If we assume continued escalation of diesel fuel prices and of freight growth, electrification, which has a positive return on investment, is becoming more attractive than ever. For rail routes that carry heavy traffic, rail electrification provides a technologically available system that is extremely competitive with petroleum costs.
Since more than 200 000 miles of track are in use, the railroads will continue to rely on liquid fuels for their medium-density and low-density operation. With freight growth, electrification of high-density lines will be necessary if the railroads wish to maintain their present level of diesel fuel use. Detailed questions of cost, appropriate financing, and industry profitability remain to be answered; segments to be electrified will need to be rationalized and utility interface issues resolved.
Since it saves liquid fuel at a competitive or lower cost than supplying the equivalent synthetic fuel and since it is an existing technology, electrification should receive priority as a national investment equal to that given to synthetic fuels and other conservation options.
ACKNOWLEDGMENT
Special thanks go to Jon Habegger, a Purdue University graduate student, whose interest in railroads and capability in computer programming were instrumental in achieving these results.
REFERENCES
1. An Evaluation of the Costs and Benefits of Railroad Electrification. Federal Railroad Administration, U.S. Department of Transportation, July 1977.
2. C.H. Spenny. An Update of the Costs and Benefits of Railroad Electrification. Federal Railroad Administration, U.S. Department of Transportation, Rept. PM-742-C-14-83, April 8, 1980.
3. J. Fraser and others. Developing a Methodology for Evaluation Alternatives for Reducing Petroleum Use in Transportation. Automotive Transportation Center, Purdue Univ., West Lafayette, IN, May 1980.
4. C.G. Swanson, V.D. Nene, R. Martin, and M. Lenard. The Energy and Environmental Impact of Railroad Electrification. Mitre Corporation, McLean, VA, Tech. Rept. MTR-7594, Sept. 1977.
5. A Prospectus for Change in the Freight Railroad Industry. U.S. Department of Transportation, Oct. 1978.
41
6. F.L. Raposa and C.H. Spenny. Cost Effectiveness of Research and Development Related to Railroad Electrification in the United States. Federal Railroad Administration, U.S. Department of Transportation, Rept. FRA-ORD-77-62, Dec. 1977.
7. National Transportation Policies Through the Year 2000. National Transportation Policy Study Commission, Washington, DC, Final Rept., June 1979.
8. E.G. Schwarm. Engineering Cost Data Analysis for Railroad Electrification. Arthur D. Little, Inc., Cambridge, MA, Final Rept., Oct. 1976.
9. Intermodal Freight Program: Phase II--Demonstration Management. Federal Railroad Administration, U.S. Department of Transportation, Rept. FRA/ORD/69, July 1980.
10. R.K. White and others. Railroad Electrification in America's Future: An Assessment of Prospects and Impacts. SRI International, Menlo Park, CA, Center for Resource and Environmental System Studies Rept. 97, July 1979.
11. R.H. Shackson and H.J. Leach. Maintaining Automotive Mobility: Using Fuel Economy and Synthetic Fuels to Compete with OPEC Oil. Energy Productivity Center, Mellon Institute, Arlington, VA, Aug. 18, 1980.
12. G.A. Backus, J.R. Greene, FOSSIL79: Documentation. Center, Dartmouth College, DSD 166, Vol. 3, Aug. 1979.
and A. Masevice. Resource Policy
Hanover, NH, Rept.
13. R.E. Goodson and others. A Discussion Paper on Shale Oil and Coal Liquids and Their Use as Transportation Fuels. Automotive Transportation Center, Purdue Univ., West Lafayette, IN, Sept. 15, 1979.
14. J. Fraser and others. An Overview of Selected Alternatives for Reducing Transportation's Dependence on Imported Petroleum. Automotive Transportation Center, Purdue Univ., West Lafayette, IN, Rept. DOT-ATC-80-10, Nov. 12, 1980.
15. Monthly Energy Review. U.S. Department of Energy, Sept. 1980.
16. R.K. Whitford. Railroad Electrification: An Option for Petroleum Savings. Automotive Transportation Center, Purdue Univ., West Lafayette, IN, Aug. 1980.
17. J.E. Pastaret and R.A. Uher. Energy Savings of Regeneration on a Proposed Electrified Railroad between Harrisburg and Pittsburgh. CarnegieMellon Univ., Pittsburgh, PA, June 1977.
Publication of this paper sponsored by Committee on Rail Electrification Systems.
Energy Considerations for Railroad Electrification
in the United States
HAL B.H. COOPER, JR., AND CATHERINE A. WEBB
Minimum, medium, and maximum railroad electrification networks that consist of 10 000, 26 000, and 42 000 route miles, respectively, have been proposed for the nation. These systems are based on projected future levels of
freight traffic, which will be sufficient to justify future railroad-electrification projects. Energy and environmental impacts plus an economic analysis are presented that relate to both costs and benefits of national railroad electrifica-