application of psychoacoustics on the machinery noise...
TRANSCRIPT
Application of Psychoacoustics on the Machinery Noise Emission of Gear
Transmissions
Christian Brecher, Markus Brumm, Christian Carl
Chair of Machine Tools, Laboratory for Machine Tools and Production Engineering (WZL), RWTH Aachen
University, Email: [email protected], [email protected], [email protected]
Introduction and objectives Acoustic quality of powertrains becomes increasingly
important for the customers' acceptance. The gear
transmission is one main functional and acoustic component
in stationary (e.g. wind turbines) or mobile (e.g. vehicles)
machinery. These systems are confronted with trends like
lightweight design or the reduction of masking soundscapes.
Therefore, high acoustic quality of the gear transmission is
strongly demanded in order to meet the acoustic
requirements of the machinery system. But a complete
avoidance of gearbox noise often can not be achieved by
reasonable means. Consequently, increased acoustic quality
needs to be achieved by reduction of perception related
annoyance, which can be determined by psychoacoustic
metrics. But there is only insufficient knowledge about the
correlation between the physical excitation in the gear mesh
and the psychoacoustic rating of the radiated noise [1].
This paper discusses the application of psychoacoustics on
machineacoustic signals of gearbox noise. This incorporates
excitation, surface vibration and air-borne noise. Therefore,
two different gearsets, which differ in their manufacturing
quality and hence in their excitation, are investigated
experimentally regarding the psychoacoustic evaluation.
Furthermore, the application of FRFs is discussed to predict
the noise emission theoretically. Finally, correlation analyses
show possibilities of transfer psychoacoustics to the gear set
excitation that represents a foundation for the gear
transmission design process.
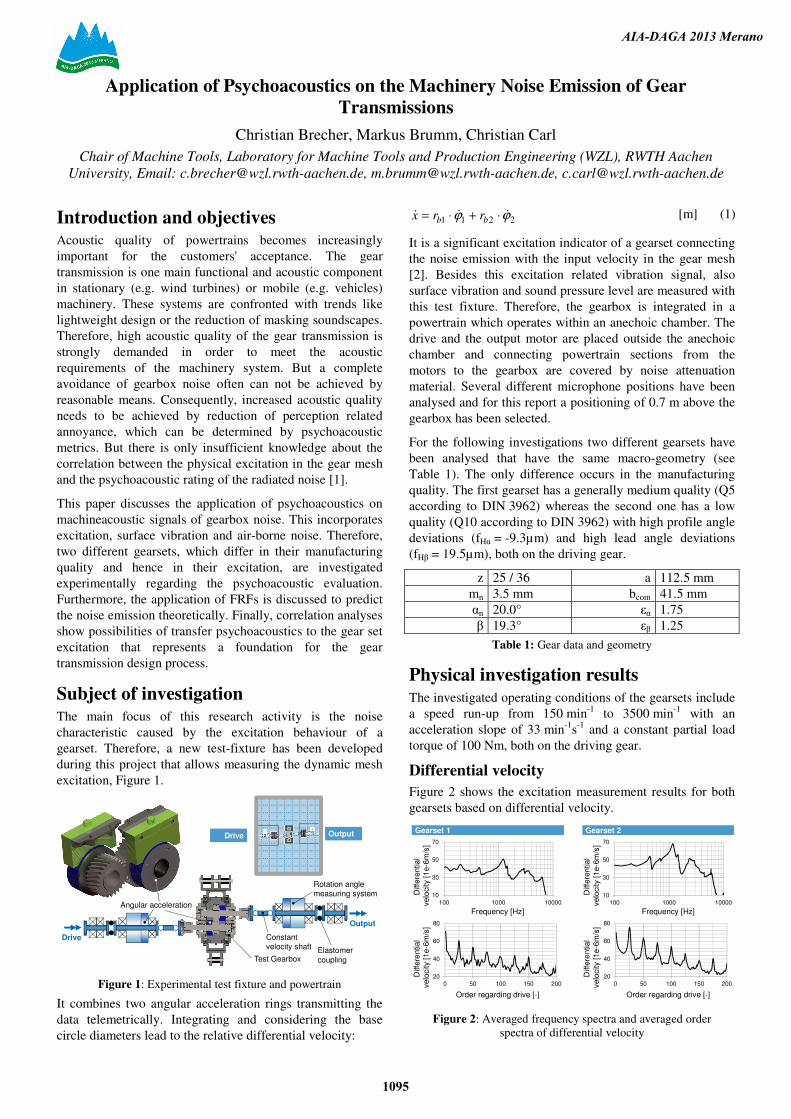
Subject of investigation The main focus of this research activity is the noise
characteristic caused by the excitation behaviour of a
gearset. Therefore, a new test-fixture has been developed
during this project that allows measuring the dynamic mesh
excitation, Figure 1.
Drive
Output
Elastomer
coupling
Constantvelocity shaft
Angular acceleration
Rotation angle measuring system
Test Gearbox
Drive Output
Figure 1: Experimental test fixture and powertrain
It combines two angular acceleration rings transmitting the
data telemetrically. Integrating and considering the base
circle diameters lead to the relative differential velocity:
2211 ϕϕ &&& ⋅+⋅= bb rrx [m] (1)
It is a significant excitation indicator of a gearset connecting
the noise emission with the input velocity in the gear mesh
[2]. Besides this excitation related vibration signal, also
surface vibration and sound pressure level are measured with
this test fixture. Therefore, the gearbox is integrated in a
powertrain which operates within an anechoic chamber. The
drive and the output motor are placed outside the anechoic
chamber and connecting powertrain sections from the
motors to the gearbox are covered by noise attenuation
material. Several different microphone positions have been
analysed and for this report a positioning of 0.7 m above the
gearbox has been selected.
For the following investigations two different gearsets have
been analysed that have the same macro-geometry (see
Table 1). The only difference occurs in the manufacturing
quality. The first gearset has a generally medium quality (Q5
according to DIN 3962) whereas the second one has a low
quality (Q10 according to DIN 3962) with high profile angle
deviations (fHα = -9.3µm) and high lead angle deviations
(fHβ = 19.5µm), both on the driving gear.
z 25 / 36 a 112.5 mm
mn 3.5 mm bcom 41.5 mm
αn 20.0° εα 1.75
β 19.3° εβ 1.25
Table 1: Gear data and geometry
Physical investigation results
The investigated operating conditions of the gearsets include
a speed run-up from 150 min-1
to 3500 min-1
with an
acceleration slope of 33 min-1
s-1
and a constant partial load
torque of 100 Nm, both on the driving gear.
Differential velocity
Figure 2 shows the excitation measurement results for both
gearsets based on differential velocity.
20
40
60
80
0 50 100 150 20020
40
60
80
0 50 100 150 200
10
30
50
70
100 1000 10000
10
30
50
70
100 1000 10000
Gearset 1 Gearset 2
Diff
ere
ntial
velo
city [
1e-6
m/s
]
Frequency [Hz] Frequency [Hz]
Order regarding drive [-] Order regarding drive [-]
Diff
ere
ntial
velo
city [
1e-6
m/s
]
Diff
ere
ntial
velo
city [
1e-6
m/s
]
Diff
ere
ntial
velo
city [
1e-6
m/s
]
Figure 2: Averaged frequency spectra and averaged order
spectra of differential velocity
AIA-DAGA 2013 Merano
1095
The upper diagrams represent the averaged frequency
spectra and the lower ones show the averaged order spectra
referring to the driving speed. Both frequency spectra show a
comparable powertrain resonance behaviour with a
significantly higher excitation for the second gearset. This
can also be found in the order spectra, where both gearsets
show distinct contributions in the mesh order and its higher
harmonics.
Sound pressure
In Figure 3 a comparison of the averaged sound pressure
spectra is documented. Both gearsets show again a
comparable frequency spectrum for this signal. But certain
frequency regions, especially between 1kHz and 2kHz, are
more dominantly excited by the second gearset. That is
where the gear noise meets transfer-path resonances and
trespass the remaining air-borne noise threshold.
20
30
40
50
60
70
100 1000 10000
30
40
50
60
70
80
0 50 100 150 20030
40
50
60
70
80
0 50 100 150 200
20
30
40
50
60
70
100 1000 10000
Gearset 1 Gearset 2
Sound p
ressure
level [2
e-5
Pa]
Frequency [Hz] Frequency [Hz]
Order regarding drive [-] Order regarding drive [-]
Sound p
ressure
level [2
e-5
Pa]
Sound p
ressure
level [2
e-5
Pa]
Sound p
ressure
level [2
e-5
Pa]
Figure 3: Averaged frequency and order spectra for sound
pressure level
A similar conclusion can be found in the order spectra.
While the first gearset shows only low order contribution
that do not peak out of the spectrum significantly, the second
gearset is tonally dominant in the noise spectrum, especially
in the gear mesh order and its next harmonics.
Signal synthesis approach One objective of this report is understanding the correlation
of the noise characteristics between gear mesh excitation and
the emitted gearbox noise. The letter one can be separated
into contributions from the gearset and contributions
uncorrelated to that, called remaining noise in the following.
If it is possible to draw a connection between the gearset
excitation, described by differential velocity, and the emitted
sound pressure, it is possible to synthesize the gear noise
emission from a given excitation signal.
This objective can be reached by a two step approach. First a
frequency response function is determined between
differential velocity and sound pressure by the H1-method
that compensates mainly uncorrelated noise in the output:
( )( ) ( )[ ]( ) ( )[ ]ωω
ωωω
jxconjjx
jxconjjpjH
&&
&
⋅
⋅=1 [Pa/(m/s)] (2)
In the second step the uncorrelated noise proportion can be
determined by removing the correlating signal contributions
from the measured sound pressure signal. This procedure
allows than a resynthesis of the gear noise by applying the
transfer function on a measured or calculated differential
velocity signal and adding the remaining noise.
( ) ( ) ( ) ( )ωωωω jxjHjpjprest&⋅−= 1 [Pa] (3)
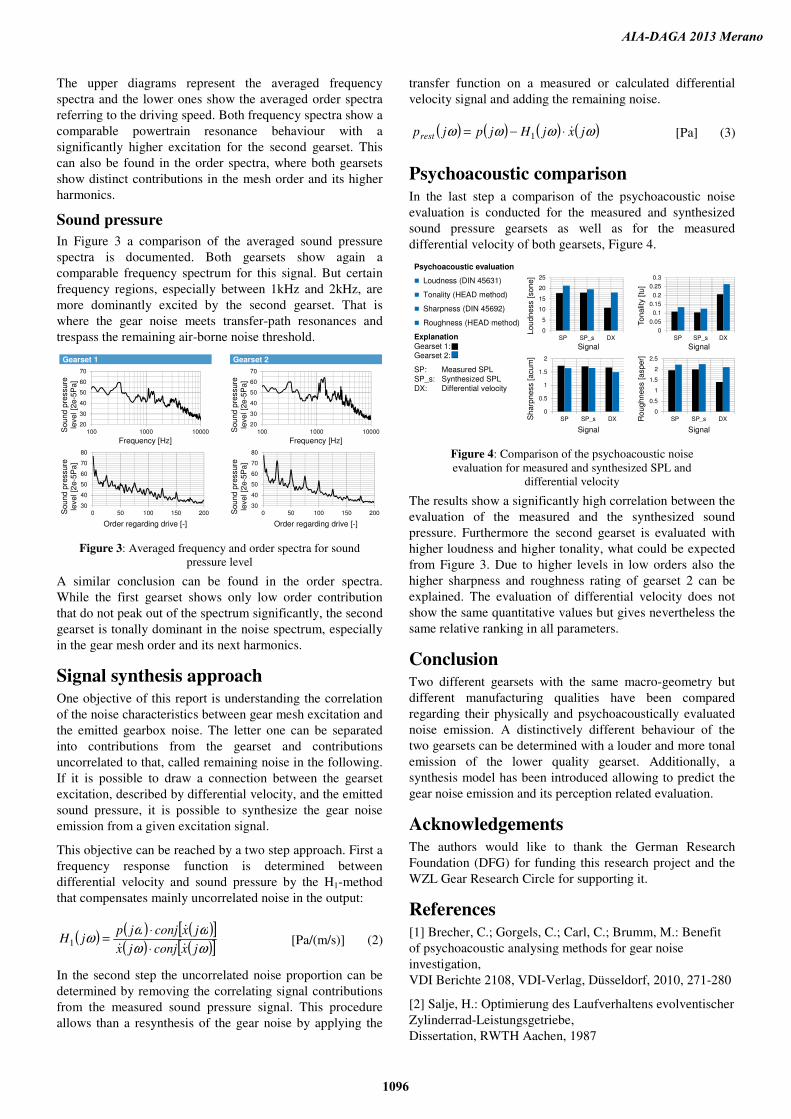
Psychoacoustic comparison
In the last step a comparison of the psychoacoustic noise
evaluation is conducted for the measured and synthesized
sound pressure gearsets as well as for the measured
differential velocity of both gearsets, Figure 4.
0
5
10
15
20
25
SP SP_s DX
0
0.05
0.1
0.15
0.2
0.25
0.3
SP SP_s DX
0
0.5
1
1.5
2
SP SP_s DX
0
0.5
1
1.5
2
2.5
SP SP_s DX
Psychoacoustic evaluation
� Loudness (DIN 45631)
� Tonality (HEAD method)
� Sharpness (DIN 45692)
� Roughness (HEAD method)
Explanation
Gearset 1:Gearset 2:
SP: Measured SPL
SP_s: Synthesized SPL
DX: Differential velocity
Lou
dness [
sone]
Signal
Tonalit
y [
tu]
Signal
Sharp
ness [
acum
]
Signal
Roughness [
asper]
Signal
Figure 4: Comparison of the psychoacoustic noise
evaluation for measured and synthesized SPL and
differential velocity
The results show a significantly high correlation between the
evaluation of the measured and the synthesized sound
pressure. Furthermore the second gearset is evaluated with
higher loudness and higher tonality, what could be expected
from Figure 3. Due to higher levels in low orders also the
higher sharpness and roughness rating of gearset 2 can be
explained. The evaluation of differential velocity does not
show the same quantitative values but gives nevertheless the
same relative ranking in all parameters.
Conclusion Two different gearsets with the same macro-geometry but
different manufacturing qualities have been compared
regarding their physically and psychoacoustically evaluated
noise emission. A distinctively different behaviour of the
two gearsets can be determined with a louder and more tonal
emission of the lower quality gearset. Additionally, a
synthesis model has been introduced allowing to predict the
gear noise emission and its perception related evaluation.
Acknowledgements The authors would like to thank the German Research
Foundation (DFG) for funding this research project and the
WZL Gear Research Circle for supporting it.
References
[1] Brecher, C.; Gorgels, C.; Carl, C.; Brumm, M.: Benefit
of psychoacoustic analysing methods for gear noise
investigation,
VDI Berichte 2108, VDI-Verlag, Düsseldorf, 2010, 271-280
[2] Salje, H.: Optimierung des Laufverhaltens evolventischer
Zylinderrad-Leistungsgetriebe,
Dissertation, RWTH Aachen, 1987
AIA-DAGA 2013 Merano
1096