application of gibbs energy minimization to oxygen steelmaking … · 2012-12-04 · application of...
TRANSCRIPT
Application of Gibbs Energy minimization to Oxygen Steelmaking Process
Ajay Kumar ShuklaDepartment of Metallurgical and Materials EngineeringIndian Institute of Technology, MadrasChennai 600036
Prof. Brahma DeoDepartment of Materials and Metallurgical EngineeringIndian Institute of Technology, Kanpur 208016
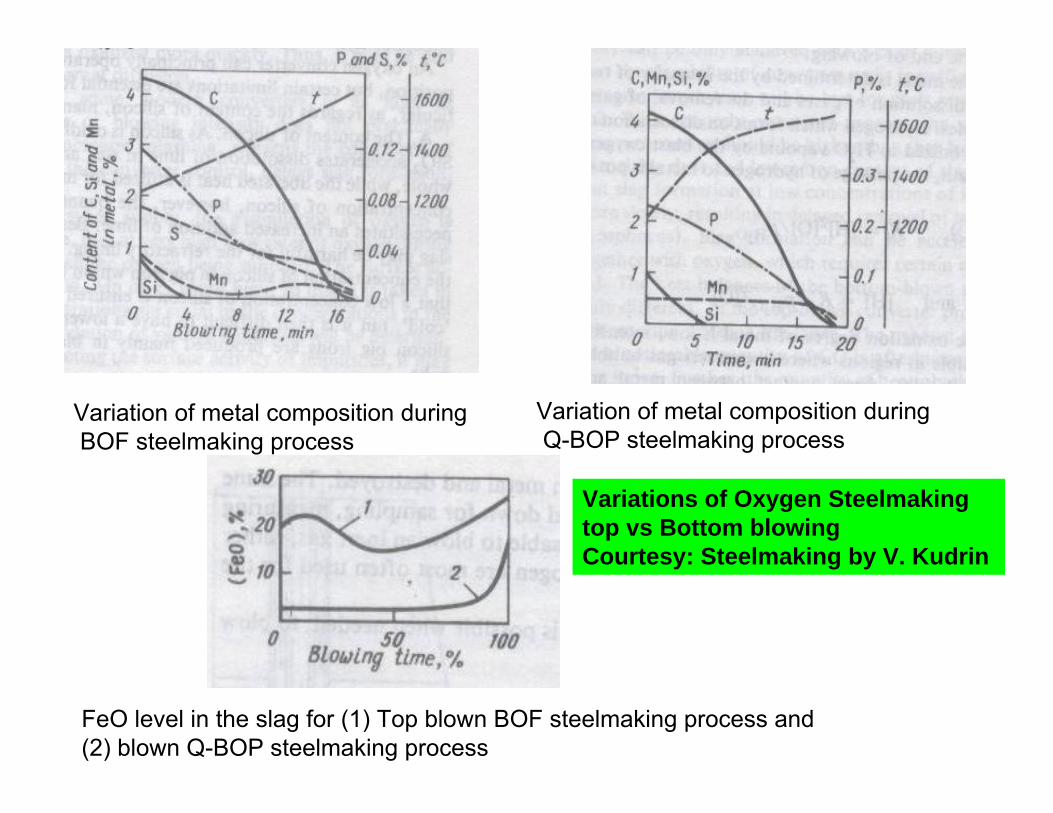
Variation of metal composition duringBOF steelmaking process
Variation of metal composition duringQ-BOP steelmaking process
FeO level in the slag for (1) Top blown BOF steelmaking process and(2) blown Q-BOP steelmaking process
Variations of Oxygen Steelmaking top vs Bottom blowingCourtesy: Steelmaking by V. Kudrin

Sequence of reactions in an oxygen steelmaking system
Liquid metal
Slag +metal droplets+ gas bubbles
Emulsion of metal and slag+ gas bubbles
Gas + droplets of metal + droplets of slag
Gas bubbles
Oxygen supply
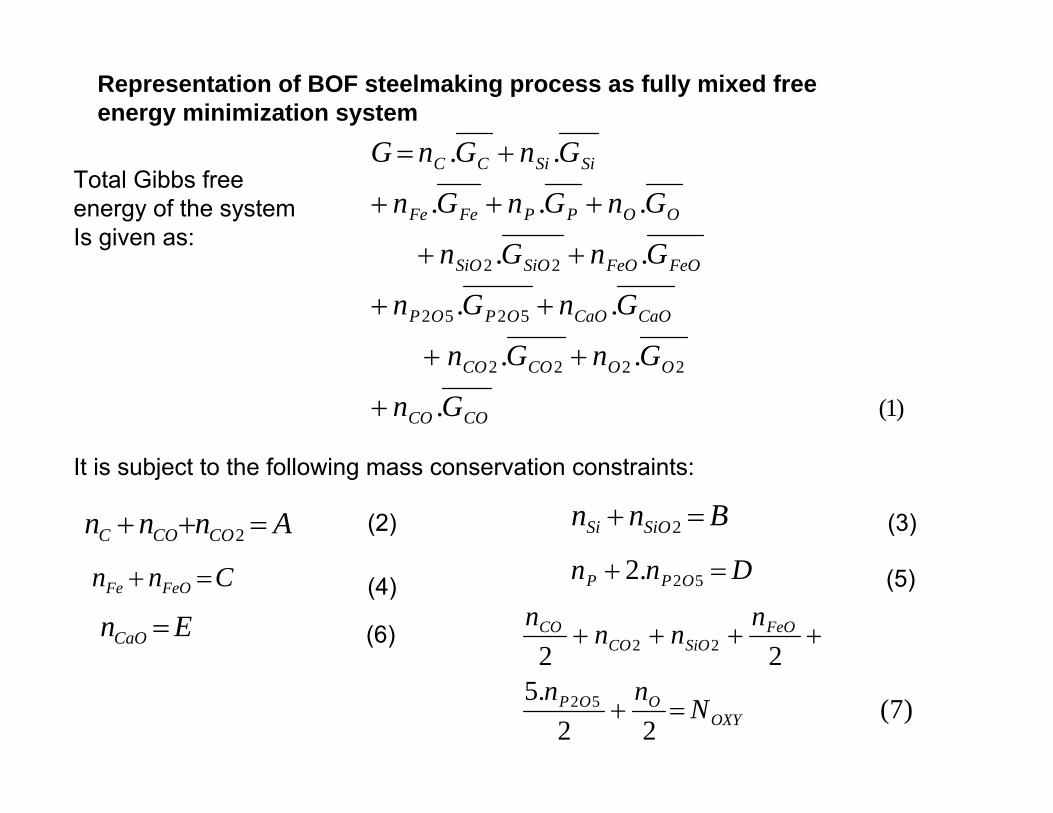
Let the metal phase contain[C], [Si],[P] and [O] in dissolved state.
The slag phase contains CaO, FeO,SiO2 and P2O5.
The gas phasecontains CO,CO2and O2.
)1(.
..
..
..
...
..
2222
5252
22
COCO
OOCOCO
CaOCaOOPOP
FeOFeOSiOSiO
OOPPFeFe
SiSiCC
Gn
GnGn
GnGn
GnGn
GnGnGn
GnGnG
Representation of BOF steelmaking process as fully mixed freeenergy minimization system
Annn COCOC 2Bnn SiOSi 2
Cnn FeOFe Dnn OPP 52.2
EnCaO
(2)
Total Gibbs freeenergy of the systemIs given as:
It is subject to the following mass conservation constraints:
(3)
(4) (5)
(6)
)7(22
.522
52
22
OXYOOP
FeOSiOCO
CO
Nnn
nnn
n
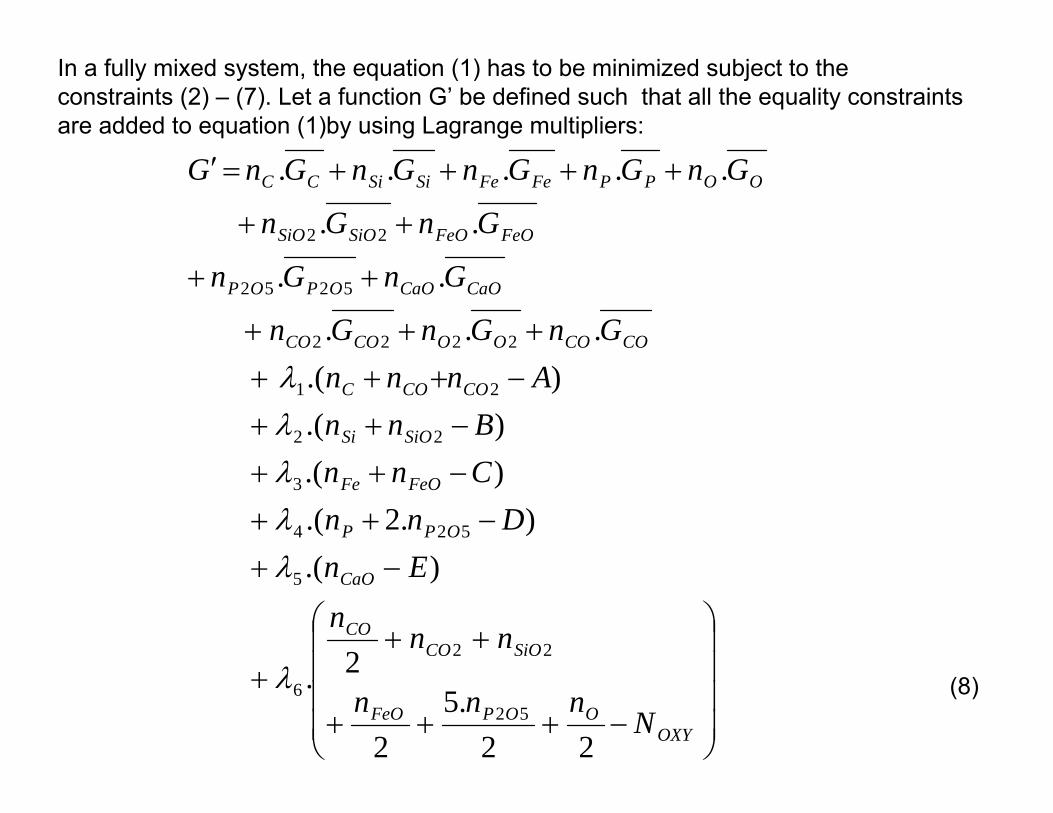
In a fully mixed system, the equation (1) has to be minimized subject to the constraints (2) – (7). Let a function G’ be defined such that all the equality constraints are added to equation (1)by using Lagrange multipliers:
OXYOOPFeO
SiOCOCO
CaO
OPP
FeOFe
SiOSi
COCOC
COCOOOCOCO
CaOCaOOPOP
FeOFeOSiOSiO
OOPPFeFeSiSiCC
Nnnn
nnn
EnDnn
CnnBnn
AnnnGnGnGn
GnGn
GnGn
GnGnGnGnGnG
22.5
2
2.
).().2.(
).().(
).(...
..
..
.....
52
22
6
5
524
3
22
21
2222
5252
22
(8)
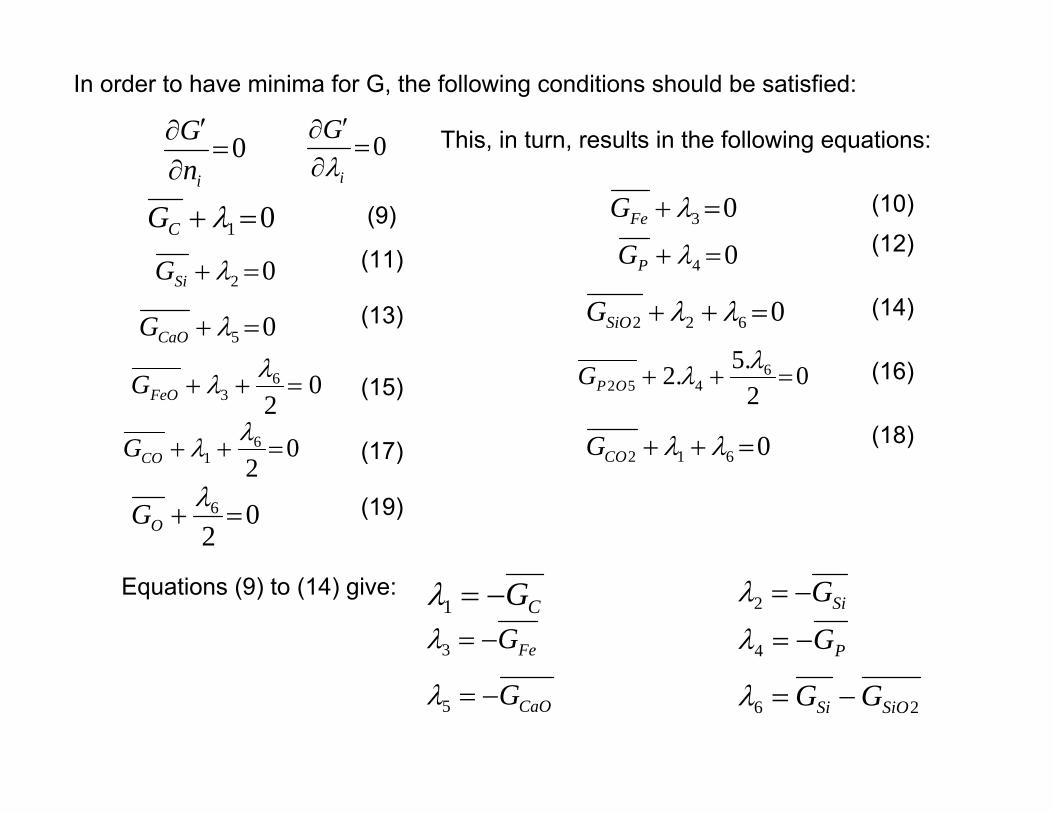
In order to have minima for G, the following conditions should be satisfied:
0
inG 0
i
G
This, in turn, results in the following equations:
01 CG
02 SiG
03 FeG
04 PG
05 CaOG 0622 SiOG
026
3 FeOG 0
2.5.2 6
452 OPG
026
1 COG 0612 COG
026
OG
(9) (10)
(11)(12)
(13) (14)
(15)(16)
(17)(18)
(19)
Equations (9) to (14) give:CG1 SiG2
FeG3 PG4
CaOG5 26 SiOSi GG
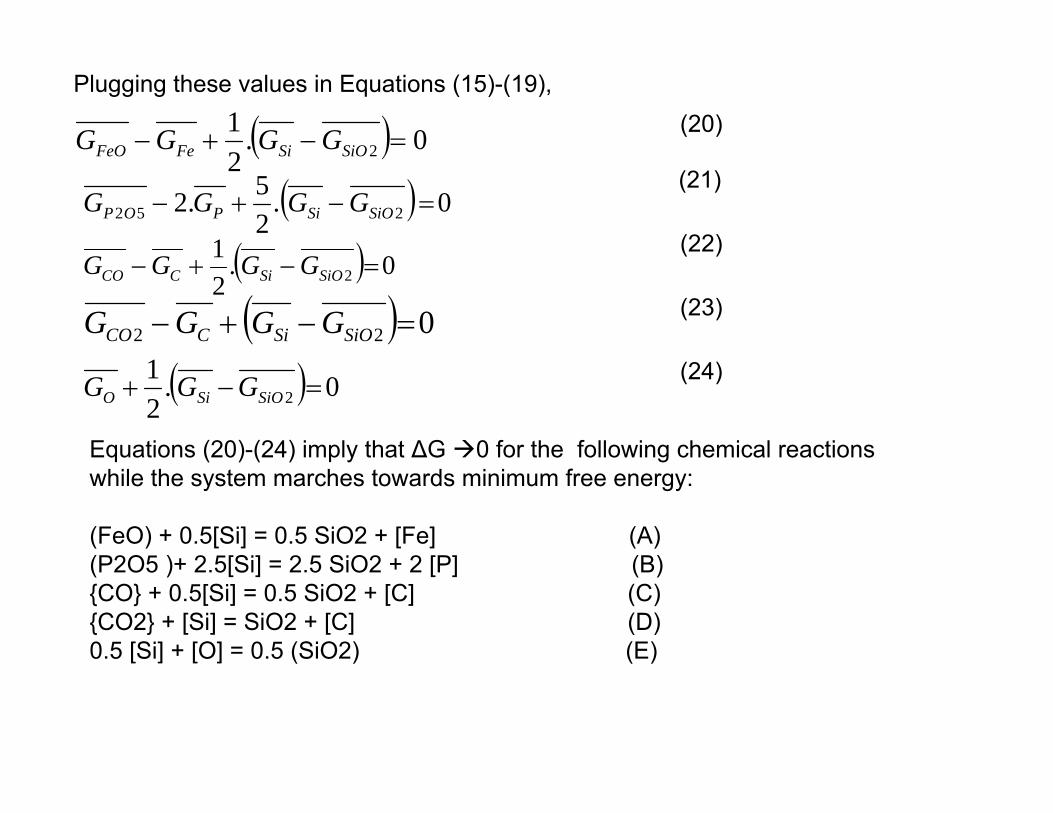
Plugging these values in Equations (15)-(19),
0.21
2 SiOSiFeFeO GGGG
0.25.2 252 SiOSiPOP GGGG
0.21
2 SiOSiCCO GGGG
022 SiOSiCCO GGGG
0.21
2 SiOSiO GGG
Equations (20)-(24) imply that ΔG 0 for the following chemical reactions while the system marches towards minimum free energy:
(FeO) + 0.5[Si] = 0.5 SiO2 + [Fe] (A) (P2O5 )+ 2.5[Si] = 2.5 SiO2 + 2 [P] (B){CO} + 0.5[Si] = 0.5 SiO2 + [C] (C) {CO2} + [Si] = SiO2 + [C] (D) 0.5 [Si] + [O] = 0.5 (SiO2) (E)
(20)
(21)
(22)
(23)
(24)
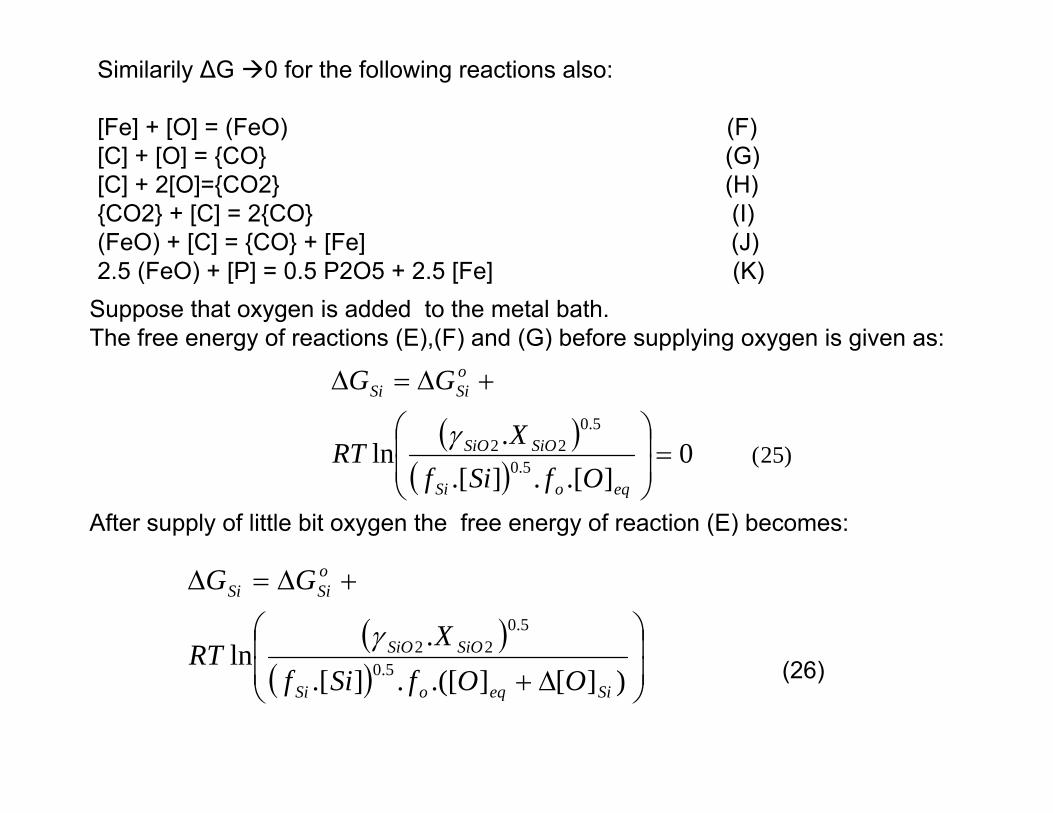
Similarily ΔG 0 for the following reactions also:
[Fe] + [O] = (FeO) (F) [C] + [O] = {CO} (G) [C] + 2[O]={CO2} (H) {CO2} + [C] = 2{CO} (I) (FeO) + [C] = {CO} + [Fe] (J) 2.5 (FeO) + [P] = 0.5 P2O5 + 2.5 [Fe] (K)
Suppose that oxygen is added to the metal bath. The free energy of reactions (E),(F) and (G) before supplying oxygen is given as:
)25(0].[.].[
.ln 5.0
5.022
eqoSi
SiOSiO
oSiSi
OfSifX
RT
GG
After supply of little bit oxygen the free energy of reaction (E) becomes:
)][].([.].[.
ln 5.0
5.022
SieqoSi
SiOSiO
oSiSi
OOfSifX
RT
GG
(26)
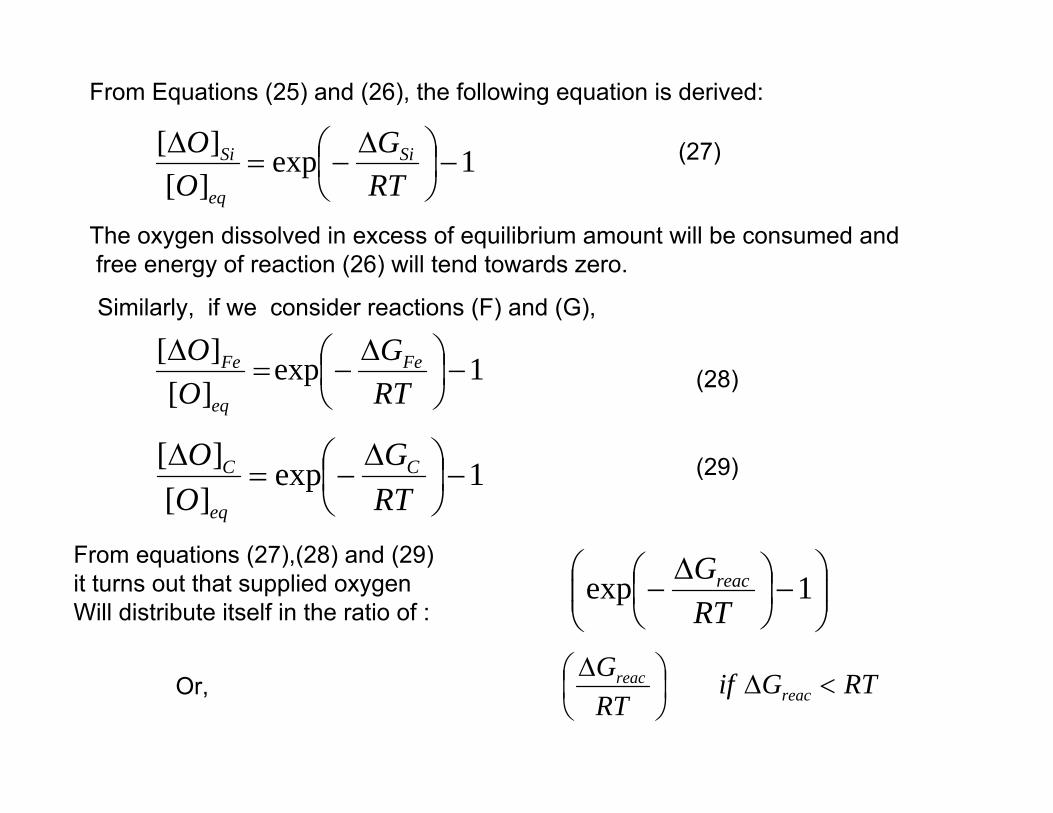
From Equations (25) and (26), the following equation is derived:
1exp][][
RTG
OO Si
eq
Si
The oxygen dissolved in excess of equilibrium amount will be consumed andfree energy of reaction (26) will tend towards zero.
Similarly, if we consider reactions (F) and (G),
1exp][][
RTG
OO Fe
eq
Fe
1exp][][
RTG
OO C
eq
C
(27)
(28)
(29)
From equations (27),(28) and (29)it turns out that supplied oxygenWill distribute itself in the ratio of :
1exp
RTGreac
RTGifRTG
reacreac
Or,
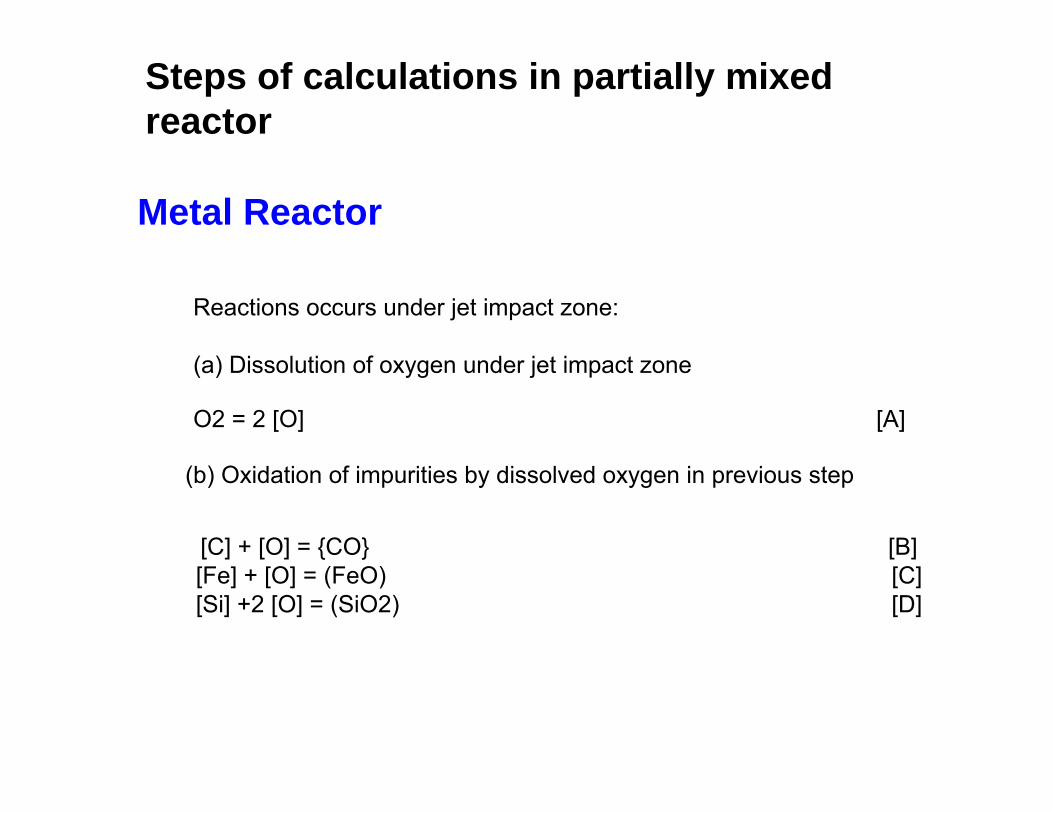
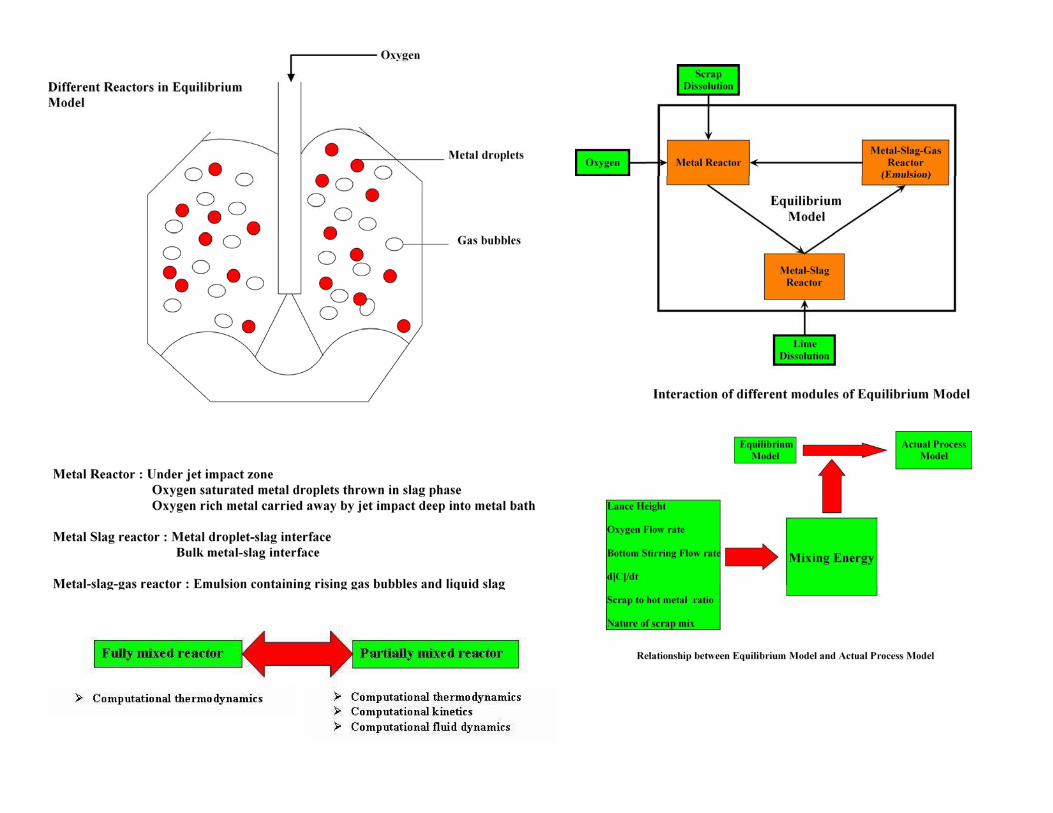
Metal Reactor
Reactions occurs under jet impact zone:
(a) Dissolution of oxygen under jet impact zone
O2 = 2 [O] [A]
[C] + [O] = {CO} [B][Fe] + [O] = (FeO) [C][Si] +2 [O] = (SiO2) [D]
(b) Oxidation of impurities by dissolved oxygen in previous step
Steps of calculations in partially mixed reactor
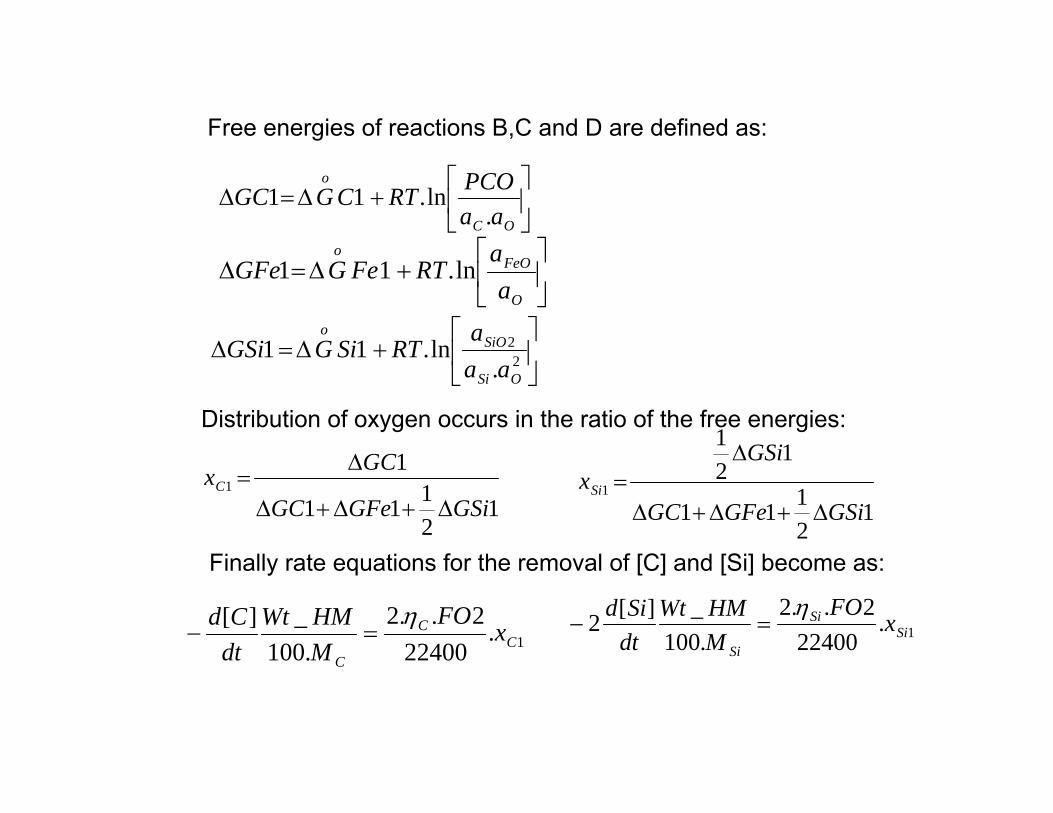
Free energies of reactions B,C and D are defined as:
OC
o
aaPCORTCGGC
.ln.11
O
FeOo
aa
RTFeGGFe ln.11
2
2
.ln.11
OSi
SiOo
aaa
RTSiGGSi
12111
11
GSiGFeGC
GCxC
12111
121
1
GSiGFeGC
GSixSi
Distribution of oxygen occurs in the ratio of the free energies:
1.22400
2..2.100
_][C
C
C
xFO
MHMWt
dtCd
1.22400
2..2.100
_][2 SiSi
Si
xFO
MHMWt
dtSid
Finally rate equations for the removal of [C] and [Si] become as:
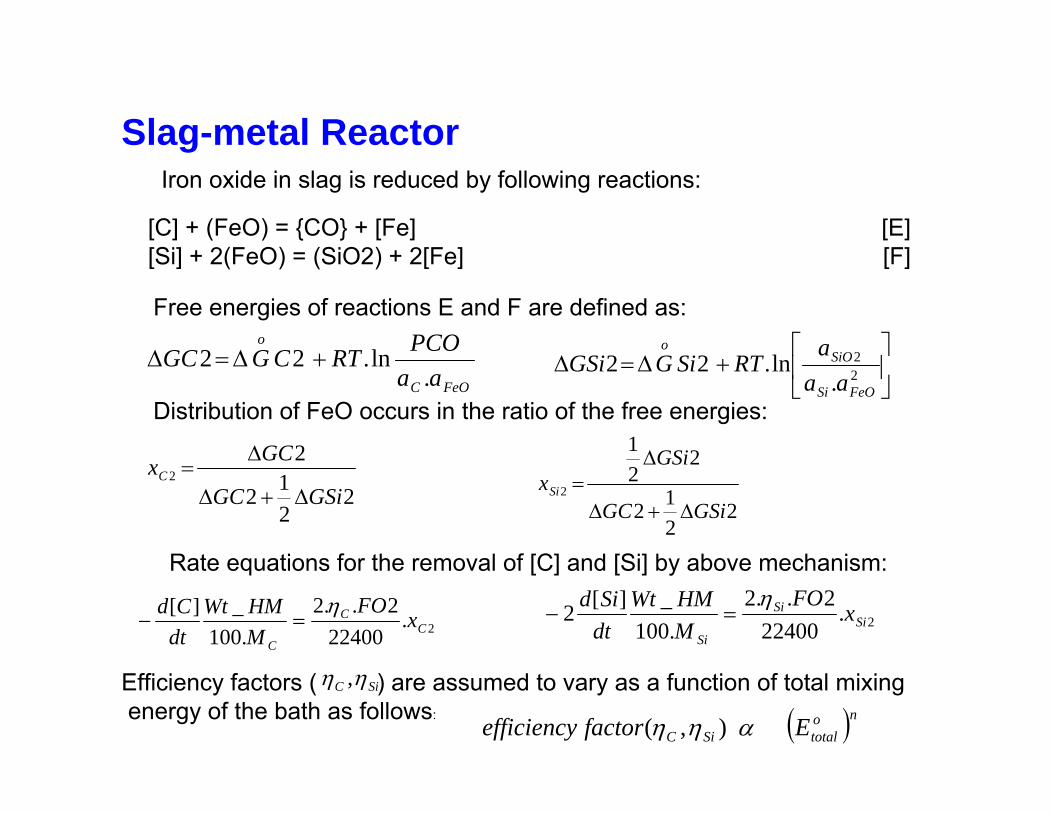
Slag-metal ReactorIron oxide in slag is reduced by following reactions:
[C] + (FeO) = {CO} + [Fe] [E][Si] + 2(FeO) = (SiO2) + 2[Fe] [F]
Free energies of reactions E and F are defined as:
FeOC
o
aaPCORTCGGC.
ln.22
2
2
.ln.22
FeOSi
SiOo
aaa
RTSiGGSi
Distribution of FeO occurs in the ratio of the free energies:
2212
22
GSiGC
GCxC
2212
221
2
GSiGC
GSixSi
Rate equations for the removal of [C] and [Si] by above mechanism:
2.22400
2..2.100
_][C
C
C
xFO
MHMWt
dtCd
2.22400
2..2.100
_][2 SiSi
Si
xFO
MHMWt
dtSid
SiC ,Efficiency factors ( ) are assumed to vary as a function of total mixingenergy of the bath as follows: no
totalSiC Efactorefficiency ),(
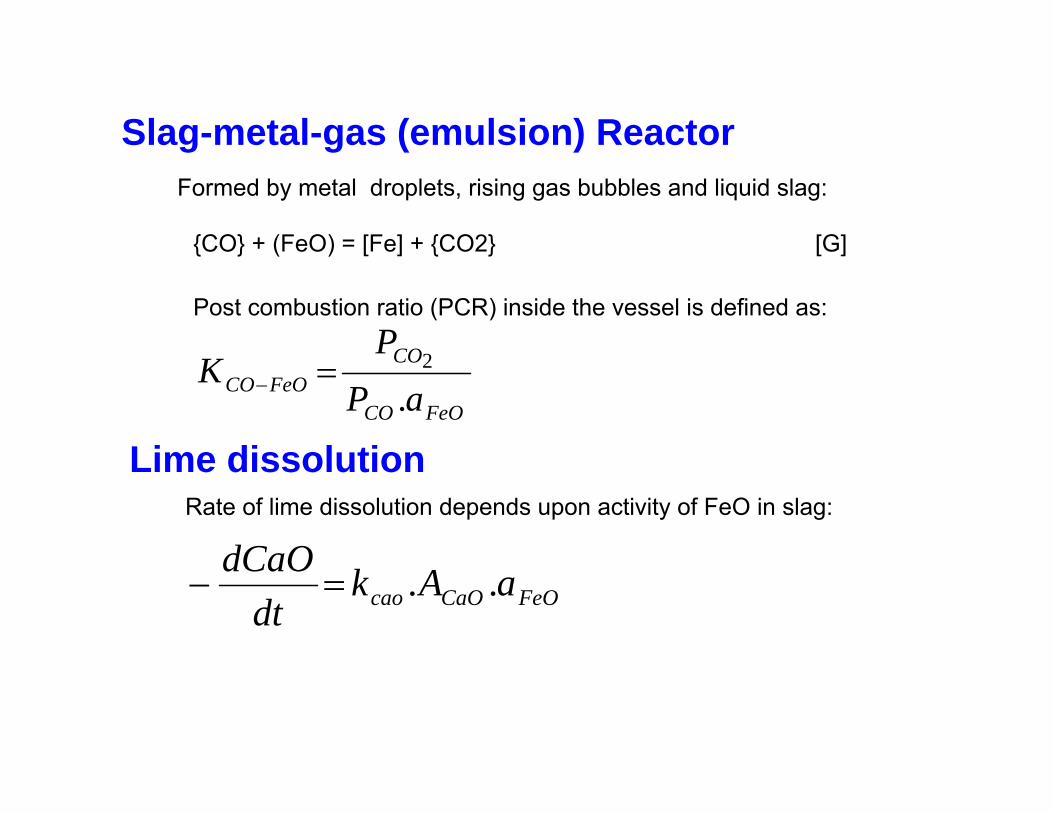
Slag-metal-gas (emulsion) Reactor
{CO} + (FeO) = [Fe] + {CO2} [G]
Formed by metal droplets, rising gas bubbles and liquid slag:
FeOCO
COFeOCO aP
PK
.2
Post combustion ratio (PCR) inside the vessel is defined as:
Lime dissolution
FeOCaOcao aAkdt
dCaO ..
Rate of lime dissolution depends upon activity of FeO in slag:
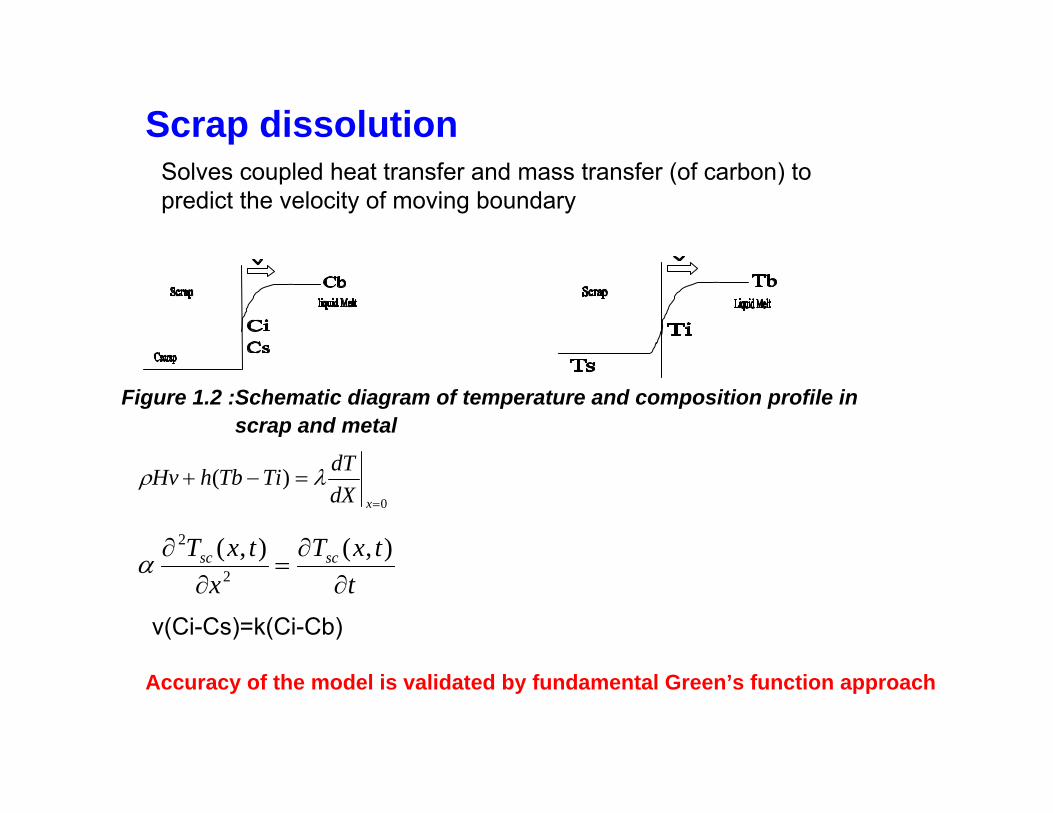
Scrap dissolution
Figure 1.2 :Schematic diagram of temperature and composition profile in scrap and metal
Solves coupled heat transfer and mass transfer (of carbon) to predict the velocity of moving boundary
0
)(
xdX
dTTiTbhHv
ttxT
xtxT scsc
),(),(2
2
v(Ci-Cs)=k(Ci-Cb)
Accuracy of the model is validated by fundamental Green’s function approach

Calculations steps using FactSage
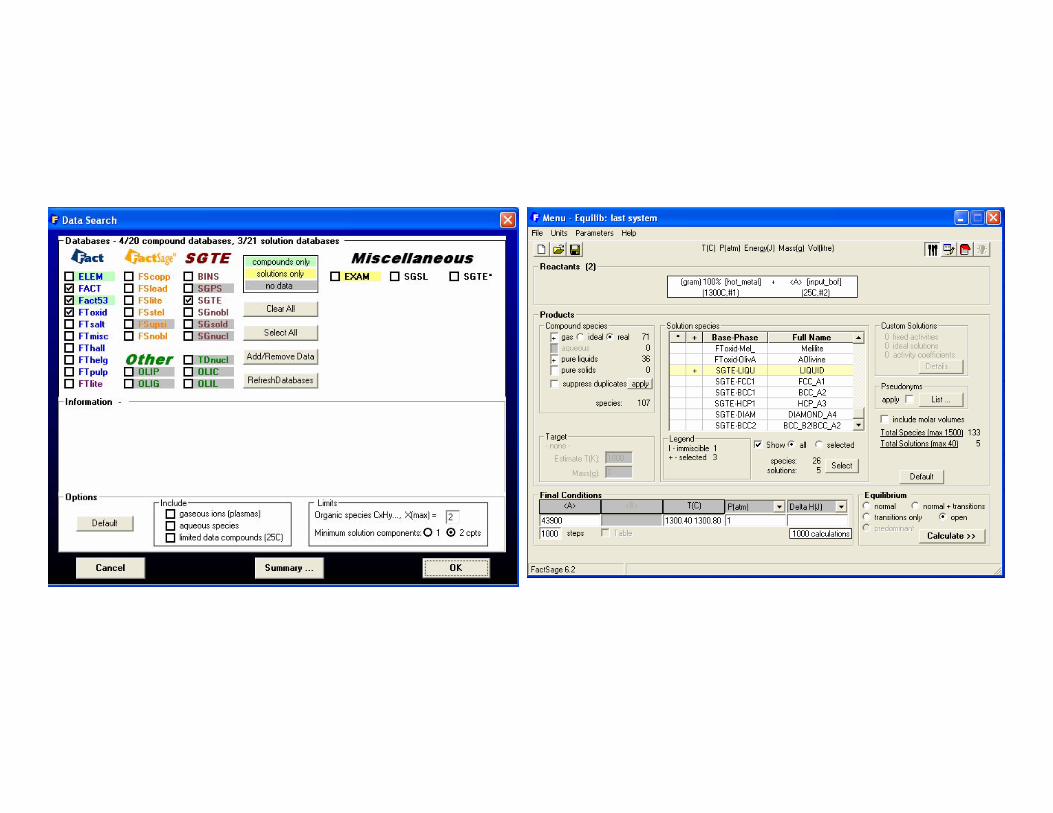
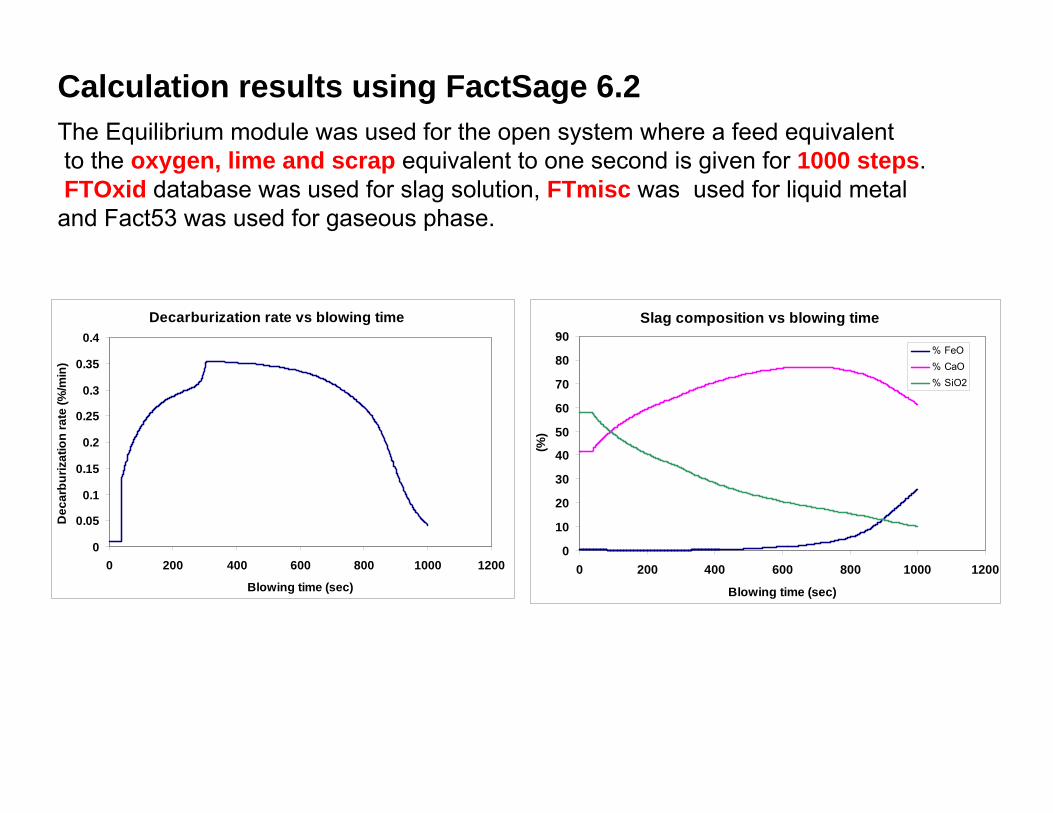
Calculation results using FactSage 6.2The Equilibrium module was used for the open system where a feed equivalentto the oxygen, lime and scrap equivalent to one second is given for 1000 steps.FTOxid database was used for slag solution, FTmisc was used for liquid metal and Fact53 was used for gaseous phase.
Decarburization rate vs blowing time
0
0.05
0.1
0.15
0.2
0.25
0.3
0.35
0.4
0 200 400 600 800 1000 1200
Blowing time (sec)
Dec
arbu
rizat
ion
rate
(%/m
in)
Slag composition vs blowing time
0
10
20
30
40
50
60
70
80
90
0 200 400 600 800 1000 1200
Blowing time (sec)
(%)
% FeO% CaO% SiO2
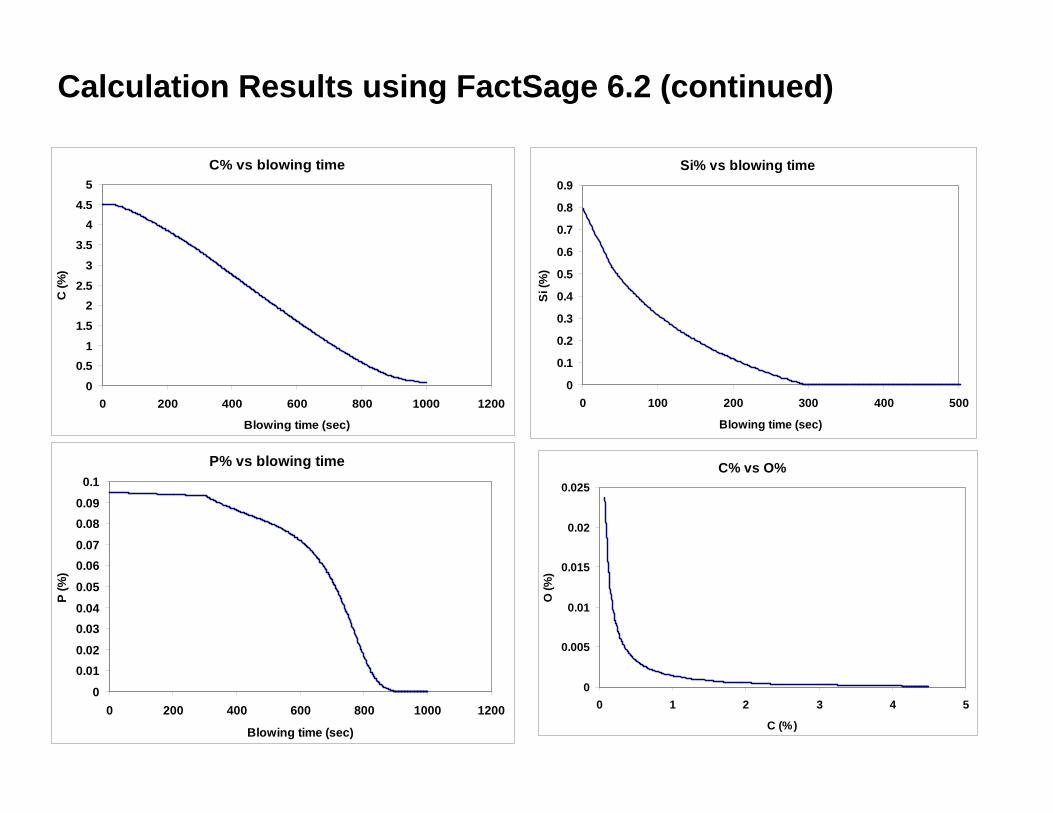
C% vs blowing time
0
0.51
1.5
22.5
3
3.5
44.5
5
0 200 400 600 800 1000 1200
Blowing time (sec)
C (%
)
Si% vs blowing time
0
0.1
0.2
0.3
0.4
0.5
0.6
0.7
0.8
0.9
0 100 200 300 400 500
Blowing time (sec)
Si (%
)
P% vs blowing time
0
0.010.02
0.030.04
0.05
0.060.07
0.080.09
0.1
0 200 400 600 800 1000 1200
Blowing time (sec)
P (%
)
C% vs O%
0
0.005
0.01
0.015
0.02
0.025
0 1 2 3 4 5
C (%)
O (%
)
Calculation Results using FactSage 6.2 (continued)
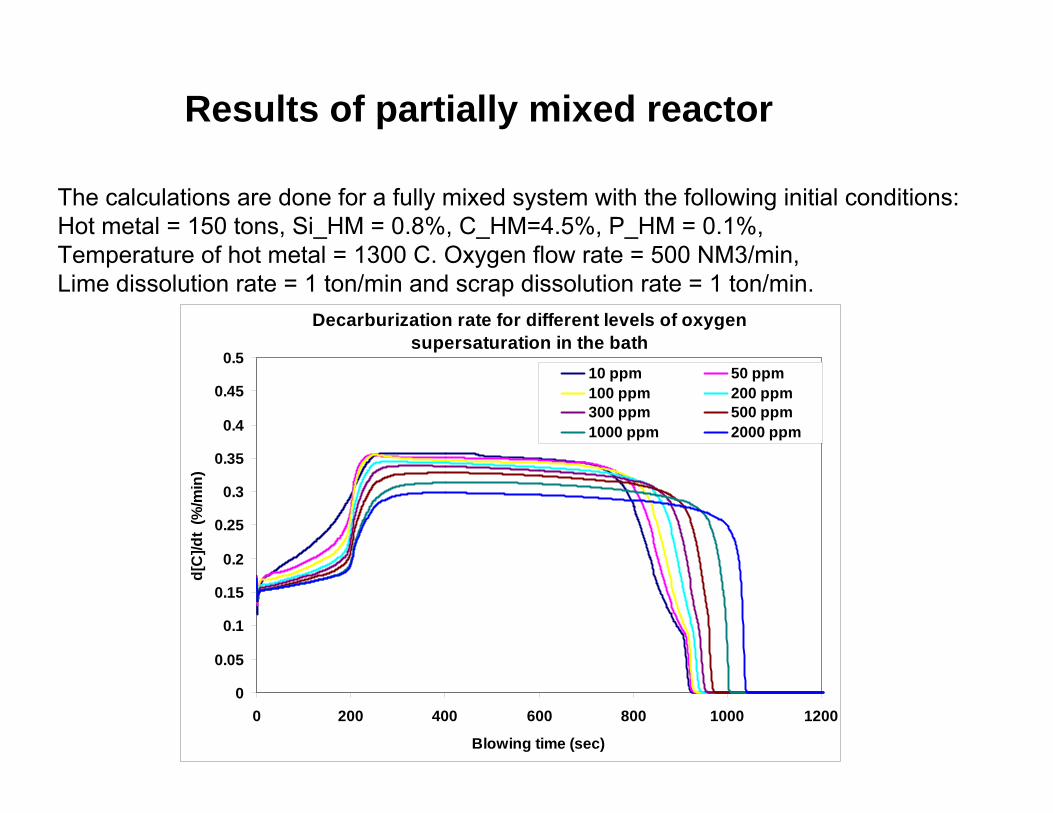
Results of partially mixed reactor
The calculations are done for a fully mixed system with the following initial conditions:Hot metal = 150 tons, Si_HM = 0.8%, C_HM=4.5%, P_HM = 0.1%, Temperature of hot metal = 1300 C. Oxygen flow rate = 500 NM3/min, Lime dissolution rate = 1 ton/min and scrap dissolution rate = 1 ton/min.
Decarburization rate for different levels of oxygen supersaturation in the bath
0
0.05
0.1
0.15
0.2
0.25
0.3
0.35
0.4
0.45
0.5
0 200 400 600 800 1000 1200
Blowing time (sec)
d[C
]/dt
(%/m
in)
10 ppm 50 ppm100 ppm 200 ppm300 ppm 500 ppm1000 ppm 2000 ppm
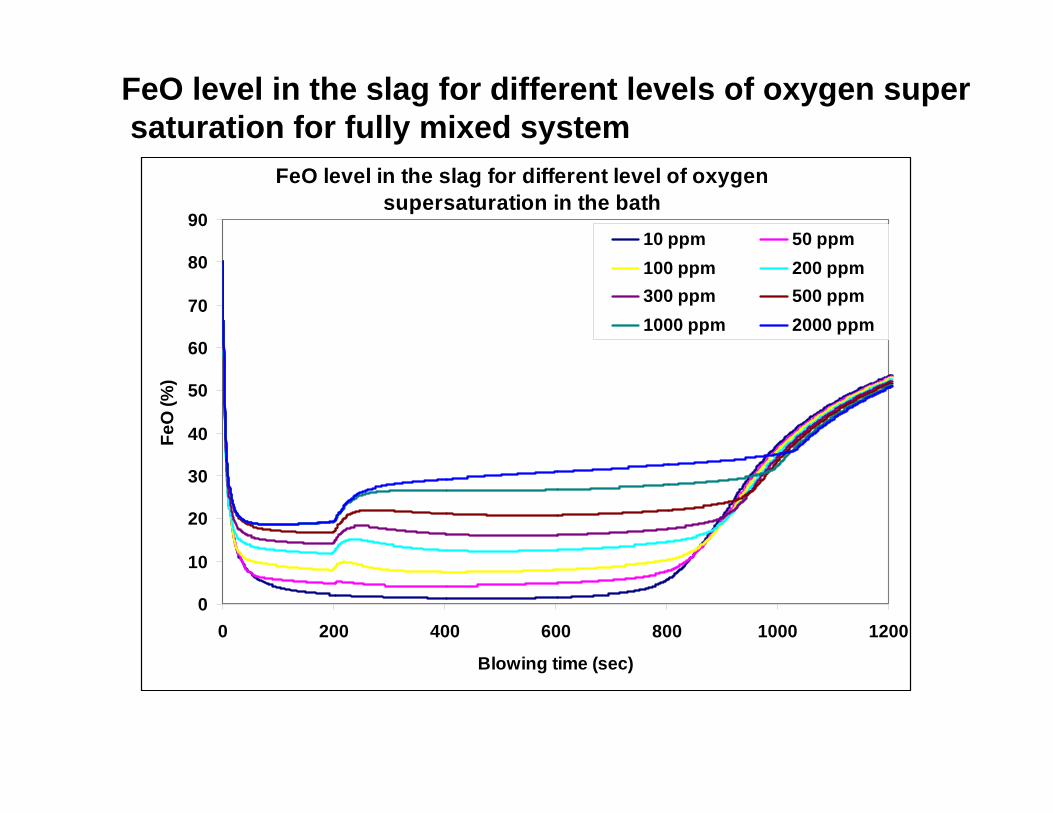
FeO level in the slag for different level of oxygen supersaturation in the bath
0
10
20
30
40
50
60
70
80
90
0 200 400 600 800 1000 1200
Blowing time (sec)
FeO
(%)
10 ppm 50 ppm100 ppm 200 ppm300 ppm 500 ppm1000 ppm 2000 ppm
FeO level in the slag for different levels of oxygen supersaturation for fully mixed system
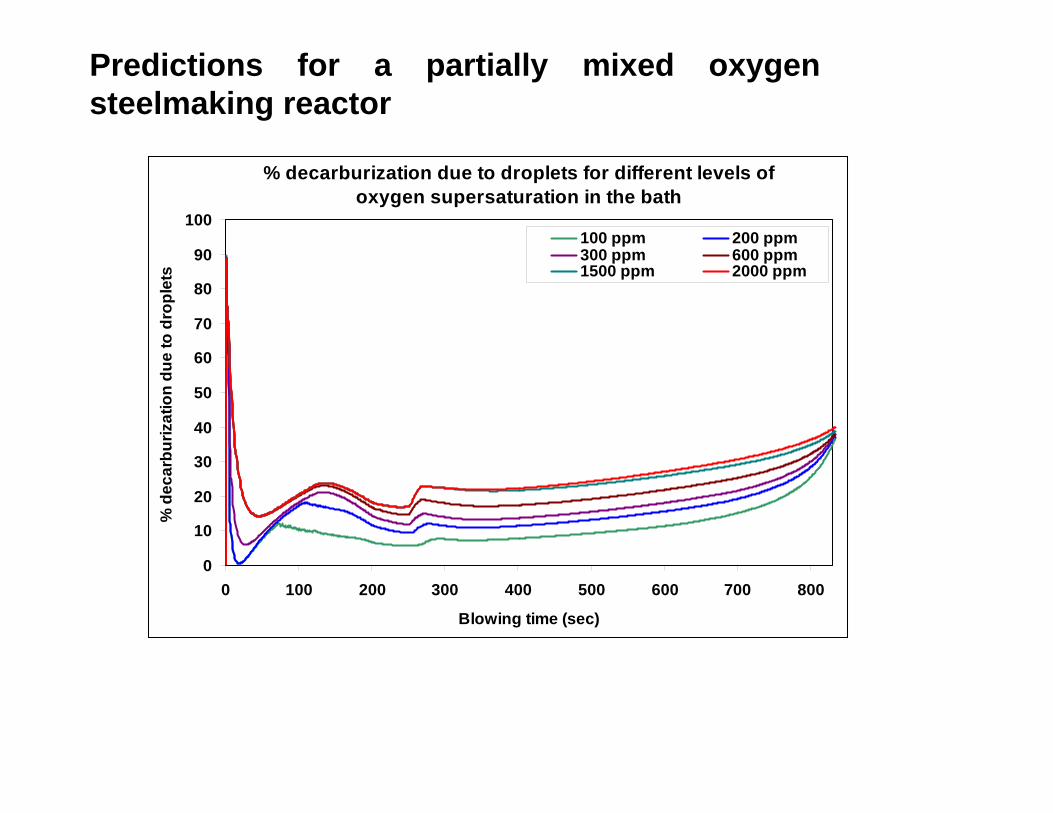
Predictions for a partially mixed oxygen steelmaking reactor
% decarburization due to droplets for different levels of oxygen supersaturation in the bath
0
10
20
30
40
50
60
70
80
90
100
0 100 200 300 400 500 600 700 800
Blowing time (sec)
% d
ecar
buriz
atio
n du
e to
dro
plet
s
100 ppm 200 ppm300 ppm 600 ppm1500 ppm 2000 ppm
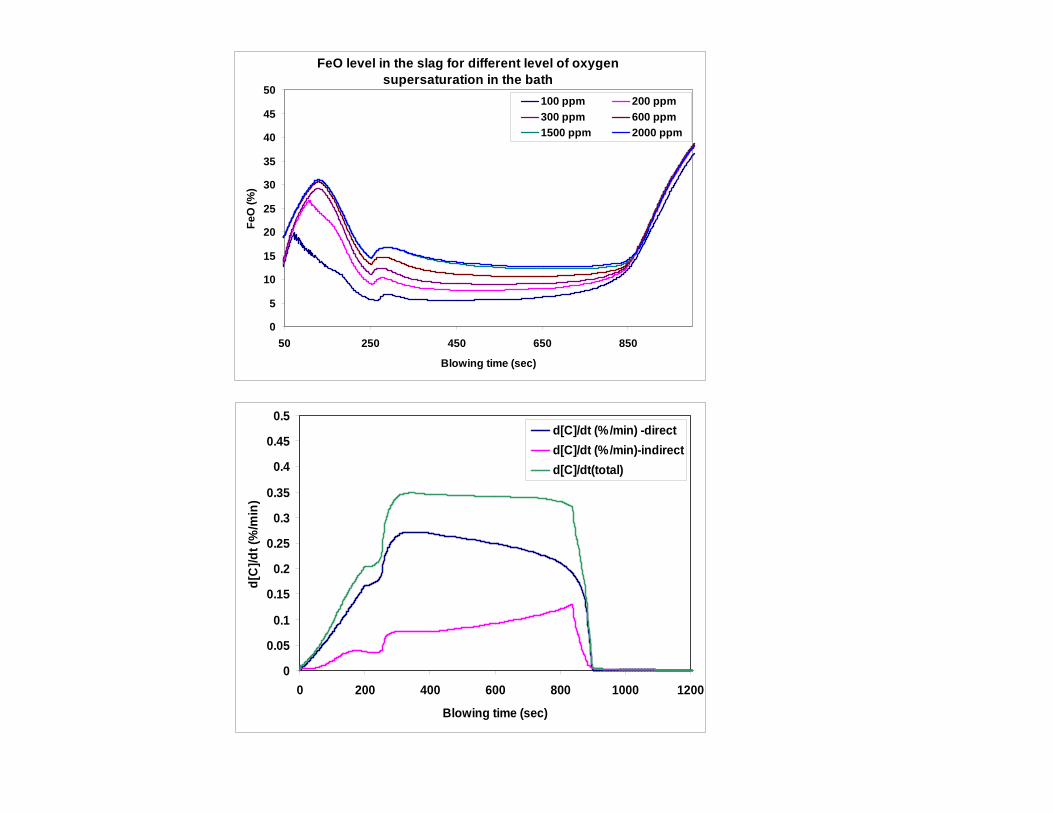
FeO level in the slag for different level of oxygen supersaturation in the bath
0
5
10
15
20
25
30
35
40
45
50
50 250 450 650 850
Blowing time (sec)
FeO
(%)
100 ppm 200 ppm300 ppm 600 ppm1500 ppm 2000 ppm
0
0.05
0.1
0.15
0.2
0.25
0.3
0.35
0.4
0.45
0.5
0 200 400 600 800 1000 1200
Blowing time (sec)
d[C
]/dt (
%/m
in)
d[C]/dt (%/min) -directd[C]/dt (%/min)-indirectd[C]/dt(total)
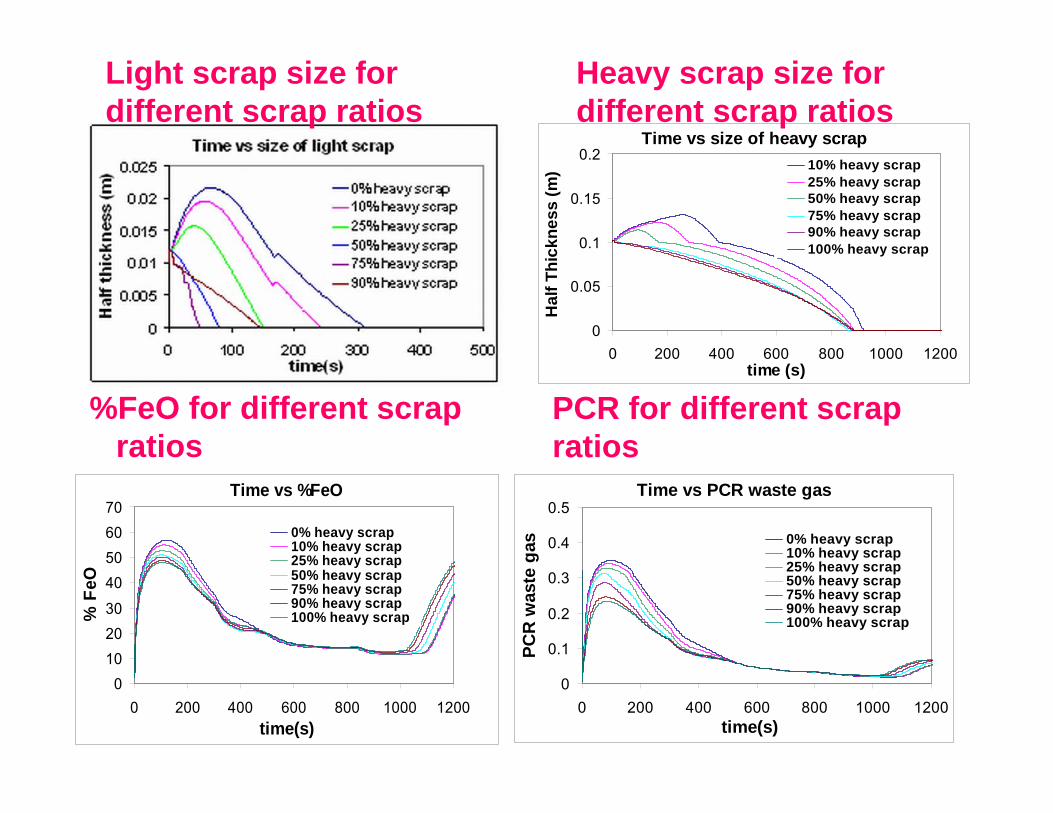
Time vs %FeO
0102030
40506070
0 200 400 600 800 1000 1200time(s)
% F
eO
0% heavy scrap10% heavy scrap25% heavy scrap50% heavy scrap75% heavy scrap90% heavy scrap100% heavy scrap
%FeO for different scrap ratios
Time vs PCR waste gas
0
0.1
0.2
0.3
0.4
0.5
0 200 400 600 800 1000 1200time(s)
PCR
was
te g
as 0% heavy scrap10% heavy scrap25% heavy scrap50% heavy scrap75% heavy scrap90% heavy scrap100% heavy scrap
PCR for different scrap ratios
Time vs size of heavy scrap
0
0.05
0.1
0.15
0.2
0 200 400 600 800 1000 1200time (s)
Hal
f Thi
ckne
ss (m
) 10% heavy scrap25% heavy scrap50% heavy scrap75% heavy scrap90% heavy scrap100% heavy scrap
Heavy scrap size for different scrap ratios
Light scrap size for different scrap ratios
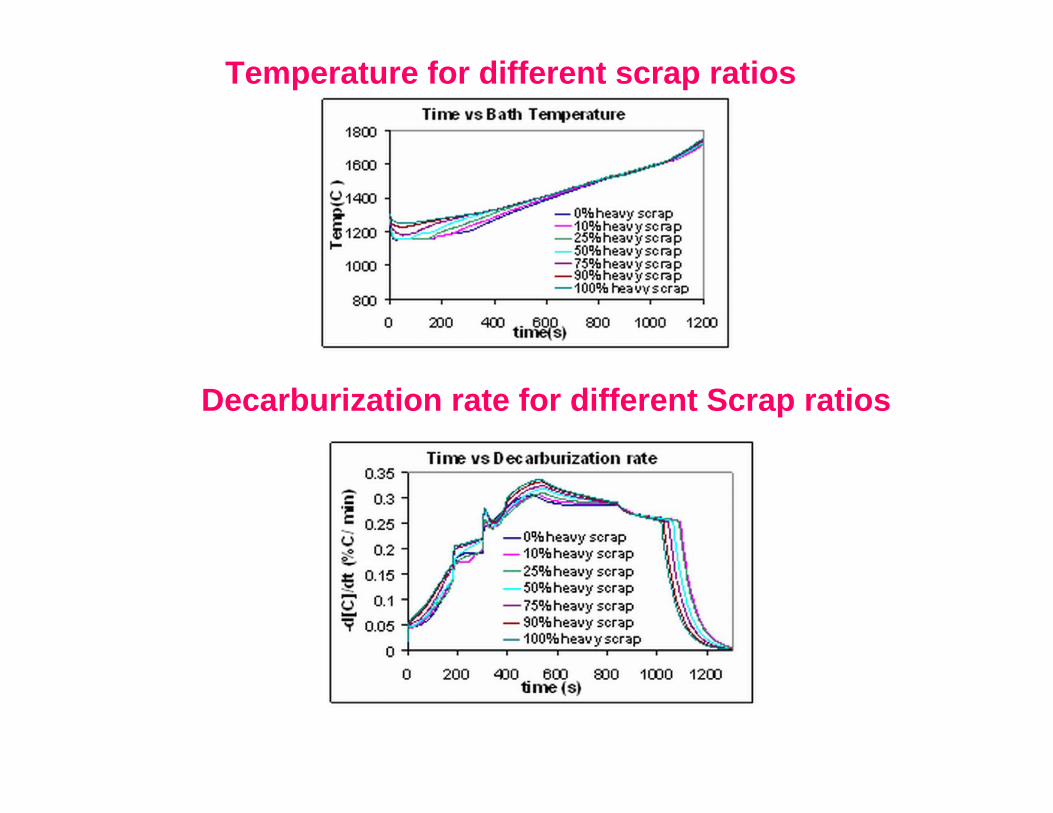
Temperature for different scrap ratios
Decarburization rate for different Scrap ratios
700
900
1100
1300
1500
1700
1900
0 1 2 3 4 5
0% heavy scrap10% heavy scrap25% heavy scrap50% heavy scrap75% heavy scrap90% heavy scrap100% heavy scrap
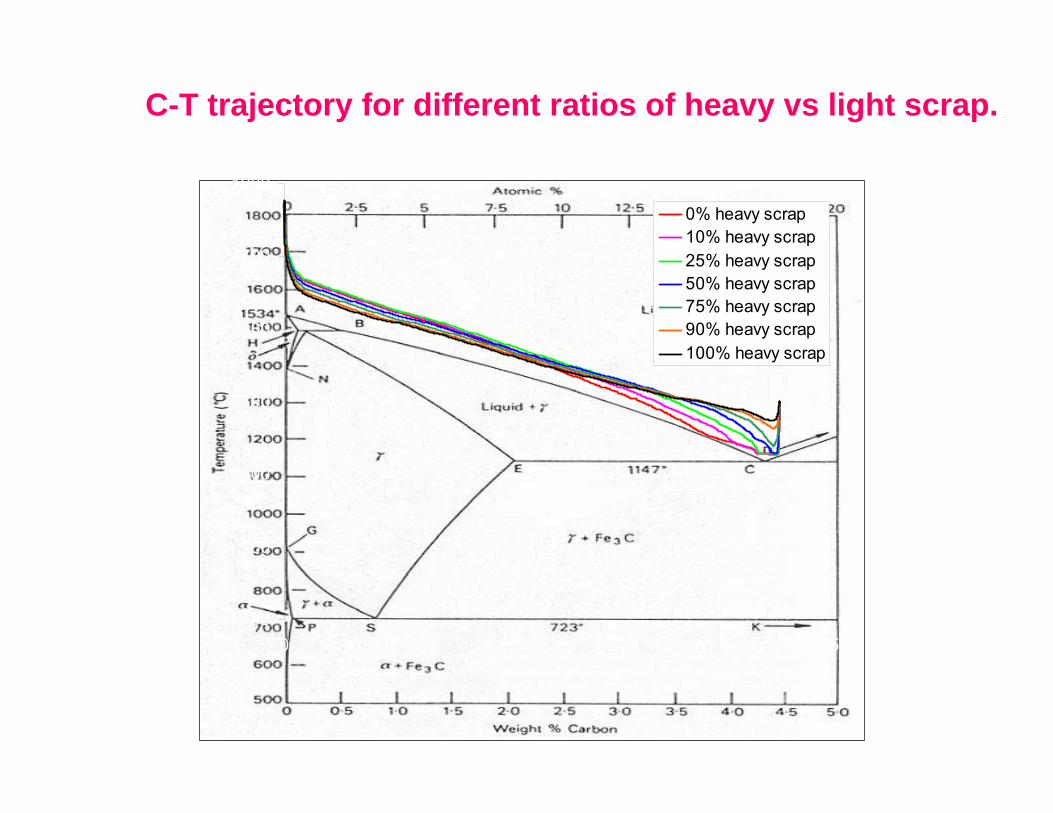
C-T trajectory for different ratios of heavy vs light scrap.
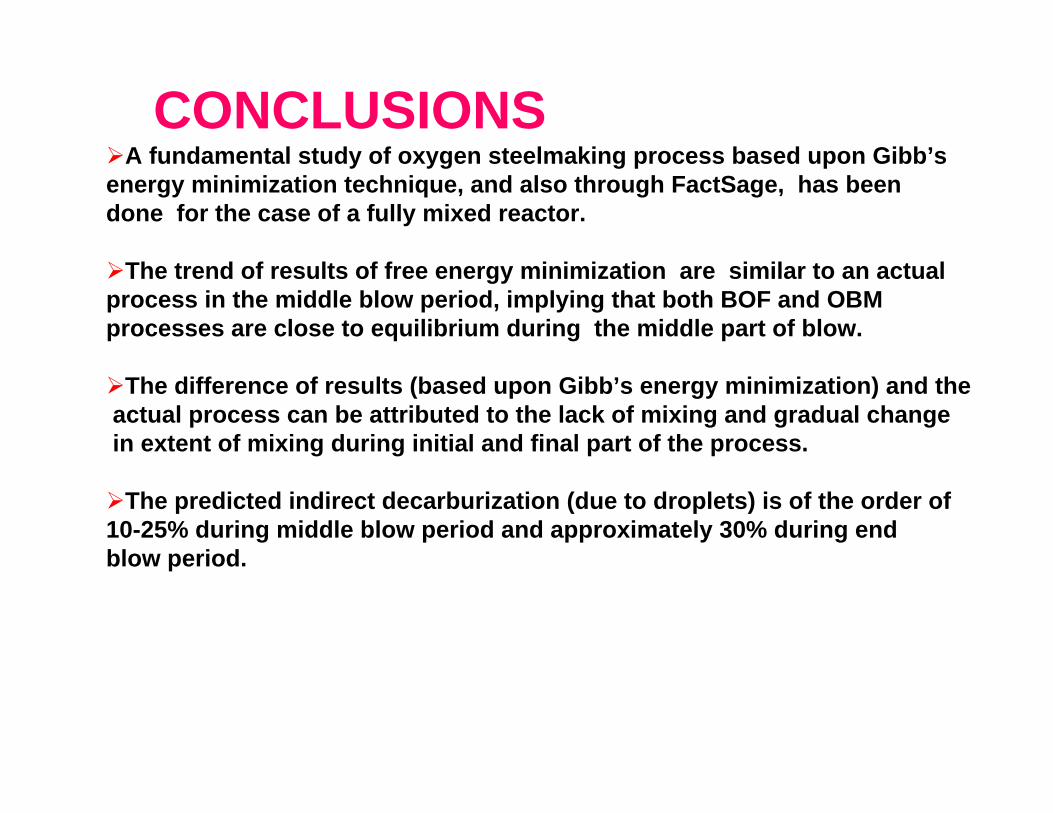
CONCLUSIONSA fundamental study of oxygen steelmaking process based upon Gibb’senergy minimization technique, and also through FactSage, has been done for the case of a fully mixed reactor.
The trend of results of free energy minimization are similar to an actualprocess in the middle blow period, implying that both BOF and OBM processes are close to equilibrium during the middle part of blow.
The difference of results (based upon Gibb’s energy minimization) and theactual process can be attributed to the lack of mixing and gradual changein extent of mixing during initial and final part of the process.
The predicted indirect decarburization (due to droplets) is of the order of10-25% during middle blow period and approximately 30% during endblow period.

Dephosphorization process cannot be explained adequately by free energycalculations because mass transfer in slag phase is important in that case. Mixing in metal phase cannot do much however extended surface area ofslag-metal due to droplets thrown in slag phase help this to a great extent.
Good agreement with the practical observations on the shopfloor. The model is integrated with the scrap dissolution model which is based uponcoupled heat and mass transfer. The computed results are similar to thepractical observations.
The model can be used as a simulation tool to study the effectof various parameters. Further testing on extensive plant data required.
AcknowledgementsNational Metallurgical Laboratory for Fact-Sage thermodynamic software
Thanks….