application of classification technique and … journal of engineering technology, management and...
TRANSCRIPT

International Journal of Engineering Technology, Management and Applied Sciences
www.ijetmas.com May 2015, Volume 3 Special Issue, ISSN 2349-4476
7
1 Selvan C,
2 Raju R,
3 Jitendranath Palem,
4 Marie-Claude Guérin
Application of Classification Technique and Sentiment
Analysis Based Text Analytics to the Patient Feedback
Management System
1 Selvan C,
2 Raju R,
3 Jitendranath Palem,
4 Marie-Claude Guérin
1 Corresponding Author: Selvan C, Department of Industrial Engineering,
Anna University, Guindy, Chennai, 2
Raju R, Professor, Department of Industrial Engineering, Anna University, Guindy, Chennai,India 3 Jitendranath Palem, Quality Subject Matter Expert - Program Manager, IBM India
4 Marie-Claude Guerin, Master Linguist Engineer, SPSS Text Analytics, IBM France
ABSTRACT
This case study presents the application of Sentiment Analysis based Text analytics applied for the
Patient feedback management System at multi super speciality hospital in India. This technique was
successfully implemented in order to improve the quality of care and patient‟s satisfaction levels by
mining the patients‟ opinion and feedback data using text analytics and identifying the specific
problematic departments which were the major source of patient dissatisfaction. This study breaks
the myth of the hospital management team who were under assumption that “all the patients are
satisfied at every stage as everyone getting the equal quality of treatment”. This study proves that
patient‟s satisfaction level varies at every stage of their treatment life cycle and also it differs among
patient types and varies at every stage of treatment. By leveraging the Text analytics the hospital top
management derived the optimum countermeasures which resulted in improving patient satisfaction
across all departments by reducing complaints and improving patient care.
Keywords Text Analytics, Text Mining, Opinion Mining, Sentiment Analysis, Decision Tree, Patient
satisfaction
1. INTRODUCTION
Treating patients as customers has an adverse effect in the healthcare industry as well as on society.
Customer retention is one of the top priorities for every organization however, as the multi super
specialty hospitals adopted the corporate level service strategy and started providing the superior
facilities to all the patients, every single patient visiting their hospital are treated with high respect
and superior service, while this is true for the majority of hospitals, this case study reveals the
consequences of the corporate style of service strategy and the potential risks that would severely
affect the hospital revenue in the future if they do not adapt the analytical approach to digest the
unstructured data collected from the various feedback systems across all the departments and
branches in all locations. It is important to note that, treating patients as customers would completely
defeat the purpose of hospital industry and the medical profession itself in the long run. Customer
retention strategies are at the core for all type of industries, except hospital industry. Since patients
are not customers and hospitals never expect patients to visit their hospital for the same diseases
repeatedly despite of long medication courses. In this paper, we described how we have saved one
multi super specialist hospital which was about to experience a crisis situation which would have
affected the financial aspects as well as reputation and brand. This study uses statistical techniques

International Journal of Engineering Technology, Management and Applied Sciences
www.ijetmas.com May 2015, Volume 3 Special Issue, ISSN 2349-4476
8
1 Selvan C,
2 Raju R,
3 Jitendranath Palem,
4 Marie-Claude Guérin
and performed text analytics to improve customer satisfaction, moreover this can lead to new
ventures similar to “Patientslikeme”social web platforms in India as well. The emphasis is on the
importance of establishing a culture of clinical service excellence by reducing patients‟ complaints
which improves the patient experience and satisfaction which intern improves profitability. This has
been the significant reason for the paradigm shift in the delivery of care in many hospitals
worldwide. Creation of a competitive advantage in such hospitals is mainly based on that world class
service offered by them to their patients. One of the main reasons why many of the organizations fail
in delivering service excellence is that, providing service excellence involves the combination of
many key factors such as design of service processes, organizational culture, staff members
participation and performance of the organization which leads to not caring enough the soft side of
the service which is patient satisfaction and perception. A complimentary benefit can be obtained
when clinical excellence is combined with service excellence. Such an increased focus on service
delivery can greatly impact the success of hospitals. The following are objectives of this study:
Identify the key touch points that affect the patient satisfaction at hospital
Assess how these key patient touch points are rated by the patients in “patient feedback
management system”
Determine the effect of reducing patient complaints and measure the overall satisfaction.
1.1 Data Design and feedback collection method
Patient feedback management system is a web based portal being used centrally across all branches
by the multi super speciality hospital. The data is collected for all the 16 branches of the hospital.
Total 2347 patient‟s responses were captured and used for the analysis. We assessed the touch points
at various stages of patient treatment through the survey and performed text analytics to identify
hidden problems in order to improve the patient satisfaction level.
1.2 Solution methodology
This study used the decision tree classification method (C5.0 Algorithm) due to the nature of its
speed, memory usage and its support for boosting, weighting, winnowing for identifying the focus
area of opportunities and order of priority to focus on corrective actions. Traditionally, most of the
data analysts uses pareto analysis to identify the vital few factors or the top focus areas, since this
conventional approach does not focus on soft elements such as satisfaction levels and actual feelings
of patients and the impact on service. Moreover, the categorization of feedback responses provided
in lengthy text box contains lot of description about their feelings, appreciations, concerns, issues,
challenges. Using Text Analytics, it helped us to understand the actual emotions or sentiments
contained in patient's feedback text. The unique aspect of this study lies in leveraging the decision
tree for identifying the problematic area of opportunities to implement the countermeasures in order
to improve patient satisfaction levels. This can be further used for predicting the complaints type in
specific departments.
1.3. Results:
Based on the text analytics recommendations, the hospital management staff understood the patients‟
perceptions and feelings. This resulted in reduction of 72% patient complaints across all top
contributing areas.
2. LITERATURE REVIEW
The thorough literature review study helped us to realize that there are no notable case studies in the
area of leveraging sentiment analysis based text analytics for the patient‟s feedback management

International Journal of Engineering Technology, Management and Applied Sciences
www.ijetmas.com May 2015, Volume 3 Special Issue, ISSN 2349-4476
9
1 Selvan C,
2 Raju R,
3 Jitendranath Palem,
4 Marie-Claude Guérin
system. “Patientslikeme” is a digital social network website where patients of chronic, life-changing
diseases share detailed quantifiable information about themselves, their diseases and their treatments
„effectiveness (Christopher S. Rollyson and associates 2008). Transformation of healthcare is
underway from sellers‟ market to consumers‟ market, where the satisfaction of the patients‟ need is a
primary concern while defining the service quality (Fellani Danasra et al. 2011). Healthcare
experiences of a patient can be measured from the patient complaint because a complaint might
suggest unsatisfactory or unsafe services. (Pichert et al. 2008) demonstrated an association between
unsolicited patient complaints and physicians‟ risk management profiles. They delineate about how a
responsive healthcare organization benefits by recording the patient complaint, systematically
analysing and aggregating it in order to improve service quality, safety and reduce lawsuit risks.
(Sage 2002) linking patient complaints and malpractice risks noted that such an association helped to
forge stronger links between the „customer satisfaction‟ side of the healthcare and the „clinical
safety‟ side.
Furthermore, (Hsieh et al. 2005) noted that many healthcare organizations hardly use patient
complaints to promote higher standards of care. In the recent years, several authors have suggested
several ways of promoting quality service and mitigating patient risks. (Gurses and Xiao 2006) found
that communications between healthcare teams and patients uncovered unmet needs and improved
clinical outcomes as well. Levinson and Gallagher (2007) emphasized the significance of disclosing
medical errors to patients. They suggested that physicians‟ error disclosures might create
opportunities for patients to help improve safety and quality. Coulter and Ellins (2007) have stressed
the effectiveness of strategies for informing, educating and involving patients.
For more than a decade, even though many healthcare organizations have supported
awareness
on feedback mechanism and many interventions to reduce the number of patient complaints thereby
increasing the patient satisfaction, a concrete optimal statistical model to assess the critical patient
touch points with a structured methodology within less amount of time was found missing. This
study shows the patients‟ complaint categories and in which area most of the complaints are
originating.
The scope of the text analytics in this case study is for the categories patients‟ "Complaints"
and "Suggestions" and for the decision tree model, all the three types (complaints, compliments,
suggestions) of feedback taken into consideration.
In the SPSS Modeler, The classification technique used the Area Name as the “input field”
and the “Comment type” as the target field. The Area name column was coded into nominal
variables as shown in Table 1.
Table 1 Area names and corresponding complaints and suggestions
Serial
number
Area name(issue area) Complaints
and
Suggestions
1 Administration 182
2 Nursing 106
3 House Keeping 93
4 Rooms 75
5 Front office 71
6 Billing 50

International Journal of Engineering Technology, Management and Applied Sciences
www.ijetmas.com May 2015, Volume 3 Special Issue, ISSN 2349-4476
10
1 Selvan C,
2 Raju R,
3 Jitendranath Palem,
4 Marie-Claude Guérin
7 In-room Dinning 45
8 Medical Services 38
9 PHC 28
10 IP Service 21
11 Investigation Services 17
12 Cardiology 13
13 Pharmacy 11
14 Public Areas 10
15 Operation Theatre 8
16 Restaurants 6
18 International Patient Services 3
19 Dialysis Unit 3
20 Telephones 2
21 Bio Medical 1
22 Laundry 1
23 Blood Bank 1
24 Ambulance service 1
2.1 METHODOLOGY
Assessing the various patient touch points at different stages of patient life cycle to reduce the
number of patient complaints in the hospital will satisfy the customers. (Internal and External)
Feedback collected from 2347 Patients and 577 complaints were reported
Metric - Number of Patient Complaints
Baseline - 577 Complaints per month / measured over year
Goal - 121 Complaints per month
2.2 Data Collection summary
Feedback responses from 2347 respondents extracted from patient feedback management system and
the data period of 1 year. The data contains the feedback concerned with frontline, in-patient, out-
patient, health check-up and post discharge. The descriptive summary of data shows that 18%
complaints (577) were recorded, 75% of compliments (2351) and 7% of suggestions were recorded
(216).
The classification technique used the Area Name as the input field and the Comment type as
the target field. The Area name column was coded into nominal variables
Variables recoded in IBM® SPSS® Statistics
Comment type column coded into three nominal variables such as
compliment = 1
complaint= 2
suggestion= 3
3. ANALYTICAL PHASE – MODEL BUILDING
Figure (1) represents the IBM® SPSS® Modeler Premium stream building to apply the decision tree
model (c5.0 algorithm) to identify the area codes which have a high complaint percentage that needs
to be targeted for improvement with minimal effort.
International Journal of Engineering Technology, Management and Applied Sciences
www.ijetmas.com May 2015, Volume 3 Special Issue, ISSN 2349-4476
11
1 Selvan C,
2 Raju R,
3 Jitendranath Palem,
4 Marie-Claude Guérin
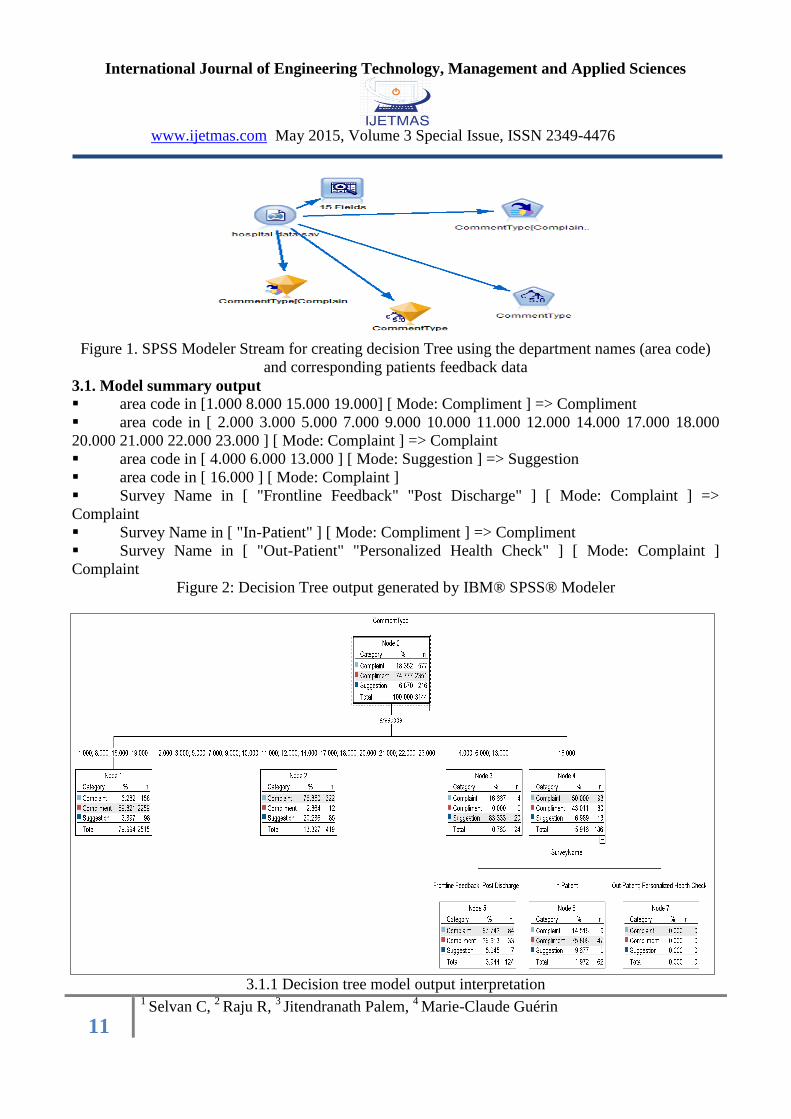
Figure 1. SPSS Modeler Stream for creating decision Tree using the department names (area code)
and corresponding patients feedback data
3.1. Model summary output
area code in [1.000 8.000 15.000 19.000] [ Mode: Compliment ] => Compliment
area code in [ 2.000 3.000 5.000 7.000 9.000 10.000 11.000 12.000 14.000 17.000 18.000
20.000 21.000 22.000 23.000 ] [ Mode: Complaint ] => Complaint
area code in [ 4.000 6.000 13.000 ] [ Mode: Suggestion ] => Suggestion
area code in [ 16.000 ] [ Mode: Complaint ]
Survey Name in [ "Frontline Feedback" "Post Discharge" ] [ Mode: Complaint ] =>
Complaint
Survey Name in [ "In-Patient" ] [ Mode: Compliment ] => Compliment
Survey Name in [ "Out-Patient" "Personalized Health Check" ] [ Mode: Complaint ]
Complaint
Figure 2: Decision Tree output generated by IBM® SPSS® Modeler
3.1.1 Decision tree model output interpretation

International Journal of Engineering Technology, Management and Applied Sciences
www.ijetmas.com May 2015, Volume 3 Special Issue, ISSN 2349-4476
12
1 Selvan C,
2 Raju R,
3 Jitendranath Palem,
4 Marie-Claude Guérin
Referring to the C5.0 decision tree in Figure 2, the root node classification table calculated the
proportions of each comment type category. Complaint category feedback covers 18% of the total
feedback. There are 4 nodes generated from the root node. Each node contains the relative
proportions of comment type categories and corresponding area code the comment type belongs to.
The point of interest is to identify which area codes (department) need to be targeted in order to
reduce complaints with minimal efforts. Referring to Node 4, the complaint percentage is 50% and
the corresponding survey type groups.
Frontline feedback, Post discharge are dominant groups with maximum complaints belonging
to the area code 16, i.e. nursing department.
The second top contributing departments to focus on are mentioned in Node 3 corresponding
to the area codes 4, 6, 13, i.e. Blood bank, Dialysis unit, IP service. The blood bank related issues
were due to the IT infrastructure issues which were fixed by conducting another research program
and enclosed the complete case study in the thesis.
Table 2 presents the cross tabulation summary performed through hypothesis testing using
the test of association (Chi-square) to validate the hospital management team‟s assumption that the
feedback responses are evenly distributed across all patient types and no relationship between patient
type and their response.
Table 2: Feedback type versus the feedback type category cross tabulation
SurveyName * CommentType Crosstabulation
CommentType
Total Complaint Compliment Suggestion
SurveyName Frontline
Feedback
Count 13 0 0 13
Expected
Count 2.4 9.7 .9 13.0
% within
SurveyName 100.0% 0.0% 0.0% 100.0%
% within
CommentType 2.3% 0.0% 0.0% .4%
% of Total .4% 0.0% 0.0% .4%
In-Patient Count 99 244 117 460
Expected
Count 84.4 344.0 31.6 460.0
% within
SurveyName 21.5% 53.0% 25.4% 100.0%
% within
CommentType 17.2% 10.4% 54.2% 14.6%
% of Total 3.1% 7.8% 3.7% 14.6%
Out-Patient Count 13 5 6 24
Expected
Count 4.4 17.9 1.6 24.0
% within
SurveyName 54.2% 20.8% 25.0% 100.0%
% within
CommentType 2.3% .2% 2.8% .8%

International Journal of Engineering Technology, Management and Applied Sciences
www.ijetmas.com May 2015, Volume 3 Special Issue, ISSN 2349-4476
13
1 Selvan C,
2 Raju R,
3 Jitendranath Palem,
4 Marie-Claude Guérin
% of Total .4% .2% .2% .8%
Personalized
Health
Check
Count 9 46 20 75
Expected
Count 13.8 56.1 5.2 75.0
% within
SurveyName 12.0% 61.3% 26.7% 100.0%
% within
CommentType 1.6% 2.0% 9.3% 2.4%
% of Total .3% 1.5% .6% 2.4%
Post
Discharge
Count 443 2056 73 2572
Expected
Count 472.0 1923.3 176.7 2572.0
% within
SurveyName 17.2% 79.9% 2.8% 100.0%
% within
CommentType 76.8% 87.5% 33.8% 81.8%
% of Total 14.1% 65.4% 2.3% 81.8%
Total Count 577 2351 216 3144
Expected
Count 577.0 2351.0 216.0 3144.0
% within
SurveyName 18.4% 74.8% 6.9% 100.0%
% within
CommentType 100.0% 100.0% 100.0% 100.0%
% of Total 18.4% 74.8% 6.9% 100.0%
3.1.3. Hypothesis testing
H0: There is no significant relationship among patient type and their satisfaction levels
Ha: There is a significant relationship among patient type and their satisfaction levels
3.1.4. Cross tab summary interpretation
Based on the cross tab summary table shown in table 3, it is clear that there is a huge difference
between observed and expected values. The same is confirmed in the asymptotic significant level P
value in the chi-square table, which is less than 0.05 favouring the alternate hypothesis. Below
section contains the text analytics results obtained and the data insights. This proves that the patient‟s
feedback satisfaction level has strong association with patient type (In-patient, out-patient,
personalized health check-up, post-discharge)
Table 3. Chi- Square output – Decision tree classification
Chi-Square Tests
Value df
Asymp. Sig. (2-
sided)
Pearson Chi-Square 475.812a 8 .000
Likelihood Ratio 362.675 8 .000
N of Valid Cases 3144

International Journal of Engineering Technology, Management and Applied Sciences
www.ijetmas.com May 2015, Volume 3 Special Issue, ISSN 2349-4476
14
1 Selvan C,
2 Raju R,
3 Jitendranath Palem,
4 Marie-Claude Guérin
4. Sentiment analysis based Text analytics on the patient feedback data
Table 4 shows the output generated by IBM® SPSS® Modeler Text Analytics for the patients‟
feedback automatically categorized into negative, negative functioning, negative budget, negative
attitude, negative feeling, and negative competence. Category building refers to the generation of
category definitions and classification through the use of one or more built-in techniques, and
categorization refers to the scoring, or labelling process whereby unique identifiers (name/ID/value)
are assigned to the category definitions for each record or document. Table 4.1 shows the output
generated during category building, the concepts and types that were extracted and used as the
building blocks for the selected categories. When we build categories, the records or documents are
automatically assigned to categories if they contain text that matches an element of a category's
definition.
Table 4: Negative type
Table 4.1: Negative type concept 1, concept 2 extraction

International Journal of Engineering Technology, Management and Applied Sciences
www.ijetmas.com May 2015, Volume 3 Special Issue, ISSN 2349-4476
15
1 Selvan C,
2 Raju R,
3 Jitendranath Palem,
4 Marie-Claude Guérin
Figure 3: category web of patient feedback data
Table 5: category type proportion and the corresponding document
Figure 4: sentiment analysis output generated based on patients feedback data related to “Negative
functioning”

International Journal of Engineering Technology, Management and Applied Sciences
www.ijetmas.com May 2015, Volume 3 Special Issue, ISSN 2349-4476
16
1 Selvan C,
2 Raju R,
3 Jitendranath Palem,
4 Marie-Claude Guérin
Figure 5: sentiment alysis output generated based on patients feedback data related to “Negative
functioning- products”
Figure 6: sentiment alysis output generated based on patients feedback data related to “Negative
feeling”
Negative budget
Figure 7: sentiment alysis output generated based on patients feedback data related to “Negative
budget”

International Journal of Engineering Technology, Management and Applied Sciences
www.ijetmas.com May 2015, Volume 3 Special Issue, ISSN 2349-4476
17
1 Selvan C,
2 Raju R,
3 Jitendranath Palem,
4 Marie-Claude Guérin
In Table 4.1.the Concept tab displays the set of concepts that were extracted. Concepts are presented
in a table format with one row for each concept. The objective is to select which concepts will be
used for scoring. In some cases, a concept represents the concept name as well as some other
underlying terms associated with this concept, such as inflected forms, variant terms or synonyms.
Figures 3 and 4 present the document/record overlap for the categories to which the
documents/records belong according to the selection in the other panes. If category labels exist, these
labels appear in the graph. The thickness of the line denotes the number of common documents or
records they have that represents the high traffic interactions between the concepts. It is clear that
patient to nursing staffs have thick lines which was already proved by the decision tree model output
(i.e. the area code 16). In a simple terminology, this represents that there are maximum comments
related to nursing staffing. Figures 5, 6, 7,8 show the sentiment analysis output that clearly reveals
the dissatisfaction elements related to function (infrastructure related), service support (front office
service), budget(expenditure at the hospital). It is clear that there is a high association between the
nursing services and patients relative to other aspects such as medicines, occupation/staff etc. The
sentiment analysis graphs on Figures 5, 6, 7 and 8 reveal that there are complaints related to hospital
cost/expenditure, in-patient facilities with respect to the hospital infrastructure such as air-condition
systems, toilets, fans, beds, etc. The factors related to other dominant reasons were also revealed by
the text mining results which helped the hospital management to take the appropriate corrective
actions. The complete output is not shown in order to preserve confidentiality for patients, doctors,
nurses and staff members
5. KEY RECOMMENDED SOLUTIONS RECOMMENDED AND IMPLEMENTED BY HOSPITAL
MANAGEMENT TEAM
1. Sentiment analysis index has been created and deployed in the hospital management
dashboard itself for the key branch where there were more number of complaints. This index
dynamically gets updated on daily basis as and when the patient‟s feedback management system gets
updated with new feedback entries.
2. Customized training programs was conducted for the target nurses whose service was poor
3. Automated Queue system was deployed for proper bed allocation.
4. Language translators were made available to overcome the problems regarding the language
barrier for non-local or international patients.
5. Proper training was given to all the admission staff to speed up the process and properly
guide patients.
6. Cross functional meetings were conducted with all the kitchen staffs to brief them to be more
cautious while preparing patients‟ food. Production in-charge had been briefed to ensure that taste
and quality of food would be maintained.
7. Departmental meeting was conducted for service staffs, to ensure that timeliness of service
was adhered to.
8. Food for emergency patients was served on scheduled timings. The emergency nurses in
charge had been instructed to serve proper diet to patients.
9. Patients were educated about the availability of floor coordinators in the floors to clarify their
doubts.
10. Admission staffs were trained to behave with patients in a friendly & cordial way.
11. Patients were educated about the waiting areas in the different places.

International Journal of Engineering Technology, Management and Applied Sciences
www.ijetmas.com May 2015, Volume 3 Special Issue, ISSN 2349-4476
18
1 Selvan C,
2 Raju R,
3 Jitendranath Palem,
4 Marie-Claude Guérin
12. Proper inventory management system was followed to optimize the reorder level and
quantity.
13. Regular on job refresher training programs were conducted.
14. Preventive healthcare classes scheduled for free for patient‟s relatives(as nominated by
patients)
All the improvement measures were implemented during the improve phase and continuous review
of the different solutions was carried out. All levels of staff involved in the hospital were trained to
follow mistake proofing techniques to carry out routine surveillance of various processes. Clinical
pharmacology personnel monitored the processes with constant vigilance on all the activities of
medication management. Periodic meetings were scheduled to review the progress of the
improvement measures and their impact on the overall business objectives.
6. RESULTS AND DISCUSSION
Patient‟s complaints tracked using the I-MR control chart, from the chart, it is clear that the
reduction of patient‟s complaints started from June 2013 onwards, process shift taken place and the
new control limits were computed . Complaints related to Nursing have been completely eliminated
post implementation of corrective actions. In addition to nursing related complaints the other
immediate complaints such as billing related issues, front office issues, medical services, or PHC
also got reduced. The number of complaints was reduced by 72% i.e. from 577 to 158 over a period
of 1 year which is shown in Figure. (8)
Figure 8: control chart representing the state of “patients‟ complaints” before and after solution
implementation
Post implementation of corrective actions, the number of complaints had been significantly reduced
and the same is represented in the control chart. , but also post feedback had recorded 74.77%
compliments (2351) and 6.88% suggestions (216). Some of the novel approaches to capture the
immense insights into customer experience were management summary dashboard, indices summary
dashboard, departmental scorecard, daily pulse, top ten customer irritants and trend charts,
comparative score cards, qualitative reports on departmental performance, case aging report and
Service Level Agreement for each head of the department.
International Journal of Engineering Technology, Management and Applied Sciences
www.ijetmas.com May 2015, Volume 3 Special Issue, ISSN 2349-4476
19
1 Selvan C,
2 Raju R,
3 Jitendranath Palem,
4 Marie-Claude Guérin
7. CONCLUSION
The role of text analytics is increasing at exponential rate with the growth of unstructured data.
Leveraging this in healthcare industry like demonstrated in this case study helps improving the
patient satisfaction and quality of care. Using the decision tree classification modelling technique we
were able to specifically target the departments requiring corrective action implementation without
overspending the training costs. Using text analytics the hospital management team understood each
and every patient feedback and the nature of the complaint. Also, the patient concerns about several
attributes causing dissatisfaction were understood from the voice of the customer which helped in
establishing the CTQ characteristics. Hypothesis testing was used to show that the financial, clinical,
operational, service and safety attributes had a significant impact on patient satisfaction and that it
differs from each patient group. Considerable amount of time was saved by identifying the non-value
adding activities and eliminating them. As a result, the waiting time of the patient had reduced
significantly resulting in increased patient satisfaction. Further, it was proved that the patient
satisfaction was positively correlated with the patient loyalty. Also patient loyalty was positively
correlated with the hospital performance. As a result, the rate of patients with loyalty intention
started increasing hand in hand with referral index of the hospital. This directly improved the
operating profit, operating profit per patient, revenue and revenue per patient.
8. SCOPE FOR FUTURE WORK
The scope for future work for this case study is enormous, for example: creating a “Patientslikeme”
digital network for any hospital in India to establish the connected experience infrastructure which
gives the world class quality care and transparency across all departments of all levels to the top
level management in real time. This paper can also lead the top executives of the hospital industry to
deploy social media monitoring tools to further capture the patients „feedback (comments,
suggestions, experience, satisfaction level) in real time so that it becomes beneficial to the society as
well as the entire healthcare community. Furthermore, the decision tree classification technique
(C5.0) would further help in building predictive models to identify the potential area of issues and
problematic departments based on the patient‟s complaints and also helps the hospital management
team to identify and appreciate the best doctors and staff based on the patient‟s feedback data.
9. REFERENCES 1. Dewi, F. D., Sudjana, G., & Oesman, Y. M. (2011). Patient satisfaction analysis on service quality of
dental health care based on empathy and responsiveness. Dental Research Journal, 8(4), 172–177.
doi:10.4103/1735-3327.86032
2. Pichert, J. W., Hickson, G., & Moore, I. (2008). Using patient complaints to promote patient safety.
3. Raftopoulos V. A grounded theory for patients‟ satisfaction with quality of hospital care. Journal web
ICUS Nurs. 2005;22:1–15.
4. Lliffe S, Wilcock J, Manthorpe J, Moriarty J, Cornes M, Clough R, et al. Can clinicians benefit from
patient satisfaction surveys? Evaluating the NSF for Older People, 2005-2006. J Royal Soc Med.
2008;101:598–604.
5. Hojat M. Ten approaches for enhancing empathy in health and human services cultures. J Health
Hum Serv Adm. 2009;31(4):412–450
6. Pollak KI, Alexander SC, Tulsky JA, et al. Physician empathy and listening: associations with patient
satisfaction and autonomy. J Am Board Fam Med. 2011;24(6):665–672.

International Journal of Engineering Technology, Management and Applied Sciences
www.ijetmas.com May 2015, Volume 3 Special Issue, ISSN 2349-4476
20
1 Selvan C,
2 Raju R,
3 Jitendranath Palem,
4 Marie-Claude Guérin
7. Ahrweiler F, Neumann M, Goldblatt H, Hahn EG, Scheffer C. Determinants of physician empathy
during medical education: hypothetical conclusions from an exploratory qualitative survey of
practicing physicians. BMC Med Educ. 2014;14:122
8. Ginter P (2013) The Strategic Management of Health Care Organizations, 7th ed. (Jossey-Bass, San
Francisco)
9. Williams B, Sadasivan S, Kadirvelu A, Olaussen A. Empathy levels among first year Malaysian
medical students: an observational study. Adv Med Educ Pract. 2014;5:149–156.
10. Parasuraman A, Zeithaml V, Berry LL. Delivering quality service; Balancing customer perception
and expectations. New York: Free Press; 1990.
11. Berry Michael W., (2004), “Automatic Discovery of Similar Words”, in “Survey of Text Mining:
Clustering,Classification and Retrieval”, Springer Verlag, New York, LLC, 24-43.
12. Weiguo Fan, Linda Wallace, Stephanie Rich, and Zhongju Zhang, (2005), “Tapping into the Power
of Text Mining”,Journal of ACM, Blacksburg.
13. Michael J. Mugavero, Hui-Yi Lin, Jeroan J. Allison, James H. Willig,Pei-Wen Chang, Malcolm
Marler, James L. Raper, Joseph E. Schumacher, Maria Pisu, and Michael S. Saag, “Failure to
Establish HIV Care: Characterizing the “No Show” Phenomenon”.
14. Vernon J Lee, Arul Earnest, Mark I Chen and Bala Krishnan, "Predictors of failed attendances in a
multi-specialty outpatient center using electronic databases”, BMC Health Services Research 2005,
5:51.
15. L. Breiman, J. Freidman, R. Olshen, and C. Stone, Classification and Regression Trees, Monterey:
Wadsworth and Brooks, 1984.J. R. Quinlan, “Introduction of decision tree,” Machine Learning
Journal, vol. 1, 1986, pp. 81-106.
16. X. Li and C. Claramunt, “A spatial entropy-based decision tree for classification of geographical
information,” Transaction in GIS, vol. 10(3), 2006, pp. 451-467.
17. M. Punia, P. K. Joshi and M. C. Porwal, “Decision tree classification of land use land cover for
Delhi, India using IRS-P6 AWiFS data,” Expert Systems with Applications, 2010, pp. 5577-5583.
18. M. Easter, H. Kriegel and J. Sander, “Spatial data mining: A database approach,” Springer Lecture
Notes in Computer Science, vol. 1262, 1997, pp. 48-66.
19. R. C. Balling and S. S. Roy, “A spatial entropy analysis of temperature trends in the United States,”
Geophysical Research Letters, vol. 31, 2004,pp. 11-2.
20. Q. Ding, Q. Ding, and W. Perrizo, “Decision Tree Classification of Spatial Data Streams Using
Peano Count Trees,” Proceedings of the ACM
Symposium on Applied Computing, pp. 413-417, 2004.
21. Hickson GB, Federspiel CF, Pichert JW, et al. Patient complaints and malpractice risk. JAMA. 2002;
287:2951–2957.
22. Sage WM. Putting the patient in patient safety: Linking patient complaints and malpractice
risk. JAMA.2002; 287:3003–3005.
23. Gurses AP, Xiao Y. A systematic review of the literature on multidisciplinary rounds to design
information technology. J Am Med Inform Assoc. 2006; 13:267–276.
24. Levinson W, Gallagher TH. Disclosing medical errors to patients: A status report in
2007. CMAJ. 2007;177:265–267.
25. Coulter A, Ellins J. Effectiveness of strategies for informing, educating, and involving
patients. BMJ.2007;135:24–27.
26. Greaves F, Ramirez-Cano D, Millett C, Darzi A, Donaldson L,Use of Sentiment Analysis for
Capturing Patient Experience From Free-Text Comments Posted Online,J Med Internet Res
2013;15(11):e239