application of bus transfer schemes to stabilise power
TRANSCRIPT

APPLICATION OF BUS TRANSFER SCHEMES TO
STABILISE POWER SUPPLY IN A COAL FIRED POWER
PLANT UNIT AUXILIARY RETICULATION
Vonani Clive Mathebula
In fulfilment of the Masters in Electrical Engineering
College of Agriculture, Engineering and Science,
University of KwaZulu-Natal
04 March 2019
VC Mathebula
…………………………………….
Signature 04/03/2019
Supervisor: Prof. AK Saha
…………………………………….
Signature
Examiner’s copy

i
As the candidate’s Supervisor I agree/do not agree to the submission of this dissertation.
Supervisor: Prof. AK Saha Date:
…………………………….. ……………………………..

ii
DECLARATION 1 - PLAGIARISM
I, Vonani Clive Mathebula, declare that:
1. The research reported in this thesis, except where otherwise indicated, and is my
original research.
2. This thesis has not been submitted for any degree or examination at any other
university.
3. This thesis does not contain other persons’ data, pictures, graphs or other information,
unless specifically acknowledged as being sourced from other persons.
4. This thesis does not contain other persons' writing, unless specifically acknowledged
as being sourced from other researchers. Where other written sources have been
quoted, then:
a. Their words have been re-written but the general information attributed to them has
been referenced
b. Where their exact words have been used, then their writing has been placed in italics
and inside quotation marks, and referenced.
5. This thesis does not contain text, graphics or tables copied and pasted from the
Internet, unless specifically acknowledged, and the source being detailed in the thesis
and in the References sections.
Signed
…………………………………….
Signature 04/03/2019

iii
DECLARATION 2 - PUBLICATIONS
DETAILS OF CONTRIBUTION TO PUBLICATIONS that form part and/or include
research presented in this thesis (include publications in preparation, submitted, in press and
published and give details of the contributions of each author to the experimental work and
writing of each publication)
Publication 1:
V.C. Mathebula and A.K. Saha, "Development of in-phase bus transfer scheme using Matlab
Simulink", SAUPEC/RobMech/PRASA, Bloemfontein, South Africa, January 2019
Publication 2:
V.C. Mathebula and A.K. Saha, "Coal fired power plant in-phase bus transfer simulation of
forced and induced draught fan motors", SAUPEC/RobMech/PRASA, Bloemfontein, South
Africa, January 2019
Publication 3:
V.C. Mathebula and A.K. Saha, "Application of bus transfer schemes to stabilise power
supply in a coal fired power plant unit auxiliary reticulation ", PRIS, Durban Westville,
South Africa, October 2018
Signed:
…………………………………….
Signature 04/03/2019

iv
ACKNOWLEDGMENTS
I would like to express my sincere appreciation to my supervisor Prof. AK Saha for his
guidance, support, encouragement and patience. His careful attention to detail on my
work is invaluable.
I would also like to acknowledge my friends and colleagues for the support during my
studies; thank you letting me bother you about my challenges.
Special thanks to my family for the great support and inspiration to pursue and complete
my studies, in particular Dolphinia Mathebula, Nkateko Mathebula, and Makungu
Mathebula.
Above all, I would like to thank God Almighty for giving me the courage, wisdom,
ability and opportunity to undertake this research study and to persevere and complete it
satisfactorily. Without his blessings, this achievement would not have been possible.

v
ABSTRACT
A multi-function bus transfer system comprising fast, in-phase and residual bus voltage
transfer schemes is developed in the thesis. Bus residual voltage magnitude and phase angle
are calculated by converting time domain components of a three phase system in an abc
reference frame to dq0 components in a rotating reference frame using Park’s transformation
equations. Residual bus voltage phase angle is then modelled by a Taylor’s series expansion
to calculate the phasor angular position with reference to the alternate power supply ahead of
time to enable synchronization of the two supplies. Simulations are performed to verify
functionality and performance; and to deduce the characteristics of the respective schemes.
The thesis then explores the feasibility of using the bus transfer system to stabilise power
supply within a power generating plant auxiliary electrical reticulation when upstream
electrical equipment failures occur; in particular focus is placed on the unit boiler furnace
draught system which would normally result in reduction of up to half of unit generating
capability if one set of the draught system is lost. Simulation results of case studies
conducted provided practical understanding on the feasibility of using a bus transfer system,
with fast bus transfer scheme being the most preferred method at 70 ms transfer time; which
enables the forced draught fan motor to be transferred within 2 s before the unit begins to de-
load. The thesis proposes a new reticulation configuration that allows the transfer of both
forced and induced draught fan motors simultaneously while maintaining stable draught
furnace pressure. The new configuration allows both fan motors to remain connected to the
switchboard for up to 3 s before tripping the motors on under-voltage protection when
upstream equipment failures occur, even though bus transfer can be executed in 70 ms or
520 ms using fast or in-phase transfer schemes respectively. The speed and minimum impact
on the electrical system makes the fast transfer scheme the most preferred transfer method.

vi
TABLE OF CONTENTS
ABSTRACT ............................................................................................................................. v
TABLE OF CONTENTS ........................................................................................................ vi
LIST OF FIGURES .............................................................................................................. viii
LIST OF TABLES ................................................................................................................. xii
CHAPTER 1 - INTRODUCTION ........................................................................................... 1
1.1 Background ...................................................................................................................... 1
1.2 Purpose of research .......................................................................................................... 4
1.3 Objectives of the research ................................................................................................ 5
1.4 Scope of research work .................................................................................................... 5
1.5 Limitations ....................................................................................................................... 6
1.6 Outline of chapters ........................................................................................................... 6
CHAPTER 2 - THEORETICAL BACKGROUND AND LITERATURE REVIEW ............. 8
2.1 Introduction ...................................................................................................................... 8
2.2 Application and working principles of bus transfer system ............................................. 8
2.3 Residual voltage of induction motor .............................................................................. 12
2.4 Unit auxiliary power reticulation ................................................................................... 14
2.5 Boiler furnace pressure .................................................................................................. 18
2.6 Conclusion ..................................................................................................................... 19
CHAPTER 3 - RESEARCH METHODOLOGY ................................................................. 20
3.1 Introduction .................................................................................................................... 20
3.2 Modelling of induction machine .................................................................................... 20
3.3 Bus transfer design approach ......................................................................................... 29
3.4 Boiler furnace pressure dynamics .................................................................................. 30
3.5 Unit auxiliary power reticulation ................................................................................... 30
3.6 Bus transfer case studies ................................................................................................ 31
3.7 Conclusion ..................................................................................................................... 32
CHAPTER 4 - BUS TRANSFER SYSTEM DESIGN .......................................................... 33
4.1 Introduction .................................................................................................................... 33
4.2 Fast Bus Transfer System............................................................................................... 33
4.3 Phasor Computation ....................................................................................................... 33
4.4 Delta phase angle calculation ......................................................................................... 34
4.5 Phasor angular characteristics ........................................................................................ 35
4.6 Angular velocity and angular acceleration computation algorithm ............................... 35
4.7 Fast bus transfer scheme ................................................................................................ 36

vii
4.8 Fast bus transfer simulation ........................................................................................... 37
4.9 Fast bus transfer simulation results ................................................................................ 39
4.10 In-phase bus transfer scheme ......................................................................................... 43
4.11 Residual bus voltage transfer scheme ............................................................................ 50
4.12 Simulink model of bus transfer device ........................................................................... 56
4.13 Discussion ...................................................................................................................... 58
4.14 Conclusion ..................................................................................................................... 59
CHAPTER 5 - BUS TRANSFER CASE STUDIES OF DRAUGHT MOTORS ................. 60
5.1 Introduction .................................................................................................................... 60
5.2 Thermal Power Plant ...................................................................................................... 60
5.3 South African coal fired power generating plants .......................................................... 61
5.4 Impact of loss of draught on boiler furnace pressure protection .................................... 63
5.5 Response of furnace draught pressure when power supply is interrupted ..................... 64
5.6 Bus transfer case studies ................................................................................................ 67
5.8 Conclusion ................................................................................................................... 118
CHAPTER 6 - CONCLUSIONS ......................................................................................... 120
6.1 Introduction .................................................................................................................. 120
6.2 Case study 1: Transfer of induced draught fan motor .................................................. 120
6.3 Case study 2: Transfer of forced draught and primary air fan motors ......................... 121
6.4 Case study 3: Transfer of forced and induced draught fan motors .............................. 122
6.5 Case study 4: Transfer of service medium voltage board C load to board D ............... 123
6.6 Recommendations ........................................................................................................ 123
REFERENCES..................................................................................................................... 126

viii
LIST OF FIGURES
Figure 2-1: Open bus transfer schemes transfer methods [14] ................................................. 9
Figure 2-2: Motor terminal residual decay characteristic [21] ............................................... 13
Figure 2-3: Main-tie breaker configuration [19] .................................................................... 15
Figure 2-4: Main-tie-main breaker configuration [19] ........................................................... 15
Figure 3-1: Induction machine directly supplied through a circuit breaker ........................... 21
Figure 3-2: Start-up current, electromagnetic torque and shaft speed ................................... 22
Figure 3-3: Rotor flux, stator flux, stator to rotor flux ration and rotor flux angle during
motor start-up ................................................................................................................. 23
Figure 3-4: Motor bus terminal voltage ‘Phase A’, shaft speed and frequency ..................... 24
Figure 3-5: Rotor current, stator current and rotor angle upon loss of power supply ............ 26
Figure 3-6: Rotor flux, stator flux and electromagnetic upon loss of power supply .............. 27
Figure 3-7: Residual voltage magnitude and phase angle upon loss of power supply ........... 28
Figure 3-8: Residual voltage phasor diagram upon loss of power supply ............................. 29
Figure 3-9: Main-tie-main reticulation configuration ............................................................ 29
Figure 3-10: Modelling of auxiliary reticulation in Simulink ................................................ 30
Figure 3-11: Motor aggregation approach ............................................................................. 31
Figure 4-1: Delta phase angle computation............................................................................ 34
Figure 4-2: Angular velocity ( ∅′𝐭𝐢) and angular acceleration (∅′"𝐭𝐢) computation algorithm36
Figure 4-3: Fast bus transfer scheme ..................................................................................... 37
Figure 4-4: Simulink fast bus transfer model configuration .................................................. 38
Figure 4-5: Voltage and frequency response during a fast bus transfer process .................... 39
Figure 4-6: Phase angle and shaft speed response during a fast bus transfer process ............ 40
Figure 4-7: Current and torque response during a fast bus transfer process .......................... 41
Figure 4-8: Rotor flux response during a fast bus transfer process ........................................ 42
Figure 4-9: Bus voltage phasor response during a fast bus transfer process .......................... 43
Figure 4-10: Phase coincidence prediction algorithm ............................................................ 44
Figure 4-11: In – phase bus transfer scheme .......................................................................... 45
Figure 4-12: Voltage and frequency response during an in – phase bus transfer process...... 46
Figure 4-13: Phase angle and shaft speed response during an in – phase bus transfer process47
Figure 4-14: Current and torque response during an in – phase bus transfer process ............ 48
Figure 4-15: Rotor flux angle response during an in – phase bus transfer process ................ 49
Figure 4-16: Bus voltage phasor response during an in - phase bus transfer process ............ 50
Figure 4-17: In – phase bus transfer scheme .......................................................................... 51
Figure 4-18: Voltage and frequency response during an in – phase bus transfer process...... 52

ix
Figure 4-19: Phase angle and shaft speed response during residual bus voltage transfer
process ............................................................................................................................ 53
Figure 4-20: Current and torque response during an in – phase bus transfer process ............ 54
Figure 4-21: Rotor flux angle response during a residual bus voltage transfer process ......... 55
Figure 4-22: Bus voltage phasor response during a residual bus voltage transfer process .... 56
Figure 4-23: Simultaneous and sequential modes of operation ............................................. 57
Figure 4-24: Bus transfer device model as modelled in matlab simulink .............................. 57
Figure 4-25: Summary of bus transfer results of induced draft fan from board A to board B 58
Figure 5-1: High-level thermal power plant auxiliary electrical system ................................ 60
Figure 5-2: Unit auxiliary power reticulation system ............................................................ 62
Figure 5-3: Simplified draught group motor breaker trip logic on power supply failure ...... 64
Figure 5-4: Induced draught fan pressure response when both induced and forced draught
fans lose power simultaneously [36] .............................................................................. 65
Figure 5-5: Boiler furnace draught pressure on loss of one forced draught system motor
[36] ................................................................................................................................. 65
Figure 5-6: Forced draught fan pressure response when both induced and forced draught fans
lose power simultaneously [36] ...................................................................................... 66
Figure 5-7: Boiler furnace draught pressure on loss of induced and forced draught system
motors [36] ..................................................................................................................... 66
Figure 5-8: Service medium voltage boards A and B load configuration .............................. 67
Figure 5-9: Service medium voltage boards C and D load configuration .............................. 68
Figure 5-10: Busbar voltage, bus phase angle and speed response during a fast bus transfer of
induced draught fan motor to service medium voltage board D .................................... 70
Figure 5-11: Induced draught motor Stator current, electromagnetic torque and rotor flux
angle response during a fast bus transfer to service medium voltage board D............... 71
Figure 5-12: Busbar voltage, bus phase angle and speed response during in-phase bus
transfer of induced draught fan motor to service medium voltage board D ................... 73
Figure 5-13: Induced draught motor stator current, electromagnetic torque and rotor flux
angle response during an in-phase bus transfer to service medium voltage board D ..... 75
Figure 5-14: Busbar voltage, bus phase angle and speed response during residual bus voltage
transfer of induced draught fan motor to service medium voltage board D ................... 77
Figure 5-15: Induced draught motor stator current, electromagnetic torque and rotor flux
angle response during residual bus voltage transfer to service medium voltage board D78
Figure 5-16: Busbar voltage, bus phase angle and primary air fan motor speed response
during a fast bus transfer of forced draught and primary air fan motors to service
medium voltage board B ................................................................................................ 81
Figure 5-17: Primary air fan stator current, electromagnetic torque and rotor flux angle
response during fast bus transfer of forced draught and primary air fan motors to service
medium voltage board B ................................................................................................ 82

x
Figure 5-18: Busbar voltage, busbar phase angle and primary air fan speed response during
in-phase bus transfer of forced draught and primary air fan motors to service medium
voltage board B .............................................................................................................. 84
Figure 5-19: Primary air fan motor stator current, electromagnetic torque and rotor flux angle
response during an in-phase bus transfer of induced draught fan motor to service
medium voltage board B ................................................................................................ 86
Figure 5-20: Busbar voltage, busbar phase angle and speed response during residual bus
voltage transfer of both forced draught and primary air fan motors to service medium
voltage board B .............................................................................................................. 88
Figure 5-21: Primary air fan motor stator current, electromagnetic torque and rotor flux angle
response on residual bus voltage transfer of forced draught and primary air fan motors
to service medium voltage board B ................................................................................ 89
Figure 5-22: Proposed service medium voltage boards A and B load configuration ............. 91
Figure 5-23: Proposed service medium voltage boards C and D load configuration ............. 91
Figure 5-24: Busbar voltage, bus phase angle and induced draught fan motor speed response
during a fast bus transfer of forced and induced draught fans motors to service medium
voltage board B .............................................................................................................. 93
Figure 5-25: Induced draught fan stator current, electromagnetic torque and rotor flux angle
response during fast bus transfer of forced and induced draught fan motors to service
medium voltage board B ................................................................................................ 94
Figure 5-26: Busbar voltage, busbar phase angle and induced draught fan speed response
during in-phase bus transfer of forced and induced draught fan motors to service
medium voltage board B ................................................................................................ 96
Figure 5-27: Induced draught fan motor stator current, electromagnetic torque and rotor flux
angle response during an in-phase bus transfer of induced draught fan motor to service
medium voltage board B ................................................................................................ 98
Figure 5-28: Busbar voltage, busbar phase angle and speed response during residual bus
voltage transfer of both forced and induced draught fan motors to service medium
voltage board B ............................................................................................................ 100
Figure 5-29: Induced draught fan motor stator current, electromagnetic torque and rotor flux
angle response on residual bus voltage transfer of forced and induced draught fan
motors to service medium voltage board B .................................................................. 101
Figure 5-30: Busbar voltage, bus phase angle and induced draught fan motor speed response
during a fast bus transfer of all service medium voltage board C motors to service
medium voltage board D .............................................................................................. 104
Figure 5-31: Induced draught motor stator current, electromagnetic torque and rotor flux
angle response during fast bus transfer of all service medium voltage board C motors to
service medium voltage board D .................................................................................. 105
Figure 5-32: Busbar voltage, busbar phase angle and induced draught fan motor speed
response during an in-phase bus transfer of service medium voltage board C motors to
service medium voltage board D .................................................................................. 107

xi
Figure 5-33: Induced draught fan motor stator current, electromagnetic torque and rotor flux
angle response during an in-phase bus transfer of all service medium voltage board C
motors to service medium voltage board D .................................................................. 109
Figure 5-34: Busbar voltage, busbar phase angle and speed response during residual bus
voltage transfer service medium voltage board C motors to service medium voltage
board D ......................................................................................................................... 111
Figure 5-35: Induced draught motor stator current, electromagnetic torque and rotor flux
angle response during residual bus voltage transfer of forced and induced draught fan
motors ........................................................................................................................... 112
Figure 5-36: Bus transfer results of induced draught fan from service medium voltage board
C to service medium voltage board D .......................................................................... 114
Figure 5-37: Bus transfer results of forced draught and primary air fans from service medium
voltage board A to service medium voltage board B ................................................... 115
Figure 5-38: Bus transfer results of forced and induced draught fans from service medium
voltage board A to service medium voltage board B ................................................... 116
Figure 5-39: Bus transfer results of service medium voltage board C to service medium
voltage board D ............................................................................................................ 117

xii
LIST OF TABLES
Table 2-1: Comparison of main-tie and main-tie-main reticulation configuration
[14][18][19][21] ..................................................................................................................... 16
Table 4-1: Fast bus transfer system settings .......................................................................... 38
Table 4-2: In – phase bus transfer system settings ................................................................. 45
Table 4-3: Residual bus voltage transfer system settings ...................................................... 51
Table 5-1: Fast bus transfer system settings .......................................................................... 69
Table 5-2: In – phase bus transfer system settings ................................................................. 72
Table 5-3: Residual bus voltage transfer system settings ...................................................... 76

xiii
NOMENCLATURE
EHV Extra High Voltage
FD Forced Draught
Hz Hertz
I/C Incomer
ID Forced Draught
L.H. Left Hand
M Motor
MB Motor Bus
MCR Maximum Continuous Rating
N/C Normally Closed
N-m Newton Meter
p.u. Per Unit
R.H. Right Hand
RTDS Real Time Digital Simulator
UAT Unit Auxiliary Transformer
V Volt
VT Voltage Transformer

1
CHAPTER 1 - INTRODUCTION
1.1 Background
Coal fired power plants require auxiliary power in order to run auxiliary systems, which in
turn support the generation of power. The amount of required auxiliary power is usually in
the order of 4% - 7% [1][2], however it could be as high as 10% depending on the size of the
power generating unit, the type of flue gas cleaning system, as well as the applicable
environmental control legislation [3]. A power generating unit is made up of multiple units,
where a unit comprises one boiler, one turbine, one generator set and one generator step-up
transformer [4].
Unit auxiliary systems comprise systems that are directly linked to the unit generating
capability, of which their failures result in immediate loss of unit generating capability.
Therefore unit auxiliary systems are designed and configured to be redundant so as to
provide the required level of reliability, of which also the unit auxiliary power reticulation is
also designed to support the level of mechanical systems redundancy in order to maintain
process continuity whenever main power supply is lost as a result of upstream equipment
failures [1][2][4]. Main-tie-main auxiliary power reticulation configuration is used to
distribute power to unit auxiliary systems, wherein bus transfer systems can be integrated as
supervisory control systems to automatically transfer load to alternate healthy supply when
the main power supply is lost, [5][6][7].
Bus transfer systems comprise two categories, closed transition and open transition bus
transfer processes. Closed transition bus transfer is a process whereby an alternate supply is
temporarily paralleled with the main supply before the main supply is tripped, while open
transition bus transfer is a process whereby the main supply is tripped first before closing the
alternate supply [8][9]. Irrespective of the configuration of the bus transfer scheme, its
successful implementation is dependent on three aspects [2][3]:
a) Process requirements
Interruption of electrical power supply during the transfer should not negatively
impact mechanical systems; so as to disturb process continuity.
b) Electrical system requirements
Reacceleration of motors should not be achieved through the sacrifice of other systems
by means of load shedding, unless the process remains stable.

2
The method of transfer should consider impact on the electrical system and machines
so as to minimise excessive transient torques that overstress the motor windings, rotor,
shaft, and the driven load.
Interlocking systems should be integrated in the bus transfer design to prevent the
closing of an alternate supply onto a fault. Circuit breaker failure protection should be
used to initiate a trip to the alternate supply breaker in the event where the main
supply circuit breaker fails to open; this scenario can occur in a case where
simultaneous transfer is applied.
Electrical protection settings should be optimised to allow motors to reaccelerate
without tripping the incomer breaker, while providing adequate protection during
normal running of the plant.
c) Bus transfer system requirements
Reduction of speed on motors should not be too low so as to result in prolonged high
transient currents during reacceleration.
The transfer system should be reliable so as to support process continuity and not
compromise the electrical system.
The transfer scheme should be interfaced to the protection system to enable fast
detection of power failures as well as prevent prolonged paralleling of supplies when
the main supply breaker has failed to open.
Selection of any transfer method requires thorough understanding of its characteristics and
the impact it has on both the electrical system and the process plant.
Advantages of closed transition bus transfer process [6]:
No interruption to process continuity as power supply to load is maintained thought-
out the transfer process.
Non-complexity of scheme implementation using a synchronising check relay
supervision across alternate supply breaker.
Disadvantages of closed transition bus transfer process [6]:
Transfer method cannot be used when a failure has occurred on the system in order
to avoid feeding onto a fault.
Transfer method can only be used when the two supplies are synchronised.
Transfer method result in higher fault level on the busbar as a result of paralleling
the two supplies, the resulting currents usually exceed the interrupting capacity of
the circuit breakers concerned and short time rating of the source transformers.

3
Higher fault currents resulting from the paralleled supplies will over stress the
equipment should a failure occur during the transfer. Even though the probability of
the fault occurring may be considered to be small; the consequences of parallel
transfer method should be thoroughly evaluated before it is used.
Open transition bus transfer schemes can be classified into four different types, namely fast,
in-phase, residual voltage and slow bus transfer schemes. Fast and in-phase bus transfer
methods are regarded as high-speed transfer systems, while residual voltage and slow
transfer methods are regarded as slow transfer processes [3][10][11].
Fast, in-phase, residual voltage and slow bus transfer schemes can be configured for either
sequential or simultaneous transfer operation once initiated [3][10]. Sequential transfer is a
process whereby a main circuit breaker is tripped before the alternative source circuit breaker
is closed; an auxiliary contact 52a (‘open’) on the main circuit breaker is used to confirm that
the circuit breaker is open before a close command can be sent to the alternate circuit
breaker. In certain cases, an early contact 52b (‘not closed’); is used to minimise the bus
transfer execution time. The advantage of sequential transfer process is its ability to prevent
the paralleling of the two power supplies when the main supply fails to open, which would
otherwise lead to connecting the alternate supply onto a fault; thereby compromising the
overall auxiliary power reticulation. The disadvantage however is that the sequential process
lengthens the dead-time during the transfer process, which might negatively impact process
continuity as a result of machines slowing down to much lower speeds resulting in increased
machine slip and relatively high accelerating currents caused by the reduced effective rotor
resistances; especially where the driven loads are of low inertia. [2][12][13].
Simultaneous transfer however, is a process whereby, at the same time; both open and close
commands are sent to the main and alternate power supply circuit breakers respectively
[3][10][11]. The advantage of simultaneous transfer process is its shorter dead-time during
the transfer process, which keeps the machine slip relatively low resulting in relatively low
accelerating current since the effective rotor resistances of the respective machines remain
relatively very high during the transfer process; and thereby support process continuity even
where the driven loads are of low inertia. The disadvantage however, is its inability to
prevent the paralleling of the two power supplies when the main supply circuit breaker fails
to open, which causes the alternate supply to be connected onto a fault; thereby
compromising the overall auxiliary power reticulation [2][13]. In principle, simultaneous
load transfer process does not seem very different to that of sequential transfer process
because the circuit breaker operating times for closing and opening are not equal, this
operating characteristic of circuit breakers ensures that the tripping and opening breakers

4
cannot be closed at the same time if the transfer is successfully executed; unless the closed
circuit breaker malfunctions and fails to open.
Therefore, the possibility of paralleling the main and alternate supplies as a result of the
closed circuit breaker failing to open; and bus transfer dead-time are two distinct factors
between sequential and simultaneous bus transfer processes which can affect security of
supply and process continuity. In order to increase the security of supply, circuit breaker
protection is integrated to the transfer scheme in order to safe guard the electrical system by
minimising the duration that the alternate supply can feed onto a fault when the main circuit
breaker has failed to open [2].
1.2 Purpose of research
Main-tie-main reticulation configuration is used to distribute unit auxiliary power in a power
generating plant. The advantage of a main-tie-main reticulation configuration is its redundant
characteristic enabling provision of power between the two main supplies through the tie
breaker whenever power supply to one of the two boards has been lost as a result of
upstream equipment failure. The configuration makes the respective main supplies to be
back-up supplies to each other. The operating philosophy of Eskom power plants state that
the generating unit should be de-loaded to 50% of maximum continuous rating (MCR)
immediately when half of the required draught system is lost as a result of losing power to
one of the draught boiler auxiliary boards. The output power of the generating unit can be
restored to 80% - 90% of MCR upon manual restoration of power through the tie breaker [7].
The research focusses on the feasibility of using bus transfer system technology to
automatically transfer load to alternate healthy supply in order to maintain unit generating
capability in the event of losing power supply to one of the two main supplies on the main-
tie-main configuration. The research therefore seeks to answer the following questions:
What would be the challenges of implementing an automatic bus transfer scheme
between two motor buses with regard to reticulation ability to reaccelerate motors
simultaneously?
What effect can a bus transfer system have on power system stability of a power
generating unit auxiliary system, in particular voltage, as well as process continuity?
Are there specific bus transfer methods that are not suitable for application within a
power generating plant?
What is, or are the best transfer methods that are suitable for a particular system
condition?

5
1.3 Objectives of the research
The research explores the feasibility of using a bus transfer system to stabilise power supply
in a coal fired unit auxiliary reticulation whenever power supply has been lost as a result of
upstream equipment failure in order to maintain process continuity, in particular the
following aspects are covered:
Investigation into the functionality of a multi-function bus transfer system
comprising fast, in-phase and residual voltage bus transfer schemes.
Investigation into the impact of the respective bus transfer schemes on the electrical
system, in particular voltage stability upon load transfer scheme execution, and the
ability of the electrical system to reaccelerate motors.
Impact of load transfer on a coal fired power plant boiler furnace pressure stability,
and the feasibility of maintaining process continuity whenever power disturbance
resulting in loss of power occur.
Investigate and recommend the most suitable unit auxiliary reticulation
configuration with integrated bus transfer system to supervise load transfers during
power supply failures, as well as support boiler furnace pressure stability.
1.4 Scope of research work
The scope of research work covered in the thesis is limited to unit auxiliary power
reticulation and its impact on the boiler plant as a result of power disturbances which often
lead to undesirable reduction in unit power generating capability.. The following aspects are
covered in detail:
Analysis of induction motor residual voltage characteristics under heavily loaded
condition to serves as basis for the design of a multi-function bus transfer system.
Development of a multi-function open transition bus transfer system comprising fast,
in-phase and residual voltage bus transfer schemes.
Impact analysis of bus transfer system on unit auxiliary main-tie-main power
reticulation configuration to enable bus transfer case studies of various plant
conditions in order to determine conditions under which the respective transfer
schemes can be used to stabilise power supply following a loss of supply on one of
the main supplies as a result of upstream equipment failure.
Recommendation and simulation of an optimised unit auxiliary power reticulation
configuration with integrated bus transfer system to support an overall fail-safe
design of the boiler plant while enabling stabilisation of power supply when power
supply failure to one of the main supplies occurs.
6
Recommend the most suitable bus transfer scheme with regards to performance and
its impact on the electrical system, as well as the mechanical process, in particular
boiler furnace draught pressure stability in order to prevent furnace explosions and
implosions.
1.5 Limitations
Real-time simulations or actual plant tests have not been conducted as part of the
research work, as such, the results presented in the thesis serve to share some
insights and encourage further research on the topic of bus transfer application in the
South African power generating plants.
Boiler furnace pressure dynamics have not been modelled as part of the research
work, instead the research work is based on plant operating manuals, National Fire
Protection Association standard and furnace pressure dynamic simulation studies of
similar plants to determine acceptable conditions under which successful load bus
transfers will support furnace pressure stability.
1.6 Outline of chapters
Chapter 2 presents theoretical background as well as literature review on the bus transfer
system, residual voltage of induction motor, coal fired unit power auxiliary reticulation
configuration and boiler furnace draught pressure protection system.
Chapter 3 presents modelling methodologies of major systems used in the research,
comprising induction motors, simulation of residual voltage, bus transfer system and unit
auxiliary power reticulation, as well as the approach taken to conduct bus transfer case
studies.
Chapter 4 presents the design, modelling and simulation of a multi-function open transition
bus transfer system comprising fast, in-phase and residual voltage bus transfer schemes in
Matlab Simulink. Evaluation of bus transfer system is achieved using ideal sources.
Chapter 5 presents the unit auxiliary power reticulation configuration of a typical South
African power plant, review of furnace boiler pressure dynamics, modelling of unit auxiliary
reticulation in Matlab Simulink using DigSilent PowerFactor simulation results, as well as
case studies performed in the research work. Furthermore, a new reticulation configuration is
proposed and simulated as a case study.
Chapter 6 summarises the results of the various case studies performed in chapter 5, and
draws conclusions. Recommendations on the application of bus transfer system to stabilise

7
power supply in a unit auxiliary reticulation while maintaining a stable boiler furnace
pressure are made. Future research work is also proposed in this chapter.

8
CHAPTER 2 - THEORETICAL BACKGROUND AND
LITERATURE REVIEW
2.1 Introduction
More than 90% of unit auxiliary load comprise induction motors according to [8][9][10].
The total auxiliary load of a power generating plant is stated to be in the order of 7% of the
maximum continuous rating (MCR) of the plant in [2]; while [3] suggest that the total unit
auxiliary load power can be higher than stated in [2], depending on the type of flue gas
cleaning system that is used. The size of both forced and induced draught fan motors
contribute as much as 48% to the boiler auxiliary load power requirement of a unit power
generating plant, with the induced fan motor sized at 150% larger than the forced draught fan
motor. The size of the induced draught fan motor allow evacuation of flue gas through the
flue gas cleaning system, wherein both the induced draught and primary air fans supply
combustion air and fuel to the boiler furnace respectively. The induced draught fans also
maintain negative pressure in the furnace. Relatively small unit generating plants comprise
one set of forced and induced draught fans as stated in [6], while large unit power generating
plants comprise two sets of forced and induced draught fans according to [10].
Power plant unit auxiliary power interruptions often result in complete power supply failure;
which can be mitigated or avoided by the application of an automated bus transfer system.
Automatic bus transfer is a process of transferring a load bus from one supply to a healthy
alternative supply. The transfer is initiated to transfer bus load to an alternative supply when
the main power supply becomes unavailable. The application of a bus transfer system is
aimed at improving power supply security by stabilising power in the event of a sudden loss
of main power supply [11][12].
2.2 Application and working principles of bus transfer system
Bus transfer systems are used in industrial facilities in general, as well as in coal fired power
plants to transfer unit auxiliary load between house load power and station utility transformer
[12]. The objective of bus transfer system application is to maintain process continuity in the
sudden loss of power supply to a process plant, ensure safety of plant and personnel,
minimise cumulative damage on the machines and their driven loads as a result of closing
out of phase, as well as to safely shutdown the plant or provide start-up power accordingly
[13]. Coal fired power plants and industrial facilities consist of many types of loads, of
which majority of the loads are induction machines driving loads such as boiler feed pumps,
draught group fans, pulverisers and cooling water pumps [12][14].

9
Successful implementation of a bus transfer system using any of the fast, in-phase and
residual voltage bus transfer schemes is dependent on the characteristics of the electrical
system and the connected load, of which induction motors have a characteristic of inducing a
decaying voltage on the motor terminals when abruptly disconnected from a power supply
[15]; this phenomenon together with the decaying frequency of the residual voltage
complicates the application of bus transfer system according to [13][16][17]. Slow bus
transfer process however, is only dependent on time considered to be safe to execute a load
transfer; the time should be long enough to ensure that residual bus voltage has subsided to
almost zero so as not to compromise the electrical system, damage the machine or harm the
process. Therefore slow transfer is not considered further since it does not present any form
of complexity to the electrical system and the connected load except that it would probably
not support full process continuity due to its much higher transfer dead-time and therefore
much higher reaccelerating transient current and torque.
2.2.1 Fast bus transfer scheme
Fast bus transfer scheme is a process of transferring a load bus from a main power supply to
an alternate supply when the main supply fails. The scheme transfer algorithm ensures that
the two supplies are in synchronism by comparing the phase difference and the voltage
magnitudes between the two supplies. The bus transfer is executed within 10 cycles of power
supply failure during the time when the residual bus voltage has not decayed much, and the
phase angle is till closer to that of the alternate supply. Residual bus voltage and phase angle
of <0.85 p.u. and ±35o respectively are required for the fast transfer to be executed as
depicted in Zone ‘1’ of Figure 2-1 [18].
Figure 2-1: Open bus transfer schemes transfer methods [14]

10
Advantages of fast bus transfer process [19][20]:
Power interruption on the motor bus is minimised because of its high transfer speed.
The transfer process is reliable and fast, as well as economic as far as keeping
motors running during the transfer process.
Paralleling of main and alternate supply is avoided by the open transfer
characteristic of the transfer method.
Shorter dead-time resulting in low reaccelerating transient currents, and therefore
lower reaccelerating transient torques.
Does not result in increased fault level during the transfer process.
2.2.2 In-phase bus transfer scheme
In-phase bus transfer scheme is a process of transferring a load bus from a main power
supply to an alternate supply when the main supply has failed. Similar to the fast bus scheme
transfer algorithm, the scheme ensures that the two supplies are synchronised by comparing
the phase difference and the voltage magnitudes between the two supplies before the transfer
is executed. The bus transfer is executed when the phase angle of the residual voltage has
rotated one full slip cycle of 360o within 50 cycles of power supply failure during the time
when the residual bus voltage has not decayed much, and the phase angle is in synchronism
with the alternate supply phase angle. Residual bus voltage and phase angle of >0.25 p.u. and
±20o respectively are required for the in-phase bus transfer to be executed as depicted in
Zone ‘2’ of Figure 2-1 [18].
Advantages of in-phase bus transfer process [14][20][21]:
Relatively faster execution time compared to residual bus voltage transfer process
Reduces the pre-closure V/Hz due to its synchronous closing characteristic, which
reduces transient currents and torques.
Enables bus transfer of supplies with out-of-synchronism initial conditions and
where large initial standing angles cannot be executed using fast transfer scheme.
In-phase transfer process can serve as a backup to fast transfer process.
The main disadvantage of in-phase bus transfer process is that it may require combination of
synchronous machines and capacitors to support residual bus voltage, especially where low
inertia loads are connected. As a result, load shedding of low priority loads may be required
for the application of the transfer scheme.
11
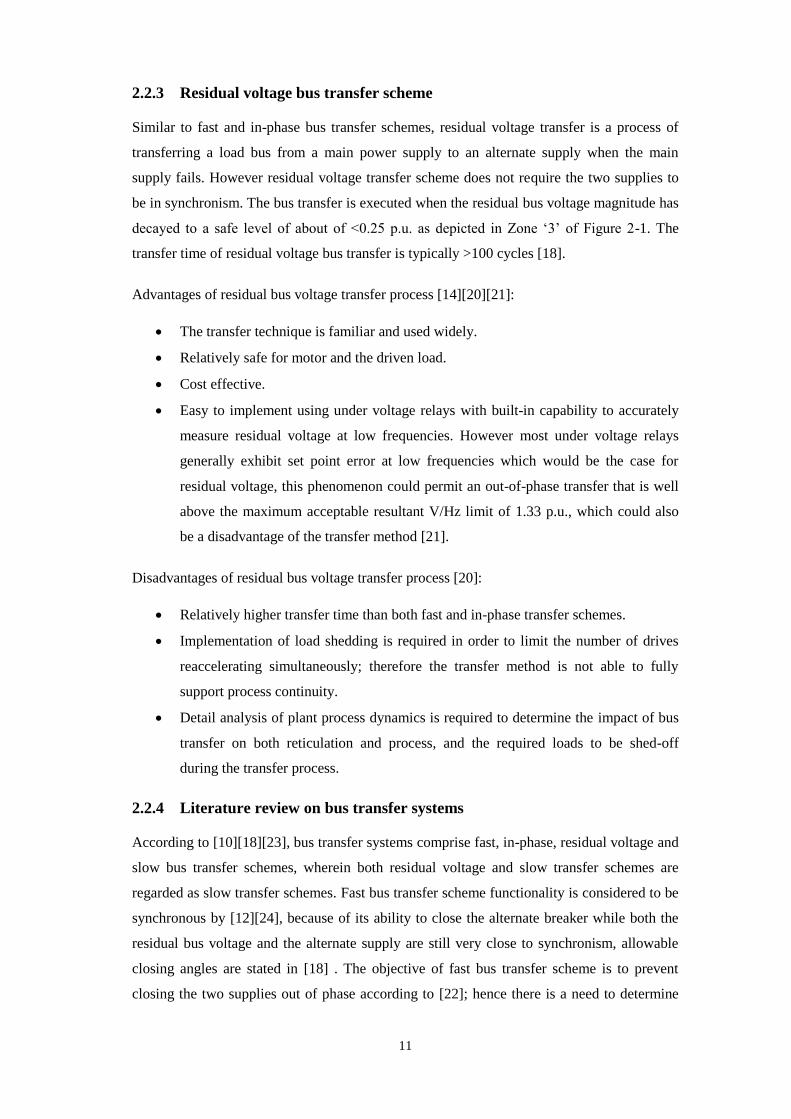
2.2.3 Residual voltage bus transfer scheme
Similar to fast and in-phase bus transfer schemes, residual voltage transfer is a process of
transferring a load bus from a main power supply to an alternate supply when the main
supply fails. However residual voltage transfer scheme does not require the two supplies to
be in synchronism. The bus transfer is executed when the residual bus voltage magnitude has
decayed to a safe level of about of <0.25 p.u. as depicted in Zone ‘3’ of Figure 2-1. The
transfer time of residual voltage bus transfer is typically >100 cycles [18].
Advantages of residual bus voltage transfer process [14][20][21]:
The transfer technique is familiar and used widely.
Relatively safe for motor and the driven load.
Cost effective.
Easy to implement using under voltage relays with built-in capability to accurately
measure residual voltage at low frequencies. However most under voltage relays
generally exhibit set point error at low frequencies which would be the case for
residual voltage, this phenomenon could permit an out-of-phase transfer that is well
above the maximum acceptable resultant V/Hz limit of 1.33 p.u., which could also
be a disadvantage of the transfer method [21].
Disadvantages of residual bus voltage transfer process [20]:
Relatively higher transfer time than both fast and in-phase transfer schemes.
Implementation of load shedding is required in order to limit the number of drives
reaccelerating simultaneously; therefore the transfer method is not able to fully
support process continuity.
Detail analysis of plant process dynamics is required to determine the impact of bus
transfer on both reticulation and process, and the required loads to be shed-off
during the transfer process.
2.2.4 Literature review on bus transfer systems
According to [10][18][23], bus transfer systems comprise fast, in-phase, residual voltage and
slow bus transfer schemes, wherein both residual voltage and slow transfer schemes are
regarded as slow transfer schemes. Fast bus transfer scheme functionality is considered to be
synchronous by [12][24], because of its ability to close the alternate breaker while both the
residual bus voltage and the alternate supply are still very close to synchronism, allowable
closing angles are stated in [18] . The objective of fast bus transfer scheme is to prevent
closing the two supplies out of phase according to [22]; hence there is a need to determine
12
the decay characteristics of the residual bus voltage according to [23] in order to enable
synchronous bus transfer. Research work by [15][24][25] have shown that the phase angle of
a bus residual voltage can be calculated using Taylor’s series expansion. Furthermore,
literature presented in [25] suggests that a second order series is sufficient to accurately
calculate the phase angle movement with time. However [14] proposes a lookup table
method to determine the phase angle of the residual voltage on the motor board. This
approach is achieved through detailed plant modelling and simulation studies, or actual plant
measurement records. The main disadvantage of this method is that it is not flexible to plant
load changes which can be as a result of standby motors being switched on and off, or
machine loading.
A method of calculating residual bus voltage magnitude and phase angle using Park’s
transformation is proposed by [23], which according to [16][26][27] assumes that the system
is balanced. Simulation results of the proposed method using Park’s transformation in [23]
are satisfactory; this is so even when the Taylor’s series is reduced to only the first order
term in the case of in-phase bus transfer application; instead of the second order equation
stated in [25]. This is because the second order derivative becomes very small to be ignored
by the time the phase angle has slipped by close to 360o. However due to the relatively high
accelerating transient current and torque produced during the in-phase bus transfer process
compared to fast bus transfer process, [20] recommend that a consideration for integrating a
load shedding scheme to trip non-priority loads during in-phase bus transfer process be made
where the transfer process is applied.
Residual voltage bus transfer scheme is only depended on the magnitude of the residual
voltage according to [18]; this characteristic is supported by [28] stating that the objective of
using a low voltage setting is to ensure that the per unit volts/per unit frequency (V/Hz) ratio
is less than 1.33 in order to limit the accelerating transient current and torque. However
[29][30] suggest that the 1.33 V/Hz criteria is not sufficient to ensure that the safe torque
limits will not be exceeded, and therefore recommend that studies should be performed prior
to implementing the transfer method.
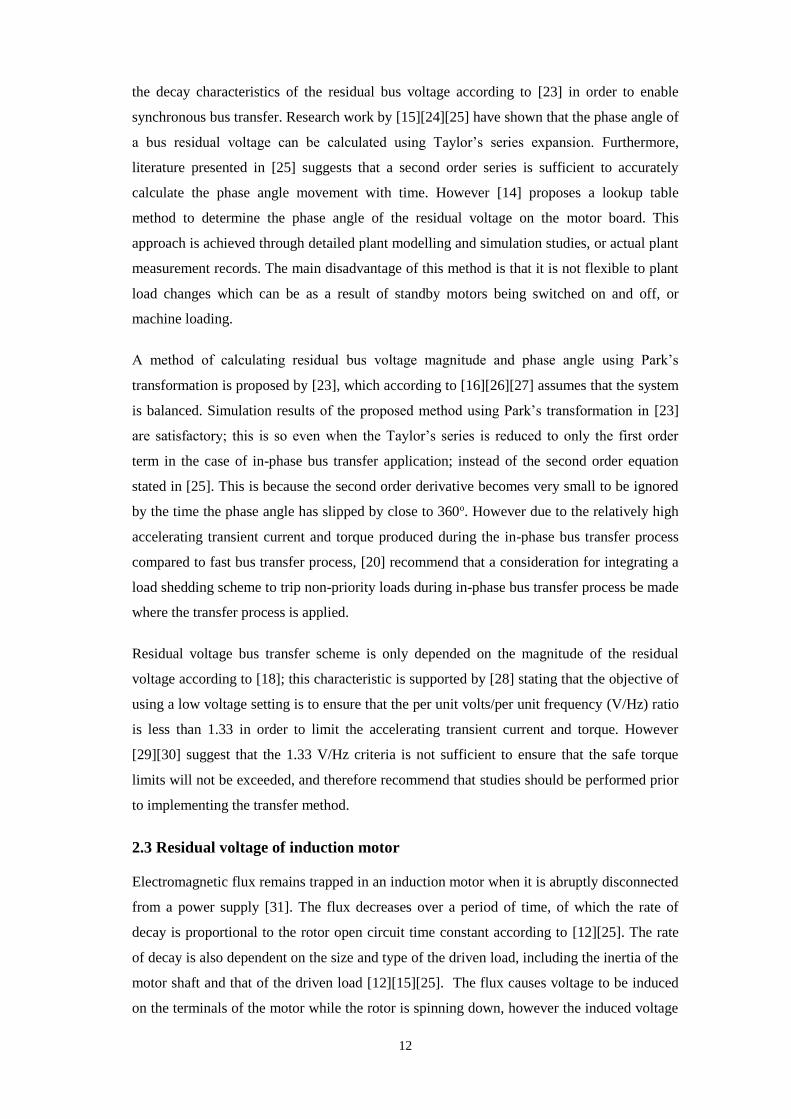
2.3 Residual voltage of induction motor
Electromagnetic flux remains trapped in an induction motor when it is abruptly disconnected
from a power supply [31]. The flux decreases over a period of time, of which the rate of
decay is proportional to the rotor open circuit time constant according to [12][25]. The rate
of decay is also dependent on the size and type of the driven load, including the inertia of the
motor shaft and that of the driven load [12][15][25]. The flux causes voltage to be induced
on the terminals of the motor while the rotor is spinning down, however the induced voltage

13
decays as the flux weakens [14][31]. The induced voltage on the motor terminals is referred
to as residual voltage [12][31]. Equation (2.1) describes the characteristic of the motor
residual voltage when it is abruptly disconnected from a power supply, and remains open-
circuited [21].
𝑉𝑡 = 𝑉𝑒−𝑡/𝑇𝑜 (2.1)
Where Vt is the residual voltage at time t, V is the initial voltage at the time of power supply
disconnection, To is the open-circuit time constant in seconds, and t is the time after the
opening of the circuit breaker. The open circuit time constant of the motor residual voltage to
decay to 36.8 % is computed using equation (2.2) [21].
𝑇𝑜 = (𝑋𝑚 + 𝑋𝑟)/2𝜋𝑓𝑅𝑟 (2.2)
Where Xm is the magnetising reactance of the motor, Xr is the rotor reactance, f is the
frequency of the supply, and Rr is the rotor resistance. However, magnetising reactance Xm is
relatively very high when is compared to the rotor reactance Xr, equation (2.2) can therefore
be simplified to equation (2.3) [21].
To = Xm/2πfRr (2.3)
Figure 2-2 depicts the residual voltage magnitude decay characteristic of the motor when it is
abruptly disconnected from the power supply.
Figure 2-2: Motor terminal residual decay characteristic [21]
The residual voltage is considered to be safe to execute a transfer when its vector summation
with the alternate supply voltage is less than 1.33 V/Hz p.u., which implies a frequency
decay of up to 94% when residual bus voltage magnitude has decayed to 0.25 p.u. However

14
the motor transfer standard does not state the basis for the V/Hz criteria; impact studies
relating to the selection of the transfer method may be required prior to implementing the
transfer method [21][14].
The phenomenon of frequency decay and the subsequent shift in phase angle of the residual
voltage over a period of time is a distinct characteristic of an induction machine, which is
due to the machine speed that decreases upon loss of power supply [14][31].
2.3.1 Literature review on residual voltage of induction motor
Although induction motors generate power when abruptly disconnected from a power supply
according to [14][31], this is not always the case when multiple induction motors are
connected on the same busbar according to [32]; stating that relatively large motors changes
mode of operation to induction generating mode as a result of reversal of the voltage across
the motor stator leakage inductance while relatively small motors continue to operate as
motors. Furthermore, according [32] the largest power generating machine determines the
frequency of the residual voltage on the busbar. The duration of power generation is
dependent on the amount of trapped flux in the machine, which is also dependent on the
level of machine load before power was lost. Research work presented in [32] states that the
overall characteristic of the residual bus voltage is the aggregate effect of the connected
motors and their respective loads. It is therefore recommended to model the motors
individually as in [26] in order to enable behavior analysis of each of the various machines
during transfer execution, instead of aggregating the motors according to [33][34]; which is
suitable for investigating aggregate motor impact on the electrical system.
2.4 Unit auxiliary power reticulation
Coal fired power plant unit auxiliary load and industrial process plants generally have main
and backup power supply to increase the reliability of the overall power supply to the plant
[11][12][15]. The configuration of the redundant electrical reticulation can take different
forms depending on the requirements of the process plant and the availability of backup
power supply, however main–tie and main–tie–main breaker redundant configurations are
the most commonly used configurations in large coal fired power plants and process plants.
Small coal fired power plants, or small scale manufacturing plants with critical loads often
employ the main-tie configuration, while main-tie-main breaker configuration is applied in
industrial facilities because of its advantage for each source to serve as both main and
backup supply for its load bus and to the other load bus through the tie breaker respectively
[13][14][18]. Figure 2-3 and Figure 2-4 depict the layout of both main–tie and main–tie–
main breaker redundant configurations with integrated bus transfer system.

15
M
Station Board
UB_VT SB_VT
Tie-Breaker
Bus Transfer
System
M
Generator
Transformer
Generator
Unit Auxiliary
Transformer
Unit Board
Generator
Transformer
Breaker
EHV Bus
Station
Transformer
Station Board
Incomer
Breaker
N/C
Station
Transformer
Breaker
UAT
I/C
Figure 2-3: Main-tie breaker configuration [19]
M
BUS - 1
SOURCE 1
BUS-1_VT BUS-2_VT
I/C 2
Breaker
I/C 1
Breaker
Tie-Breaker
Bus Transfer
System
Transformer
1Transformer
2
M M M
BUS - 2
SOURCE 2
Figure 2-4: Main-tie-main breaker configuration [19]
Table 2-1 present the comparison between the main-tie and main-tie-main reticulation
configuration focusing on process requirements and design consideration:

16
Table 2-1: Comparison of main-tie and main-tie-main reticulation configuration [14][18][19][21]
Criteria of comparison Main-tie configuration Main-tie-main configuration
Process
Adaptability to
mechanical system plant
redundancy
Configuration provides
sufficient electrical system
redundancy, however is
unable to support
mechanical system
redundancy if more than
one process line exists.
Configuration provides
sufficient electrical system
redundancy with adequate
adaptability to mechanical
process redundancy
requirements.
Process continuity Support process continuity
in so far as main power
supply failure is concerned;
however a fault on the
busbar will result in a
complete loss of plant
production.
Support process continuity in
case of main supply failure, as
well as able to support limited
plant production when a
failure had occurred on one of
the two boards, depending on
mechanical plant
configuration.
Design
Switchgear sizing with
regards to fault current
rating
May result in high busbar
fault current rating, and
therefore high capital
expenditure.
Transformer sizes can be
reduced to limit fault current
rating of the switchgear;
however care should be taken
to have sufficient fault current
for motor acceleration and or
reacceleration.
Simplicity of interlocking
systems
Simple implementation of
interlocking logic due to
lower number of circuit
breakers to be interfaced.
Implementation of
interlocking logic is more
complex compared to main-tie
interlocking requirement,
which may also reduce the
reliability of the overall
system.

17
Busbar protection Simple implementation of
busbar protection since
only one zone exists.
Busbar protection is more
complex compared to main-tie
bus configuration since more
than one zone exist; also the
switchboards may be not
adjacent to each other, and
therefore the need to protect
the cables between
switchboards.
The comparison between main-tie and main-tie-main reticulation configuration indicates that
the suitability of each configuration is dependent on the requirements of the process and the
ability of the electrical system to tolerate disturbances such as electrical faults or abnormal
conditions in the form of temporary equipment overloading.
2.4.1 Literature review on unit auxiliary power reticulation
Multi-unit power generating plants comprise unit and common plant auxiliary loads [4].
According to [24], unit auxiliary load can be supplied from either the generator terminals or
the power utility supply. The choice of supply configuration is dependent on the required
level of supply reliability and the associated cost of energy from the power utility as stated in
[7]. Research work presented in [24] suggests that both supplies are required depending on
the state and condition of the plant; furthermore [24] suggest that a bus transfer scheme
should be used to transfer supplies as and when it is required to meet process requirements.
Closed transition bus transfer scheme is used to execute planned supply transfers between
unit and utility power supplies. The view of using closed transition transfer scheme to
execute planned transfers is also supported by [19][29]. The advantage of closed transition
bus transfer scheme is its characteristic to execute bus transfer without affecting the stability
of the motors and the driven process. According to [19], the major drawback of the closed
transition bus transfer is that the process results in higher fault level during the time when the
two supplies are closed at the same time.
According to [19], there is also a need to transfer unit auxiliary load to station utility supply
whenever the generator trips in order to safely shutdown the generating unit. Much research
work including the work of [12][14][19] support the view presented by [19], further stating
that station utility to generator supply transfer is required upon successful power generating
unit start-up. In large power generating plants such as the one presented [35], major boiler
draught system auxiliary loads such as forced and induced fans are designed and configured

18
such that two subsystems are each rated at 50% of required boiler furnace total draught
supply. The design configuration of the reticulation is such that one set of forced and
induced draught fan motors is fed from a common primary transformer as presented in [35].
Therefore failure of one of the two subsystems result in the unit losing 50% of its generating
capability as stated in [35][36]. However according to [35], main-tie-main reticulation
configuration enables manual restoration of power to the boiler auxiliary loads when power
has failed on one of the boards in order to increase the output power of the generating unit to
80% - 90% of maximum continuous rating of the generating unit.
Although bus transfer studies have been conducted between unit and station utility supplies
as presented in the work performed by [13][15][20], the feasibility of bus transfer schemes
between motor boards in a power generating plant with special reference to the impact it has
on the boiler furnace pressure is yet to be explored in the South African power generating
plants. Similar main-tie-main case studies presented in the work conducted by [23] looked at
in-phase bus transfer scheme between two motor boards which are supplied by two
independent lines. The loads on the boards comprised motors, capacitors and resistive loads.
However, the actual process driven by the motors was not discussed in [23]. Therefore the
study presented in [23] focused only on the electrical system and the impact on the motor.
The research work presented in this thesis also investigate the impact of the respective bus
transfer schemes; namely fast, in-phase and residual voltage transfer schemes, on the
mechanical process.
2.5 Boiler furnace pressure
Coal fired power plant boilers require furnace draught to enable fuel combustion in order to
produce the required steam pressure to drive the turbine, which in turn drives the generator
set to produce power. The required furnace draught is provided by two sets of draught
systems in large power generating plants. Forced and induced draught fans driven by
induction motors are used to supply and regulates furnace pressure to remain within the
design limits of the boiler furnace structure to prevent furnace explosion or implosion.
Modelling of furnace pressure dynamics and the associated impact on furnace structural
design specification enables the determination of furnace pressure alarms and trip set points,
however the safest approach to preventing boiler furnace explosion or implosion is to trip the
corresponding forced or induced draught fan as the first step following the loss of one of the
fans. Therefore the selection and design of the auxiliary electrical reticulation configuration
should be such that is supports fail-safe system requirements of the boiler plant [12][35][36]
[37][38].

19
2.5.1 Literature review on boiler furnace pressure protection
According to [35][37], boiler furnace explosion or implosion may occur as a result of high or
low furnace pressure respectively. In [37], high furnace pressure is stated to be usually as a
result of forced draught fan reaching its maximum test block capability; similarly furnace
implosion is as a result of induced draught fan reaching it maximum test block capability.
Furthermore, [37] states that 2 s can be allowed upon the loss of forced draught fan motor
before the unit begins to de-load. However, according to [38], loss of either induced or
forced draught fan motor should initiate a trip to the corresponding induced or forced
draught fan motor. Even though [37] states that time delay should be determined by the
boiler manufacturer, no consideration of any form of protection philosophy is presented, or
basis thereof. This approach is probably specific to boiler type and manufacturer. Boiler
safety standards [39][40] recommend that a detail risk assessment should be performed on
the boiler plant to determine the likelihood and the associated severity of any incident that
could occur as a result of boiler furnace explosion or implosion, the risk assessment should
inform the required level of boiler protection system reliability.
2.6 Conclusion
Residual bus voltage that results following the reversal of voltage across the stator leakage
inductance of induction motors require careful consideration in order to prevent closing the
motor bus onto alternate supply while it is out of phase. The choice of bus transfer process
should consider system capability to tolerate disturbances and abnormal conditions without
compromising the safety of personnel, as well as plant process requirements. In this research,
transfer of boiler draught fan motors of a thermal power plant is therefore investigated to
determine the feasibility of implementing a bus transfer scheme between two motor busses in
order to improve unit auxiliary power supply security when main power supply is lost as a
result of upstream equipment failure. Open transition bus transfer system has fault isolation
operating characteristic and therefore considered further in this research, while closed
transition bus transfer system is suitable for the restoration of the reticulation to normal state
of operation after open transition bus transfer process has been executed; and therefore not
investigated further in the following chapters.
20
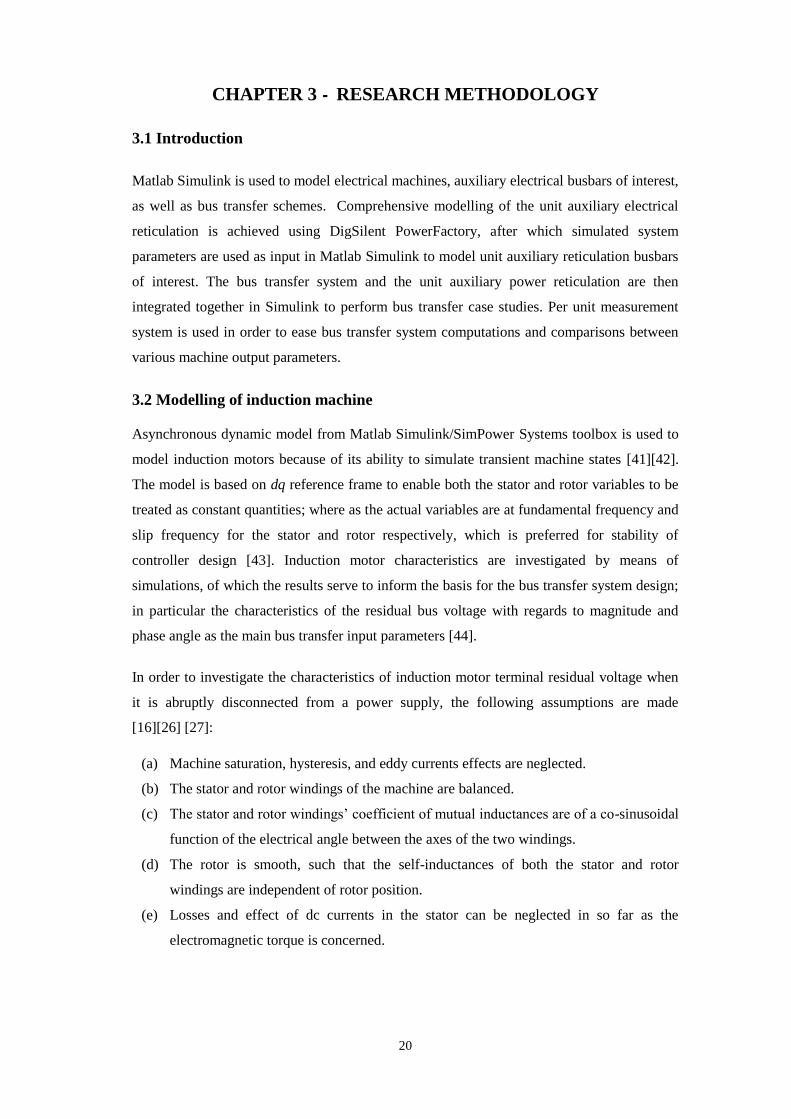
CHAPTER 3 - RESEARCH METHODOLOGY
3.1 Introduction
Matlab Simulink is used to model electrical machines, auxiliary electrical busbars of interest,
as well as bus transfer schemes. Comprehensive modelling of the unit auxiliary electrical
reticulation is achieved using DigSilent PowerFactory, after which simulated system
parameters are used as input in Matlab Simulink to model unit auxiliary reticulation busbars
of interest. The bus transfer system and the unit auxiliary power reticulation are then
integrated together in Simulink to perform bus transfer case studies. Per unit measurement
system is used in order to ease bus transfer system computations and comparisons between
various machine output parameters.
3.2 Modelling of induction machine
Asynchronous dynamic model from Matlab Simulink/SimPower Systems toolbox is used to
model induction motors because of its ability to simulate transient machine states [41][42].
The model is based on dq reference frame to enable both the stator and rotor variables to be
treated as constant quantities; where as the actual variables are at fundamental frequency and
slip frequency for the stator and rotor respectively, which is preferred for stability of
controller design [43]. Induction motor characteristics are investigated by means of
simulations, of which the results serve to inform the basis for the bus transfer system design;
in particular the characteristics of the residual bus voltage with regards to magnitude and
phase angle as the main bus transfer input parameters [44].
In order to investigate the characteristics of induction motor terminal residual voltage when
it is abruptly disconnected from a power supply, the following assumptions are made
[16][26] [27]:
(a) Machine saturation, hysteresis, and eddy currents effects are neglected.
(b) The stator and rotor windings of the machine are balanced.
(c) The stator and rotor windings’ coefficient of mutual inductances are of a co-sinusoidal
function of the electrical angle between the axes of the two windings.
(d) The rotor is smooth, such that the self-inductances of both the stator and rotor
windings are independent of rotor position.
(e) Losses and effect of dc currents in the stator can be neglected in so far as the
electromagnetic torque is concerned.

21
(f) Mechanical energy in the form of kinetic energy on the system is relatively too high
compared to the trapped electromagnetic energy for a machine operating near its rated
speed and load.
The next subsection evaluates the ability of the selected induction motor modelling method
to simulate residual voltage on the motor terminal when the motor is abruptly disconnected
from a power supply.
3.2.1 Simulation of induction motor
A model depicted in Figure 3-1 is setup in Matlab Simulink to investigate the residual
voltage characteristics of an induction motor in an abrupt loss of power supply. The
induction motor is assumed to be coupled to an induced draught fan of a coal fired power
generating plant [12]. The mechanical torque is proportional to the square of the fan speed.
The value of the inertia constant H of 5.23 s comprises inertias of the motor shaft and the
driven fan load [12].
M
4.0 kV, 50 Hz 3.73 MW – ID Fan
BA
GS
Circuit breaker
Figure 3-1: Induction machine directly supplied through a circuit breaker
3.2.1.1 Induction motor start-up simulation
The simulation is started at time t = 0 s when the circuit breaker is closed, the motor is
continuously loaded in proportion to the square of the shaft speed as the speed increases until
the torque reaches 1 p.u. load. Figure 3-2 depicts the start-up curves of the motor stator
current, electromagnetic torque and shaft speed.

22
Figure 3-2: Start-up current, electromagnetic torque and shaft speed
The motor continuously draw high current of 8.2 p.u. to accelerate the shaft to a full speed of
0.9959 p.u. at time t = 13.55 s as depicted in Figure 3-2(a) and Figure 3-2(c). The high
current magnitude is as a result of high slip value when the motor is initially powered up,
which causes the effective rotor resistance to be very low [14]. Electromagnetic torque of
3.908 p.u. initially develops as a result of the high current drawn by the machine in order to
overcome the combined friction of both the machine rotor and that of the driven fan load,
and then decreases once the machine starts picking up speed. The torque however gradually
increases in accordance with the fan load characteristics as depicted in Figure 3-2(b) until it
reaches 3.67 p.u. at time t = 13.39 s when the machine reaches full speed, then drops to 1
p.u. afterwards.
Figure 3-3(a) and Figure 3-3(b) depict the developed flux in the machine during start-up.
Rotor flux response is proportional to the output torque of the motor as depicted in Figure
3-3(a), this is because effective rotor resistance increases as the shaft speed increase. The
stator flux however, remains steady, and responds marginally to the developed
electromagnetic torque as depicted in Figure 3-3(b). The stator flux magnitude of 1.707
p.u. at time t = 13.11s is as a result of machine saturation, hysteresis, and eddy currents
effects which have not been considered during simulation. The results of the simulation are
considered to be accurate since mechanical energy in the form of kinetic energy on the
0 5 10 15
0
5
10
(a)
Sta
tor
cu
rren
t (p
.u.)
0 5 10 15
-5
0
5
(b)
To
rqu
e (
p.u
.)
0 5 10 15
0
0.5
1
(c)
Sh
aft
sp
eed
(p
.u.)
Time (s)
0.12 s, 3.908 p.u.
4.998 s, 8.215 p.u.
13.39 s, 3.67 p.u.
13.55 s, 1.001 p.u.
14.55 s, 1.002 p.u.
14.5 s, 0.9959 p.u.
14.45 s, 0.9883 p.u.

23
system is relatively too high compared to the trapped electromagnetic energy for a machine
operating near its rated speed and load [16][26] [27]. Figure 3-3(c) depicts the stator to
rotor flux ratio as the machine starts up, of which the steady state value of 1.042 is reached
at time t = 13.98 s, indicating the machine effective turns ration.
Figure 3-3: Rotor flux, stator flux, stator to rotor flux ration and rotor flux angle during motor start-up
Figure 3-3(d) depicts the rotor flux angle during the start-up of the machine. Initially at time
t = 0 s when the motor is powered up, the rotor flux angle varies between 0o and 360o,
measured against the stator flux as reference; this is as a result of the rotor being stationary at
time t = 0 s, while the stator flux rotates at synchronous speed. Thereafter, the rotor start
moving and begins to lag the stator flux by 173o at time t = 10 s while the motor shaft is
accelerating. The rotor flux angle decreases at time t = 13.63 s as the motor reaches full
speed and synchronises to the stator flux with a resultant rotor flux angle of 95.85o between
the two fluxes.
3.2.1.2 Effect of abrupt power disconnection on induction motor
The machine is once more started at time t = 0 by closing the circuit breaker, and reaches full
speed at time t = 13.63 s, and then tripped at time t = 15 s. The simulation is stopped at time t
= 17 s. Before time t = 15 s, the motor is running at steady state. Only phase ‘A’ voltage is
monitored to ease the effort of analysing the results, which is measuring 0.9996 p.u. as
depicted in Figure 3-4(a). The circuit breaker is opened at time t = 15 s, when a sudden drop
0 5 10 15
0
1
2
(a)
Ro
tor
flu
x(p
.u.)
0 5 10 15
0
2
4
(b)
Sta
tor
flu
x(p
.u.)
0 5 10 15
0
20
40
(c)
Sta
tor
to r
oto
r ra
tio
0 5 10 15
-200
0
200
(d)
Ro
tor
an
gle
(deg
)
Time (s)
0.135 s, 0.692 p.u.14.16 s, 1.655 p.u.
0.0109 s, 3.142 p.u.
13.11 s, 1.707 p.u.
10 s, 173 deg
13.63 s, 92.2 deg14.49 s, 95.85 deg
13.98 s, 1.042
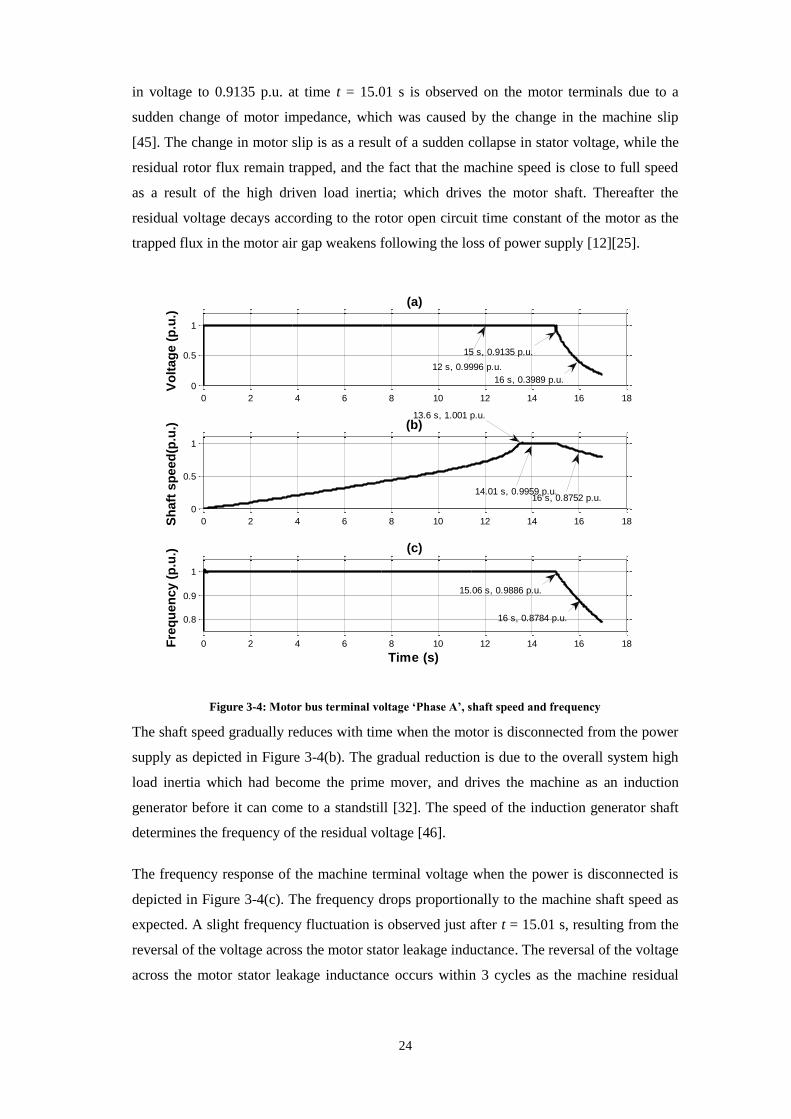
24
in voltage to 0.9135 p.u. at time t = 15.01 s is observed on the motor terminals due to a
sudden change of motor impedance, which was caused by the change in the machine slip
[45]. The change in motor slip is as a result of a sudden collapse in stator voltage, while the
residual rotor flux remain trapped, and the fact that the machine speed is close to full speed
as a result of the high driven load inertia; which drives the motor shaft. Thereafter the
residual voltage decays according to the rotor open circuit time constant of the motor as the
trapped flux in the motor air gap weakens following the loss of power supply [12][25].
Figure 3-4: Motor bus terminal voltage ‘Phase A’, shaft speed and frequency
The shaft speed gradually reduces with time when the motor is disconnected from the power
supply as depicted in Figure 3-4(b). The gradual reduction is due to the overall system high
load inertia which had become the prime mover, and drives the machine as an induction
generator before it can come to a standstill [32]. The speed of the induction generator shaft
determines the frequency of the residual voltage [46].
The frequency response of the machine terminal voltage when the power is disconnected is
depicted in Figure 3-4(c). The frequency drops proportionally to the machine shaft speed as
expected. A slight frequency fluctuation is observed just after t = 15.01 s, resulting from the
reversal of the voltage across the motor stator leakage inductance. The reversal of the voltage
across the motor stator leakage inductance occurs within 3 cycles as the machine residual
0 2 4 6 8 10 12 14 16 18
0
0.5
1
(a)
Vo
ltag
e (
p.u
.)
0 2 4 6 8 10 12 14 16 18
0
0.5
1
(b)
Sh
aft
sp
eed
(p.u
.)
0 2 4 6 8 10 12 14 16 18
0.8
0.9
1
(c)
Fre
qu
en
cy (
p.u
.)
Time (s)
12 s, 0.9996 p.u.
15 s, 0.9135 p.u.
13.6 s, 1.001 p.u.
14.01 s, 0.9959 p.u.16 s, 0.8752 p.u.
16 s, 0.3989 p.u.
15.06 s, 0.9886 p.u.
16 s, 0.8784 p.u.

25
voltage shift behind the rotor flux [16]. The change in slip affects both the frequency of the
terminal voltage and the machine impedance [13].
This phenomenon causes the rotor winding current to reduce to 0.2679 p.u. at time t = 15.02
s and remain flowing momentarily in order to maintain the exciting current and suppress the
abrupt change in the main flux in the motor as depicted in Figure 3-5(a) [46], this follows
from the loss of stator current which was 0.9885 p.u. as depicted in Figure 3-5(b) before the
machine is tripped at time t = 15 s. The stator current drops to zero when the circuit breaker
is tripped, and remains at zero as a result of the stator winding that had become open
circuited.
Figure 3-5(c) depicts the rotor flux angle of the motor from the time when the motor was
started at time t = 0 s. The motor is stable, maintaining a full speed of 0.9959 p.u. before
time t = 15 s when it is tripped, the rotor flux angle was lagging the stator flux by 95.37o.
The rotor flux suddenly losses synchronism when the power supply to the motor terminals is
disconnected at time t = 15 s, and begins to fluctuate between 0o and 360o while the machine
is disconnected. This is caused by the shaft speed which does not immediately drop to zero
when stator voltage is lost. The residual rotor flux instantly becomes the source of main flux
and therefore induces a decaying voltage on the stator terminals of the motor as it decays.
The reversal of the voltage across the motor stator leakage inductance is as a result of the
load inertia that drives the shaft during this time of operation. However the residual flux
eventually decays to zero as depicted in Figure 3-6(a) and Figure 3-6(b), resulting in the
induced residual voltage also decaying to zero as depicted in Figure 3-4(a).

26
Figure 3-5: Rotor current, stator current and rotor angle upon loss of power supply
The induction of residual voltage on the motor terminals is short lived because the rotor
current cannot be sustained for long as the trapped flux in the machine air gap continues to
decay upon the loss of power supply [13]. Therefore both the shaft speed and motor terminal
voltage eventually decays gradually as the flux weakens and the kinetic energy that is stored
in the inertia of the system is depleted.
0 2 4 6 8 10 12 14 16 18
0
2
4
6
8
(a)
Ro
tor
cu
rren
t (p
.u.)
0 2 4 6 8 10 12 14 16 18
0
5
10
(b)
Sta
tor
cu
rren
t (p
.u.)
0 2 4 6 8 10 12 14 16 18
-200
-100
0
100
200
(c)
Ro
tor
an
gle
(d
eg
)
Time (s)
15.02 s, 0.2679 p.u.
4 s, 8.218 p.u. 14.46 s, 0.9885 p.u.
16 s, 0 p.u.
1.45 s, 179.9 deg
1.823 s, -180 deg
14 s, 95.37 deg

27
Figure 3-6: Rotor flux, stator flux and electromagnetic upon loss of power supply
Electromagnetic torque is constant at 1 p.u. before time t = 15 s, however drops to zero when
power supply to the motor terminals is abruptly disconnected at time t = 15 s as depicted in
Figure 3-6(c).
3.2.1.3 Phasor representation of bus residual voltage
Detail analysis of the motor bus voltage is achieved by converting the three phases abc to
dq0 reference frame using Parks transform linking equations to study the magnitude and the
phase angle of the voltage waveform in isolation [47][48]. The busbar voltage magnitude as
depicted in Figure 3-4(a) is again depicted in Figure 3-7(a) for ease of reference. The phase
angle of the residual voltage is depicted in Figure 3-7(b). The phase angle increases until it
completes a full cycle of 360o upon loss of power supply, this phenomenon continues
repeatedly until the voltage magnitude decays to zero. It is also observed in Figure 3-7(b)
that the rate of change of the residual voltage phase angle increases with time as the speed of
the shaft decreases.
0 2 4 6 8 10 12 14 16 18
0
0.5
1
1.5
2
(a)
Ro
tor
flu
x (
p.u
.)
0 2 4 6 8 10 12 14 16 18
-5
0
5
(c)
To
rqu
e (
p.u
.)
Time (s)
0 2 4 6 8 10 12 14 16 18
0
1
2
3
4
(b)
Sta
tor
flu
x (
p.u
.)
0.35 s, 0.6915 p.u.
14 s, 1.655 p.u.
16.01 s, 0.8079 p.u.
6 s, 1.725 p.u. 15.01 s, 1.613 p.u.
0.115 s, 3.907 p.u. 13.4 s, 3.68 p.u.
13.64 s, 0.382 p.u. 15 s, 0.1186 p.u.
16 s, 0.7865 p.u.
13.81 s, 1.235 p.u.

28
Figure 3-7: Residual voltage magnitude and phase angle upon loss of power supply
The characteristic of the residual voltage depicted in Figure 3-7(a) and Figure 3-7(b) is
presented in Figure 3-8 by means of a polar plot to illustrate the motor bus voltage
movement from 0o, which is the point of synchronism with the alternative source before
power is disconnected. The polar plot further illustrates that the residual voltage
synchronises multiple times with the phase angle of board B voltage supplied from an
alternate source, however the magnitude of the voltage is observed to be decreasing at each
subsequent point of synchronism.
0 2 4 6 8 10 12 14 16 18
0
0.2
0.4
0.6
0.8
1
1.2(a)
Vo
ltag
e(p
.u.)
0 2 4 6 8 10 12 14 16 18
-300
-200
-100
0
100
(b)
Ph
ase a
ng
le (
deg
)
Time (s)
5.98 s, 0.9997 p.u.
15 s, 0.9084 p.u.
15,52 s, -359.6 deg
0.2
0.4
0.6
0.8
1
30
210
60
240
90
270
120
300
150
330
180 0

29
Figure 3-8: Residual voltage phasor diagram upon loss of power supply
3.3 Bus transfer design approach
The research focusses on open transition bus transfer system, where an assumption is made
that the main power supply fails as a result of upstream equipment failure; wherein an inter-
trip signal is sent to the incomer breaker on the switchboard in order to isolate the faulty
section of the reticulation. It is further assumed that the board of interest remains fault-free in
order for a load transfer to be executed to transfer the load on the respective board to an
alternate power supply when the incomer breaker trips in order to maintain process
continuity.
Fast, in-phase and residual bus voltage transfer schemes are designed and modelled from
first principles as individual transfer schemes using Simulink and Matlab s-functions, and
later integrated into one multi-function bus transfer system. Functional logic block diagrams
are used to illustrate the implementation of the design model in Matlab Simulink. Main-tie-
main reticulation configuration as depicted in Figure 3-9 in used to evaluate the functionality
and performance of the respective bus transfer schemes.
M
BOARD A BOARD B
MAIN SOURCE BMAIN SOURCE A
MB_VT ASB_VT
B
MAIN
BREAKER
A
MAIN
BREAKER
TIE BREAKER
Motor
4.0 kV, 50 Hz 4.0 kV, 50 Hz
Fast Bus Transfer
System
Protection
Relay
A
Upstream
protection
Protection
Relay
B
Upstream
protection
Figure 3-9: Main-tie-main reticulation configuration
The objective of the respective schemes, or transfer system as a whole is to transfer the
motor from main source ‘A’ on board A to main source ‘B’ on board B through the tie
breaker in case of power supply failure on board A, which could be as a result of tripping of
A main breaker caused by inter tripping signal received from upstream protection.

30
3.4 Boiler furnace pressure dynamics
Plant operating manual, National Fire Protection Association boiler and combustion systems
standard and furnace pressure dynamic simulation studies are used to determine acceptable
conditions under which successful load bus transfers will aid process continuity
[35][36][38]. The power generating unit in consideration consists of two sets of draught
systems referred to as left and right hand draught systems. Each system is capable of
supplying 60% of the required total draught in the furnace; wherein both the draught systems
are operated at 80% each to provide the required draught in order to enable the unit to
produce maximum continuous rated power [35]. The impact of each successful bus transfer
execution is assessed against the set process requirements to determine if it aids process
continuity.
3.5 Unit auxiliary power reticulation
Unit auxiliary reticulation is modelled using DigSilent PowerFactory, wherein load flow and
fault current studies are conducted in accordance with IEC 60909 guidelines [49]. In
particular, fault levels and system x/r ratios from the DigSilent PowerFactory model results
are used to model specific busbars of interest in Matlab Simulink; in order to perform bus
transfer case studies. Figure 3-10 depicts a simplified modelling method that is used in
Simulink [50].
M
SERVICE MV BOARD A SERVICE MV BOARD B
MAIN SOURCE A
Voltage (kV), frequency (Hz)
Fault level (MVA)
x/r
MB_VT ASB_VT
B
MAIN
BREAKER
A
MAIN
BREAKER
TIE BREAKER
Bus Transfer
System
Protection
Relay
A
Upstream
protection
Protection
Relay
B
Upstream
protection
M M MM
Motor -1 Motor -2
M
Motor -3 Motor -4 Motor -5 Motor -6
MAIN SOURCE B
Voltage (kV), frequency (Hz)
Fault level (MVA)
x/r
Figure 3-10: Modelling of auxiliary reticulation in Simulink
Consideration of aggregating the motors as depicted in Figure 3-11 to further simplify the
model and ease computation effort was made, however it was not considered to be the best

31
method as the approach does not allow analysis of individual motor behaviors. Motor
aggregation method approach would be best suited for studying impact on a power system
by a large group of motors [33][34][51].
M
SERVICE MV BOARD A SERVICE MV BOARD A
MAIN SOURCE A
Voltage (kV), frequency (Hz)
Fault level (MVA)
x/r
MB_VT ASB_VT
A
MAIN
BREAKER
A
MAIN
BREAKER
Protection
Relay
A
Upstream
protection
Protection
Relay
A
Upstream
protection
M M
Motor -1 Motor -2
M
Motor -3 Motor -1, -2, -3
MAIN SOURCE A
Voltage (kV), frequency (Hz)
Fault level (MVA)
x/r
Figure 3-11: Motor aggregation approach
3.6 Bus transfer case studies
Bus transfer case studies are performed using the three different bus transfer schemes for
each case on the existing unit auxiliary power reticulation, the results of each transfer are
evaluated together with the set process requirements to establish if the proposed bus transfer
scheme would support process continuity [36]. Distribution of draught system fan motors on
the existing auxiliary reticulation is used to determine the case studies to be performed. In all
cases, the board with the highest fault level is assumed to have lost power, so that load is
transferred to the board with the least fault level in order to evaluate the worst case condition
between the two boards of interest with regards to motor reacceleration power system
capability and impact on voltage. The performance of the respective bus transfer schemes on
the different case studies is evaluated by comparing their respective impact with regards to
busbar voltage, shaft speed, accelerating transient current and torque of the largest motor
amongst the group of motors being transferred where more than one motor is transferred
[13]. More details with regards to analysis of existing reticulation and determination of case
studies are discussed in chapter 5.

32
3.7 Conclusion
The behaviour of induction motor on abrupt interruption of power supply was investigated
using the model depicted in Fig 3-1. The following conclusions are drawn:
The motor generates residual voltage which decays with time. The generation of
residual voltage is caused by flux that remains trapped in the machine when power
supply is disconnected. The machine mode of operation changes from motoring to
generating as an induction generator, while the load inertia acts as a prime mover;
which is caused by the reversal of the voltage across the motor stator leakage
inductance. The flux continues to decay while the machine is open-circuited, and the
shaft speed reduces as the driving load loses momentum.
The magnitude of the residual voltage is dependent on the magnitude of the trapped
rotor flux, which is also dependent on the developed electromagnetic torque prior to the
time of loss of power supply.
Phasor representation of the waveform can be used to accurately track the movement of
the residual bus voltage decaying waveform. Representation of residual voltage by a
phasor enables separation of magnitude and angle to ease computation and analysis.
Computational analysis of phasor magnitude and phase angle for bus transfer
applications should consider sudden change of motor impedance as a result of change in
slip when power supply is disconnected.
The conclusions drawn in this chapter serve as a basis for the design of fast, in-phase and
residual voltage bus transfer schemes presented in chapter 4.

33
CHAPTER 4 - BUS TRANSFER SYSTEM DESIGN
4.1 Introduction
Bus transfer devices consist of fast, in-phase and residual voltage bus transfer schemes
integrated into one device [18]. The respective schemes can be enabled individually to meet
specific plant process requirements, where fast, in-phase and residual bus voltage transfer is
commonly the order of priority [18][52]. The bus transfer system design approach presented
in the following subsections considers the three modes of transfers as subsystems, and
therefore present a design per subsystem starting with the fast bus transfer scheme, followed
by in-phase bus transfer, and then residual bus voltage transfer scheme.
4.2 Fast Bus Transfer System
Fast bus transfer scheme should successfully transfer a load bus to an alternate healthy
supply in a minimum time possible upon loss of supply in order to maintain process
continuity and avoid, or minimise damage to motors and their driven loads [23][53]. The
magnitude of the bus residual voltage and the phase angle between the residual bus voltage
and the alternate supply are used to supervise fast bus transfers [18][52]. Fast bust transfer
scheme is further broken down into four subsystems:
Phasor computation
Delta phase angle computation
Angular velocity and angular acceleration computation algorithm
Phase and magnitude evaluation
4.3 Phasor Computation
Voltage phases abc are transformed using Park’s transformation to dq0 reference frame
[23][53]. The transformation is achieved by the application of the transformation matrix
depicted by equation (4.1), after which both phasor magnitude and angle are calculated using
(4.2) and (4.3) respectively, where the arctangent is a four quadrant inverse tangent function
[54].
The computation of phasor magnitude and angle is applied on both the alternate and residual
bus voltages [23].

34
[
𝑣𝑑
𝑣𝑞
0] =
[ 2
3−
1
3−
1
3
0√3
3−
√3
31
3
1
3
1
3 ]
[
𝑣𝑎
𝑣𝑏
𝑣𝑐
] (4.1)
𝑉𝒎𝒂𝒈𝒏𝒊𝒕𝒖𝒅𝒆 = (𝑉𝑞2 + 𝑉𝑑
2)1
2 (4.2)
𝑉𝑎𝑛𝑔𝑙𝑒 = arctangent(𝑣𝑞
𝑣𝑑⁄ ) (4.3)
4.4 Delta phase angle calculation
The phase angle difference (∅i) between the alternate supply and the bus residual voltage,
gives the residual bus voltage angular position with respect to the alternate supply. The
difference in phase angle is obtained by subtracting the residual bus voltage phase angle
from the alternate supply phase angle to obtain a wrapped phase angle θi since the
respective phase angles are computed using (4.3). The wrapped phase angle is as a result of
the arctangent phase angle range of between -180o and 180o. However Matlab atan2 function
as used in the delta phase angle computation algorithm of Figure 4-1 confines the range to
between 0o and 360o since is a four quadrant inverse tangent function, causing the phase
angle to wrap at 360o [54]. The wrapped angle is then unwrapped to obtain the true phase
angle [55][56][57]. The residual voltage bus phase angle is defined as:
∅𝑖 = 𝜃𝑖 + 2𝜋𝑘𝑖 (4.4)
Where 𝜃𝑖 is the wrapped angle, Øi the true angle, and ki is the integer multiple referred to as
the wrap count [57]. The unwrapped phase angle is sampled and held until its value is equal
to 360o, and then off-set by 360o multiplied by an integer multiple slip cycle counter Ci. The
sample, hold and off-set function is implemented using s-function in Matlab. The delta phase
angle computation process is presented in Figure 4-1.
+
-
Delta phase angle
computation
Phase unwrapping
function
Alternate supply
phase angle
Residual bus voltage
phase angle
Phasor positionu1x1
f(x1...xn)
Sample, hold and
off-set s-function
u1x1
f(x1...xn)
Figure 4-1: Delta phase angle computation

35
4.5 Phasor angle difference
The phase angle difference of a bus residual voltage at time t1 ahead is computed using a
second order Taylor series expansion, where higher order derivatives are assumed to be
small and therefore neglected [24][58]. The dynamic characteristic of the residual bus
voltage requires the evaluation of the phasor position every half cycle, and solving the phase
angle equation for every sampled data point [25]. The Taylor series expansion for a
continuous function is given by (4.5).
∅(𝑡) = ∅(𝑡1) + ∅′(𝑡1)(𝑡 − 𝑡1) + ∅′′(𝑡1)
2(𝑡 − 𝑡1)
2 + . . . (4.5)
Where ∅(𝑡1) is the phase angle at t = t1, ∅′(𝑡1) the first derivative of phase angle at t = t1,
and ∅″(𝑡1) the second derivative of phase angle at t = t1.
Given that a circuit breaker takes time TB to close on command, the transfer system must
evaluate if the closing angle magnitude criteria would still be satisfied by the time the circuit
breaker contacts closes, otherwise the transfer should be blocked [23][25]. Therefore,
looking at time TB ahead when the breaker contacts closes, the phase angle at time t = t1 + TB
is given by (4.6), to be solved for a specific set permissive phase angle range.
∅(𝑡𝑖 + 𝑇𝐵) = ∅(𝑡𝑖) + ∅′(𝑡𝑖)𝑇𝐵 +∅′′(𝑡𝑖)
2(𝑇𝐵)2 (4.6)
4.6 Angular velocity and angular acceleration computation algorithm
Computation of both the first and second coefficients in (4.6) is achieved by the
implementation of an angle derivative computation algorithm function depicted in Figure 4-
2(a). Figure 4-2(b) presents the flow of data during the computation.
The first part of the algorithm as depicted in Figure 4-2(b) receives the bus residual voltage
angle as an input to compute the first derivative ∅′(𝑡𝑖) by sampling and holding the value of
instantaneous phase angle ∅𝑖(𝑡); and subtract the next sampled data point to obtain the
change in phase angle 𝜕∅𝑖, and then divide by the sampling time 𝜕𝑡 to obtain ∅′(𝑡𝑖).
The second part of the algorithm also depicted in Figure 4-2(b) computes Ø"(ti) by sampling
and holding the value of the instantaneous phase rate of change ∅′(𝑡𝑖); and subtract the next
sampled data point to obtain the change in the rate of change of phase angle 𝜕∅′(𝑡𝑖), and
then divide by the sampling time 𝜕𝑡 to obtain ∅′′(𝑡𝑖). The accuracy of the derivatives in the

36
form of angular speed and angular acceleration is dependent on the sampling time in
calculating the change in phase angle position. Real time simulation of phasor angular
position estimation using Taylor series expansion and ‘sample-and-hold’ method using Real
Time Digital Simulator (RTDS) has demonstrated acceptable accuracy [23].
phasor_angle
+
-
sampling_time
+-
Ø’(ti)
Ø’’(ti)∑Z-1Z
-1∑ ÷ ÷
(b)
u2
u1
x2
x1
f(x1...xn)
Ø’(ti) and Ø’’(ti) algorithm
(a)
phasor_angle
sampling_time
Ø’(ti)
Ø’’(ti)
Computation model of
Ø’(ti) and Ø’’(ti)
Figure 4-2: Angular velocity ( ∅′(𝐭𝐢)) and angular acceleration (∅′"(𝐭𝐢)) computation algorithm
4.7 Fast bus transfer scheme
The outputs of the computation algorithm in Figure 4-2 are then used together with the delta
phase angle computation algorithm depicted in Figure 4-1 to compute the residual bus
voltage phase angle when the circuit breaker closes time TB later after a closing command
has been issued as depicted in Figure 4-3.

37
x3
x4
x5
u1
x2
x1
f(x1...xn)
Ø’(ti)Ø’’(ti)
Ø(ti)
TB
Øsetting
Switching pulse
Transfer Enable
Time delay
Scheme enabling unit
D Q
C !Q
&0
0
0(a)
x3
x4
x5
u1
x2
x1
f(x1...xn)
(b)
VASMgn
VMbMgn_Limit
VMbMgn
VASMgn_Upp_Limit
VASMgn_Low_Limit(c)
Phase processing unit
Magnitude processing unit
D-latch
Figure 4-3: Fast bus transfer scheme
The phase processing unit calculates the phase angle at time t = ti + TB when the circuit
breaker closes using equation (6), to ensure that the residual bus voltage angle will still be
within the set limit. Logic ‘high’ output is issued by the phase processing unit if the
evaluation of equation (6) is true (i.e. ∅(𝑡𝑖 + 𝑇𝐵) ≤ ∅𝑠𝑒𝑡𝑡𝑖𝑛𝑔). The phasor magnitudes of
both the residual bus voltage and the alternate supply obtained from equation (2) are
monitored and compared to the set limits in the magnitude processing unit as depicted in
Figure 4-3(b). Logic ‘high’ output is also issued by the magnitude processing unit if the
magnitudes of the input voltages are within the set limits. The outputs of both the phase and
magnitude processing units are then gated through an ‘AND’ logic function to a d-latch
block used to enable or disable the output of the scheme through a time delay to ensure that
the output of the scheme is stable as a result of change of machine state of operation [26].
4.8 Fast bus transfer simulation
Fast bus transfer is used in plant areas where bus transfers can be executed with a phase
difference of 20o - 30o between the alternate supply and the residual bus voltage, and a
residual bus voltage magnitude of equal or more than 0.85 p.u. [18]. Figure 4-4 depicts the
power supply configuration and the associated transfer system as is modelled in Simulink to
simulate the bus transfer system design functionality presented in subsection 4.7 upon a loss
of power supply scenario on board A. The loss of power on board A is assumed to have been
as a result of an inter-tripping signal received from an upstream protection scheme following

38
a transformer fault picked up by a differential protection relay element (87). Tripping of both
upstream and downstream ensures that the transformer is isolated from the system [15]. The
bus transfer scheme’s objective is therefore to transfer the load bus to an alternative healthy
board ‘B’ that is supplied from main source ‘B’ to maintain process continuity by keeping
the induced draught fan motor running. Table 4-1 presents the applicable bus transfer
settings modelled in Figure 4-4.
M
BOARD A BOARD B
MAIN SOURCE BMAIN SOURCE A
MB_VT ASB_VT
B
MAIN
BREAKER
A
MAIN
BREAKER
TIE BREAKER
3.73 MW – ID Fan
4.0 kV, 50 Hz 4.0 kV, 50 Hz
Fast Bus Transfer
System
Protection
Relay
A
Upstream
protection
Protection
Relay
B
Upstream
protection
Figure 4-4: Simulink fast bus transfer model configuration
Table 4-1: Fast bus transfer system settings
VASMgn_Upp_Limit
[p.u.]
VASMgn_Low_Limit
[p.u.]
VMbMgn_Limit
[p.u.]
TB
[s]
Øsetting
[deg]
1.1 0.9 0.85 0.02 ±20
In order to simulate the functionality of fast bus transfer scheme, both main source ‘A’ and
‘B’ are in synchronism before power is lost on board ‘A’; ‘A’ main breaker is initially closed
at the beginning of the simulation, tie breaker is open, and ‘B’ main breaker is closed and
supplying board ‘B’. The simulation is started a time t = 0 s when the motor is powered up
with its shaft coupled to an induced draught fan load, this approach allows comparisons
between starting and reacceleration characteristics to be made with ease. The inertia constant
of the system is 5.23 s. The motor is then continuously loaded in proportion to the square of
the shaft speed as the speed increases, until the torque reaches 44200 N-m, and a full speed
of 0.996 p.u. at time t = 12.4 s. An inter-tripping signal from upstream protection scheme is
received at time t = 14 s when the motor is already running at full speed, where upon the fast
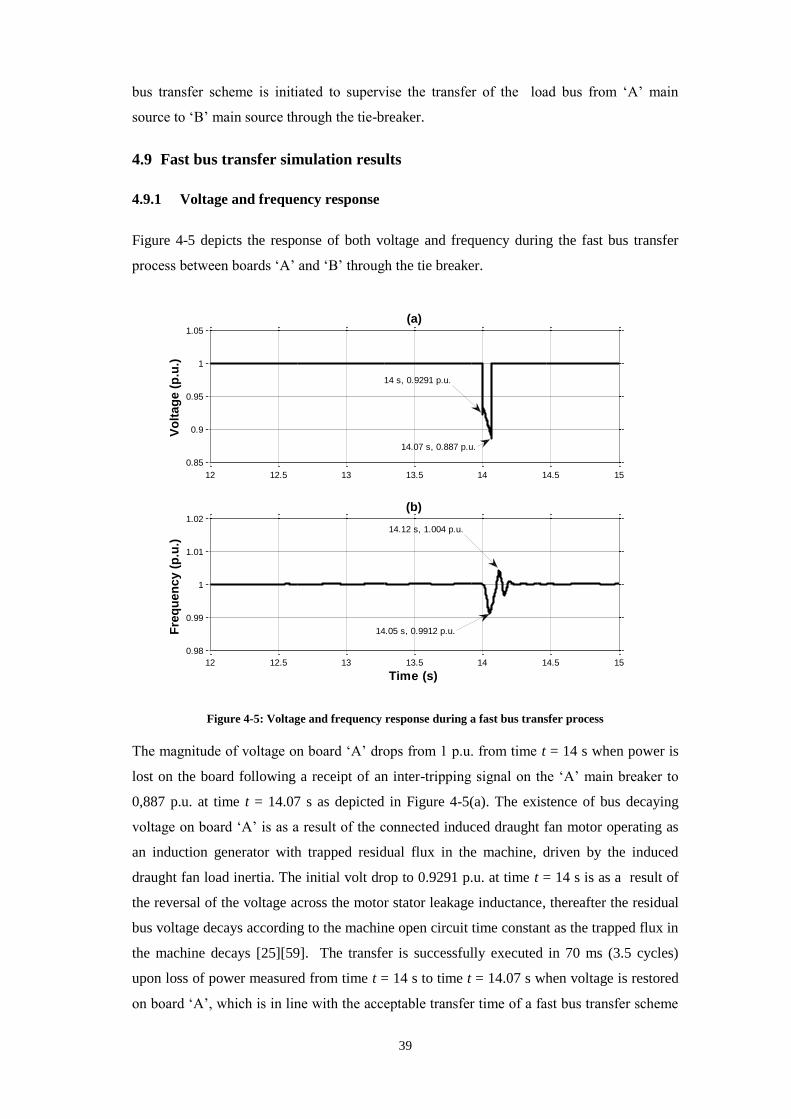
39
bus transfer scheme is initiated to supervise the transfer of the load bus from ‘A’ main
source to ‘B’ main source through the tie-breaker.
4.9 Fast bus transfer simulation results
4.9.1 Voltage and frequency response
Figure 4-5 depicts the response of both voltage and frequency during the fast bus transfer
process between boards ‘A’ and ‘B’ through the tie breaker.
Figure 4-5: Voltage and frequency response during a fast bus transfer process
The magnitude of voltage on board ‘A’ drops from 1 p.u. from time t = 14 s when power is
lost on the board following a receipt of an inter-tripping signal on the ‘A’ main breaker to
0,887 p.u. at time t = 14.07 s as depicted in Figure 4-5(a). The existence of bus decaying
voltage on board ‘A’ is as a result of the connected induced draught fan motor operating as
an induction generator with trapped residual flux in the machine, driven by the induced
draught fan load inertia. The initial volt drop to 0.9291 p.u. at time t = 14 s is as a result of
the reversal of the voltage across the motor stator leakage inductance, thereafter the residual
bus voltage decays according to the machine open circuit time constant as the trapped flux in
the machine decays [25][59]. The transfer is successfully executed in 70 ms (3.5 cycles)
upon loss of power measured from time t = 14 s to time t = 14.07 s when voltage is restored
on board ‘A’, which is in line with the acceptable transfer time of a fast bus transfer scheme
12 12.5 13 13.5 14 14.5 15
0.85
0.9
0.95
1
1.05
(a)
Vo
ltag
e (
p.u
.)
12 12.5 13 13.5 14 14.5 15
0.98
0.99
1
1.01
1.02
(b)
Fre
qu
en
cy (
p.u
.)
Time (s)
14.12 s, 1.004 p.u.
14.05 s, 0.9912 p.u.
14 s, 0.9291 p.u.
14.07 s, 0.887 p.u.

40
[28][60], resulting in minimal impact on the system frequency dropping to 0.9912 p.u. at
time t = 14.05 s as depicted in Figure 4-5(b). The drop in frequency is as a result of loss of
speed as the kinetic energy of system begins to deplete.
4.9.2 Residual bus voltage phase and shaft speed response
The angle between board ‘A’ and main source ‘B’ is observed to increase from 0o when the
power to the machine is lost at time t = 14 s to 9.664o at time t = 14.07 s when power to
board ‘A’ is restored as depicted in Figure 4-6(a).
Figure 4-6: Phase angle and shaft speed response during a fast bus transfer process
The sudden increase in relative phase angle between the bus voltage and main source ‘B’ is
also as a result of reversal of the voltage across the motor stator leakage inductance, which
causes the machine impedance to change as the machine slip changes, resulting in a sudden
3.566o relative phase change at time t = 14 s as depicted in Figure 4-6(a) [60]. Further
increase in relative phase difference is observed as the machine losses speed. Figure 4-6(b)
depicts the shaft speed, which is easily maintained at full speed due to high load inertia
constant of the system, and the high-speed transfer of the motor bus to a healthy alternate
source ‘B’ [61].
13.8 13.9 14 14.1 14.2 14.3 14.4 14.5 14.6 14.7 14.8
-5
0
5
10
(a)
Delt
a a
ng
le (
deg
)
13.8 13.9 14 14.1 14.2 14.3 14.4 14.5 14.6 14.7 14.8
0.99
0.995
1
1.005
(b)
Sp
eed
(p
.u.)
Time (s)
14.07 s, 0.992 p.u.
14.18 s, 1.001 p.u.
14.07 s, 9.664 deg
14.01 s, 3.566 deg

41
4.9.3 Stator current and electromagnetic torque response
Stator current drops to 0 p.u. when the main source ‘A’ power supply is disconnected,
following the tripping of ‘A’ main breaker. This phenomenon causes the developed stator
flux to collapse, which result in electromagnetic torque also dropping to zero as depicted in
Figure 4-7(a) and Figure 4-7(b) at time t = 14 s respectively [62].
Figure 4-7: Current and torque response during a fast bus transfer process
When the tie breaker closes at time t = 14.07 s as depicted in Figure 4-7, current increases to
a peak of 1.549 p.u. at time t = 14.09 s as a result of reduced motor shaft speed of 0.992 p.u.;
resulting in an increase in slip that causes the rotor circuit resistance to decrease [62]. The
increase in current causes the motor to develop torque with a peak of 4.332 p.u. at time t =
14.09 s and accelerate the shaft speed to reach 0.996 p.u. full speed as it was before the loss
of power on board ‘A’. The magnitude of the peak torque is as a result of system natural
frequency with which the load torque oscillates upon loss of power to the machine,
depending on its angular position when the alternate source is connected; higher
electromagnetic torque magnitude is produced when the two torques initially act against each
other [29]. The reaccelerating torque does not exceed the starting torque magnitude during
the transfer [30].
0 2 4 6 8 10 12 14 16 18
0
1
2
3
4
5
6
(a)
Cu
rren
t (p
.u.)
0 2 4 6 8 10 12 14 16 18
-6
-4
-2
0
2
4
6
(b)
To
rqu
e (
p.u
.)
Time (s)
14.09 s, 1.549 p.u.
14.09 s, 4.332 p.u.
2.186 s, 5.814 p.u.

42
4.9.4 Rotor flux angle response
The residual rotor flux momentarily losses synchronism to the stator flux to which it was
lagging 93.5o before power was lost on board ‘A’ at time t = 14 s as depicted in Figure 4-8.
Figure 4-8: Rotor flux response during a fast bus transfer process
The flux angle increased to 100.1o at time t = 14.07 s as depicted in Figure 4-8(b). The loss
of synchronism is as a result of the collapse in stator flux following stator current dropping
to zero upon loss of power supply on the machine [62]. However, the machine develops
torque and accelerates following the slight reduction in speed [62], both stator and rotor
fluxes synchronise and maintain 93.5o between them soon after the load on the bus has been
transferred to the alternate supply main source ‘B’, ensuring that the machine remain stable
to support process continuity.
4.9.5 Residual bus voltage phasor response
Figure 4-9 depicts the phasor plot of the bus voltage during the fast bus transfer process,
which illustrates the behaviour of the bus voltage from the time when power was lost on the
board resulting in change of both magnitude and phase angle to 0.887 p.u. and 350.55o
respectively as it began to lag when power was lost. However, both magnitude and phase
angle of the bus voltage recovered once the transfer process was completed.
0 2 4 6 8 10 12 14 16 18
-200
-100
0
100
200
Ro
tor
flu
x a
ng
le (
deg
)
(a)
13.8 14 14.2 14.4 14.6 14.8 15
90
92
94
96
98
100
102
Ro
tor
flu
x a
ng
le (
deg
)
Time (s)
(b)
14.9 s, 93.5 deg14.22 s, 91.82 deg
14.07 s, 100.1 deg
13.9 s, 93.5 deg

43
Figure 4-9: Bus voltage phasor response during a fast bus transfer process
4.10 In-phase bus transfer scheme
The supervision of bus transfer using in-phase transfer process also takes both the
magnitudes and phases of the motor bus and that of the alternate source voltages into
consideration. Motor bus voltage is allowed to decay to a much lower value of 0.35 – 0.25
p.u., while phase coincidence at 0o is targeted to execute the transfer [63]. Phase coincidence
prediction involves taking circuit breaker closing time into consideration and issuing a close
command ahead of time so that the circuit breaker closes exactly when the phase difference
is at ±0o [23][64].
4.10.1 Phase coincidence prediction algorithm
This section focuses on the phase coincidence prediction with input parameters Ø(𝑡𝑖) and
∅′(𝑡𝑖) already obtained from the fast transfer scheme Ø(𝑡𝑖) and ∅′(𝑡𝑖) computation
algorithm presented in subsection 4.6 [23]. Figure 4-10(a) depicts the phase coincidence
prediction algorithm inputs and output, the details of which are depicted in Figure 4-10(b) as
implemented in Matlab Simulink.
0.5 1
1.5
30
210
60
240
90 270
120
300
150
330
180
0
0.887 p.u., 350.335 deg
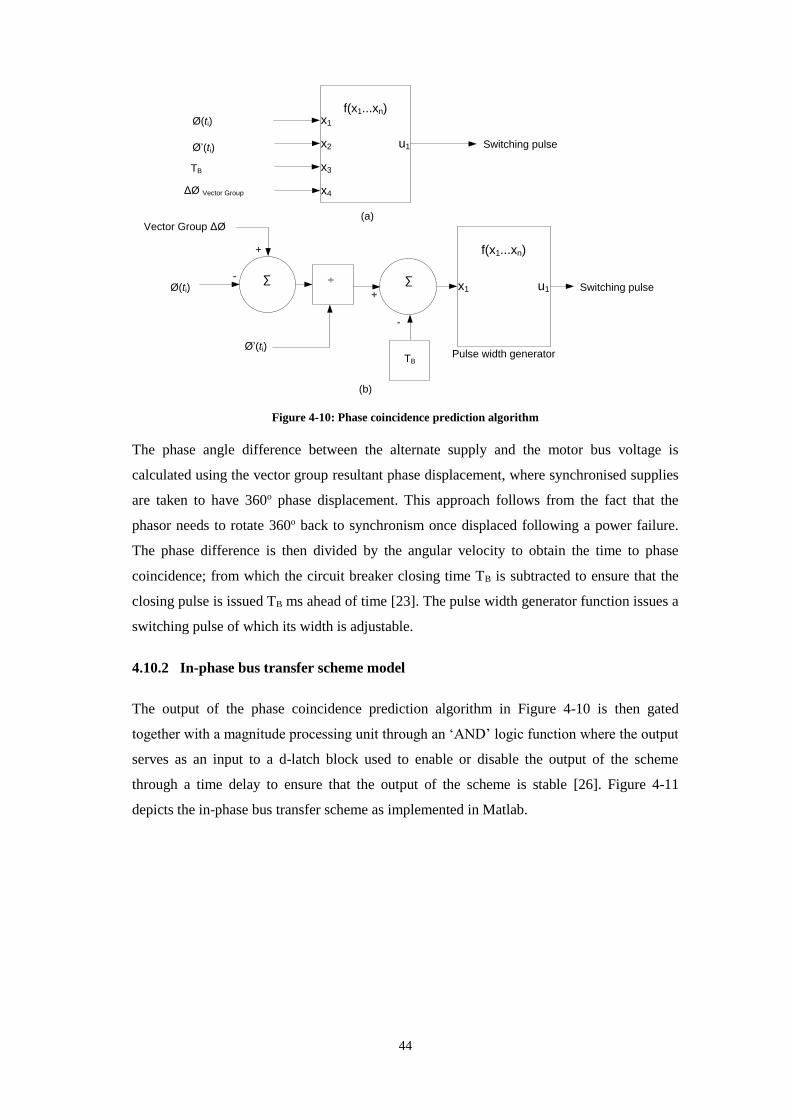
44
+
-
+
-
∑∑ ÷
TB
∑
Pulse width generator
u1x1
f(x1...xn)
Switching pulse
Ø’(ti)
Ø(ti)
x3
x4
u1x2
x1
f(x1...xn)
Ø’(ti)
Ø(ti)
TB
(a)
ΔØ Vector Group
(b)
Switching pulse
Vector Group ΔØ
Figure 4-10: Phase coincidence prediction algorithm
The phase angle difference between the alternate supply and the motor bus voltage is
calculated using the vector group resultant phase displacement, where synchronised supplies
are taken to have 360o phase displacement. This approach follows from the fact that the
phasor needs to rotate 360o back to synchronism once displaced following a power failure.
The phase difference is then divided by the angular velocity to obtain the time to phase
coincidence; from which the circuit breaker closing time TB is subtracted to ensure that the
closing pulse is issued TB ms ahead of time [23]. The pulse width generator function issues a
switching pulse of which its width is adjustable.
4.10.2 In-phase bus transfer scheme model
The output of the phase coincidence prediction algorithm in Figure 4-10 is then gated
together with a magnitude processing unit through an ‘AND’ logic function where the output
serves as an input to a d-latch block used to enable or disable the output of the scheme
through a time delay to ensure that the output of the scheme is stable [26]. Figure 4-11
depicts the in-phase bus transfer scheme as implemented in Matlab.
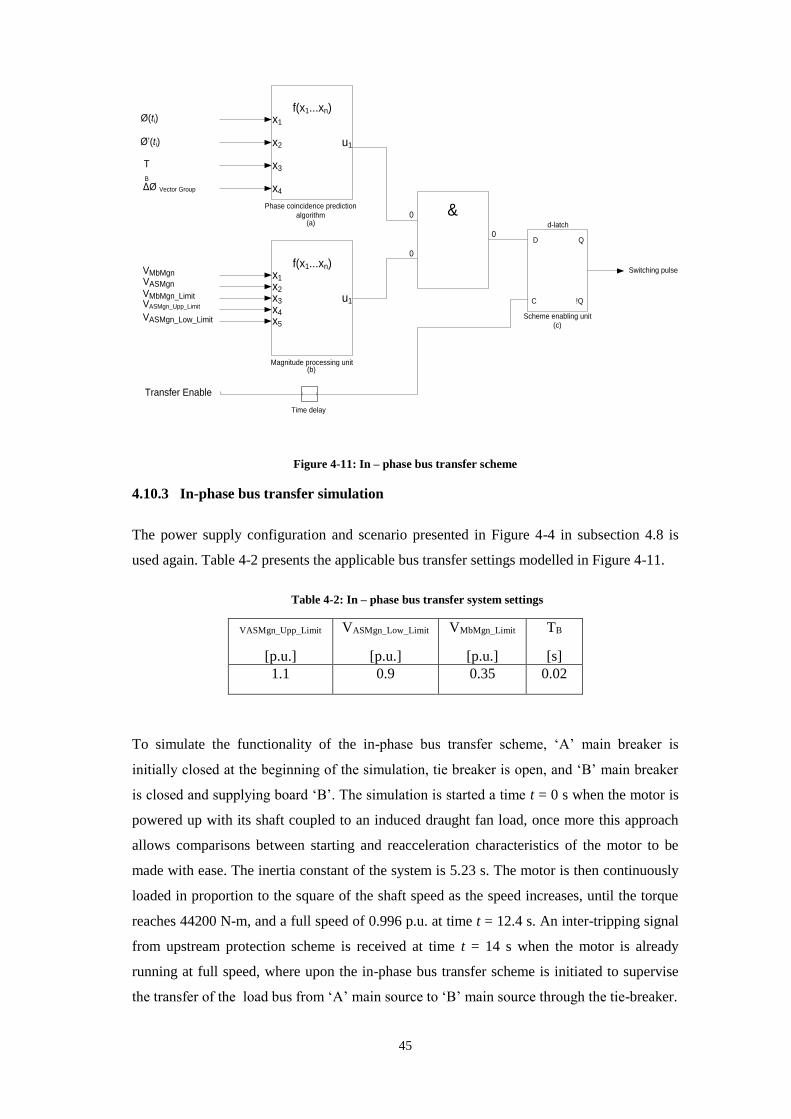
45
x3
x4
u1x2
x1
f(x1...xn)
Ø’(ti)
Ø(ti)
T
B
Switching pulse
Transfer Enable
Time delay
Scheme enabling unit
D Q
C !Q
&0
0
0
(a)
x3
x4
x5
u1
x2
x1
f(x1...xn)
(b)
VASMgn
VMbMgn_Limit
VMbMgn
VASMgn_Upp_Limit
VASMgn_Low_Limit(c)
Phase coincidence prediction
algorithm
Magnitude processing unit
d-latch
ΔØ Vector Group
Figure 4-11: In – phase bus transfer scheme
4.10.3 In-phase bus transfer simulation
The power supply configuration and scenario presented in Figure 4-4 in subsection 4.8 is
used again. Table 4-2 presents the applicable bus transfer settings modelled in Figure 4-11.
Table 4-2: In – phase bus transfer system settings
VASMgn_Upp_Limit
[p.u.]
VASMgn_Low_Limit
[p.u.]
VMbMgn_Limit
[p.u.]
TB
[s]
1.1 0.9 0.35 0.02
To simulate the functionality of the in-phase bus transfer scheme, ‘A’ main breaker is
initially closed at the beginning of the simulation, tie breaker is open, and ‘B’ main breaker
is closed and supplying board ‘B’. The simulation is started a time t = 0 s when the motor is
powered up with its shaft coupled to an induced draught fan load, once more this approach
allows comparisons between starting and reacceleration characteristics of the motor to be
made with ease. The inertia constant of the system is 5.23 s. The motor is then continuously
loaded in proportion to the square of the shaft speed as the speed increases, until the torque
reaches 44200 N-m, and a full speed of 0.996 p.u. at time t = 12.4 s. An inter-tripping signal
from upstream protection scheme is received at time t = 14 s when the motor is already
running at full speed, where upon the in-phase bus transfer scheme is initiated to supervise
the transfer of the load bus from ‘A’ main source to ‘B’ main source through the tie-breaker.

46
4.10.4 In-phase bus transfer simulation results
4.10.4.1 Voltage and frequency response
Figure 4-12 depicts the response of both voltage and frequency during the in-phase bus
transfer process between boards ‘A’ and ‘B’ through the tie breaker.
Figure 4-12: Voltage and frequency response during an in – phase bus transfer process
The magnitude of voltage on board ‘A’ decays from 1 p.u. at time t = 14 s when power is
lost on board ‘A’ following a receipt of an inter-tripping signal on the ‘A’ main breaker on
board ‘A’. The decay in bus voltage is as a result of the connected induced draught fan motor
operating as an induction generator as the machine flux decays to zero [32]. The machine is
driven by the fan load inertia. Voltage decayed to a value of 0.5489 p.u. at time t = 14.68 s,
which resulted in 45.11% voltage drop. The initial bus volt drop to 0.9923 p.u. at time t = 14
s is as a result of the reversal of the voltage across the motor stator leakage inductance as
discussed in subsection 4.9.1, thereafter the residual bus voltage decays according to the
machine open circuit time constant as the trapped flux in the machine decays [25][59]. The
transfer is successfully executed in 680 ms (34 cycles) upon a loss of power, which is in line
with the acceptable transfer time of in-phase bus transfer scheme [28][60], resulting in a
frequency impact as depicted in Figure 4-5(b) at time t = 14 s where frequency dropped to
0.9456 p.u.
12 12.5 13 13.5 14 14.5 15 15.5 16 16.5 17
0.4
0.6
0.8
1
1.2
(a)
Vo
ltag
e (
p.u
.)
12 12.5 13 13.5 14 14.5 15 15.5 16 16.5 17
0.94
0.96
0.98
1
1.02
(b)
Fre
qu
en
cy (
p.u
.)
Time (s)
14 s, 0.9923 p.u.
14.68 s, 0.5489 p.u.
14.67 s, 0.9456 p.u.
14.08 s, 0.994 p.u.
14.05 s, 0.9918 p.u.

47
4.10.4.2 Residual bus voltage phase and shaft speed response
Relative phase angle between board ‘A’ and main source ‘B’ increases from 0o as an
indication of loss of synchronism between bus ‘A’ voltage and the alternate source ‘B’. The
phasor slips one full cycle of 360o during the time when the board ‘A’ is not connected to
any power source as depicted in Figure 4-13(a).
Figure 4-13: Phase angle and shaft speed response during an in – phase bus transfer process
This phenomenon is expected as a result of in-phase bus transfer characteristics switching at
the first phase co-incidence between the residual bus voltage and the alternate source.
[63][64]. The increase in relative phase angle is as a result of the machine operating mode,
which causes the machine impedance to change as the machine slip changes, resulting in a
sudden 3.566o relative phase change [26], as illustrated in Figure 4-13(a). Further increase in
relative phase difference is observed as the machine losses speed. Figure 4-13(b) depicts the
shaft speed as it dropped to 0.9447 p.u. as the kinetic energy on the fan load slowly reduces
[65][66]; however the speed recovered to full speed after slightly overshooting once the
transfer process was complete and the motor was powered up.
4.10.4.3 Stator current and electromagnetic torque response
Stator current drops to 0 p.u. at time t = 14 s when the main source ‘A’ power supply is
disconnected, following the tripping of ‘A’ main breaker. This phenomenon causes the
13 13.5 14 14.5 15 15.5 16
-100
0
100
200
300
400
(a)
Delt
a a
ng
le (
deg
)
13 13.5 14 14.5 15 15.5 16
0.94
0.96
0.98
1
1.02
(b)
Sp
eed
(p
.u.)
Time (s)
14.67 s, 360 deg
14.67 s, 0.9447 p.u.
14.88 s, 1.009 p.u.

48
developed stator flux to collapse, resulting in electromagnetic torque also dropping to zero as
depicted in Figure 4-14(a) and Figure 4-14(b) respectively [62].
Figure 4-14: Current and torque response during an in – phase bus transfer process
When the tie breaker closes at time t = 14.67 s as illustrated in Figure 4-13(a) and (b),
current increases to 3.754 p.u. at time t = 14.7 as depicted in Figure 4-14(a). This is as a
result of the reduced motor shaft speed of 0.9447 p.u. at time t = 14.67 resulting in an
increase in slip that causes the rotor circuit resistance to decrease [62]. The increase in
current causes the motor to develop torque with a peak of 7.251 p.u. at time t = 14.71 and
accelerate the shaft speed to reach a full speed of 0.996 p.u. at as it was before the loss of
power on board ‘A’ [28] as depicted in Figure 4-14(b). The magnitude of the peak torque is
as a result of system natural frequency with which the load torque oscillates upon loss of
power to the machine, depending on its angular position when the alternate source is
connected; higher electromagnetic torque is produced when the two torques initially act
against each other [14][29]. The delay in load transfer of in-phase bus transfer compared to
fast transfer scheme results in higher current and torque when the load bus is connected to
the alternate healthy source because of the much reduced speed of 94.47 %.
0 2 4 6 8 10 12 14 16 18
0
1
2
3
4
5
6
7
(a)
Cu
rren
t (p
.u.)
0 2 4 6 8 10 12 14 16 18
-5
0
5
10
(b)
To
rqu
e (
p.u
.)
Time (s)
14.7 s, 3.754 p.u.
14.71 s, 7.251 p.u.
12.15 s, 5.042 p.u.0.1148 s, 5.439 p.u.

49
4.10.4.4 Rotor flux angle response
The residual rotor flux losses synchronism to the stator flux to which it was lagging 93.5o
before power was lost on board ‘A’, and slip by 360o during the time when the machine is
not connected to any power supply as depicted in Figure 4-15.
Figure 4-15: Rotor flux angle response during an in – phase bus transfer process
The loss of synchronism is as a result of the collapse in stator flux following stator current
dropping to zero upon the loss of power supply on the machine [62].The machine develops
torque and accelerates soon after it has been transferred to the alternate supply [62]. The
stator and rotor fluxes synchronises with 93.5o phase difference soon after the load has been
transferred to the alternate supply main source ‘B’ as they were before power was lost;
ensuring that the machine remain stable to support process continuity.
4.10.4.5 Residual bus voltage phasor response
Figure 4-16 depicts the phasor plot of the bus voltage during the in-phase bus transfer
process, which illustrates the behaviour of the bus voltage from the time when power was
lost on the board resulting in change of both magnitude and phase angle as it began to lag
and slipped one full cycle before it was transferred to an alternate supply source ‘B’
according to the in-phase bus transfer characteristic. However, both magnitude and phase
angle of the bus voltage recovered once the transfer process was completed.
0 2 4 6 8 10 12 14 16 18
-200
-150
-100
-50
0
50
100
150
200
Ro
tor
flu
x a
ng
le (
deg
)
Time (s)
14.32 s, 180 deg
14.32 s, -180 deg
14.76 s, 125.8 deg

50
Figure 4-16: Bus voltage phasor response during an in - phase bus transfer process
4.11 Residual bus voltage transfer scheme
Residual bus voltage transfer is achieved by only monitoring the magnitudes of the alternate
supply to be between 1.1 and 0.9 p.u., and the decaying bus residual voltage to be below 0.35
- 0.25 p.u.; where upon it is assumed that bus transfer will not present any negative effects
on the motor and the driven load [60].
4.11.1 Residual bus voltage transfer scheme
The phasor magnitudes of both the residual bus voltage and the alternate supply obtained
from equation (4.2) are monitored and compared to the set limits in the magnitude
processing unit. Logic ‘high’ output is issued by the magnitude processing unit if the
magnitudes of the input voltages are within the set limits. The output of the magnitude
processing unit gated through a d-latch block to enable or disable the output of the scheme
through a time delay to ensure that the output is stable [26]. Figure 4-17 depicts the residual
bus voltage transfer scheme.
0.5 1
1.5
30
210
60
240
90 270
120
300
150
330
180
0

51
Switching pulse
Transfer Enable
Time delay Scheme enabling unit
x3
x4
x5
u1
x2
x1
f(x1...xn)
VASMgn
VMbMgn_Limit
VMbMgn
VASMgn_Upp_LimitVASMgn_Low_Limit
Magnitude processing unit
D-latch
D Q
C !Q
Figure 4-17: In – phase bus transfer scheme
4.11.2 Residual bus voltage transfer simulation
The power supply configuration presented in Figure 4-4 presented in subsection 4.8 is used
to simulate residual voltage bus transfer scheme. Table 4-3 presents the applicable bus
transfer settings modelled in Figure 4-17.
Table 4-3: Residual bus voltage transfer system settings
VASMgn_Upp_Limit
[p.u.]
VASMgn_Low_Limit
[p.u.]
VMbMgn_Limit
[p.u.]
1.1 0.9 0.25
The functionality of the residual bus voltage transfer scheme is simulated using a power
supply configuration depicted in Figure 4-4, where ‘A’ main breaker is initially closed at the
beginning of the simulation, tie breaker is open, and ‘B’ main breaker is closed and
supplying board B. The simulation is started at time t = 0 s when the motor is powered up
with its shaft coupled to an induced draught fan load, this approach allows comparisons
between starting and reacceleration characteristics to be made with ease. The inertia constant
of the system is 5.23 s. The motor is then continuously loaded in proportion to the square of
the shaft speed as the speed increases, until the torque reaches 44200 N-m, and a full speed
of 0.996 p.u. at time t = 12.4 s. An inter-tripping signal from upstream protection scheme is
received at time t = 14 s when the motor is already running at full speed, where upon the
residual bus voltage transfer scheme is initiated to supervise the residual voltage bus transfer
of the load bus from ‘A’ main source to ‘B’ main source through the tie-breaker.

52
4.11.3 Residual bus voltage transfer simulation results
4.11.3.1 Voltage and frequency response
Figure 4-18 depicts the response of both voltage and frequency during the execution of
residual voltage bus transfer between boards ‘A’ and ‘B’ through the tie breaker.
Figure 4-18: Voltage and frequency response during an in – phase bus transfer process
The magnitude of voltage on board ‘A’ decays from 1 p.u. from time t = 14 s when power is
disconnected on the board following a receipt of an inter-tripping signal on the ‘A’ main
breaker to 0.2449 p.u. at time t = 15.72 s; as depicted in Figure 4-18(a) according to the set
point in Table 4-3. The existence of decaying voltage on board ‘A’ is as a result of the
connected induced draught fan motor operating as an induction generator, driven by the fan
inertia coupled with the trapped flux in the machine [31]. The overall percentage voltage
drop is 75.51%. The initial volt drop to 0.9293 p.u. is again as a result of the reversal of the
voltage across the motor stator leakage inductance as in the case fast and in-phase bus
transfer schemes, thereafter the residual bus voltage decays according to the machine open
circuit time constant as the trapped flux in the machine decays [25][59]. The transfer is
successfully executed in 1760 ms (88 cycles) upon loss of power, which is in line with the
acceptable transfer time of residual voltage bus transfer scheme [28][60], resulting in
frequency dropping to 0.8654 p.u. at time t = 15.76 s as depicted in Figure 4-18(b) following
a much higher reduction in speed compared to both fast and in-phase transfer schemes.
12 12.5 13 13.5 14 14.5 15 15.5 16 16.5 17
0.2
0.4
0.6
0.8
1
1.2
(a)
Vo
ltag
e (
p.u
.)
12 12.5 13 13.5 14 14.5 15 15.5 16 16.5 17
0.85
0.9
0.95
1
1.05
(b)
Fre
qu
en
cy (
p.u
.)
Time (s)
14 s, 0.9293 p.u.
15.72 s, 0.2449 p.u.
15.76 s, 0.8654 p.u.

53
4.11.3.2 Residual bus voltage phase and shaft speed response
The phase angle between board ‘A’ and main source ‘B’ slips 6 times between 0o and 360o
when the power to the machine is lost at time t = 14 s according to the residual bus voltage
transfer method as depicted in Figure 4-19(a) [60].
Figure 4-19: Phase angle and shaft speed response during residual bus voltage transfer process
Figure 4-19(b) depicts the shaft speed, which dropped to 0.8732 p.u. at time t = 15.71 s as
the kinetic energy on the fan load reduced even more compared to both fast and in-phase bus
transfer schemes; however the speed recovered to full speed after slightly overshooting once
the transfer process was completed. It is evident that the residual bus voltage transfer process
is not dependent on the relative phase difference between the alternate supply and the
residual bus voltage as depicted on Figure 4-19(a), where 6 slip cycles were recorded; before
it reached the of 0.25 p.u. as depicted in Figure 4-18(a).
4.11.3.3 Stator current and electromagnetic torque response
Stator current drops to 0 p.u. at time t = 14 s when the main source ‘A’ power supply is
disconnected, following the tripping of ‘A’ main breaker. This phenomenon causes the
developed stator flux to collapse, which results in electromagnetic torque also dropping to
zero as depicted in Figure 4-20(a) and Figure 4-20(b) respectively [62].
0 2 4 6 8 10 12 14 16 18
-100
0
100
200
300
400
(a)
Delt
a a
ng
le (
deg
)
0 2 4 6 8 10 12 14 16 18
0
0.2
0.4
0.6
0.8
1
1.2
(b)
Sp
eed
(p
.u.)
Time (s)
14.67 s, 360 deg
15.71 s, 0.8732 p.u.
16.13 s, 1.004 p.u.

54
Figure 4-20: Current and torque response during an in – phase bus transfer process
When the tie breaker closes at time t = 15.72 s as depicted in Figure 4-18(a), current
increases to a peak of 6.251 p.u. at time t = 15.83 s as a result of the reduced motor shaft
speed of 0.8732 p.u. The speed reduction result in an increase in slip which causes the rotor
circuit resistance to decrease [62]. The increase in current causes the motor to develop torque
with a peak of 8.553 p.u. at time t = 15.79 s and accelerate the shaft speed to reach a full
speed of 0.996 p.u. as it was before the loss of power on board ‘A’ [28]. The magnitude of
the peak torque is as a result of system natural frequency with which the load torque
oscillates upon loss of power to the machine, depending on the angular position of the
mechanical system when the alternate source is connected; higher electromagnetic torque
magnitude is produced when the two torques initially act against each other [29]. The peak
torque is also dependent of the phase angle of the bus residual voltage [11], which should
also be stated by the motor manufacturer [67].
4.11.3.4 Rotor flux angle response
The residual rotor flux losses synchronism to the stator flux to which it was lagging 93.5o
before power was lost on board ‘A’, and slips 6 cycles during the time when the machine is
not connected to any power supply as depicted on Figure 4-21.
0 2 4 6 8 10 12 14 16 18
0
2
4
6
8
(a)
Cu
rren
t (p
.u.)
0 2 4 6 8 10 12 14 16 18
-10
-5
0
5
10
(b)
To
rqu
e (
p.u
.)
Time (s)
15.79 s, 8.553 p.u.
15.73 s, -5.868 p.u.
15.82 s, 6.215 p.u.

55
Figure 4-21: Rotor flux angle response during a residual bus voltage transfer process
The loss of synchronism is as a result of the collapse in stator flux following stator current
dropping to zero upon loss of power supply on the machine [62]. However, when the
machine is reconnected after the residual voltage has dropped by 75.51%; it develops torque
and accelerates the shaft speed following the reduction in speed 87.32% [62]. Both stator
and rotor fluxes synchronise with 94o phase difference soon after the load has been
transferred to the alternate supply main source ‘B’, ensuring that the machine remain stable
to support process continuity.
4.11.3.5 Residual bus voltage phasor response
Figure 4-22 depicts the phasor plot of the bus voltage during the residual voltage bus transfer
process, which illustrates the behaviour of the bus voltage from the time when power was
lost on the board; resulting in change of both magnitude and phase angle as the phasor began
to lag and slipped 6 full cycles before it was transferred to an alternate supply source ‘B’.
However, both magnitude and phase angle of the bus voltage recovered once the transfer
process was completed.
0 2 4 6 8 10 12 14 16 18
-200
-150
-100
-50
0
50
100
150
200
Ro
tor
flu
x a
ng
le (
deg
)
Time (s)
14.32 s, 180 deg
14.32 s, -180 deg

56
Figure 4-22: Bus voltage phasor response during a residual bus voltage transfer process
4.12 Simulink model of bus transfer device
The three bus transfer schemes namely fast, in – phase and residual bus voltage transfer
schemes are gated through an ‘OR’ logic function, and the output of the ‘OR’ logic function
is gated through an ‘AND’ logic function together with the output of an ‘XOR’ logic
function, the inputs of which comprises enabling inputs for simultaneous and sequential
modes of operation. The overall close command of the system is issued if one or more of the
individual schemes is logic ‘1’, one of the scheme modes of operation is a logic ‘1’, as an
additional security feature; the resultant vector difference between the alternate and residual
bus voltage must be less than 1.33 p.u. as depicted in Figure 4-23 [29][30][52].
0.5 1
1.5
30
210
60
240
90 270
120
300
150
330
180
0

57
Fast bus transfer
In – phase bus transfer
Residual bus transfer
Simultaneous mode
Sequential – brk open contact 52a
Sequential – brk not closed contact 52b
u1
x2
x1
f(x1...xn)
Per unit volts per unit frequency
Per unit volts
Per unit freq
Output pulse
Figure 4-23: Simultaneous and sequential modes of operation
Figure 4-24 depicts the overall bus transfer device comprising fast, in-phase and residual
transfer scheme capabilities. The respective transfer schemes can be enabled simultaneously
or individually to satisfy specific process requirement [18][52].
VMbMgn_Limit
Transfer Scheme Method
VASMgn_Upp_Limit_Fst
VASMgn_Low_Limit_Fst
Bus Transfer
Device
ModelVASMgn_Upp_Limit_In-P
VASMgn_Low_Limit_In-P
VASMgn_Upp_Limit_Res
VASMgn_Low_Limit_Res
ΔØ Vector Group
Øsetting
Transfer Enable
VAS
VMb
Transfer Sequence
CB_Mb_DI_closed
CB_Mb_DI_opened
CB_AS_DI_closed
CB_AS_DI_opened
CB_Tie_DI_closed
CB_Tie_DI_opened
CB_Mb_DO_open
CB_Mb_DO_closeCB_AS_DO_open
CB_AS_DO_close
CB_Tie_DO_open
CB_Tie_DO_close
Figure 4-24: Bus transfer device model as modelled in matlab simulink

58
4.13 Discussion
The results of recorded magnitudes of busbar voltage, shaft speed, stator current and
electromagnetic torque response of induced draught fan motor being transferred from board
A upon loss of power; to an alternative board B using fast, in-phase and residual bus voltage
transfer schemes are depicted in Figure 4-25.
Figure 4-25: Summary of bus transfer results of induced draft fan from board A to board B
Fast and residual bus voltage transfers recorded the highest and lowest minimum magnitudes
for busbar voltage and shaft speed respectively. The lowest peak accelerating current was
recorded during the fast bus transfer execution, while residual bus voltage transfer scheme
recorded the highest peak accelerating current of 6.215 p.u. Peak accelerating torque of
4.332 p.u. was recorded as the lowest of the three transfer schemes during the fast bus
transfer, while in-phase bus transfer process is the highest at 8.553 p.u. Therefore, fast bus
transfer scheme exhibited best performance during the transfer of induced draught fan motor
from board A to board B.
0.000
1.000
2.000
3.000
4.000
5.000
6.000
7.000
8.000
9.000
Minimum VoltageRecorded
Minimum SpeedRecorded
Peak AcceleratingCurrent
Peak AcceleratingTorque
Mag
nit
ud
e [
p.u
.]
Fast Transfer Scheme In-phase Transfer Scheme Residual Transfer Scheme

59
4.14 Conclusion
The design and simulation of fast, in-phase and residual bus voltage transfer schemes have
been presented. Simulation results give insight to the characteristics of the different bus
transfer schemes, where fast transfer scheme has less electromagnetic torque impact while
residual transfer has the most severe peak torque. The torque to which the machine will be
subjected should be stated by the manufacturer of the motor before a specific transfer
technique is chosen.
Fast bus transfer scheme offers the most efficient and smooth load transfer resulting in
minimal impact on the system with regards to both current and torque magnitudes. Both
reaccelerating current and torque remain within starting current and torque magnitudes
respectively, which indicate that the impact on the motor is within its design capability. The
speed and smooth characteristic of the fast bus transfer scheme makes it suitable for use in
load bus transfers where the objective is to maintain process continuity in case of a sudden
loss of power from the main or preferred supply.
In – phase bus transfer scheme offers the second best efficient load transfer characteristic
resulting in reaccelerating current of less than the starting current, while the reaccelerating
torque is likely to exceed the starting torque depending on the torsional oscillations of the
mechanical system. This scheme may be suitable for maintaining process continuity for the
most critical part of the process since it may require load shedding consideration of non-
critical loads in order to allow for reacceleration of most critical motors. The resulting torque
magnitudes require proper knowledge of the design capability of both the motor and the
driven load.
Residual bus voltage transfer scheme result in much higher reaccelerating current and torque
that exceed the starting current and torque following the much reduced shaft speed of the
motor. Therefore more loads may need to be shed to allow the most critical loads to be
reaccelerated. Alternatively the scheme may be suitable for power restoration to allow the
plant operator to manually bring the process back to production. As in the case of in-phase
bus transfer scheme, the resulting torque magnitudes require proper knowledge of the design
capability of both the motor and the driven load.

60
CHAPTER 5 - BUS TRANSFER CASE STUDIES OF DRAUGHT
MOTORS
5.1 Introduction
Coal fired thermal power plants auxiliary systems comprise unit and station services
systems. A unit in a power plant is made up of one boiler, one turbine, one generator step up
transformer, and all associated auxiliaries operating together as one unit. The high voltage
terminal bushings of each generator step-up transformer are connected to the transmission
system high voltage substation through the high voltage circuit breaker [4]. Unitised
auxiliary systems serve the respective power generating units, and would result in a direct
loss of power generating capability of the unit when unit auxiliary power supply is
interrupted. Station auxiliary services however, serve multiple units, and would not result in
immediate or direct loss of any particular unit capability to generate power when station
auxiliary power supply is interrupted [1]. This chapter focuses on bus transfer case studies
and their impact on process continuity when power is interrupted within a unit auxiliary
power reticulation.
5.2 Thermal Power Plant
Unit auxiliary power requirement in a thermal power plant is between 4.5% - 7% of unit
maximum output power [1][2], however power consumption by auxiliary systems can be as
high as 10% depending on the environmental control system that is used in relation to the
type and quality of fuel used to fire the boiler [3]. Figure 5-1 depicts a high level auxiliary
electrical system of a coal fired thermal power plant [5][6][68].
UNIT AUXILIARY
BOARD
A
UNIT AUXILIARY
BOARD
B
B
MAIN
BREAKER
A
MAIN
BREAKER
TIE BREAKER
GENERATOR
UNIT
AUXILIARY
TANSFORMER
A
GENERATOR
STEP UP
TRANSFORMER
TRANSMISSION
NETWORK
GENERATOR
CIRCUIT BREAKER
STATION SERVICES
TRANSFORMER
DISTRIBUTION
NETWORK
STATION SERVICES
BOARD AUNIT
AUXILIARY
TANSFORMER
B
HV CIRCUIT BREAKER
Figure 5-1: High-level thermal power plant auxiliary electrical system

61
Generator step-up transformer is used to start-up a unit by suppling power to the unit
auxiliary systems through the high voltage circuit breaker while the generator remain
isolated by the generator circuit breaker. Station services transformer is used to start-up unit
auxiliary loads where a power generating unit does not have a generator circuit breaker.
Closed transition bus transfer system is used to transfer unit auxiliary loads from the station
services transformer to the unit auxiliary transformer once the unit has successfully started
up where station services transformer is used to start up a unit [1][5][8], however special
consideration is made to ensure that the transfer is executed in a minimum time possible due
of high fault levels as a result of paralleling supplies [69][70]. Therefore the existence of
generator circuit breaker eliminates the requirement of starting up a unit using the station
services transformer [5].
Electrically driven auxiliaries are preferred over steam driven auxiliaries for both essential
and non-essential systems because of convenience, cleanliness in operation and adaptability
to automatic and remote control [2][4][71]. Majority of electrically driven auxiliary systems
in the order of more than 90% utilises direct on line squirrel cage induction motors,
comprising fans, pumps and mills [8][9][10]. Direct-on-line induction motors enable
implementation of bus transfer systems with ease [2][4].
Unit auxiliary power reticulation is designed with the objective of achieving high availability
and reliability of auxiliary power supply to satisfy mechanical plant process requirement.
The design optimises simplicity and cost against availability and reliability [1][2][5]. The
design of the reticulation system also includes the necessary interlocking systems to ensure
safety of both plant and personnel in case of any failure occurring on the reticulation [4].
Two unit auxiliary transformers supply power to two respective unit auxiliary boards, which
intern supply power to unit auxiliary loads. Use of two unit auxiliary transformers reduces
fault levels and also achieves high plant availability at the same time [8][72][73]. Failure of
one unit auxiliary transformer causes the unit to lose 50% generating capability as a result of
losing one set of auxiliary systems, the draught group system in particular [1][5]. This is
because momentary loss of draught in the boiler causes upset in the boiler steam cycle, or
even worse; flame extinction can result if the loss of power is prolonged [70].
5.3 South African coal fired power generating plants
South African power generating plants comprise two sets of boiler auxiliary systems to
support availability of the boiler plant [5][74]. One set of boiler auxiliary systems enables the
unit to produce half of the unit generating capacity [7]. Figure 5-2 depicts a simplified power
plant unit auxiliary power reticulation [7][75].

62
UNIT AUXILIARY BOARD A UNIT AUXILIARY BOARD B
B
MAIN
BREAKER
A
MAIN
BREAKER
TIE BREAKER
GENERATOR
UNIT
AUXILIARY
TANSFORMER
A
GENERATOR
STEP UP
TRANSFORMER
TRANSMISSION
NETWORK
GENERATOR
CIRCUIT BREAKER
STATION SERVICES
TRANSFORMER/
STATION SERVICES
BOARD
UNIT
AUXILIARY
TANSFORMER
B
M M
M M M M
M M M M
M M M M
TIE BREAKER
TIE BREAKER
TIE BREAKER
UNIT LV BOARD A UNIT LV BOARD B
SERVICE MV BOARD A SERVICE MV BOARD B
SERVICE MV BOARD DSERVICE MV BOARD C
HV CIRCUIT BREAKER
SERVICE
TRANSFORMER
B
SERVICE
TRANSFORMER
D
SERVICE
TRANSFORMER
A
SERVICE
TRANSFORMER
C
Figure 5-2: Unit auxiliary power reticulation system
Unit auxiliary boards A and B can be connected through the tie breaker when one of the unit
auxiliary transformers A or B is out of service and isolated. Under normal operating
conditions, unit auxiliary transformer A supplies unit auxiliary board A and half of station
service loads through station service board A as depicted in Figure 5-1 and Figure 5-2, while
unit auxiliary transformer B supplies unit auxiliary board B. Station services transformer is
used to supply power to unit auxiliary loads when the unit auxiliary transformers are not
available [7][75].
Two electric boiler feed pumps are supplied from the respective unit auxiliary boards A and
B, the boards also supply power to medium voltage boiler drives through four service
transformers; and low voltage drives including other unitised loads such as flue gas cleaning
systems and lighting through various other transformers. Configuration of service medium
voltage boards A, B, C and D is depicted in Figure 5-2. Services medium voltage boards A
and B can be connected through a tie breaker when one of the service transformers becomes
unavailable; similarly service medium voltage boards C and D can be connected when one of
the service transformers C or D becomes unavailable.
Interruption of power supply to one of the service medium voltage boards A, B, C or D result
in 50% reduction of unit capability to generate power. The reduction in power generating
capability of a unit is as a result of loss of boiler draught group system and or primary air

63
system [7][76]. Unit capability is restored to 80% – 90% of maximum unit output power
upon power reinstatement using the tie breaker between the respective service medium
voltage boards A and B, or C and D [7][76].
This chapter investigates the feasibility of utilising a bus transfer system to transfer boiler
draught and primary air system fan motors between service medium voltage boards A and B,
or C and D to maintain maximum unit power generating capability when power supply is
lost on either service medium voltage boards A, B, C or D.
5.4 Impact of loss of draught on boiler furnace pressure protection
Boiler furnace explosions are rare, but possible due to the nature of furnace operation;
whereby it is supplied with accumulative explosions. Furnace pressure protection is one of
many parameters that require continuous control, protection and monitoring in order to
safeguard against furnace explosion or implosion [77]. National fire protection association
(NFPA) stipulates specific protection requirements for boiler plants and combustion systems,
including the requirement of a dedicated plant control systems to safeguard against incorrect
operation of plant and process abnormalities. Positive furnace pressure limit is reached when
forced draught fan reaches its test block capability, while negative pressure limit is reached
when an induced draught fan reaches its test block capability. Furnace pressure
measurements are also measurable by means of pressure instrument transmitters located in
the boiler furnace [37][77].
Two draught subsystems are configured to supply boiler furnace draught on a common duct,
the two subsystems are referred to as left and right hand draught groups systems [35].
However failure of an induced draught fan on one of the draught subsystems increases the
possibility of the corresponding forced draught fan reaching its test block capability, and
vice versa; even though the second draught group system will tend to compensate for the
partial loss of draught as a result of the first draught subsystem failure [37][78][79].
Therefore boiler protection system is configured to accordingly trip the corresponding
induced or forced draught fan each time one of the fans trip, this is to ensure that furnace
pressure does not increase or reduce beyond the respective fan test block capabilities in order
to safeguard against furnace implosion or explosion. Further than tripping the draught group
fans, master fuel trip is activated by boiler protection system to stop fuel entering into the
boiler furnace when both left and right hand draught subsystems are lost [35][38][79]. The
level of complexity of interfacing subsystems responsible for boiler protection, from sensing
elements to actual devices responsible to trip the plant in case of unforeseen abnormalities
makes it of utmost importance that boiler furnace protection system meets the necessary

64
level of reliability and availability according to plant specific risk assessment
[39][40][80][81].
Loss of incomer circuit breaker on service medium voltage board A on Fig 2 for instance,
result in an under-voltage condition on the board, which will cause the respective drives to
trip in 3 s [80]. This is as a result of busbar voltage having dropped to, or below 70% for 3 s
[80]. The phenomenon will impact the furnace draught pressure because the forced draught
fan motor would have lost power.
The corresponding induced draught fan motor on service medium voltage board C will
eventually be tripped by boiler protection system [35][38]. However during the 3 s time
delay when the under-voltage protection is timing out, boiler furnace pressure may reduce up
to the induced fan test block capability, which could also cause the boiler protection system
to trip the corresponding induced draught fan motor before 3 s has timed-out. Figure 5-3
depicts a simplified draught group motor protection trip logic that will be executed in case of
an under voltage condition, following from the loss of incomer breaker on one of the service
medium voltage boards A, B, C and D [38][79][80].
u2
x3
x4
x5
u1
x2
x1
f(x1...xn)
Boiler Protection System -
furnace pressure
protection
Induced draught fan
Test block capability limit
Trip output
Under-voltage protection
function (ANSI 27)
u1x1
f(x1...xn)
Forced draught fan
Test block capability limit
Trip output
Busbar voltage
Boiler plant
measurements
Drive circuit breaker
trip coil
Motor feeder protection
relay
Figure 5-3: Simplified draught group motor breaker trip logic on power supply failure
5.5 Response of furnace draught pressure when power supply is interrupted
Two scenarios are considered in order to analyse the impact of partial loss of draught group
system, first is failure of induced draught fan power supply; second is failure of forced
draught fan power supply. The objective of the analysis is to establish safe conditions under
which successful motor bus transfer will aid process continuity by maintaining stable furnace
pressure during the transfer process.

65
5.5.1 Interruption of induced draught fan power supply
Interruption of power supply to one of the induced draught fan motors result in boiler
protection system automatically tripping the corresponding forced draught fan to prevent
furnace explosion [36][38]. Tripping of forced draught fan motor is initiated by an auxiliary
contact of the corresponding induced draught fan motor circuit breaker. However, when
power interruption is as a result of upstream reticulation equipment failure, a 3 s time delay
is introduced by as a result of motor under voltage protection scheme setting [80]. Figure 5-4
depicts the induced draught fan pressure response of both left and right hand fans when both
corresponding left hand induced and forced draught fans lose power simultaneously,
followed by a loss of power supply to the second corresponding right hand induced and
forced draught fans in 5 s; whereupon master fuel trip is initiated. Boiler furnace draught
pressure remains stable when corresponding fans are tripped simultaneously as depicted in
Figure 5-5. Cross-tripping of corresponding forced draught fan when the induced draught fan
trips is a mandatory requirement to prevent boiler furnace explosion [36].
Figure 5-4: Induced draught fan pressure response when both induced and forced draught fans lose power
simultaneously [36]
Figure 5-5: Boiler furnace draught pressure on loss of one forced draught system motor [36]

66
It is observed in Figure 5-4 and Figure 5-5 that simultaneous loss of induced and
corresponding forced draught fans maintains furnace draught pressure stability. Therefore
successful transfer of induced draught fan to an alternate power supply on loss of power may
not always aid process continuity because of the requirement for the corresponding forced
draught fan to be momentarily tripped in order to maintain draught pressure stability, this is
so when the two fan motors are supplied from different power supplies.
5.5.2 Interruption of forced draught fan power supply
Interruption of power supply to one of the two forced draught fan motors result in immediate
closing of the respective fan output vanes, and the unit automatically begins to de-load in 2 s
[36]. The remaining forced draught fan and two induced draught fans continue to run and
regulate the draught pressure in the boiler furnace. It can be observed in Figure 5-6 that the
fan output pressure remains above 80% at time t = 65 s after the fan motor lost power supply
at time t = 60 s as a result of high fan inertia. This phenomenon causes the furnace draught
pressure to remain stable as depicted in Figure 5-7. Master fuel trip is initiated together with
the tripping of the induced draught fans when the second forced draught fan motor trips.
Figure 5-6: Forced draught fan pressure response when both induced and forced draught fans lose power
simultaneously [36]
Figure 5-7: Boiler furnace draught pressure on loss of induced and forced draught system motors [36]

67
Therefore successful transfer of forced draught fan motor within 2 s to an alternate power
supply on loss of main supply will aid process continuity.
5.6 Bus transfer case studies
This section focuses on the simulation of draught group system load transfer to a healthy
alternate supply upon failure of one of the service transformers A, B, C or D using three
different bus transfer methods, namely fast, in-phase and residual bus voltage transfer
schemes. The draught and primary air systems comprise two sets of three drives each,
referred to as left and right hand systems as mentioned earlier. Service medium voltage
board A supply power to the left hand forced draught and primary air fans together with
other drives as depicted in Figure 5-8, while service medium voltage board C supply power
to the left hand induced draught fan together with other drives as depicted in Figure 5-9;
similarly service medium voltage boards B and D supply power to the right hand fans as
depicted in Figure 5-8 and Figure 5-9 respectively.
M
SERVICE MV BOARD A SERVICE MV BOARD B
MAIN SOURCE A
4.0 kV, 50 Hz
Fault level – 217.4 MVA
x/r – 19.86
MB_VT ASB_VT
B
MAIN
BREAKER
A
MAIN
BREAKER
TIE BREAKER
Bus Transfer
System
Protection
Relay
A
Upstream
protection
Protection
Relay
B
Upstream
protection
MM M M MM M
MILL A EXTRACTION
PUMP
A
PRIMARY AIR
FAN L.H.
FORCED
DRAUGHT
FAN L.H.
M
BOILER
CIRCULATING
PUMP
FORCED
DRAUGHT
FAN R.H.
PRIMARY AIR
FAN R.H.
EXTRACTION
PUMP
MILL D
MAIN SOURCE B
4.0 kV, 50 Hz
Fault level – 180.0 MVA
x/r – 17.17
Figure 5-8: Service medium voltage boards A and B load configuration

68
M
SERVICE MV BOARD C SERVICE MV BOARD D
MAIN SOURCE A
4.0 kV, 50 Hz
Fault level – 194.2 MVA
x/r – 24.27
MB_VT ASB_VT
B
MAIN
BREAKER
A
MAIN
BREAKER
TIE BREAKER
Bus Transfer
System
Protection
Relay
A
Upstream
protection
Protection
Relay
B
Upstream
protection
M M M MM M
MILL B MILL C CIRCULATING
WATER
PUMP
A
M
INDUCED
DRAUGHT
FAN L.H.
INDUCED
DRAUGHT
FAN R.H.
CIRCULATING
WATER
PUMP
B
MILL E MILL F
MAIN SOURCE B
4.0 kV, 50 Hz
Fault level – 173.9 MVA
x/r – 18.95
Figure 5-9: Service medium voltage boards C and D load configuration
Unit auxiliary power reticulation is modelled by short-circuit capacities, base voltage and x/r
ratios on service medium voltage boards A, B, C and D as depicted in Figure 5-8 and Figure
5-9 respectively for simulation purposes [5][50]. DigSILENT PowerFactroy is used to
perform system load flow and fault level studies to determine the reticulation short-circuit
capacities, and x/r ratios for the different case studies as simulated and discussed in the next
subsections. Impact on busbar voltage, busbar relative phase angle, motor shaft speed, stator
current, electromagnetic torque and rotor flux angle of the largest motor amongst the group
of motors being transferred is analysed in order to evaluate the performance of the different
bus transfer methods and their impact on the process thereof.
5.6.1 Case study 1: Transfer of left hand induced draught fan
Figure 5-9 depicts the power supply configuration and associated transfer system as is
modelled in Simulink in order to simulate the performance of the three bus transfer schemes
during transfer of an induced draught fan motor from service medium voltage board C to
service medium voltage board D when power supply is lost on service medium voltage board
C. The loss of power on service medium voltage board C is assumed to have been as a result
of an inter-tripping signal received from an upstream protection scheme following a
transformer fault picked up by a differential protection relay element device number 87 [82].
Tripping of both upstream and downstream ensures that the transformer is isolated from the
system [15]. The bus transfer scheme objective is therefore to transfer the induced draught
fan motor to an alternate service medium voltage board D that is supplied from main source
‘B’ to maintain process continuity by keeping the induced draught fan motor running.

69
5.6.1.1 Fast bus transfer simulation results
Main sources ‘A’ and ‘B’ are in synchronism before power is lost on service medium voltage
board C; ‘A’ main breaker is initially closed at the beginning of the simulation, tie breaker is
open, and ‘B’ main breaker is closed and supplying service medium voltage board D. The
simulation is started a time t = 0 s when the motors are powered up with their shafts coupled
to their respective loads. The induced draught fan motor in particular, is continuously loaded
in proportion to the square of the shaft speed as the speed increases, until the torque reaches
a load magnitude of 0.8 p.u. torque, and a full speed of 0.996 p.u. An inter-tripping signal
from upstream protection scheme is received at time t = 15 s when the motors are already
running at full speeds, initiating the fast bus transfer scheme to supervise the transfer of the
induced draught fan motor from service medium voltage board C to service medium voltage
board D through the tie-breaker; all other motors on service medium voltage board C are
shed-off, and would be restored manually by the unit operator. Table 5-1 presents the
applicable bus transfer settings.
Table 5-1: Fast bus transfer system settings
VASMgn_Upp_Limit
[p.u.]
VASMgn_Low_Limit
[p.u.]
VMbMgn_Limit
[p.u.]
TB
[s]
Øsetting
[deg]
1.1 0.9 0.85 0.02 ±20
5.6.1.1(a) Voltage, busbar phase angle and shaft speed response
Figure 5-10 depicts the response of voltage, busbar phase angle and shaft speed during the
fast bus transfer of induced draught fan motor from service medium voltage boards C to D
through the tie breaker.
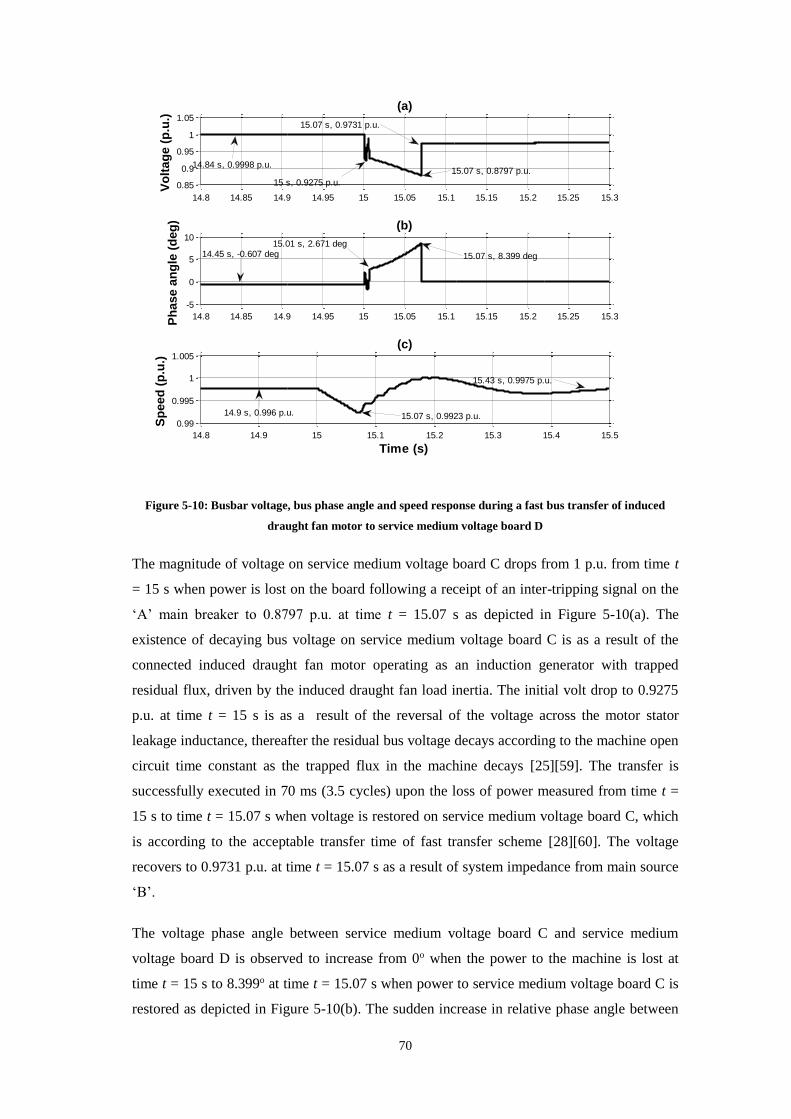
70
Figure 5-10: Busbar voltage, bus phase angle and speed response during a fast bus transfer of induced
draught fan motor to service medium voltage board D
The magnitude of voltage on service medium voltage board C drops from 1 p.u. from time t
= 15 s when power is lost on the board following a receipt of an inter-tripping signal on the
‘A’ main breaker to 0.8797 p.u. at time t = 15.07 s as depicted in Figure 5-10(a). The
existence of decaying bus voltage on service medium voltage board C is as a result of the
connected induced draught fan motor operating as an induction generator with trapped
residual flux, driven by the induced draught fan load inertia. The initial volt drop to 0.9275
p.u. at time t = 15 s is as a result of the reversal of the voltage across the motor stator
leakage inductance, thereafter the residual bus voltage decays according to the machine open
circuit time constant as the trapped flux in the machine decays [25][59]. The transfer is
successfully executed in 70 ms (3.5 cycles) upon the loss of power measured from time t =
15 s to time t = 15.07 s when voltage is restored on service medium voltage board C, which
is according to the acceptable transfer time of fast transfer scheme [28][60]. The voltage
recovers to 0.9731 p.u. at time t = 15.07 s as a result of system impedance from main source
‘B’.
The voltage phase angle between service medium voltage board C and service medium
voltage board D is observed to increase from 0o when the power to the machine is lost at
time t = 15 s to 8.399o at time t = 15.07 s when power to service medium voltage board C is
restored as depicted in Figure 5-10(b). The sudden increase in relative phase angle between
14.8 14.85 14.9 14.95 15 15.05 15.1 15.15 15.2 15.25 15.3
0.85
0.9
0.95
1
1.05
(a)
Vo
ltag
e (
p.u
.)
14.8 14.85 14.9 14.95 15 15.05 15.1 15.15 15.2 15.25 15.3
-5
0
5
10
(b)
Ph
ase a
ng
le (
deg
)
14.8 14.9 15 15.1 15.2 15.3 15.4 15.5
0.99
0.995
1
1.005
(c)
Sp
eed
(p
.u.)
Time (s)
15.07 s, 0.8797 p.u.
15.07 s, 0.9731 p.u.
15.07 s, 8.399 deg
15.43 s, 0.9975 p.u.
15.07 s, 0.9923 p.u.
14.84 s, 0.9998 p.u.
14.45 s, -0.607 deg
14.9 s, 0.996 p.u.
15.01 s, 2.671 deg
15 s, 0.9275 p.u.

71
service medium voltage board C and service medium voltage board D is also as a result of
reversal of the voltage across the motor stator leakage inductance, which causes the machine
impedance to change as the machine slip changes, resulting in a sudden 2.671o relative phase
change at time t = 15 s as depicted in Figure 5-10(b) [60]. Further increase in relative phase
difference is observed as the machine losses speed. Figure 5 - 10(c) depicts the shaft speed,
which is easily maintained at full speed after dropping to 0.9923 p.u. at time t = 15.07 s due
to high load inertia constant, and the high-speed transfer of the motor bus to a healthy
alternate source ‘B’ through service medium voltage board D [61].
5.6.1.1(b) Stator current, electromagnetic torque and rotor flux angle
Figure 5-11 depicts the response of stator current, electromagnetic torque and rotor flux
angle during the fast bus transfer of induced draught fan motor from service medium voltage
board C to service medium voltage board D through the tie breaker.
Figure 5-11: Induced draught motor Stator current, electromagnetic torque and rotor flux angle response
during a fast bus transfer to service medium voltage board D
Stator current drops to 0 p.u. when the main source ‘A’ power supply is disconnected,
following the tripping of ‘A’ main breaker. This phenomenon causes the developed stator
flux to collapse, which result in electromagnetic torque also dropping to zero as depicted in
Figure 5-11(a) and Figure 5-11(b) at time t = 15 s respectively [62].
14.8 14.9 15 15.1 15.2 15.3 15.4 15.5
0
0.5
1
1.5
(a)
Sta
tor
cu
rren
t (p
.u.)
14.8 14.9 15 15.1 15.2 15.3 15.4 15.5
-2
0
2
4
(b)
To
rqu
e (
p.u
.)
14.8 14.9 15 15.1 15.2 15.3 15.4 15.5
95
100
105
(c)
Ro
tor
flu
x a
ng
le (
deg
)
Time (s)
15.09 s, 1.203 p.u.
15.4 s, 0.515 p.u.
15.09 s, 3.479 p.u.
15.07 s, 0.0509 p.u.
15.07 s, 99.8 deg
15.41 s, 95.17 deg
15.07 s, 0.038 p.u.
14.9 s, 0.5019 p.u.
14.9 s, 0.8509 p.u.
14.9 s, 93.47 deg

72
When the tie breaker closes at time t = 15.07 s as depicted in Figure 5-11, current increases
to a peak of 1.203 p.u. at time t = 15.09 s as a result of the reduced motor shaft speed of
0.9923 p.u.; resulting in an increase in slip that causes the rotor circuit resistance to decrease
[62]. The increase in current causes the motor to develop torque with a peak of 3.479 p.u. at
time t = 15.09 s and accelerate the shaft speed to reach 0.9975 p.u. full speed as it was before
the loss of power on service medium voltage board C. The magnitude of the peak torque is
as a result of system natural frequency with which the load torque oscillates upon loss of
power to the machine, depending on angular position of the shaft when the alternate source
is connected; higher electromagnetic torque magnitude is produced when the two torques
initially act against each other [29].
The residual rotor flux momentarily losses synchronism to the stator flux to which it was
lagging 93.47o before power was lost on service medium voltage board C at time t = 14.9 s
as depicted in Figure 5-11(c). The flux angle increased to 99.8o at time t = 15.07 s as
depicted in Figure 5-11(c). The loss of synchronism is as a result of the collapse in stator
flux following stator current dropping to zero upon the loss of power supply on the machine
[62]. However, the machine develops torque and accelerates following the slight reduction in
speed [62], both stator and rotor fluxes synchronise and maintain 95.17o between them soon
after the load bus has been transferred to the alternate service medium voltage board D,
ensuring that the machine remain stable to support process continuity.
5.6.1.2 In-phase bus transfer simulation results
Simulation setup and configuration for the fast bus transfer scheme presented in subsection
5.6.1.1 is used to simulate in-phase bus transfer of the induced draught fan motor from
service medium voltage board C to service medium voltage board D. Table 5-2 presents the
applicable bus transfer settings.
Table 5-2: In – phase bus transfer system settings
VASMgn_Upp_Limit
[p.u.]
VASMgn_Low_Limit
[p.u.]
VMbMgn_Limit
[p.u.]
TB
[s]
1.1 0.9 0.35 0.02

73
5.6.1.2(a) Voltage, busbar phase angle and shaft speed response
Figure 5-12 depicts the response of voltage, busbar phase angle and shaft speed during in-
phase bus transfer of induced draught fan motor from service medium voltage board C to
service medium voltage board D through the tie breaker.
Figure 5-12: Busbar voltage, bus phase angle and speed response during in-phase bus transfer of induced
draught fan motor to service medium voltage board D
The magnitude of voltage on service medium voltage board C drops from 1 p.u. from time t
= 15 s when power is lost on the board following a receipt of an inter-tripping signal on the
‘A’ main breaker to 0.523 p.u. at time t = 15.64 s as depicted in Figure 5-12(a). The
existence of bus decaying voltage on service medium voltage board A is again as a result of
the connected induced draught fan motor operating as an induction generator with trapped
residual flux, driven by the induced draught fan load inertia. The initial volt drop to 0.924
p.u. at time t = 15 s is as a result of the reversal of the voltage across the motor stator
leakage inductance, thereafter the residual bus voltage decays according to the machine open
circuit time constant as the trapped flux in the machine decays [25][59]. The transfer is
successfully executed in 640 ms (32 cycles) upon the loss of power measured from time t =
15 s to time t = 15.64 s when voltage is restored on service medium voltage board C, which
is according to the acceptable transfer time of in-phase bus transfer scheme [28][60]. The
14.8 15 15.2 15.4 15.6 15.8 16 16.2 16.4
0.5
1
1.5
(a)
Vo
ltag
e (
p.u
.)
14.8 15 15.2 15.4 15.6 15.8 16 16.2 16.4
0
100
200
300
(b)
Ph
ase a
ng
le (
deg
)
14.8 15 15.2 15.4 15.6 15.8 16 16.2 16.4
0.85
0.9
0.95
1
1.05
(c)
Sp
eed
(p
.u.)
Time (s)
15 s, 0.924 p.u.15.64 s, 0.523 p.u.
15.64 s, 0.939 p.u. 16.04 s, 0.972 p.u.
15.64 s, 360 deg
15.63 s, 0.939 p.u.
15.87 s, 1.009 p.u. 16.3 s, 0.9975 p.u.
14.88 s, 0.9998 p.u.
14.9 s, 0.9975 p.u.
14.9 s, -0.6706 deg
15.01 s, 2.594 deg

74
voltage recovers to 0.972 p.u. at time t = 16.04 s as a result of system impedance from main
source ‘B’, and the added load.
Relative phase angle between service medium voltage board C and service medium voltage
board D increases as an indication of loss of synchronism between service medium voltage
board C and service medium voltage board D. The phasor slips one full cycle of 360o
according to in-phase bus transfer method during the time when service medium voltage
board C is not connected to any power supply as depicted in Figure 5-12(b).
The sudden increase in relative phase angle between service medium voltage board C and
service medium voltage board D is also as a result of the reversal of the voltage across the
motor stator leakage inductance, which causes the machine impedance to change as the
machine slip changes, resulting in a sudden 2.994o relative phase change at time t = 15 s as
depicted in Figure 5-12(b) [60]. Further increase in relative phase difference is observed as
the machine losses speed. Figure 5-12(c) depicts the shaft speed, which is maintained
between 0.939 p.u. at time t = 15.63 s and 1.009 p.u. at time t = 15.87s due to high load
inertia constant, and the relative high-speed transfer of the motor bus to a healthy alternate
service medium voltage board D through the tie breaker [61]. The speed stabilises at 0.9975
p.u. at time t = 16.43 s.
5.6.1.2(b) Stator current, electromagnetic torque and rotor flux angle response
Figure 5-13 depicts the response of stator current, electromagnetic torque and rotor flux
angle during the in-phase bus transfer process of induced draught fan motor from service
medium voltage board C to service medium voltage board D through the tie breaker.

75
Figure 5-13: Induced draught motor stator current, electromagnetic torque and rotor flux angle response
during an in-phase bus transfer to service medium voltage board D
Stator current drops at time t = 15 s when the main source ‘A’ power supply is disconnected,
following the tripping of ‘A’ main breaker. This phenomenon causes the developed stator
flux to collapse, which results in electromagnetic torque also dropping to zero as depicted in
Figure 5-13(a) and Figure 5-13(b) at time t = 15 s respectively [62].
When the tie breaker closes at time t = 15.64 s as depicted in Figure 5-13, current increases
to a peak of 3.497 p.u. at time t = 15.73 s as a result of the reduced motor shaft speed of
0.939 p.u.; resulting in an increase in slip that causes the rotor circuit resistance to decrease
[62]. The increase in current causes the motor to develop torque with a peak of 6.676 p.u. at
time t = 15.71 s and accelerate the shaft speed to reach 0.9975 p.u. full speed as it was before
the loss of power on service medium voltage board C. The magnitude of the peak torque is
as a result of system natural frequency with which the load torque oscillates upon the loss of
power to the machine, depending on its angular position when the alternate source is
connected; higher electromagnetic torque magnitude is produced when the two torques
initially act against each other [29].
The residual rotor flux losses synchronism to the stator flux to which it was lagging 93.5o
before power was lost on service medium voltage board C, and slip by 360o during the time
when the machine is not connected to any power supply as depicted in Figure 5-13(c). The
14.8 15 15.2 15.4 15.6 15.8 16 16.2 16.4
0
2
4
(a)
Sta
tor
cu
rren
t (p
.u.)
14.8 15 15.2 15.4 15.6 15.8 16 16.2 16.4
-5
0
5
10
(b)
To
rqu
e (
p.u
.)
14.8 15 15.2 15.4 15.6 15.8 16 16.2 16.4
-200
0
200
(c)
Ro
tor
flu
x a
ng
le (
deg
)
Time (s)
14.99 s, 0.519 p.u. 15.64 s, 0.2095 p.u.15.73 s, 3.497 p.u. 16.46 s, 0.5113 p.u.
14.99 s, 0.85 p.u.
15.64 s, 0.248 p.u.
15.71 s, 6.676 p.u.16.44 s, 0.851 p.u.
15.32 s, 180 deg15.32 s, -180 deg
15.72 s, 133.4 deg16.43 s, 94.77 deg
14.9 s, 0.8509 p.u.
14.9 s, 93.47 deg

76
loss of synchronism is as a result of the collapse in stator flux following stator current
dropping to zero upon the loss of power supply on the machine [62].The machine develops
torque and accelerates soon after it has been transferred to the alternate supply [62]. The
stator and rotor fluxes synchronise with 94.77o phase difference soon after the induced
draught fan motor has been transferred to the alternate supply through service medium
voltage board D; ensuring that the machine remain stable to support process continuity.
5.6.1.3 Residual bus voltage transfer simulation results
Simulation setup and configuration for the fast and in-phase bus transfer scheme presented in
subsection 5.6.1.1 is used to simulate residual bus voltage transfer of the induced draught fan
motor from service medium voltage board C to service medium voltage board D. Table 5-3
presents the applicable bus transfer settings.
Table 5-3: Residual bus voltage transfer system settings
VASMgn_Upp_Limit
[p.u.]
VASMgn_Low_Limit
[p.u.]
VMbMgn_Limit
[p.u.]
1.1 0.9 0.25
5.6.1.3(a) Voltage, busbar phase angle and shaft speed response
Figure 5-14 depicts the response of voltage, busbar phase angle and shaft speed during
residual bus voltage transfer of induced draught fan motor from service medium voltage
board C to service medium voltage board D through the tie breaker.
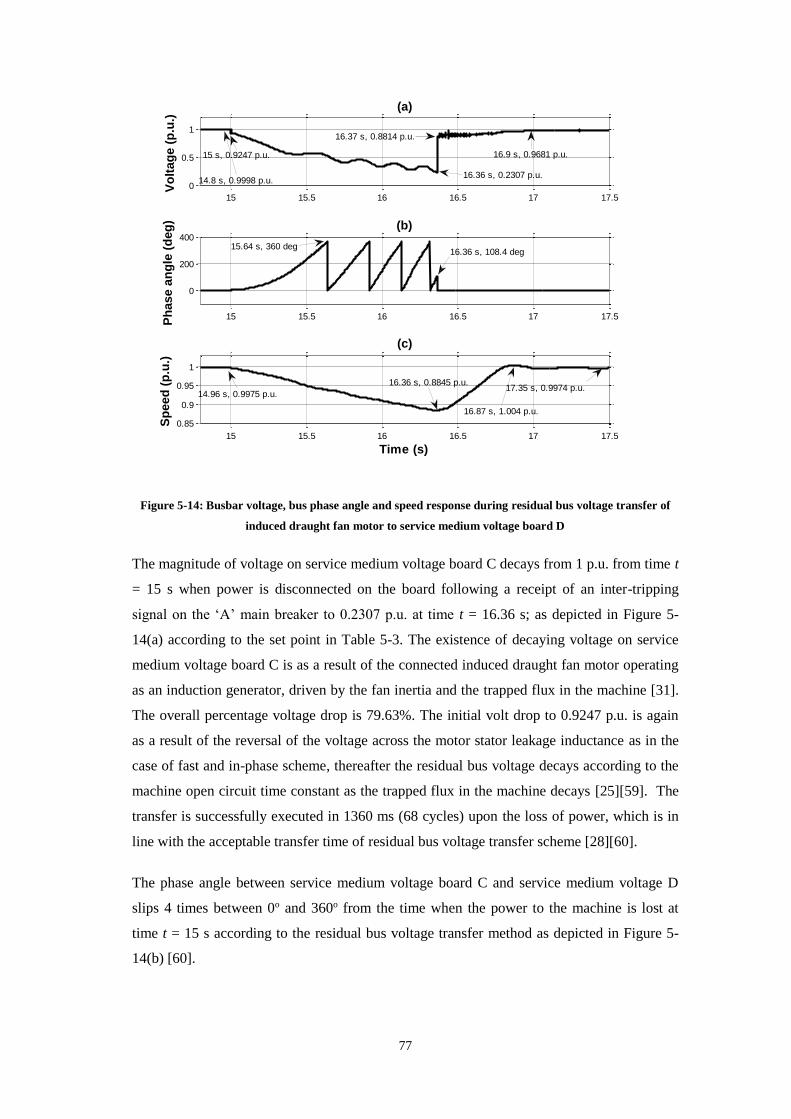
77
Figure 5-14: Busbar voltage, bus phase angle and speed response during residual bus voltage transfer of
induced draught fan motor to service medium voltage board D
The magnitude of voltage on service medium voltage board C decays from 1 p.u. from time t
= 15 s when power is disconnected on the board following a receipt of an inter-tripping
signal on the ‘A’ main breaker to 0.2307 p.u. at time t = 16.36 s; as depicted in Figure 5-
14(a) according to the set point in Table 5-3. The existence of decaying voltage on service
medium voltage board C is as a result of the connected induced draught fan motor operating
as an induction generator, driven by the fan inertia and the trapped flux in the machine [31].
The overall percentage voltage drop is 79.63%. The initial volt drop to 0.9247 p.u. is again
as a result of the reversal of the voltage across the motor stator leakage inductance as in the
case of fast and in-phase scheme, thereafter the residual bus voltage decays according to the
machine open circuit time constant as the trapped flux in the machine decays [25][59]. The
transfer is successfully executed in 1360 ms (68 cycles) upon the loss of power, which is in
line with the acceptable transfer time of residual bus voltage transfer scheme [28][60].
The phase angle between service medium voltage board C and service medium voltage D
slips 4 times between 0o and 360o from the time when the power to the machine is lost at
time t = 15 s according to the residual bus voltage transfer method as depicted in Figure 5-
14(b) [60].
15 15.5 16 16.5 17 17.5
0
0.5
1
(a)
Vo
ltag
e (
p.u
.)
15 15.5 16 16.5 17 17.5
0
200
400
(b)
Ph
ase a
ng
le (
deg
)
15 15.5 16 16.5 17 17.5
0.85
0.9
0.95
1
(c)
Sp
eed
(p
.u.)
Time (s)
16.36 s, 0.2307 p.u.
16.37 s, 0.8814 p.u.
16.9 s, 0.9681 p.u.
15.64 s, 360 deg16.36 s, 108.4 deg
16.36 s, 0.8845 p.u.
14.96 s, 0.9975 p.u.
15 s, 0.9247 p.u.
17.35 s, 0.9974 p.u.
16.87 s, 1.004 p.u.
14.8 s, 0.9998 p.u.

78
Figure 5-14(c) depicts the shaft speed, which dropped to 0.8845 p.u. at time t = 16.36 s as the
kinetic energy on the fan load reduced even more compared to both fast and in-phase bus
transfer processes; however the speed recovered to full speed after slightly overshooting
once the transfer process was completed.
5.6.1.3(b) Stator current, electromagnetic torque and rotor flux angle response
Figure 5-15 depicts the response of stator current, electromagnetic torque and rotor flux
angle during residual bus voltage transfer of induced draught fan motor from service medium
voltage board C to service medium voltage board D through the tie breaker.
Figure 5-15: Induced draught motor stator current, electromagnetic torque and rotor flux angle response
during residual bus voltage transfer to service medium voltage board D
Stator current drops to 0 p.u. at time t = 15 s when power supply is disconnected on service
medium voltage board C, following the tripping of ‘A’ main breaker. This phenomenon
causes the developed stator flux to also collapse, which result in electromagnetic torque also
dropping to zero as depicted in Figure 5-15(a) and Figure 5-15(b) respectively [62].
When the tie breaker closes at time t = 16.37 s as depicted in Figure 5-15(a), current
increases to a peak of 9.053 p.u. at time t = 16.38 s as a result of motor shaft speed having
been reduced to much lower speed of 0.8845 p.u. for the induced draught fan in particular.
The speed reduction result in an increase in slip which causes the rotor circuit resistance to
15 15.5 16 16.5 17 17.5
0
5
10
(a)
Sta
tor
cu
rren
t (p
.u.)
15 15.5 16 16.5 17 17.5
-2
0
2
4
6
(b)
To
rqu
e (
p.u
.)
15 15.5 16 16.5 17 17.5
-200
-100
0
100
200
(c)
Ro
tor
flu
x a
ng
le (
deg
)
Time (s)
16.38 s, 9.053 p.u.
17.26 s, 0.5095 p.u.
14.9 s, 93.47 deg
16.38 s, 3.884 p.u.14.97 s, 0.8509 p.u.
16.7s, 4.256 p.u.
17.47 s, 0.849 p.u.
16.39 s, -180 deg
16.39 s, 180 deg
17.39 s, 94.52 deg
14.93 s, 0.5019 p.u. 16.37 s, 0.3974 p.u.

79
decrease [62]. The increase in current causes the motor to develop torque with a peak of
4.256 p.u. at time t = 16.7 s and accelerate the shaft speed to reach a full speed of 0.9975 p.u.
as it was before the loss of power on service medium voltage board C [28]. The magnitude
of the peak torque at time t = 16.38 s is as a result of system natural frequency with which
the load torque oscillates upon the loss of power to the machine, depending on the angular
position of the mechanical system when the alternate source is connected; higher
electromagnetic torque magnitude is produced when the two torques initially act against each
other [29]. The peak torque is also dependent on the magnitude and phase angle of the bus
residual voltage [11].
The residual rotor flux losses synchronism to the stator flux to which it was lagging 93.47o
before power was lost on service medium voltage board C, and slips 4 cycles during the time
when the machine is not connected to any power supply as depicted on Figure 5-15(c). The
loss of synchronism is as a result of the collapse in stator flux following stator current
dropping to zero upon the loss of power supply on the machine [62]. However when the
machine is reconnected after the residual voltage has dropped by 79.63%, phase change of
about 180o is notable; indicating 180o shaft twist as it develops torque and accelerates the
shaft speed following the much reduced speed of 88.45% [62]. Both stator and rotor fluxes
synchronise with 94.52o phase angle difference soon after the load has been transferred to the
alternate service medium voltage board D.
5.6.2 Case study 2: Transfer of left hand forced draught and primary air fans
The power supply configuration and associated transfer system as is modelled in Simulink to
simulate the performance of the three bus transfer schemes during transfer of both forced and
primary air fan motors from service medium voltage board A to service medium voltage
board B when power supply is lost on service medium voltage board A is depicted in Figure
5-9. The loss of power on service medium voltage board A is assumed to have been as a
result of an inter-tripping signal received from an upstream protection scheme following a
transformer fault picked up by a differential protection relay element device number 87 [82].
Tripping of both upstream and downstream ensures that the transformer is isolated from the
system [15]. The bus transfer scheme objective is therefore to transfer both forced draught
and primary air fan motors to an alternate service medium voltage board B that is supplied
from main source ‘B’ to maintain process continuity by keeping both the forced draught and
primary air fan motors running.

80
5.6.2.1 Fast bus transfer simulation results
Main sources ‘A’ and ‘B’ are in synchronism before power is lost on service medium voltage
board A; ‘A’ main breaker is initially closed at the beginning of the simulation, tie breaker is
open, and ‘B’ main breaker is closed and supplying service medium voltage board B. The
simulation is started a time t = 0 s when the motors are powered up with their shafts coupled
to their respective loads. The motors are continuously loaded in proportion to the square of
their shaft speeds as their speeds increase, until their respective torques reach 0.8 p.u. and
their respective full speeds. An inter-tripping signal from upstream protection scheme is
received at time t = 15 s when the motors are already running at their respective full speeds,
initiating the fast bus transfer scheme to supervise the transfer of both the forced draught and
primary air fan motors from service medium voltage board A to service medium voltage
board B through the tie-breaker; all other motors on service medium voltage board A are
shed-off when power is lost. Shed-off motors are restored manually by the unit operator.
Table 5-1 in subsection 5.6.1.1 presents the applicable bus transfer settings.
Focus is put on analysing the response of the busbar voltage and busbar phase angle.
Furthermore, shaft speed, stator current, electromagnetic torque and rotor flux angle of the
primary air fan is analysed during the transfer process. The primary air fan is selected for
analysis because of it being the largest motor amongst the group of motors being transferred
to the alternate service medium voltage board B.
5.6.2.1(a) Voltage, busbar phase angle and shaft speed response
Figure 5-16 depicts the response of busbar voltage, busbar phase angle and primary air fan
shaft speed during the fast bus transfer of forced draught and primary air fan motors from
service medium voltage board A to service medium voltage board B through the tie breaker.
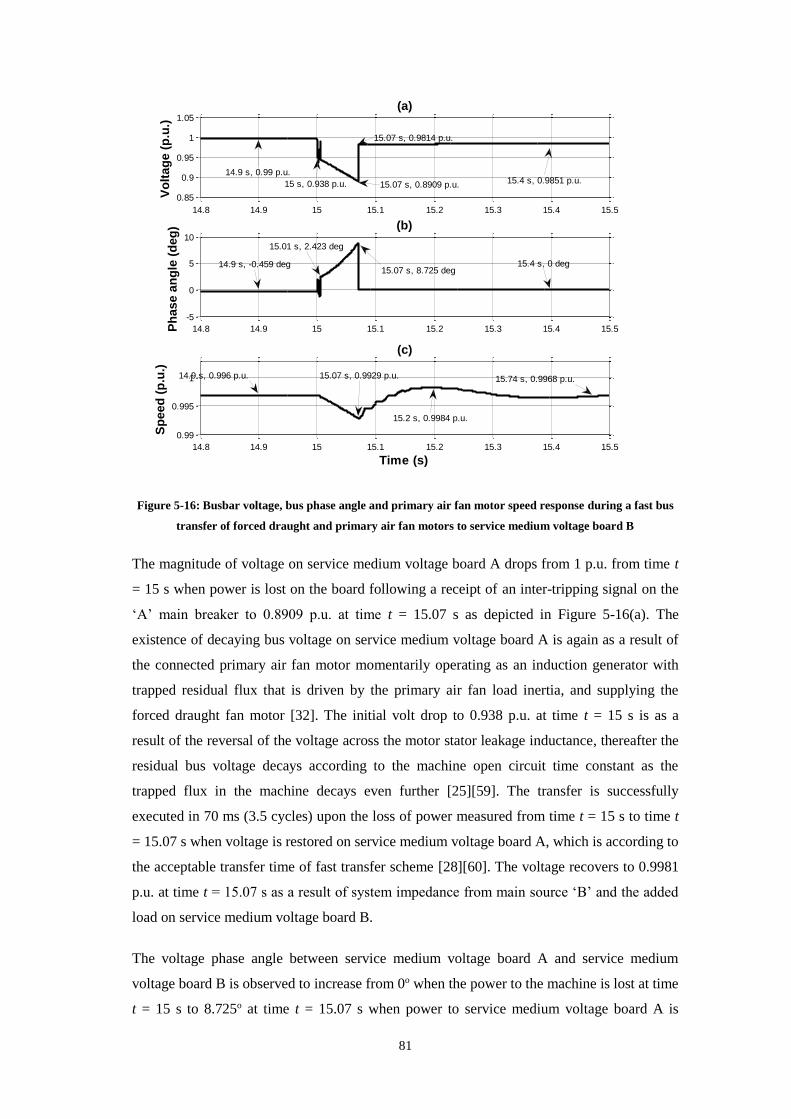
81
Figure 5-16: Busbar voltage, bus phase angle and primary air fan motor speed response during a fast bus
transfer of forced draught and primary air fan motors to service medium voltage board B
The magnitude of voltage on service medium voltage board A drops from 1 p.u. from time t
= 15 s when power is lost on the board following a receipt of an inter-tripping signal on the
‘A’ main breaker to 0.8909 p.u. at time t = 15.07 s as depicted in Figure 5-16(a). The
existence of decaying bus voltage on service medium voltage board A is again as a result of
the connected primary air fan motor momentarily operating as an induction generator with
trapped residual flux that is driven by the primary air fan load inertia, and supplying the
forced draught fan motor [32]. The initial volt drop to 0.938 p.u. at time t = 15 s is as a
result of the reversal of the voltage across the motor stator leakage inductance, thereafter the
residual bus voltage decays according to the machine open circuit time constant as the
trapped flux in the machine decays even further [25][59]. The transfer is successfully
executed in 70 ms (3.5 cycles) upon the loss of power measured from time t = 15 s to time t
= 15.07 s when voltage is restored on service medium voltage board A, which is according to
the acceptable transfer time of fast transfer scheme [28][60]. The voltage recovers to 0.9981
p.u. at time t = 15.07 s as a result of system impedance from main source ‘B’ and the added
load on service medium voltage board B.
The voltage phase angle between service medium voltage board A and service medium
voltage board B is observed to increase from 0o when the power to the machine is lost at time
t = 15 s to 8.725o at time t = 15.07 s when power to service medium voltage board A is
14.8 14.9 15 15.1 15.2 15.3 15.4 15.5
0.85
0.9
0.95
1
1.05
(a)
Vo
ltag
e (
p.u
.)
14.8 14.9 15 15.1 15.2 15.3 15.4 15.5
-5
0
5
10
(b)
Ph
ase a
ng
le (
deg
)
14.8 14.9 15 15.1 15.2 15.3 15.4 15.5
0.99
0.995
1
(c)
Sp
eed
(p
.u.)
Time (s)
14.9 s, 0.99 p.u.
15 s, 0.938 p.u. 15.07 s, 0.8909 p.u.
15.07 s, 0.9814 p.u.
15.4 s, 0.9851 p.u.
14.9 s, -0.459 deg
15.01 s, 2.423 deg
15.07 s, 8.725 deg15.4 s, 0 deg
14.9 s, 0.996 p.u. 15.07 s, 0.9929 p.u.
15.2 s, 0.9984 p.u.
15.74 s, 0.9968 p.u.

82
restored as depicted in Figure 5-16(b). The sudden increase in relative phase angle between
service medium voltage board A and service medium voltage board B is also as a result of
the reversal of the voltage across the motor stator leakage inductance, which causes the
machine impedance to change as the machine slip changes, resulting in a sudden 2.423o
relative phase change at time t = 15 s as depicted in Figure 5-16(b) [60]. Further increase in
relative phase difference is observed as the machines lose speed. Figure 5-16(c) depicts the
shaft speed, which is easily restored to full speed after dropping to 0.9929 p.u. at time t =
15.07 s due to the high load inertia constant of the system, and the high-speed transfer of the
motor bus to a healthy alternate main source ‘B’ through service medium voltage board B
[61].
5.6.2.1(b) Stator current, electromagnetic torque and rotor flux angle
Figure 5-17 depicts the response of stator current, electromagnetic torque and rotor flux
angle of primary air fan motor during the fast bus transfer process of both forced draught and
primary air motors from service medium voltage board A to service medium voltage board
B through the tie breaker.
Figure 5-17: Primary air fan stator current, electromagnetic torque and rotor flux angle response during
fast bus transfer of forced draught and primary air fan motors to service medium voltage board B
14.8 14.9 15 15.1 15.2 15.3 15.4 15.5
0
0.5
1
1.5
(a)
Sta
tor
cu
rren
t (p
.u.)
14.8 14.9 15 15.1 15.2 15.3 15.4 15.5
-2
0
2
4
(b)
To
rqu
e (
p.u
.)
14.8 14.9 15 15.1 15.2 15.3 15.4 15.5
92
94
96
98
100
(c)
Ro
tor
flu
x a
ng
le (
deg
)
Time (s)
15.07 s, 0.034 p.u. 15.09 s, 1.408 p.u .
14.49 s,0.483 p.u.
15.08 s, 3.965 p.u.
14.9 s, 92.89 deg
15.07 s, 99.28 deg 15.49 s, 93.92 deg
15.4 s, 0.85 p.u.14.9 s, 0.85 p.u.
14.9 s, 0.47 p.u.

83
Stator current drops to 0 p.u. when the main source ‘A’ power supply is disconnected,
following the tripping of ‘A’ main breaker. This phenomenon causes the developed stator
flux to collapse, which result in electromagnetic torque also dropping to zero as depicted in
Figure 5-17(a) and Figure 5-17(b) respectively at time t = 15 s [62].
When the tie breaker closes at time t = 15.07 s as depicted in Figure 5-17(a), current
increases to a peak of 1.408 p.u. at time t = 15.08 s as a result of the reduced motor shaft
speed of 0.9929 p.u.; resulting in an increase in slip that causes the rotor circuit resistance to
decrease [62]. The increase in current causes the motor to develop a peak torque of 3.965
p.u. at time t = 15.08 s and accelerate the shaft speed to reach 0.9968 p.u. speed as it was
before the loss of power on service medium voltage board A. The magnitude of the peak
torque at time t = 15.07s is as a result of system natural frequency with which the load torque
oscillates upon the loss of power to the machine, depending on the angular position of the
shaft when the alternate source is connected; higher electromagnetic torque magnitude is
produced when the two torques initially act against each other [29].
The residual rotor flux momentarily losses synchronism to the stator flux to which it was
lagging 92.89o before power was lost on service medium voltage board A at time t = 14.9 s
as depicted in Figure 5-17(c). The flux angle increased to 99.28o at time t = 15.07 s as
depicted in Figure 5-17(c). The loss of synchronism is as a result of collapse in stator flux
upon the loss of power supply on the machine [62]. However, the machine develops torque
and accelerates following the slight reduction in speed [62], both stator and rotor fluxes
synchronise and maintain 93.92o between them soon after the load bus has been transferred
to the alternate service medium voltage board B through the tie breaker, ensuring that the
machine remain stable to support process continuity.
5.6.2.2 In-phase bus transfer simulation results
Simulation setup and configuration for the fast bus transfer scheme presented in subsection
5.6.1.1 is used to simulate in-phase bus transfer of both the forced draught and primary air
fan motors from service medium voltage board A to service medium voltage board B. Table
5-2 in subsection 5.6.1.2 presents the applicable bus transfer settings.
5.6.2.2(a) Busbar voltage, busbar phase angle and shaft speed response
Figure 5-18 depicts the response of busbar voltage, busbar phase angle and primary air fan
shaft speed during in-phase bus transfer of both the forced draught and primary air fan
motors from service medium voltage board A to service medium voltage board B through
the tie breaker.

84
Figure 5-18: Busbar voltage, busbar phase angle and primary air fan speed response during in-phase bus
transfer of forced draught and primary air fan motors to service medium voltage board B
The magnitude of voltage on service medium voltage board A drops from 1 p.u. from time t
= 15 s when power is lost on the board following a receipt of an inter-tripping signal on the
‘A’ main breaker to 0.5111 p.u. at time t = 15.63 s as depicted in Figure 5-18(a). The
existence of bus decaying voltage on the service medium voltage board A is as a result of the
connected forced draught and primary air fan motors. The primary air fan motor
momentarily operate as an induction generator with trapped residual flux that is driven by
the primary air fan load inertia, supplying the forced draught fan motor because of its size
relative to the forced draught fan. The initial volt drop to 0.9448 p.u. at time t = 15 s is as a
result of the reversal of the voltage across the motor stator leakage inductance, thereafter the
residual bus voltage decays according to the open circuit time constant of the machines as
the trapped flux decays [25][59]. The transfer is successfully executed in 630 ms (31.5
cycles) upon the loss of power supply measured from time t = 15 s to time t = 15.63 s when
voltage is restored on service medium voltage board A through the tie breaker, which is
according to the acceptable transfer time of in-phase bus transfer scheme [28][60]. The
voltage initially recovers to 0.9462 p.u. at time t = 15.63 s as a result of system impedance
from main source ‘B’ and the added load, but ultimately recovers to 0.9901 p.u. at time t =
15.98 s when the primary air fan motor reaches full speed at time t = 16.2 s.
14.8 15 15.2 15.4 15.6 15.8 16 16.2 16.4
0.4
0.6
0.8
1
(a)
Vo
ltag
e (
p.u
.)
14.8 15 15.2 15.4 15.6 15.8 16 16.2 16.4
-200
0
200
400
(b)
Ph
ase a
ng
le (
deg
)
14.8 15 15.2 15.4 15.6 15.8 16 16.2 16.4
0.92
0.94
0.96
0.98
1
1.02
(c)
Sp
eed
(p
u)
Time (s)
14.9 s, 0.999 p.u.
15 s, 0.9448 p.u.
15.63 s, 0.9462 p.u.
15.63 s, 359.6 deg14.9 s, -0.459 deg
14.89 s, 0.9967 p.u.
15.65 s, 0.9439 p.u.
15.9 s, 1.002 p.u. 16.2 s, 0.9967 p.u.
15.02 s, 2.97 deg
15.98 s, 0.9901 p.u.
15.63 s, 0.5111 p.u.

85
Relative phase angle between service medium voltage board A and service medium voltage
board B increases as an indication of loss of synchronism between service medium voltage
board A and service medium voltage board B. The phasor slips one full cycle of 360o
according to in-phase bus transfer method during the time when service medium voltage
board A is not connected to any power supply as depicted in Figure 5- 18(b).
The sudden increase in relative phase angle between service medium voltage board A and
service medium voltage board B at time t = 15 s is again as a result of the reversal of the
voltage across the motor stator leakage inductance, which causes the machine impedance to
change as the machine slip changes, resulting in a sudden 2.97o relative phase change as
depicted in Figure 5-18(b) [60]. Further increase in relative phase difference is observed as
the machine losses speed. Figure 5-18(c) depicts the shaft speed, which is maintained above
0.9439 p.u. at time t = 15.65 s due to high load inertia and the relative high-speed transfer of
the motor bus to a healthy alternate service medium voltage board B through the tie breaker
[61]. The speed stabilises at 0.9967 p.u. at time t = 16.2 s.
5.6.2.2(b) Stator current, electromagnetic torque and rotor flux angle response
Figure 5-19 depicts the response of primary air fan stator current, electromagnetic torque and
rotor flux angle during an in-phase bus transfer of both forced draught and primary air fan
motors from service medium voltage board A to service medium voltage board B through
the tie breaker.

86
Figure 5-19: Primary air fan motor stator current, electromagnetic torque and rotor flux angle response
during an in-phase bus transfer of induced draught fan motor to service medium voltage board B
Stator current momentarily stops flowing at time t = 15 s when the main source ‘A’ power
supply is disconnected, following the tripping of ‘A’ main breaker. This phenomenon causes
the developed stator flux to collapse, which results in electromagnetic torque also dropping
to zero as depicted in Figure 5-19(a) and Figure 5-19(b) respectively at time t = 15 s [62],
after which the stator current begins to increase and reaches a peak of 0.6445 p.u. at time t =
15.48 s, while negative electromagnetic torque of 0.8508 p.u. develops on the motor, this
phenomenon demonstrates the induction generating mode of the primary air fan motor
driven by its load inertia [32].
When the tie breaker closes at time t = 15.63 s, current increases to a peak of 3.398 p.u. at
time t = 15.73 s depicted in Figure 5-19(b). The reduced motor shaft speed of 0.9439 p.u.
leads to an increase in slip that causes the rotor circuit resistance to decrease [62]. The
increase in current causes the motor to develop torque with a peak of 7.257 p.u. at time t =
15.7 s and accelerate the shaft speed to reach 0.9967 p.u. full speed as it was before the loss
of power on service medium voltage board A. The magnitude of the initial peak torque at
time t = 15.63 s is as a result of system natural frequency with which the load torque
oscillates upon loss of power to the machine, depending on its angular position when the
alternate source is connected; higher electromagnetic torque magnitude is produced when the
two torques initially act against each other [29].
14.8 15 15.2 15.4 15.6 15.8 16 16.2 16.4
0
1
2
3
4
(a)
Sta
tor
cu
rren
t (p
.u.)
14.8 15 15.2 15.4 15.6 15.8 16 16.2 16.4
-5
0
5
10
(b)
To
rqu
e (
p.u
.)
14.8 15 15.2 15.4 15.6 15.8 16 16.2 16.4
-200
-100
0
100
200
(c)
Ro
tor
flu
x a
ng
le (
deg
)
Time (s)
14.9 s, 0.4666 p.u. 15 s, 0.03507 p.u.
15.48 s, 0.6445 p.u.
15.63 s, 0.1743 p.u.
15.73 s, 3.398 p.u.
16.33 s, 0.4653 p.u.
14.9 s, 0.85 p.u.
14.47 s, -0.8508 p.u.
15.7 s, 7.257 p.u.
16.29 s, 0.8523 p.u.
14.9 s, 92.89 deg
15.32 s, -180 deg
15.32 s, 179.6 deg
15.71 s, 123.8 deg16.38 s, 93.69 deg

87
The residual rotor flux losses synchronism to the stator flux to which it was lagging 92.89o
before power was lost on service medium voltage board A, and slip by 360o during the time
when the machine is not connected to any power supply as depicted in Figure 5-19(c). The
loss of synchronism is as a result of collapsed stator flux following stator current
momentarily dropping to zero upon the loss of power supply on the machine [62]. The
machine develops torque and accelerates soon after it has been transferred to the alternate
supply [62]. The stator and rotor fluxes synchronise with 93.69o phase difference soon after
both forced draught and primary air fan motors have been transferred to the alternate supply
through service medium voltage board B; ensuring that the machine remain stable to support
process continuity.
5.6.2.3 Residual bus voltage transfer simulation results
Simulation setup and configuration for the fast bus transfer scheme presented in subsection
5.6.1.1 is used to simulate in-phase bus transfer of the forced draught and primary air fan
motors from service medium voltage board A to service medium voltage board B. Table 5-3
in subsection 5.6.1.3 presents the applicable bus transfer settings.
5.6.2.3(a) Voltage, busbar phase angle and shaft speed response
Figure 5-20 depicts the response of busbar voltage, busbar phase angle and shaft speed of the
primary air fan motor during a residual bus voltage transfer of both the forced draught and
primary air fan motors from service medium voltage board A to service medium voltage
board B through the tie breaker.

88
Figure 5-20: Busbar voltage, busbar phase angle and speed response during residual bus voltage transfer
of both forced draught and primary air fan motors to service medium voltage board B
The magnitude of voltage on service medium voltage board A decays from 1 p.u. from time t
= 15 s when power is disconnected on the board following a receipt of an inter-tripping
signal on the ‘A’ main breaker to 0.2361 p.u. at time t = 16.12 s; as depicted in Figure 5-
20(a) according to the set point in Table 5-3. The existence of decaying bus voltage on
service medium voltage board A is as a result of the connected forced draught and primary
air fan motors. The primary air fan motor momentarily operate as an induction generator
with trapped residual flux that is driven by the primary air fan load inertia, and supply the
forced draught fan motor because of its size relative to the forced draught fan motor. The
initial volt drop to 0.9478 p.u. at time t = 15.01 s is as a result of the reversal of the voltage
across the motor stator leakage inductance as in the case of fast and in-phase transfer
processes, thereafter the residual bus voltage decays according to the machine open circuit
time constant as the trapped flux in the machine decays [25][59]. The transfer is
successfully executed in 1612 ms (80.6 cycles) upon the loss of power supply, which is
according to the acceptable transfer time of residual bus voltage transfer scheme [28][60].
The phase angle between service medium voltage board A and service medium voltage B
slips 3 times between 0o and 360o from the time when the power to the machine is lost at
time t = 15 s according to the residual bus voltage transfer method as depicted in Figure 5-
20(b) [60]. Figure 5-20(c) depicts the shaft speed, which dropped to 0.9039 p.u. at time t =
14.8 15 15.2 15.4 15.6 15.8 16 16.2 16.4 16.6 16.8
0.2
0.4
0.6
0.8
1
(a)
Vo
ltag
e (
p.u
.)
14.8 15 15.2 15.4 15.6 15.8 16 16.2 16.4 16.6 16.8
-200
0
200
400
(b)
Ph
ase a
ng
le (
deg
)
14.8 15 15.2 15.4 15.6 15.8 16 16.2 16.4 16.6 16.8
0.9
0.95
1
1.05
(c)
Sp
eed
(p
.u.)
Time (s)
14.89 s, 0.999 p.u.
15.01 s, 0.9478 p.u.
16.12 s, 0.236 p.u.
16.19 s, 0.8876 p.u.
16.66 s, 0.9823 p.u.
16.8 s, 0.9847 p.u.
15.63 s, 359.6 deg 16.12 s, 126 deg
16.2 s, 0.9039 p.u.
16.6 s, 1 p.u.
16.98 s, 0.9967 p.u.
14.9 s, -0.4595 deg
14.89 s, 0.9967p.u.
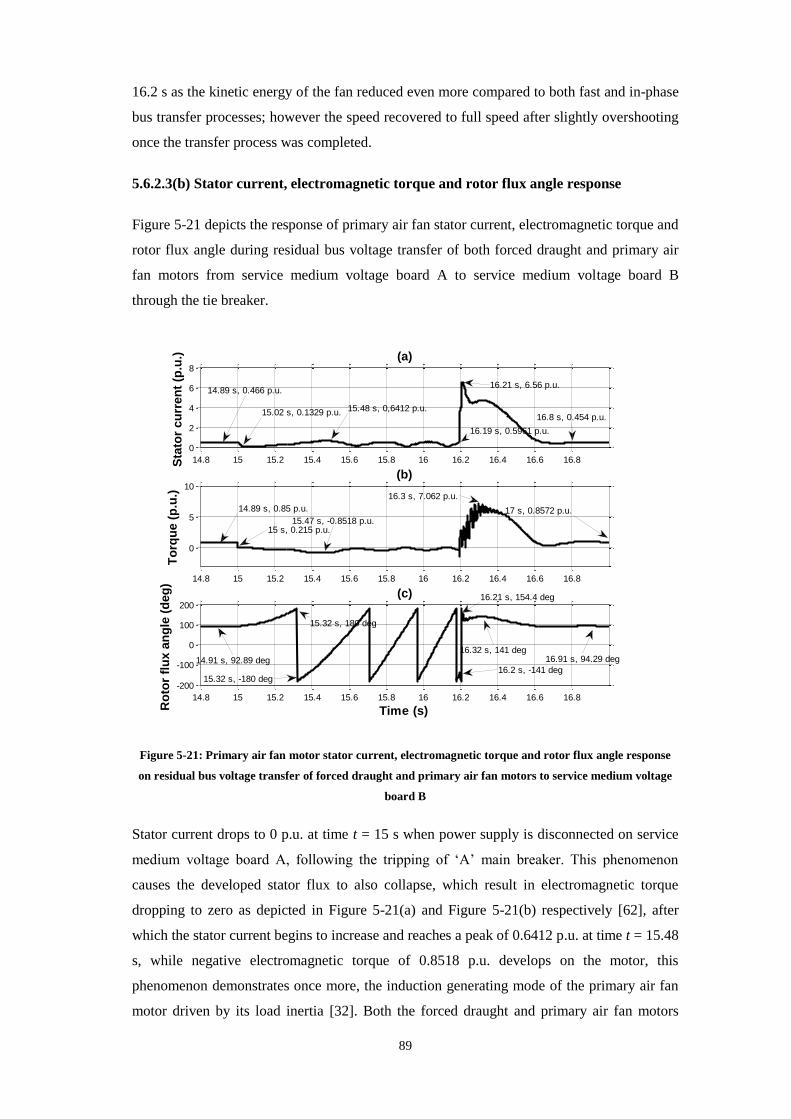
89
16.2 s as the kinetic energy of the fan reduced even more compared to both fast and in-phase
bus transfer processes; however the speed recovered to full speed after slightly overshooting
once the transfer process was completed.
5.6.2.3(b) Stator current, electromagnetic torque and rotor flux angle response
Figure 5-21 depicts the response of primary air fan stator current, electromagnetic torque and
rotor flux angle during residual bus voltage transfer of both forced draught and primary air
fan motors from service medium voltage board A to service medium voltage board B
through the tie breaker.
Figure 5-21: Primary air fan motor stator current, electromagnetic torque and rotor flux angle response
on residual bus voltage transfer of forced draught and primary air fan motors to service medium voltage
board B
Stator current drops to 0 p.u. at time t = 15 s when power supply is disconnected on service
medium voltage board A, following the tripping of ‘A’ main breaker. This phenomenon
causes the developed stator flux to also collapse, which result in electromagnetic torque
dropping to zero as depicted in Figure 5-21(a) and Figure 5-21(b) respectively [62], after
which the stator current begins to increase and reaches a peak of 0.6412 p.u. at time t = 15.48
s, while negative electromagnetic torque of 0.8518 p.u. develops on the motor, this
phenomenon demonstrates once more, the induction generating mode of the primary air fan
motor driven by its load inertia [32]. Both the forced draught and primary air fan motors
14.8 15 15.2 15.4 15.6 15.8 16 16.2 16.4 16.6 16.8
0
2
4
6
8
(a)
Sta
tor
cu
rren
t (p
.u.)
14.8 15 15.2 15.4 15.6 15.8 16 16.2 16.4 16.6 16.8
0
5
10
(b)
To
rqu
e (
p.u
.)
14.8 15 15.2 15.4 15.6 15.8 16 16.2 16.4 16.6 16.8
-200
-100
0
100
200
(c)
Ro
tor
flu
x a
ng
le (
deg
)
Time (s)
14.89 s, 0.466 p.u.
15.02 s, 0.1329 p.u. 15.48 s, 0,6412 p.u.
16.19 s, 0.5961 p.u.
16.21 s, 6.56 p.u.
16.8 s, 0.454 p.u.
14.89 s, 0.85 p.u.
15 s, 0.215 p.u.15.47 s, -0.8518 p.u.
16.3 s, 7.062 p.u.
17 s, 0.8572 p.u.
14.91 s, 92.89 deg
15.32 s, 180 deg
15.32 s, -180 deg16.2 s, -141 deg
16.21 s, 154.4 deg
16.91 s, 94.29 deg16.32 s, 141 deg

90
subsequently exchange energy till time t = 16.19 s when the tie breaker closes as depicted in
Figure 5-21, current increases to a peak of 6.56 p.u. at time t = 16.21 s as a result of motor
shaft speed having been reduced to a much lower speed of 0.9039 p.u.
The much reduced speed results in an increase in slip which causes the rotor circuit
resistance to decrease [62]. The increase in current causes the motor to develop a peak torque
of 7.062 p.u. at time t = 16.3 s and accelerate the shaft speed to reach full speed. Figure 5-
21(c) depicts the speed response of the primary air fan reaching full speed of 0.9975 p.u. at
time t = 16.98 s as it was before the loss of power on service medium voltage board A [28].
The peak torque at time t = 16.2 s depicted in Figure 5-21(b) is as a result of system natural
frequency with which the load torque oscillates upon the loss of power to the machine,
depending on the angular position of the mechanical system when the alternate source is
connected; higher electromagnetic torque magnitude is produced when the two torques
initially act against each other [29]. The peak torque is also dependent on the magnitude and
phase angle of the bus residual voltage [11].
The residual rotor flux losses synchronism to the stator flux to which it was lagging 92.89o
before power was lost on service medium voltage board A, and slips 3 cycles during the time
when the machine is not connected to any power supply as depicted on Figure 5-21(c). The
loss of synchronism is as a result of the collapsed stator flux following stator current
dropping to zero upon the loss of power supply on the machine [62]. However when the
machine is reconnected after the residual voltage has dropped to 23.61%, phase change of
about 180o is notable as depicted in Figure 5-21(c); indicating 180o shaft twist as it develops
torque and accelerates the shaft speed following the reduced speed of 90.39% [62]. Both
stator and rotor fluxes synchronise with 94.29o phase difference soon after the load has been
transferred to the alternate service medium voltage board B.
5.6.3 Case study 3: Transfer of left hand forced and induced draught fans
In order to ensure boiler furnace draught pressure stability during the transfer of induced
draught fan motor when its power is interrupted, the corresponding forced draught fan power
supply should be disconnected momentarily at the same time when the induced draught fan
motor is not connected to any power supply; and reconnected simultaneously when the
induced draught is connected to the alternate power supply [35][36][38]. Reconfiguring the
loads in Figure 5-8 and Figure 5-9 to the configuration in Figure 5-22 and Figure 5-23
respectively achieves the objective, ensuring that failure of reticulation upstream equipment
result in loss of power supply to both induced and forced draught fans to prevent draught
pressure instability in the boiler furnace; after which both fans can be transferred

91
simultaneously to an alternate healthy power supply within 3 s before under voltage
protection timeout [80]. This case study therefore assesses the feasibility of transferring both
induced and forced draught fans to an alternate power supply on loss of main power supply.
M
SERVICE MV BOARD A SERVICE MV BOARD B
MAIN SOURCE A
4.0 kV, 50 Hz
Fault level – 217.4 MVA
x/r – 19.86
MB_VT ASB_VT
B
MAIN
BREAKER
A
MAIN
BREAKER
TIE BREAKER
Bus Transfer
System
Protection
Relay
A
Upstream
protection
Protection
Relay
B
Upstream
protection
MM M M MM M
MILL C EXTRACTION
PUMP
A
PRIMARY AIR
FAN L.H.
CIRCULATIN
G WATER
PUMP A
M
BOILER
CIRCULATING
PUMP
CIRCULATIN
G WATER
PUMP B
PRIMARY AIR
FAN R.H.
EXTRACTION
PUMP
B
MILL D
MAIN SOURCE B
4.0 kV, 50 Hz
Fault level – 180.0 MVA
x/r – 17.17
M
MILL A
M
MILL E
Figure 5-22: Proposed service medium voltage boards A and B load configuration
M
SERVICE MV BOARD C SERVICE MV BOARD D
MAIN SOURCE A
4.0 kV, 50 Hz
Fault level – 194.2 MVA
x/r – 24.27
MB_VT ASB_VT
B
MAIN
BREAKER
A
MAIN
BREAKER
TIE BREAKER
Bus Transfer
System
Protection
Relay
A
Upstream
protection
Protection
Relay
B
Upstream
protection
M M MM
MILL B FORCED
DRAUGHT
FAN L.H.
M
INDUCED
DRAUGHT
FAN L.H.
INDUCED
DRAUGHT
FAN R.H.
FORCED
DRAUGHT
FAN R.H.
MAIN SOURCE B
4.0 kV, 50 Hz
Fault level – 173.9 MVA
x/r – 18.95
MILL F
Figure 5-23: Proposed service medium voltage boards C and D load configuration
The power supply configuration and associated transfer system as is modelled in simulink to
simulate the performance of the three bus transfer schemes during transfer of both forced and
induced draught fan loads from service medium voltage board C to service medium voltage
board D when power supply is lost on service medium voltage board C is depicted in Figure
5-23. Once more, the loss of power on service medium voltage board C is assumed to have
92
been as a result of an inter-tripping signal received from an upstream protection scheme
following a transformer fault picked up by a differential protection relay element device
number 87 [82]. Tripping of both upstream and downstream ensures that the transformer is
isolated from the system [15]. The bus transfer scheme objective is therefore to transfer both
forced and induced draught fan motors to an alternate service medium voltage board D that
is supplied from main source ‘B’ to maintain process continuity by keeping both the forced
and induced draught fan motors running.
5.6.3.1 Fast bus transfer simulation results
As before, main sources ‘A’ and ‘B’ are in synchronism before power is lost on service
medium voltage board C; ‘A’ main breaker is initially closed at the beginning of the
simulation, tie breaker is open, and ‘B’ main breaker is closed, supplying service medium
voltage board B. The simulation is started a time t = 0 s when the motors are powered up
with their shafts coupled to their respective loads. The motors are then continuously loaded
in proportion to the square of their respective shaft speeds, until their respective torques
reach 0.8 p.u. and their respective full speeds. An inter-tripping signal from upstream
protection scheme is received at time t = 15 s when the motors are already running at full
speeds, initiating fast bus transfer scheme to supervise the transfer of both the forced and
induced draught fan motors from service medium voltage board C to service medium voltage
board D through the tie-breaker; all other motors on service medium voltage board C are
shed-off when power is lost. Shed-off motors are restored manually by the unit operator.
Table 5-1 in subsection 5.6.1.1 presents the applicable bus transfer settings.
Focus is put on analysing the response of the busbar voltage and busbar phase angle.
Furthermore, shaft speed, stator current, electromagnetic torque and rotor flux angle of the
induced draught fan is analysed during the transfer process because of it being the largest
motor amongst the group of motors being transferred to the alternate service medium voltage
board D.
5.6.3.1(a) Voltage, busbar phase angle and shaft speed response
Figure 5-24 depicts the response of busbar voltage, busbar phase angle and induced draught
fan shaft speed during the fast bus transfer of forced and induced draught fan motors from
service medium voltage board C to service medium voltage board D through the tie breaker.

93
Figure 5-24: Busbar voltage, bus phase angle and induced draught fan motor speed response during a fast
bus transfer of forced and induced draught fans motors to service medium voltage board B
The magnitude of voltage on service medium voltage board C drops from 1 p.u. from time t
= 15 s when power is lost on the board following a receipt of an inter-tripping signal on the
‘A’ main breaker to 0.886 p.u. at time t = 15.07 s as depicted in Figure 5-24(a). The
existence of bus decaying voltage on service medium voltage board C is again as a result of
the connected induced draught fan motor momentarily operating as an induction generator
with trapped residual flux that is driven by the fan load inertia, and supplying the forced
draught fan motor [32]. The initial volt drop to 0.933 p.u. at time t = 15 .01 s is as a result of
reversal of the voltage across the motor stator leakage inductance, thereafter the residual bus
voltage decays according to the machine open circuit time constant as the trapped flux in the
machine decays even further [25][59]. The transfer is successfully executed in 70 ms (3.5
cycles) upon the loss of power measured from time t = 15 s to time t = 15.07 s when voltage
is restored on service medium voltage board C, which is according to the acceptable transfer
time of fast transfer scheme [28][60]. The voltage recovers to 0.9709 p.u. at time t = 15.08 s
as a result of system impedance from main source ‘B’ and the added load on service medium
voltage board D.
The voltage phase angle between service medium voltage board C and service medium
voltage board D is observed to increase from 0o when the power to the machine is lost at
time t = 15 s to 8.318o at time t = 15.07 s when power to service medium voltage board C is
14.8 14.9 15 15.1 15.2 15.3 15.4 15.5
0.8
0.85
0.9
0.95
1
(a)
Vo
ltag
e (
p.u
.)
14.8 14.9 15 15.1 15.2 15.3 15.4 15.5
-5
0
5
10
(b)
Ph
ase a
ng
le (
deg
)
14.8 14.9 15 15.1 15.2 15.3 15.4 15.5
0.99
0.995
1
(c)
Sp
eed
(p
.u.)
Time (s)
14.9 s, 0.99 p.u.
15 s, 0.933 p.u.15.07 s, 0.886 p.u.
15.07 s, 0.9709 p.u.
15.4 s, 0.974 p.u.
14.9 s, -0.707 deg
15.01 s, 2.12 deg15.07 s, 8.318 deg 15.4 s, 0 deg
14.9 s, 0.9975 p.u.
15.07 s, 0.9923 p.u.
15.2 s, 0.999 p.u. 15.74 s, 0.9974 p.u.

94
restored as depicted in Figure 5-24(b). The sudden increase in relative phase angle between
service medium voltage board C and service medium voltage board D is also as a result of
the reversal of the voltage across the motor stator leakage inductance, which causes the
machine impedance to change as the machine slip changes, resulting in a sudden 2.116o
relative phase change at time t = 15 s as depicted in Figure 5-24(b) [60]. Further increase in
relative phase difference is observed as the machines lose speed. Figure 5-24(c) depicts the
shaft speed, which is easily restored to full speed after dropping to 0.9923 p.u. at time t =
15.07 s due to high load inertia constant, and the high-speed transfer of the motor bus to a
healthy alternate main source ‘B’ through service medium voltage board D [61].
5.6.3.1(b) Stator current, electromagnetic torque and rotor flux angle
Figure 5-25 depicts the response of stator current, electromagnetic torque and rotor flux
angle of induced draught fan motor during the fast bus transfer process of both forced and
induced draught fan motors from service medium voltage board C to service medium voltage
board D through the tie breaker.
Figure 5-25: Induced draught fan stator current, electromagnetic torque and rotor flux angle response
during fast bus transfer of forced and induced draught fan motors to service medium voltage board B
Stator current drops to 0 p.u. when the main source ‘A’ power supply is disconnected,
following the tripping of ‘A’ main breaker. This phenomenon causes the developed stator
14.8 14.9 15 15.1 15.2 15.3 15.4 15.5
0
0.5
1
1.5
(a)
Sta
tor
cu
rren
t (p
.u.)
14.8 14.9 15 15.1 15.2 15.3 15.4 15.5
-2
0
2
4
(b)
To
rqu
e (
p.u
.)
14.8 14.9 15 15.1 15.2 15.3 15.4 15.5
92
94
96
98
100
(c)
Ro
tor
flu
x a
ng
le (
deg
)
Time (s)
14.9 s, 0.5019 p.u.
15.07 s, 0.02218 p.u.
15.1 s, 1.175 p.u.
14.9 s, 0.8509 p.u.15.08 s, 3.389 p.u.
15.57 s, 0.8544 p.u.
15.48 s, 0.5349 p.u.
14.9 s, 93.46 deg
15.07 s, 100 deg
15.49 s, 95.01 deg

95
flux to collapse, which result in electromagnetic torque also dropping to zero as depicted in
Figure 5-25(a) and Figure 5-25(b) at time t = 15 s respectively [62].
When the tie breaker closes at time t = 15.07 s as depicted in Figure 5-25(a), current
increases to a peak of 1.175 p.u. at time t = 15.1 s as a result of the reduced motor shaft
speed of 0.9923 p.u.; resulting in an increase in slip that causes the rotor circuit resistance to
decrease [62]. The increase in current causes the motor to develop a peak torque of 3.289
p.u. at time t = 15.08 s and accelerate the shaft speed to reach 0.9974 p.u. speed as it was
before the loss of power on service medium voltage board C. The magnitude of the peak
torque at time t = 15.07s is as a result of system natural frequency with which the load torque
oscillates upon the loss of power to the machine, depending on the angular position of the
shaft when the alternate source is connected; higher electromagnetic torque magnitude is
produced when the two torques initially act against each other [29].
The residual rotor flux momentarily losses synchronism to the stator flux to which it was
lagging 93.46o before power was lost on service medium voltage board C at time t = 14.9 s
as depicted in Figure 5-25(c). The flux angle increased to 100o at time t = 15.09 s as depicted
in Figure 5-25(c). The loss of synchronism is as a result of collapse in stator flux upon the
loss of power supply to the machine [62]. However, the machine develops torque and
accelerates following the slight reduction in speed [62], both stator and rotor fluxes
synchronise and maintain 95.25o between them soon after the load on the busbar has been
transferred to the alternate service medium voltage board D through the tie breaker, ensuring
that the machine remain stable to support process continuity.
5.6.3.2 In-phase bus transfer simulation results
Simulation setup and configuration for the fast bus transfer scheme presented in subsection
5.6.1.1 is used to simulate in-phase bus transfer of both the forced and induced draught fan
motors from service medium voltage board C to service medium voltage board D. Table 5-2
in subsection 5.6.1.2 presents the applicable bus transfer settings.
5.6.3.2(a) Busbar voltage, busbar phase angle and shaft speed response
Figure 5-26 depicts the response of busbar voltage, busbar phase angle and induced draught
fan shaft speed during in-phase bus transfer of both the forced and induced draught fan
motors from service medium voltage board C to service medium voltage board D through
the tie breaker.

96
Figure 5-26: Busbar voltage, busbar phase angle and induced draught fan speed response during in-phase
bus transfer of forced and induced draught fan motors to service medium voltage board B
The magnitude of voltage on service medium voltage board C drops from 1 p.u. from time t
= 15 s when power is lost on the board following a receipt of an inter-tripping signal on the
‘A’ main breaker to 0.5226 p.u. at time t = 15.57 s as depicted in Figure 5-26(a). The
existence of decaying bus voltage on the service medium voltage board C is as a result of the
connected forced and induced draught fan motors. The induced draught fan motor
momentarily operate as an induction generator with trapped residual flux that is driven by
the induced draught fan load inertia, supplying the forced draught fan motor because of its
relative size to the forced draught fan. The initial volt drop to 0.9294 p.u. at time t = 15.01 s
is as a result of the reversal of the voltage across the motor stator leakage inductance,
thereafter the residual bus voltage decays according to the open circuit time constant of the
machines as the trapped flux decays [25][59]. The transfer is successfully executed in 680
ms (34 cycles) upon the loss of power measured from time t = 15 s to time t = 15.68 s when
voltage is restored on service medium voltage board C through the tie breaker, which is
according to the acceptable transfer time of in-phase bus transfer scheme [28][60]. The
voltage initially recovers to 0.9188 p.u. at time t = 15.68 s as a result of system impedance
from main source ‘B’ and the added load, but finally recovers to 0.9722 p.u. at time t = 16.2
s when the motor reaches full speed.
14.8 15 15.2 15.4 15.6 15.8 16 16.2 16.4
0.6
0.8
1
(a)
Vo
ltag
e (
p.u
.)
14.8 15 15.2 15.4 15.6 15.8 16 16.2 16.4
-200
0
200
400
(b)
Ph
ase a
ng
le (
deg
)
14.8 15 15.2 15.4 15.6 15.8 16 16.2 16.4 16.6
0.92
0.94
0.96
0.98
1
1.02
(c)
Sp
eed
(p
.u.)
Time (s)
14.89 s, 0.99 p.u.
15.01 s, 0.9294 p.u.
15.68 s, 0.9188 p.u. 15.57 s, 0.5226 p.u.
16.2 s, 0.9722 p.u.
14.9 s, -0.7074 deg
15.02 s, 2.557 deg
15.68 s, 359.2 deg
16.6 s, 0.9974 p.u.15.91 s, 1.008 p.u.
15.68 s, 0.9439 p.u.
14.89 s, 0.9975 p.u.

97
Relative phase angle between service medium voltage board C and service medium voltage
board D increases as an indication of loss of synchronism between service medium voltage
board A and service medium voltage board D. The phasor slips one full cycle of 360o
according to in-phase bus transfer method during the time when service medium voltage
board C is not connected to any power supply as depicted in Figure 5-26(b).
The sudden increase in relative phase angle between service medium voltage board C and
service medium voltage board D at time t = 15 s is again as a result of the reversal of the
voltage across the motor stator leakage inductance, which causes the machine impedance to
change as the machine slip changes, resulting in a sudden 2.56o relative phase change as
depicted in Figure 5-26(b) [60]. Further increase in relative phase difference is observed as
the machine losses speed. Figure 5-26(c) depicts the shaft speed, which is maintained above
0.9432 p.u. at time t = 15.68 s due to high load inertia and the relative high-speed transfer of
the motor bus to a healthy alternate service medium voltage board D through the tie breaker
[61]. The speed stabilises at 0.9974 p.u. at time t = 16.6 s.
5.6.3.2(b) Stator current, electromagnetic torque and rotor flux angle response
Figure 5-27 depicts the response of induced draught fan stator current, electromagnetic
torque and rotor flux angle during an in-phase bus transfer of both forced and induced
draught fan motors from service medium voltage board C to service medium voltage board
D through the tie breaker.

98
Figure 5-27: Induced draught fan motor stator current, electromagnetic torque and rotor flux angle
response during an in-phase bus transfer of induced draught fan motor to service medium voltage board B
Stator current momentarily stops flowing at time t = 15 s when the main source ‘A’ power
supply is disconnected, following the tripping of ‘A’ main breaker. This phenomenon causes
the developed stator flux to collapse, which results in electromagnetic torque also dropping
to zero as depicted in Figure 5-27(a) and Figure 5-27 (b) respectively at time t = 15 s [62],
after which the stator current begins to increase and reaches a peak of 0.2103 p.u. at time t =
15.4 s, while negative electromagnetic torque of 0.2894 p.u. develops on the motor, this
phenomenon demonstrates the induction generating mode of the induced draught fan motor
driven by its load inertia [32].
When the tie breaker closes at time t = 15.68 s, current increases to a peak of 3.281 p.u. at
time t = 15.78 s depicted in Figure 5-27(a). The reduced motor shaft speed of 0.9432 p.u.
leads to an increase in slip that causes the rotor circuit resistance to decrease [62]. The
increase in current causes the motor to develop torque with a peak of 6.195 p.u. at time t =
15.78 s and accelerate the shaft speed to reach 0.9974 p.u. full speed as it was before the loss
of power on service medium voltage board C. The magnitude of the initial peak torque at
time t = 15.68 s is as a result of system natural frequency with which the load torque
oscillates upon loss of power to the machine, depending on its angular position when the
alternate source is connected; higher electromagnetic torque magnitude is produced when the
two torques initially act against each other [29].
14.8 15 15.2 15.4 15.6 15.8 16 16.2 16.4 16.6 16.8
0
1
2
3
4
(a)
Sta
tor
cu
rren
t (p
.u.)
14.8 15 15.2 15.4 15.6 15.8 16 16.2 16.4 16.6 16.8
-2
0
2
4
6
8
(b)
To
rqu
e (
p.u
.)
14.8 15 15.2 15.4 15.6 15.8 16 16.2 16.4 16.6 16.8
-200
-100
0
100
200
(c)
Ro
tor
flu
x a
ng
le (
deg
)
Time (s)
14.9 s, 0.5012 p.u.
15.02 s, 0.1377 p.u.
15.4 s, 0.2103 p.u. 15.78 s, 3.281 p.u.
15.68 s, 0.2.73 p.u.16.94 s, 0.5043 p.u.
14.9 s, 0.8509 p.u.
15.48 s, -0.2894 p.u. 16.8 s, 0.8396 p.u.
15.75 s, 6.195 p.u.
14.9 s, 93.46 deg
15.323s, -180 deg
15.77 s, 132 deg16.8 s, 94.96 deg
15.33 s, 179.8 deg
99
The residual rotor flux losses synchronism to the stator flux to which it was lagging 93.46o
before power was lost on service medium voltage board C, and slip by 360o during the time
when the machine is not connected to any power supply as depicted in Figure 5-27(c). The
loss of synchronism is as a result of collapsed stator flux following stator current
momentarily dropping to zero upon the loss of power supply on the machine [62]. The
machine develops torque and accelerates soon after it has been transferred to the alternate
supply [62]. The stator and rotor fluxes synchronise with 94.96o phase difference soon after
both forced and induced draught fan motors have been transferred to the alternate supply
through service medium voltage board D; ensuring that the machine remain stable to support
process continuity.
5.6.3.3 Residual bus voltage transfer simulation results
Simulation setup and configuration for the fast bus transfer scheme presented in subsection
5.6.1.1 is used to simulate residual voltage bus transfer of the forced and induced draught fan
motors from service medium voltage board C to service medium voltage board D. Table 5-3
in subsection 5.6.1.3 presents the applicable bus transfer settings.
5.6.3.3(a) Voltage, busbar phase angle and shaft speed response
Figure 5-28 depicts the response of busbar voltage, busbar phase angle and shaft speed of the
induced draught fan motor during a residual voltage bus transfer of both the forced and
induced draught fan motors from service medium voltage board C to service medium voltage
board D through the tie breaker.

100
Figure 5-28: Busbar voltage, busbar phase angle and speed response during residual bus voltage transfer
of both forced and induced draught fan motors to service medium voltage board B
The magnitude of voltage on service medium voltage board C decays from 1 p.u. from time t
= 15 s when power is disconnected on the board following a receipt of an inter-tripping
signal on the ‘A’ main breaker to 0.2346 p.u. at time t = 16.46 s; as depicted in Figure 5-
28(a) according to the set point in Table 5-3. The existence of bus decaying voltage on
service medium voltage board C is again as a result of the forced and induced draught fan
motors connected on the board. The induced fan motor momentarily operate as an induction
generator with trapped residual flux that is driven by the induced draught fan load inertia,
and supply the forced draught fan motor because of its relative size to the forced draught fan.
The initial volt drop to 0.9294 p.u. at time t = 15.01 s is also as a result of the reversal of the
voltage across the motor stator leakage inductance as in the case of fast and in-phase bus
transfer schemes, thereafter the residual bus voltage decays according to the machine open
circuit time constant as the trapped flux in the machine decays [25][59]. The transfer is
successfully executed in 1646 ms (82.3 cycles) upon the loss of power, which is according to
the acceptable transfer time of residual bus voltage transfer scheme [28][60].
The phase angle between service medium voltage board C and service medium voltage D
slips 4 times between 0o and 360o from the time when the power to the machine is lost at
time t = 15 s according to the residual bus voltage transfer method as depicted in Figure 5-
28(b) [60]. Figure 5-28(c) depicts the shaft speed, which dropped to 0.8907 p.u. at time t =
15 15.5 16 16.5 17 17.5 18
0
0.5
1
(a)
Vo
ltag
e (
p.u
.)
15 15.5 16 16.5 17 17.5 18
-100
0
100
200
300
400
(b)
Ph
ase a
ng
le (
deg
)
15 15.5 16 16.5 17 17.5 18
0.8
0.9
1
(c)
Sp
eed
(p
.u.)
Time (s)
14.9 s, 0.999 p.u.
16.46 s, 0.2346 p.u.
16.47 s, 0.8512 p.u.
17.03 s, 0.9646 p.u.
17.5 s, 0.9739 p.u.
15.01 s, 0.9294 p.u.
14.9 s, -0.7063 deg
15.08 s, 359.6 deg
16.46 s, 96.43 deg
14.9 s, 0.9967 p.u.
16.46 s, 0.8907 p.u.
17.51 s, 0.9975 p.u.
16.96 s, 1.004 p.u.

101
16.46 s as the kinetic energy on the fan load reduced even more compared to both fast and
in-phase bus transfer processes; however the speed recovered to full speed after slightly
overshooting once the transfer process was completed.
5.6.3.3(b) Stator current, electromagnetic torque and rotor flux angle response
Figure 5-29 depicts the response of induced draught fan stator current, electromagnetic
torque and rotor flux angle during residual bus voltage transfer of both forced and induced
draught fan motors from service medium voltage board C to service medium voltage board
D through the tie breaker.
Figure 5-29: Induced draught fan motor stator current, electromagnetic torque and rotor flux angle
response on residual bus voltage transfer of forced and induced draught fan motors to service medium
voltage board B
Stator current drops to 0 p.u. at time t = 15 s when power supply is disconnected on service
medium voltage board C, following the tripping of ‘A’ main breaker. This phenomenon
causes the developed stator flux to also collapse, which result in electromagnetic torque
dropping to zero as depicted in Figure 5-29(a) and Figure 5-29(b) respectively [62], after
which the stator current begins to increase and reaches a peak of 0.194 p.u. at time t = 15.5 s,
while negative electromagnetic torque of 0.2924 p.u. develops on the motor, this
phenomenon demonstrates the induction generating mode of the induced draught fan motor
driven by its load inertia [32]. Both the forced and induced draught fan motors subsequently
15 15.5 16 16.5 17 17.5 18
0
2
4
6
(a)
Sta
tor
cu
rren
t (p
.u.)
15 15.5 16 16.5 17 17.5 18
-2
0
2
4
(b)
To
rqu
e (
p.u
.)
15 15.5 16 16.5 17 17.5 18
-200
-100
0
100
200
(c)
Ro
tor
flu
x a
ng
le (
deg
)
Time (s)
15.34 s, -178.9 deg
16.49 s, -178.9 deg
16.48 s, 179.9 deg
16.62 s, 159.1 deg
17.71 s, 94.04 deg
15.02 s, 0.0958 p.u.
14.9 s, 0.01938 p.u.
16.48 s, 5.458 p.u.
17.5 s, 0.4951 p.u.
14.9 s, 0.8509 p.u.
15 s, 0.0932 p.u.
15.46 s, -0.2924 p.u.
16.73 s, 4.064 p.u.
17.67 s, 0.8646 p.u.
15.33 s, 179.9 deg14.9 s, 93.46 deg
16.46 s, 0.3707 p.u.
14.9 s, 0.5019 p.u.
102
exchange energy till time t = 16.46 s when the tie breaker closes as depicted in Figure 5-
29(a), current increases to a peak of 5.458 p.u. at time t = 16.48 s as a result of motor shaft
speed having been reduced to a much lower speed of 0.8907 p.u.
The much reduced speed results in an increase in slip which causes the rotor circuit
resistance to decrease [62]. The increase in current causes the motor to develop a peak torque
of 4.064 p.u. at time t = 16.73 s and accelerate the shaft speed to reach full speed. Figure 5-
28(c) depicts the speed response of the induced draught fan reaching full speed of 0.9975
p.u. at time t = 17.51 s as it was before the loss of power on service medium voltage board C
[28]. The peak torque at time t = 16.48 s depicted in Figure 5-29(b) is as a result of system
natural frequency with which the load torque oscillates upon loss of power to the machine,
depending on the angular position of the mechanical system when the alternate source is
connected; higher electromagnetic torque magnitude is produced when the two torques
initially act against each other [29]. The peak torque is also dependent on the magnitude and
phase angle of the bus residual voltage [11].
The residual rotor flux losses synchronism to the stator flux to which it was lagging 93.46o
before power was lost on service medium voltage board C, and slips 4 cycles during the time
when the machine is not connected to any power supply as depicted on Figure 5-29(c). The
loss of synchronism is as a result of the collapsed stator flux following stator current
dropping to zero upon the loss of power supply on the machine [62]. However when the
machine is reconnected after the residual voltage has dropped to 23.46%, phase angle change
of about 180o is notable as depicted in Figure 5-29(c); indicating 180o shaft twist as it
develops torque and accelerates the shaft speed following the reduced speed of 89.07% [62].
Both stator and rotor fluxes synchronise with 95.04o phase difference soon after the load has
been transferred to the alternate service medium voltage board D.
5.6.4 Case study 4: Transfer of service medium voltage board C load to service
medium voltage board D
Power supply configuration and associated transfer system depicted in Figure 5-9 is
modelled in Simulink in order to simulate the bus transfer scheme performance during
transfer of all existing service medium voltage board C load to service medium voltage
board D when power supply is lost on service medium voltage board C. This case study is
considered to be the worst case since service medium voltage board D has the least fault
level of the four service medium voltage boards A, B, C and D. Furthermore the induced
draught fan motor is the only drive from service medium voltage board C that should be
immediately transferred in order to support boiler stability when the board lose power, and
103
not the entire board; provided draught pressure remain stable [7][75][76]. Therefore this
case study is only simulated to evaluate the performance of the three bus transfer schemes
when the board is heavily loaded and the capability of the reticulation system to accelerate
multiple motors simultaneously.
As in the previous case studies, the loss of power on service medium voltage board C is
assumed to have been as a result of an inter-tripping signal received from an upstream
protection scheme following a transformer fault picked up by a differential protection relay
element device number 87 [82], where tripping of both upstream and downstream ensures
that the transformer is isolated from the system [15]. The bus transfer scheme objective is
therefore to transfer the entire load on service medium voltage board C to an alternate
service medium voltage board D that is supplied from main source ‘B’ to maintain process
continuity by keeping all drives on both service medium voltage boards C and D powered up
as depicted in Figure 5-9.
5.6.4.1 Fast bus transfer simulation results
Main source ‘A’ and ‘B’ are in synchronism before power is lost on service medium voltage
board C; ‘A’ main breaker is initially closed at the beginning of the simulation, tie breaker is
open, and ‘B’ main breaker is closed and supplying service medium voltage board D. The
simulation is started a time t = 0 s when the motors are powered up with their shafts coupled
to their respective loads. Motors are loaded until their torques reach 0.8 p.u. respectively. An
inter-tripping signal from upstream protection scheme is received at time t = 15 s when the
motors are already running at their respective full speeds, initiating the fast bus transfer
scheme to supervise the transfer of the entire service medium voltage board C load to service
medium voltage board D through the tie-breaker. Table 5-1 in subsection 5.6.1.1 presents the
applicable bus transfer settings. Once more, focus is put on analysing the response of the
busbar voltage and busbar phase angle; and shaft speed, stator current, electromagnetic
torque and rotor flux angle of the induced draught fan motor.
5.6.4.1(a) Busbar voltage, busbar phase angle and induced draught fan shaft speed
response
Figure 5-30 depicts the response of busbar voltage, busbar phase angle and induced draught
fan shaft speed during the fast bus transfer of service medium voltage board C motors to
service medium voltage board D through the tie breaker.

104
Figure 5-30: Busbar voltage, bus phase angle and induced draught fan motor speed response during a fast
bus transfer of all service medium voltage board C motors to service medium voltage board D
The magnitude of voltage on service medium voltage board C drops from 1 p.u. from time t
= 15 s when power is lost on the board following a receipt of an inter-tripping signal on the
‘A’ main breaker to 0.8433 p.u. at time t = 15.07 s as depicted in Figure 5-30(a). The
existence of bus decaying voltage on service medium voltage board C is again as a result of
the connected motors, in particular the induced draught fan motor which momentarily
operate as an induction generator with trapped residual flux that is driven by the induced
draught fan load inertia, supplying the rest of the motors on the board [32]. The initial volt
drop to 0.9124 p.u. at time t = 15 s is as a result of the reversal of the voltage across the
motor stator leakage inductance, thereafter the residual bus voltage decays according to the
machine open circuit time constant as the trapped flux in the machine decays [25][59]. The
transfer is successfully executed in 70 ms (3.5 cycles) upon the loss of power supply
measured from time t = 15 s to time t = 15.07 s when voltage is restored on service medium
voltage board C, which is according to the acceptable transfer time of fast transfer scheme
[28][60]. The voltage initially recovers to 0.9650 p.u. at time t = 15.07 s as a result of system
impedance from main source ‘B’ coupled with reaccelerating motors. Busbar voltage
continues to recover until it reaches 0.9671 p.u. at time t = 15.5 s, which is relatively lower
than the voltage level prior to the transfer because of the increased load on the board.
14.8 14.9 15 15.1 15.2 15.3 15.4 15.5 15.6 15.7 15.8
0.8
0.9
1
(a)
Vo
ltag
e (
p.u
.)
14.8 14.9 15 15.1 15.2 15.3 15.4 15.5 15.6 15.7 15.8
-5
0
5
10
15
(b)
Ph
ase a
ng
le (
deg
)
14.8 14.9 15 15.1 15.2 15.3 15.4 15.5 15.6 15.7 15.8
0.985
0.99
0.995
1
1.005
(c)
Sp
eed
(p
.u.)
Time (s)
15 s, 0.9124 p.u.15.07 s, 0.8433 p.u.
15.07 s, 0.965 p.u.15.5 s, 0.9671 p.u.
14.9 s, -0.6801 deg
15 s, -2.093 deg
15.007 s, 13.6 deg15.5 s, 0 deg
14.9 s, 0.9975 p.u.
15.07 s, 0.99 p.u.
15.2 s, 1.001 p.u.
15.39 s, 0.9961 p.u.
15.79 s, 0.9974 p.u.
15.01 s, 2.64 deg
14.9 s, 0.999 p.u.

105
The voltage phase angle between service medium voltage board C and service medium
voltage board D is observed to increase from 0o when the power to the machine is lost at
time t = 15 s to 13.6o at time t = 15.07 s when power to service medium voltage board C is
restored as depicted in Figure 5-30(b). The sudden increase in relative phase angle between
service medium voltage board C and service medium voltage board D at time t = 15 s is also
as a result of the reversal of the voltage across the motor stator leakage inductance, which
causes the machine impedance to change as the machine slip changes; resulting in a sudden
2.64o relative phase change as depicted in Figure 5-30(b) [60]. Further increase in relative
phase difference is observed as the machines lose speed. Figure 5-30(c) depicts the shaft
speed, which is easily restored to full speed after dropping to 0.990 p.u. at time t = 15.07 s
due to high load inertia constant, and the high-speed transfer of the motor bus to a healthy
alternate main source ‘B’ through service medium voltage board D [61].
5.6.4.1(b) Stator current, electromagnetic torque and rotor flux angle
Figure 5-31 depicts the response of stator current, electromagnetic torque and rotor flux
angle of the induced draught fan during the transfer of service medium voltage board C
motors to service medium voltage board D through the tie breaker.
Figure 5-31: Induced draught motor stator current, electromagnetic torque and rotor flux angle response
during fast bus transfer of all service medium voltage board C motors to service medium voltage board D
14.8 15 15.2 15.4 15.6 15.8 16
0
0.5
1
1.5
2
(a)
Sta
tor
cu
rren
t (p
.u.)
14.8 15 15.2 15.4 15.6 15.8 16
-2
0
2
4
6
(b)
To
rqu
e (
p.u
.)
14.8 15 15.2 15.4 15.6 15.8 16
90
95
100
105
(c)
Ro
tor
flu
x a
ng
le (
deg
)
Time (s)
15.07 s, 0.2432 p.u.
15.09 s, 1.576 p.u.
15.31 s, 0.4144 p.u.
15.47 s, 0.5552 p.u.
15.94 s, 0.5549 p.u.
15.07 s, -0.4558 p.u.
15.08 s, 4.352 p.u.
15.45 s, 1.0 p.u. 15.93 s, 0.8527 p.u.
15.09 s, 102.5 deg
15.27 s, 92.77 deg
15.46 s, 95.89 deg
15.95 s, 95.07 deg
14.9 s, 0.8509 p.u.
14.9 s, 0.5019 p.u.
14.9 s, 93.45 deg
15 s, -0.1232 p.u.
15.03 s, 0.1108 p.u.

106
Stator current drops to 0 p.u. when the main source ‘A’ power supply is disconnected,
following the tripping of ‘A’ main breaker. This phenomenon causes the stator flux to
collapse, which result in electromagnetic torque also dropping to zero as depicted in Figure
5-31(a) and Figure 5-31(b) respectively at time t = 15 s [62], after which the stator current
begins to increase to 0.2432 p.u. peak at time t = 15.07 s, while negative electromagnetic
torque of 0.4558 p.u. develops on the motor, this phenomenon demonstrates the induction
generating mode of the induced draught fan motor driven by its load inertia [32].
When the tie breaker closes at time t = 15.07 s, the reduced motor shaft speed of 0.99 p.u.
causes current to increase to a peak of 1.576 p.u. at time t = 15.08 s as depicted in Figure 5-
30(c) and Figure 5-31(a) respectively; resulting in an increase in slip that causes the rotor
circuit resistance to decrease [62]. The increase in current causes the motor to develop a peak
torque of 3.965 at time t = 15.08 s and accelerate the shaft speed to reach 0.9975 p.u. full
speed as it was before the loss of power on service medium voltage board C. The magnitude
of the peak torque at time t = 15.08 s is as a result of system natural frequency with which
the load torque oscillates upon the loss of power to the machine, depending on angular
position of the shaft when the alternate source is connected; higher electromagnetic torque
magnitude is produced when the two torques initially act against each other [29].
The residual rotor flux momentarily losses synchronism to the stator flux to which it was
lagging 93.45o before power was lost on service medium voltage board C at time t = 14.9 s
as depicted in Figure 5-31(c), the flux angle increased to 102.5o at time t = 15.09 s. The loss
of synchronism is as a result of stator flux collapsing upon the loss of power supply on the
machine [62]. However, the machine develops torque and accelerates following the slight
reduction in speed [62], both stator and rotor fluxes synchronise and maintain 95.07o
between them soon after the load bus has been transferred to the alternate service medium
voltage board D through the tie breaker, ensuring that the machine(s) remain stable to
support process continuity; provided stable draught pressure is maintained during the transfer
process.
5.6.4.2 In-phase bus transfer simulation results
Simulation setup and configuration for the fast bus transfer scheme presented in subsection
5.6.1.1 is used again to simulate in-phase bus transfer of service medium voltage board C
motors to service medium voltage board D through the tie breaker. Table 5-2 in subsection
5.6.1.2 presents the applicable bus transfer settings.
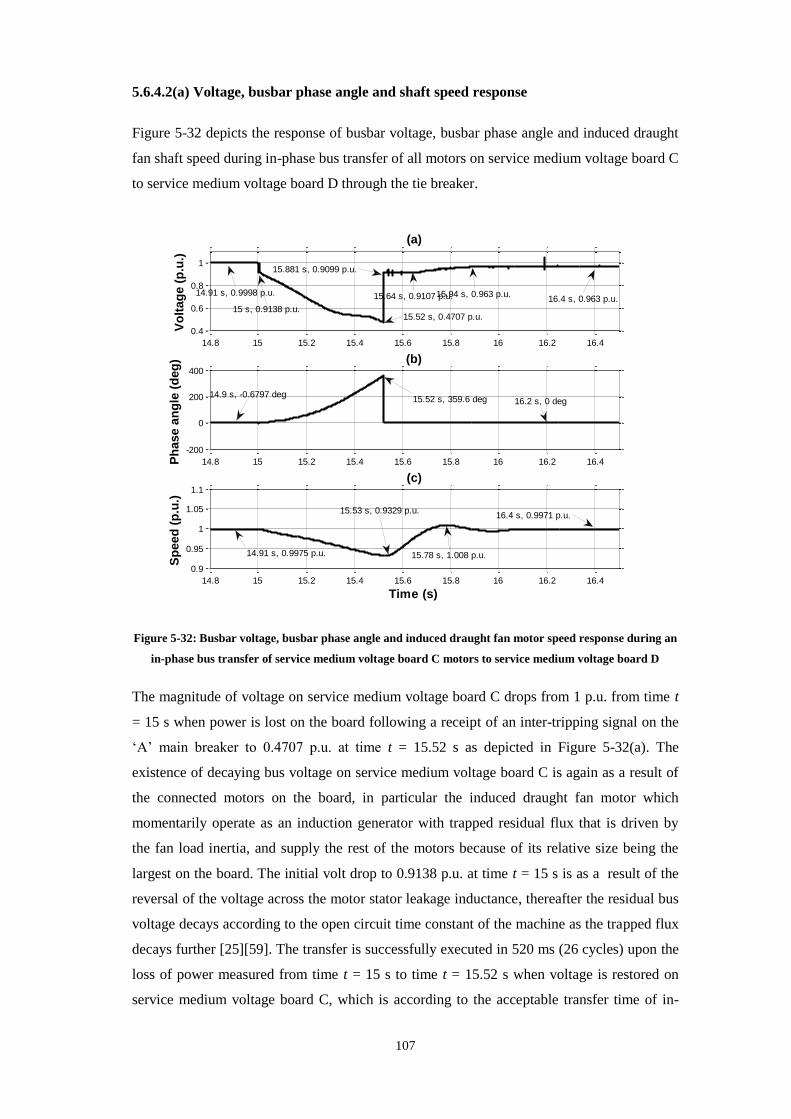
107
5.6.4.2(a) Voltage, busbar phase angle and shaft speed response
Figure 5-32 depicts the response of busbar voltage, busbar phase angle and induced draught
fan shaft speed during in-phase bus transfer of all motors on service medium voltage board C
to service medium voltage board D through the tie breaker.
Figure 5-32: Busbar voltage, busbar phase angle and induced draught fan motor speed response during an
in-phase bus transfer of service medium voltage board C motors to service medium voltage board D
The magnitude of voltage on service medium voltage board C drops from 1 p.u. from time t
= 15 s when power is lost on the board following a receipt of an inter-tripping signal on the
‘A’ main breaker to 0.4707 p.u. at time t = 15.52 s as depicted in Figure 5-32(a). The
existence of decaying bus voltage on service medium voltage board C is again as a result of
the connected motors on the board, in particular the induced draught fan motor which
momentarily operate as an induction generator with trapped residual flux that is driven by
the fan load inertia, and supply the rest of the motors because of its relative size being the
largest on the board. The initial volt drop to 0.9138 p.u. at time t = 15 s is as a result of the
reversal of the voltage across the motor stator leakage inductance, thereafter the residual bus
voltage decays according to the open circuit time constant of the machine as the trapped flux
decays further [25][59]. The transfer is successfully executed in 520 ms (26 cycles) upon the
loss of power measured from time t = 15 s to time t = 15.52 s when voltage is restored on
service medium voltage board C, which is according to the acceptable transfer time of in-
14.8 15 15.2 15.4 15.6 15.8 16 16.2 16.4
0.4
0.6
0.8
1
(a)
Vo
ltag
e (
p.u
.)
14.8 15 15.2 15.4 15.6 15.8 16 16.2 16.4
-200
0
200
400
(b)
Ph
ase a
ng
le (
deg
)
14.8 15 15.2 15.4 15.6 15.8 16 16.2 16.4
0.9
0.95
1
1.05
1.1
(c)
Sp
eed
(p
.u.)
Time (s)
15 s, 0.9138 p.u.15.52 s, 0.4707 p.u.
15.881 s, 0.9099 p.u.
15.94 s, 0.963 p.u.16.4 s, 0.963 p.u.15.64 s, 0.9107 p.u.
14.9 s, -0.6797 deg15.52 s, 359.6 deg 16.2 s, 0 deg
14.91 s, 0.9975 p.u.
15.53 s, 0.9329 p.u.
15.78 s, 1.008 p.u.
16.4 s, 0.9971 p.u.
14.91 s, 0.9998 p.u.

108
phase bus transfer scheme [28][60]. The voltage initially recovers to 0.9099 p.u. at time t =
15.88 s as a result of system impedance from main source ‘B’ and the added load on service
medium voltage board D, but finally recovers to 0.963 p.u. at time t = 16.4 s when the
induced draught fan motor reaches 0.9971 p.u. speed at time t = 16.4 s.
Relative phase angle between service medium voltage board C and service medium voltage
board D increases as an indication of loss of synchronism between service medium voltage
board C and service medium voltage board D. The phasor slips one full cycle of 360o
according to in-phase bus transfer method during the time when service medium voltage
board C is not connected to any power supply as depicted in Figure 5-32(b).
The sudden increase in relative phase angle between service medium voltage board C and
service medium voltage board D is again as a result of the reversal of the voltage across the
motor stator leakage inductance, which causes the machine impedance to change as the
machine slip changes, resulting in a sudden 2.707o relative phase change at time t = 15 s as
depicted in Figure 5-32(b) [60]. Further increase in relative phase difference is observed as
the machine losses speed. Figure 5-32(c) depicts the shaft speed, which is maintained above
0.9329 p.u. at time t = 15.53 s due to high load inertia and the relative high-speed transfer of
the motor bus to a healthy alternate service medium voltage board D through the tie breaker
[61]. The speed stabilises at 0.9971 p.u. at time t = 16.4 s.
5.6.4.2(b) Stator current, electromagnetic torque and rotor flux angle response
Figure 5-33 depicts the response of stator current, electromagnetic torque and rotor flux
angle during an in-phase bus transfer of service medium voltage board C motors to service
medium voltage board D through the tie breaker.
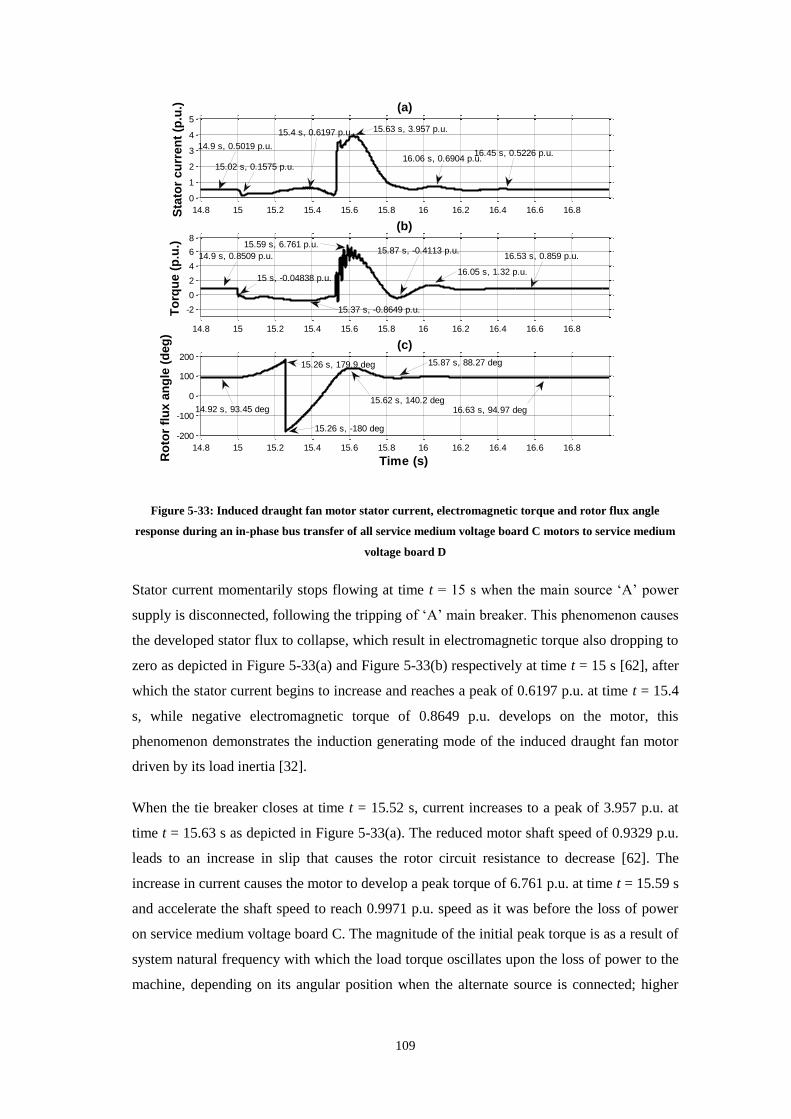
109
Figure 5-33: Induced draught fan motor stator current, electromagnetic torque and rotor flux angle
response during an in-phase bus transfer of all service medium voltage board C motors to service medium
voltage board D
Stator current momentarily stops flowing at time t = 15 s when the main source ‘A’ power
supply is disconnected, following the tripping of ‘A’ main breaker. This phenomenon causes
the developed stator flux to collapse, which result in electromagnetic torque also dropping to
zero as depicted in Figure 5-33(a) and Figure 5-33(b) respectively at time t = 15 s [62], after
which the stator current begins to increase and reaches a peak of 0.6197 p.u. at time t = 15.4
s, while negative electromagnetic torque of 0.8649 p.u. develops on the motor, this
phenomenon demonstrates the induction generating mode of the induced draught fan motor
driven by its load inertia [32].
When the tie breaker closes at time t = 15.52 s, current increases to a peak of 3.957 p.u. at
time t = 15.63 s as depicted in Figure 5-33(a). The reduced motor shaft speed of 0.9329 p.u.
leads to an increase in slip that causes the rotor circuit resistance to decrease [62]. The
increase in current causes the motor to develop a peak torque of 6.761 p.u. at time t = 15.59 s
and accelerate the shaft speed to reach 0.9971 p.u. speed as it was before the loss of power
on service medium voltage board C. The magnitude of the initial peak torque is as a result of
system natural frequency with which the load torque oscillates upon the loss of power to the
machine, depending on its angular position when the alternate source is connected; higher
14.8 15 15.2 15.4 15.6 15.8 16 16.2 16.4 16.6 16.8
0
1
2
3
4
5
(a)
Sta
tor
cu
rren
t (p
.u.)
14.8 15 15.2 15.4 15.6 15.8 16 16.2 16.4 16.6 16.8
-2
0
2
4
6
8
(b)
To
rqu
e (
p.u
.)
14.8 15 15.2 15.4 15.6 15.8 16 16.2 16.4 16.6 16.8
-200
-100
0
100
200
(c)
Ro
tor
flu
x a
ng
le (
deg
)
Time (s)
15.02 s, 0.1575 p.u.
15.4 s, 0.6197 p.u. 15.63 s, 3.957 p.u.
16.06 s, 0.6904 p.u.16.45 s, 0.5226 p.u.
14.9 s, 0.8509 p.u.
15 s, -0.04838 p.u.
15.37 s, -0.8649 p.u.
15.59 s, 6.761 p.u.15.87 s, -0.4113 p.u.
16.05 s, 1.32 p.u.
14.92 s, 93.45 deg
15.26 s, -180 deg
15.26 s, 179.9 deg
15.62 s, 140.2 deg
15.87 s, 88.27 deg
16.63 s, 94.97 deg
16.53 s, 0.859 p.u.
14.9 s, 0.5019 p.u.

110
electromagnetic torque magnitude is produced when the two torques initially act against each
other [29].
The residual rotor flux losses synchronism to the stator flux to which it was lagging 93.45o
before power was lost on service medium voltage board C, and slip by 360o during the time
when service medium voltage board C is not connected to any power supply as depicted in
Figure 5-33(c). The loss of synchronism is as a result of the collapse in stator flux following
stator current momentarily dropping to zero upon the loss of power supply on the machine
[62]. The machine develops torque and accelerates soon after it has been transferred to the
alternate supply together with the rest of motors [62]. The stator and rotor fluxes synchronise
with 94.97o phase difference soon after service medium voltage board C motors have been
transferred to the alternate supply through service medium voltage board D; ensuring that the
machine remain stable to support process continuity.
5.6.4.3 Residual bus voltage transfer simulation results
Simulation setup and configuration for the fast bus transfer scheme presented in subsection
5.6.1.1 is used to simulate residual voltage bus transfer of service medium voltage board C
motors to service medium voltage board D. Table 5-3 in subsection 5.6.1.3 presents the
applicable bus transfer settings.
5.6.4.3(a) Voltage, busbar phase angle and shaft speed response
Figure 5-34 depicts the response of busbar voltage, busbar phase angle and shaft speed of the
induced draught fan motor during a residual bus voltage transfer of all motors on service
medium voltage board C to service medium voltage board D through the tie breaker.

111
Figure 5-34: Busbar voltage, busbar phase angle and speed response during residual bus voltage transfer
service medium voltage board C motors to service medium voltage board D
The magnitude of voltage on service medium voltage board C decays from 1 p.u. from time t
= 15 s when power is disconnected on the board following a receipt of an inter-tripping
signal on the ‘A’ main breaker to 0.25 p.u. at time t = 15.84 s; as depicted in Figure 5-34(a)
according to the set point in Table 5-3. The existence of decaying bus voltage on service
medium voltage board C is again as a result of the connected motors, in particular the
induced draught fan motor which momentarily operate as an induction generator with
trapped residual flux that is driven by the fan load inertia; and supplying the rest of the
motors because of its large size relative to the rest of the motors on the board. The initial volt
drop to 0.9177 p.u. at time t = 15 s is also as a result of the reversal of the voltage across the
motor stator leakage inductance as in the case fast and in-phase transfer schemes, thereafter
the residual bus voltage decays according to the machine open circuit time constant as the
trapped flux in the machine decays further [25][59]. The transfer is successfully executed in
840 ms (42 cycles) upon the loss of power supply, which is in line with the acceptable
transfer time of residual bus voltage transfer scheme [28][60].
The phase angle between service medium voltage board C and service medium voltage
board D slips 2 times between 0o and 360o from the time when the power to the machine is
lost at time t = 15 s according to the residual bus voltage transfer method as depicted in
Figure 5-34(b) [60]. Figure 5-34(c) depicts the shaft speed, which dropped to 0.8911 p.u. at
14.8 15 15.2 15.4 15.6 15.8 16 16.2 16.4 16.6 16.8
0.2
0.4
0.6
0.8
1
(a)
Vo
ltag
e (
p.u
.)
14.8 15 15.2 15.4 15.6 15.8 16 16.2 16.4 16.6 16.8
-200
0
200
400
(b)
Ph
ase a
ng
le (
deg
)
14.8 15 15.2 15.4 15.6 15.8 16 16.2 16.4 16.6 16.8
0.9
1
1.1
(c)
Sp
eed
(p
.u.)
Time (s)
15.86 s, 0.8122 p.u.
15.84 s, 0.25 p.u.
16.9 s, 0.9707 p.u.
14.9 s, -0.6796 deg
15.52 s, 359.6 deg 15.84 s, 173.1 deg
16.8 s, 0 deg
14.91 s, 0.9975 p.u.16.8 s, 0.9977 p.u.
16.46 s, 0.9614 p.u.
15.9 s, 0.8911 p.u.
15.84 s, 0.9578 p.u.15 s, 0.9177 p.u.
14.91 s, 0.9998 p.u.

112
time t = 15.9 s as the kinetic energy on the fan load reduced even more compared to both fast
and in-phase bus transfer cases; however the speed recovered to full speed after slightly
overshooting once the transfer process was completed.
5.6.4.3(b) Stator current, electromagnetic torque and rotor flux angle response
Figure 5-35 depicts the response of stator current, electromagnetic torque and rotor flux
angle during residual bus voltage transfer of all service medium voltage board C motors to
service medium voltage board D through the tie breaker.
Figure 5-35: Induced draught motor stator current, electromagnetic torque and rotor flux angle response
during residual bus voltage transfer of forced and induced draught fan motors
Stator current drops to 0 p.u. at time t = 15 s when power supply is disconnected on service
medium voltage board C, following the tripping of ‘A’ main breaker. This phenomenon
causes the developed stator flux to also collapse, which result in electromagnetic torque also
dropping to zero as depicted in Figure 5-35(a) and Figure 5-35(b) respectively [62], after
which the stator current begins to increase and reaches a peak of 0.6045 p.u. at time t = 15.37
s, while negative electromagnetic torque of 0.8402 p.u. develops on the motor, this
phenomenon demonstrates the induction generating mode of the induced draught fan motor
driven by its load inertia [32]. The motors subsequently exchange energy till time t = 15.84 s
when the tie breaker closes as depicted in Figure 5-35(a), current increases to a peak of 7.909
14.8 15 15.2 15.4 15.6 15.8 16 16.2 16.4 16.6 16.8
0
5
10
(a)
Sta
tor
cu
rren
t (p
.u.)
14.8 15 15.2 15.4 15.6 15.8 16 16.2 16.4 16.6 16.8
-5
0
5
10
(b)
To
rqu
e (
p.u
.)
14.8 15 15.2 15.4 15.6 15.8 16 16.2 16.4 16.6 16.8
-200
0
200
(c)
Ro
tor
flu
x a
ng
le (
deg
)
Time (s)
14.9 s, 0.5019 p.u.
15.03 s, 0.1132 p.u.
15.37 s, 0.6045 p.u.
15.84 s, 0.5884 p.u.
15.87 s, 7.909 p.u.
16.6 s, 0.6326 p.u.
16.71 s, 0.5459 p.u.
15 s, 0.04319 p.u.
15.39 s, -0.8402 p.u. 16.43 s, -0.0227 p.u.
15.85 s, -90.24 deg 16.8 s, 94.48 deg
15.95 s, 4.955 p.u.
16.91 s, 0.8505 p.u.
15.26 s, 180 deg
15.26 s, -180 deg
14.91 s, 93.45 deg
15.99 s, 165.7 deg

113
p.u. at time t = 15.87 s as a result of motor shaft speed having been reduced to 0.8911 p.u.
The reduced speed results in an increase in slip which causes the rotor circuit resistance to
decrease [62].
The increase in current then causes the motor to develop a peak torque of 4.955 p.u. at time t
= 15.95 s and accelerate the shaft speed to reach 0.9975 p.u. speed. Figure 5-35(c) depicts
the speed response of the induced draught fan motor shaft reaching full speed of 0.9975 p.u.
at time t = 16.8 s as it was before the loss of power on service medium voltage board C [28].
The peak torque at time t = 15.84 s depicted in Figure 5-35(b) is as a result of system natural
frequency with which the load torque oscillates upon the loss of power to the machine,
depending on the angular position of the mechanical system when the alternate source is
connected; higher electromagnetic torque magnitude is produced when the two torques
initially act against each other [29]. The peak torque is also dependent on the magnitude and
phase angle of the bus residual voltage [11].
The residual rotor flux losses synchronism to the stator flux to which it was lagging 93.45o
before power was lost on service medium voltage board C, and slips 2 cycles during the time
when the machine is not connected to any power supply as depicted on Figure 5-35(c). The
loss of synchronism is as a result of the collapsed stator flux following stator current
dropping to zero upon the loss of power supply on the machine [62]. However when the
machine is reconnected after the residual voltage has dropped to 25% it develops torque and
accelerates the shaft speed following the reduced speed of 0.8911 p.u. [62]. Both stator and
rotor fluxes synchronise with 94.48o phase difference soon after the load has been transferred
to the alternate service medium voltage board D.

114
5.7 Discussion
Four case studies of different load sizes and fault levels have been simulated using fast, in-
phase and residual bus voltage transfer schemes for each case study. In each case, one of
service medium voltage board A, B, C or D with the least fault level was selected to
represent the healthy alternative board in order to test the worst possible case scenario with
regards to impact of motor reacceleration on the system.
5.7.1 Transfer of left hand induced draught fan
Figure 5-36 present the results of simulated busbar voltage magnitudes, shaft speed, stator
current and electromagnetic torque response of induced draught fan motor being transferred
from service medium voltage board C upon the loss of power supply; to an alternate service
medium voltage board D.
Figure 5-36: Bus transfer results of induced draught fan from service medium voltage board C to service
medium voltage board D
The magnitudes of minimum voltages and speeds recorded during the simulation of fast, in-
phase and residual bus voltage transfers are as expected given the characteristics of the
respective bus transfer schemes; with fast and residual bus voltage transfers recording the
highest and lowest minimum magnitudes for busbar voltage and shaft speed respectively.
Fast bus transfer recorded the lowest peak accelerating current, while residual bus voltage
transfer scheme recorded the highest peak accelerating current of 9.053 p.u. The recorded
peak accelerating torque during the fast bus transfer at 3.449 p.u. is the lowest of the three
transfer scheme processes, while in-phase bus transfer is the highest at 6.676 p.u. Therefore,
fast bus transfer scheme exhibited best performance during the transfer of induced draught
0.000
1.000
2.000
3.000
4.000
5.000
6.000
7.000
8.000
9.000
10.000
Minimum VoltageRecorded
Minimum SpeedRecorded
Peak AcceleratingCurrent
Peak AcceleratingTorque
Mag
nit
ud
e [
p.u
.]
Fast Transfer Scheme In-phase Transfer Scheme Residual Transfer Scheme

115
fan motor from service medium voltage board C to service medium voltage board D. In all
bus transfer cases, reacceleration of motors require incoming circuit breaker over-current
protection settings to be adjusted appropriately to allow motor reacceleration accordingly
[83][85], which should be a consideration for the transfer schemes. However this scenario
does not guarantee stable furnace draught pressure during the transfer as a result of the
forced draught fan that remains running since it is supplied from a different board, this is
regardless of the simulation results indicating that the busbar voltage magnitude remained
well above the under voltage recommended settings of 70% for 3 seconds [80][84].
Therefore transfer of induced draught fan motor in this scenario is not recommended.
5.7.2 Transfer of left hand forced draught and primary air fans
Figure 5-37 presents the results of simulated busbar voltage, shaft speed, stator current and
electromagnetic torque response of primary air fan motor during the transfer of forced
draught and primary air fan motors from service medium voltage board A upon the loss of
power supply; to an alternate service medium voltage board B.
Figure 5-37: Bus transfer results of forced draught and primary air fans from service medium voltage
board A to service medium voltage board B
The magnitudes of minimum voltages and speeds recorded during simulation of fast, in-
phase and residual bus voltage transfers are as expected given the characteristics of the
respective bus transfer schemes; with fast and residual bus voltage transfers recording the
highest and lowest minimum magnitudes for busbar voltage and shaft speed respectively.
Fast bus transfer recorded the lowest peak accelerating current, while residual bus voltage
transfer scheme recorded the highest peak accelerating current of 6.560 p.u. The recorded
0.000
1.000
2.000
3.000
4.000
5.000
6.000
7.000
8.000
Minimum VoltageRecorded
Minimum SpeedRecorded
Peak AcceleratingCurrent
Peak AcceleratingTorque
Mag
nit
ud
e [
p.u
.]
Fast Transfer Scheme In-phase Transfer Scheme Residual Transfer Scheme
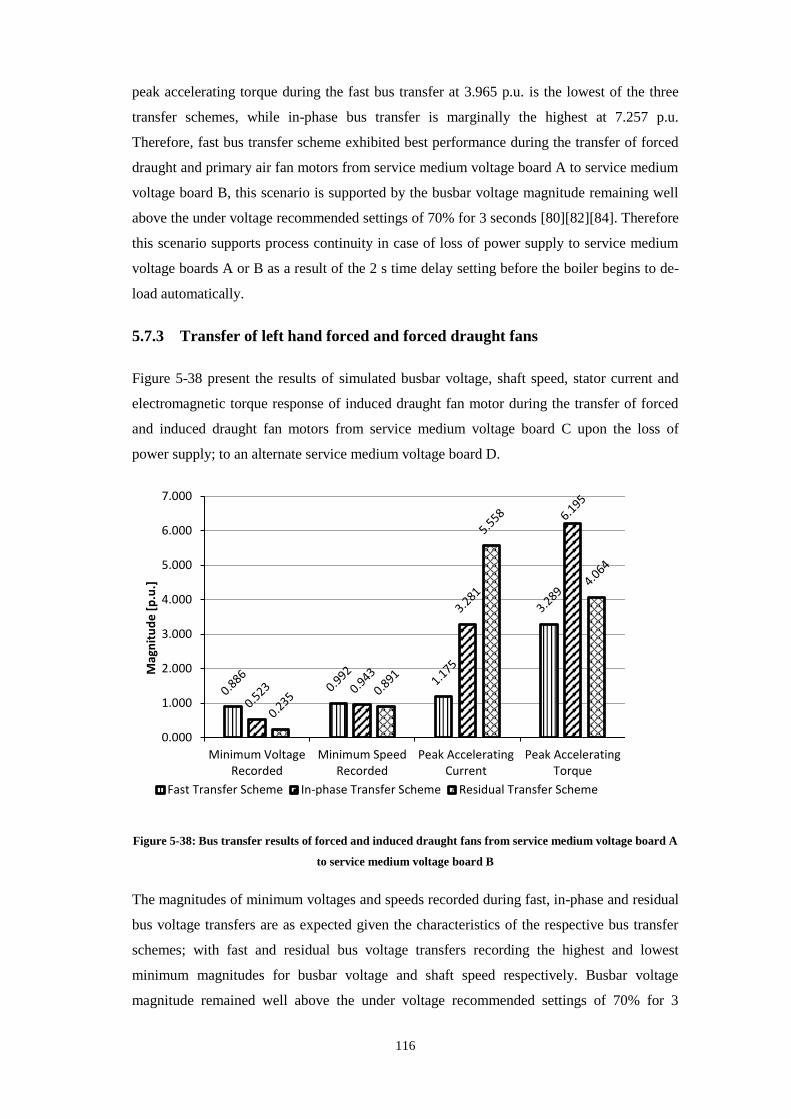
116
peak accelerating torque during the fast bus transfer at 3.965 p.u. is the lowest of the three
transfer schemes, while in-phase bus transfer is marginally the highest at 7.257 p.u.
Therefore, fast bus transfer scheme exhibited best performance during the transfer of forced
draught and primary air fan motors from service medium voltage board A to service medium
voltage board B, this scenario is supported by the busbar voltage magnitude remaining well
above the under voltage recommended settings of 70% for 3 seconds [80][82][84]. Therefore
this scenario supports process continuity in case of loss of power supply to service medium
voltage boards A or B as a result of the 2 s time delay setting before the boiler begins to de-
load automatically.
5.7.3 Transfer of left hand forced and forced draught fans
Figure 5-38 present the results of simulated busbar voltage, shaft speed, stator current and
electromagnetic torque response of induced draught fan motor during the transfer of forced
and induced draught fan motors from service medium voltage board C upon the loss of
power supply; to an alternate service medium voltage board D.
Figure 5-38: Bus transfer results of forced and induced draught fans from service medium voltage board A
to service medium voltage board B
The magnitudes of minimum voltages and speeds recorded during fast, in-phase and residual
bus voltage transfers are as expected given the characteristics of the respective bus transfer
schemes; with fast and residual bus voltage transfers recording the highest and lowest
minimum magnitudes for busbar voltage and shaft speed respectively. Busbar voltage
magnitude remained well above the under voltage recommended settings of 70% for 3
0.000
1.000
2.000
3.000
4.000
5.000
6.000
7.000
Minimum VoltageRecorded
Minimum SpeedRecorded
Peak AcceleratingCurrent
Peak AcceleratingTorque
Mag
nit
ud
e [
p.u
.]
Fast Transfer Scheme In-phase Transfer Scheme Residual Transfer Scheme
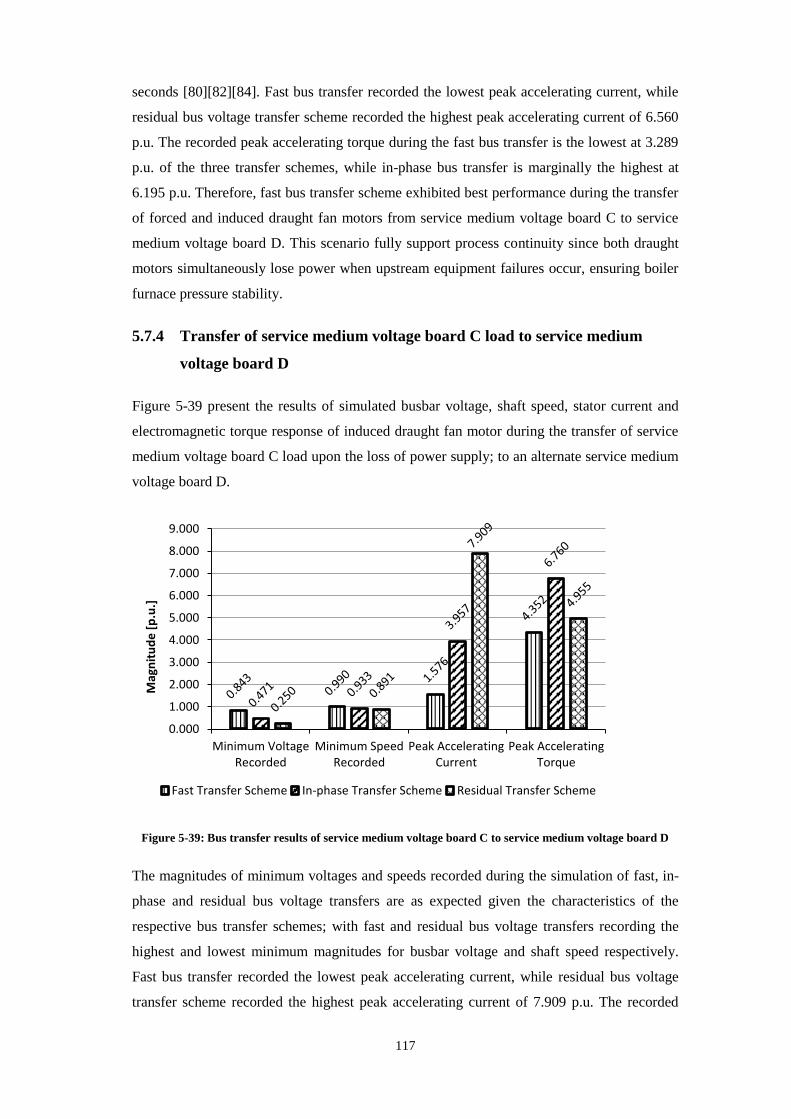
117
seconds [80][82][84]. Fast bus transfer recorded the lowest peak accelerating current, while
residual bus voltage transfer scheme recorded the highest peak accelerating current of 6.560
p.u. The recorded peak accelerating torque during the fast bus transfer is the lowest at 3.289
p.u. of the three transfer schemes, while in-phase bus transfer is marginally the highest at
6.195 p.u. Therefore, fast bus transfer scheme exhibited best performance during the transfer
of forced and induced draught fan motors from service medium voltage board C to service
medium voltage board D. This scenario fully support process continuity since both draught
motors simultaneously lose power when upstream equipment failures occur, ensuring boiler
furnace pressure stability.
5.7.4 Transfer of service medium voltage board C load to service medium
voltage board D
Figure 5-39 present the results of simulated busbar voltage, shaft speed, stator current and
electromagnetic torque response of induced draught fan motor during the transfer of service
medium voltage board C load upon the loss of power supply; to an alternate service medium
voltage board D.
Figure 5-39: Bus transfer results of service medium voltage board C to service medium voltage board D
The magnitudes of minimum voltages and speeds recorded during the simulation of fast, in-
phase and residual bus voltage transfers are as expected given the characteristics of the
respective bus transfer schemes; with fast and residual bus voltage transfers recording the
highest and lowest minimum magnitudes for busbar voltage and shaft speed respectively.
Fast bus transfer recorded the lowest peak accelerating current, while residual bus voltage
transfer scheme recorded the highest peak accelerating current of 7.909 p.u. The recorded
0.000
1.000
2.000
3.000
4.000
5.000
6.000
7.000
8.000
9.000
Minimum VoltageRecorded
Minimum SpeedRecorded
Peak AcceleratingCurrent
Peak AcceleratingTorque
Mag
nit
ud
e [
p.u
.]
Fast Transfer Scheme In-phase Transfer Scheme Residual Transfer Scheme

118
peak accelerating torque during the fast bus transfer at 4.352 p.u. is the lowest of the three
transfer schemes, while in-phase bus transfer is the highest at 6.760 p.u. Therefore, fast bus
transfer scheme exhibited best performance during the transfer of service medium voltage
board C load to service medium voltage board D. Similarly to case study 1, this scenario
does not guarantee stable furnace draught pressure during the as a result of the forced
draught fan that remains running since it is supplied from a different board, this is regardless
of the simulation results indicating that the busbar voltage magnitude remained well above
the under voltage recommended settings of 70% for 3 seconds as in case study 1 [80][84].
Therefore transfer of induced draught fan motor in this scenario is not recommended.
However it demonstrates the ability of the reticulation system to reaccelerate the drives
simultaneously.
5.8 Conclusion
The simulated unit auxiliary electrical reticulation demonstrated to have enough capability in
so far as reaccelerating service medium voltage board motors as depicted in Figure 5-8 and
Figure 5-9 during the respective bus transfer processes, in particular the draught system
motors. In all four case studies, busbar voltage magnitude remained well above the under
voltage recommended settings of 70% for 3 seconds.
Even though satisfactory results were obtained for in-phase and residual bus voltage transfer
schemes, each application of the two respective schemes should be assessed to verify its
suitability since both transfer schemes have the potential to produce high torque magnitudes
that can be harmful for the motors and the driven loads in the long run. Furthermore,
multiple motor reaccelerating simultaneously require incoming circuit breaker over-current
protection settings to be adjusted appropriately to allow simultaneous group of motor
reacceleration, which should be a consideration for the two in-phase and residual voltage bus
transfer schemes.
The possibility of a sudden rise or reduction of boiler furnace pressure to the respective
block test capabilities of the fans is a critical factor which can cause the boiler protection
system to trip a corresponding draught fan motor when one of the induced or forced draught
fans motor momentarily losses power during the bus transfer period to an alternate healthy
board. This phenomenon may occur as a result of motor under voltage trip delay of 3 s
programmed on the under voltage protection element ANSI device number 27 when the
incomer circuit breaker is tripped by an upstream protection through an inter-tripping signal
in order to isolate a faulty section of the reticulation. Case study 3, in particular fast transfer;

119
demonstrated satisfactory results during the transfer of both the induced and forced draught
fan motors simultaneously as depicted on the proposed reticulation layout on Figure 5-23.

120
CHAPTER 6 - CONCLUSIONS
6.1 Introduction
Fast, in-phase and residual voltage bus transfer schemes have been successfully modelled in
Matlab Simulink. Simulated performance results of the respective transfer schemes are well
within the recommended maximum transfer times. Bus transfer case studies have been
performed on the existing unit auxiliary power reticulation of a power generating plant to
assess the impact of the respective transfer methods on the electrical system, as well as the
associated mechanical process. In particular the research work focused on boiler furnace
draught system; comprising two sets of forced and induced draught fans. The feasibility of
using a bus transfer system to stabilise power when the main power supply failure occurs as
a result of upstream equipment failure has been investigated in so far as ensuring stable
boiler furnace pressure during the transfer process.
6.2 Case study 1: Transfer of induced draught fan motor
Load transfer of induced fan motor has been successfully executed using the three respective
bus transfer schemes in the event that failure of upstream equipment occurs. Fast bus transfer
in particular, exhibited the shortest transfer dead-time and the lowest motor shaft speed
reduction during the transfer; of which amongst other factors determines the peak
accelerating transient current and torque. The ability of the transfer scheme to close the
alternate supply incomer breaker when both the alternate and residual bus voltage supplies
are close to synchronism and before the residual bus voltage can decay significantly; is a
distinct factor that ensures that both accelerating current and torque remain low. In-phase bus
transfer scheme however, exhibited significant motor shaft speed reduction during the
transfer process when compared to the fast bus transfer scheme even though both transfer
methods have synchronous transfer characteristic. The significant shaft speed reduction
caused relatively high accelerating transient current and torque as a result of the much
reduced motor slip, which reduces the effective rotor resistance. Residual voltage transfer
scheme exhibited the highest motor shaft speed reduction and the highest accelerating
transient current and torque. The dependence of residual voltage bus transfer scheme on
voltage magnitude as the only input parameter often result in > 1 p.u. voltage applied on the
motor terminals during the bus transfer execution process, which worsen the current drawn
by the motor at the time of reacceleration.
However, momentary disconnection of power supply on the induced draught fan motor
creates a possibility of high furnace pressure limit being exceeded during the transfer to an
alternate supply as a result of the corresponding forced draught fan that remains running;

121
since it is supplied from a different board. Therefore the transfer of induced draught motor
only is not recommended even though the transfer can be successfully executed on the
electrical system, since the boiler may still trip on high furnace pressure to prevent furnace
explosion; especially when the transfer scheme fails to execute as a result of circuit breaker
failure.
6.3 Case study 2: Transfer of forced draught and primary air fan motors
Load transfer of both forced draught and primary air fan motors has been successfully
executed using the three respective bus transfer schemes in the event that failure of upstream
equipment occurs as in the case of induced draught fan motor. Amongst the three schemes,
fast bus transfer exhibited best performance with regards to minimum shaft speed reduction
during the transfer, lowest peak accelerating transient current and torque as in case study 1
for the respective fan motors. The transfer speed of the fast bus transfer scheme makes it
possible to synchronise the alternate supply to the residual bus voltage with minimum impact
on the electrical system, even though the primary air fan motor is supplying the forced
draught fan motor as an induction generator during the transfer, which causes the residual
bus voltage magnitude to decay at a higher rate while the associated phase shift also moves
much faster from synchronism compared to single motor transfer. In-phase bus transfer
scheme however, exhibited significant motor shaft speed reduction during the transfer
process when compared to the fast bus transfer scheme even though both transfer methods
have synchronous transfer characteristic. The significant shaft speed reduction result in
relatively high accelerating transient current and torque because of the much reduced motor
slip as in case study 1, and therefore its impact on the effective rotor resistance. Once more,
residual voltage transfer scheme exhibited the highest motor shaft speed reduction and the
highest accelerating transient current and torque. Similarly to case study 1, the dependence
of residual voltage bus transfer scheme on voltage magnitude as the only input parameter
often result in > 1 p.u. voltage applied on the motor terminals during the bus transfer
execution process, which worsen the current drawn by the two motors when they
reaccelerate simultaneously.
The transfer of forced draught and primary air fan motors is achievable because loss of
forced draught motor fan does not result in immediate tripping of the corresponding induced
draught fan motor, but would cause automatic de-loading of the generating unit after 2 s; of
which the time is sufficient for the transfer to be executed in order to support process
continuity.

122
6.4 Case study 3: Transfer of forced and induced draught fan motors
The case study investigated the feasibility of eliminating the possibility of furnace explosion
during the transfer of induced draught fan motor when upstream equipment failures occur,
which is achieved by disconnecting power to the forced draught fan motor to ensure that
furnace pressure remains stable. The unit auxiliary power reticulation was reconfigured such
that both corresponding forced and induced draught fan motors are supplied from a common
power supply to ensure that loss of power as a result of upstream equipment failures would
result in both the fan motors losing power, thereby ensuring that the boiler furnace pressure
remains stable.
In this case study, load transfer of both forced and induced draught fan motors was
successfully executed using the three respective bus transfer schemes when failure of
upstream equipment occurs as in case studies 1 and 2. Again, fast bus transfer exhibited best
performance with regards to minimum shaft speed reduction during the transfer, lowest peak
accelerating transient current and torque as in case studies 1 and 2 for the respective fan
motors. The transfer speed of the fast bus transfer scheme makes it possible to synchronise
the alternate supply to the residual bus voltage with minimum impact on the electrical
system, even though the induced fan motor is supplying the forced draught fan motor as an
induction generator during the transfer, which causes the residual bus voltage magnitude to
decay at a higher rate while the associated phase shift also moves much faster away from
synchronism compared to single motor transfer. In-phase bus transfer scheme however,
exhibited significant motor shaft speed reduction during the transfer process when compared
to the fast bus transfer scheme even though both transfer methods have synchronous transfer
characteristic, while residual voltage transfer scheme exhibited the highest motor shaft speed
reduction and the highest accelerating transient current and torque.
Therefore, the transfer of forced and induced draught fan motors is achievable to support
process continuity because failure of power supply affects both the fan motors
simultaneously ensuring stable boiler furnace pressure as a result of the fail-safe
characteristic design of the electrical reticulation; after which both forced and induced
draught fans motors reaccelerates simultaneously to maintain process continuity upon
transfer of power supply. The new reticulation configuration allows the bus transfer to be
executed within 3 s before the under voltage protection times-out, however only 2 s transfer
window is allowable before the unit begins to de-load; of which the transfer schemes are
capable to execute within the 2 s time frame.

123
6.5 Case study 4: Transfer of service medium voltage board C load to board D
Load transfer of service medium voltage board C to board D was performed to assess the
capability of the electrical system in so far as simultaneous reacceleration of multiple motors
is concerned. The results demonstrated that the system has sufficient capacity to reaccelerate
multiple motors simultaneously. As in the previous case studies, the residual voltage bus
transfer process exhibited the highest accelerating transient current during the transfer
process. The main disadvantage relating to high transient current is the associated voltage
drop on the board, and the possible tripping of incomer circuit breaker on the board as a
result of high current drawn by the respective motors during the reacceleration process.
Therefore residual voltage bus transfer scheme should be implemented with a load shedding
scheme of non-priority drives during the transfer process.
6.6 Recommendations
6.6.1 Application of bus transfer system
Closed transition bus transfer is recommended for use to maintain stable power supply
whenever the reticulation is being restored to normal configuration after open transition
transfer had executed. This approach prevents motor reacceleration that could result when
open transition bus transfer is used, however higher fault levels momentarily exist at the
busbar during the time when the two supplies are paralleled. It is therefore of paramount
importance that the reticulation protection and control system is designed to detect circuit
breaker failure and trip incoming alternate supply breaker to prevent prolonged
paralleling of supplies.
Open transition bus transfer system is recommended for stabilising power supply when
the main supply has failed as a result of upstream equipment failure. The open transfer
characteristic of the scheme ensures that the healthy alternative supply is not paralleled to
the main supply, which could otherwise result in alternate supply feeding onto the fault
when the main supply circuit breaker has failed to open. Furthermore, the application of
sequential transfer mode on main-tie-main reticulation as in the case of furnace boiler
draught system presented in case studies 1 through 4, ensures that the healthy boards is
not at risk of feeding onto a fault, which could compromise the remaining draught
subsystem. The use ‘open’ contact ‘52a’ or ‘not closed’ contact ‘52b’ can be employed to
block the tie circuit breaker to close if the main supply circuit breaker remains closed.

124
Simultaneous bus transfer mode is recommended for low inertia loads, main-tie
reticulation configuration supplying to one mechanical system with no process
redundancy, and where the reticulation can tolerate abnormal and fault conditions
momentarily. Therefore this method of transfer is not recommended in power plants
where the design configuration of the mechanical process comprise left and right draught
subsystems supplied from two different boards because failure of main supply circuit
breaker during the transfer process places a risk on subsystems which were originally not
affected by the loss of power, which could result in complete loss of both the subsystems;
and thereby losing the complete draught system causing the unit to trip.
Fast bus transfer is recommended over in-phase and residual voltage bus transfer
processes for its shorter dead-time, which result in low shaft speed reduction during the
transfer process. The advantage of low motor shaft speed reduction during the transfer
process is the associated low accelerating transient current and torque, which minimises
the impact on the electrical system; as well as prevents damage to the motor and the
driven load, and therefore prevent process disruption. Furthermore, it is recommended for
the in-phase bus transfer scheme to be configured as a back-up transfer scheme to the fast
bus transfer scheme because of its ability to transfer load at the first point of synchronism
even if the initial phase angle was outside the limit for fast bus transfer execution.
6.6.2 Future research work
The following future research work is proposed:
a) Real time modelling and simulation of the respective bus transfer schemes using RTDS
system or similar in order to gain practical insight on the functionality of the schemes
and the impact the respective transfer schemes have on the electrical system;
consideration of using IEC 61850 substation communication language as a means of
signal exchange between the bus transfer devices is recommended in order to derive its
benefits.
b) Development of a dynamic load shedding scheme that is dependent on the instantaneous
state of the system at the time of transfer execution. The load shedding scheme should
integrate optimised protection settings and associated interlocking systems to cater for
the respective bus transfer processes.
c) Investigate methods of improving the busbar residual voltage profile with reference to
reducing the rate of both magnitude and frequency decay on low inertia loads to enable
load transfers with minimum impact on motors, process and electrical reticulation.

125
d) Investigate the impact of abnormal and fault conditions on the electrical system as a
result of main circuit breaker failure to open during a simultaneous bus transfer process,
and the impact it has on mechanical process.

126
REFERENCES
[1] D.A. Dewison, “on Electrical supplies to power station auxiliaries (December 1959)”,
Proceedings of the IEEE - Part A: Power Engineering, Volume: 106, Issue: 30, pp 451
– 469
[2] F. H. Hollister, “on Auxiliary Drive for Steam Power Stations A Review of the
Characteristics and Economics of Steam and Electric Drive for Steam Power Station
Auxiliaries (June 1932)”, Transactions of the American Institute of Electrical
Engineers, Volume: 51, Issue, pp 329 - 330
[3] I. Kuzle, D. Bošnjak, H. Pandži, “Auxiliary System Load Schemes in Large Thermal
and Nuclear Power Plants”, Proceedings of the 8th International Conference on
Nuclear Option in Countries with Small and Medium Electricity Grids Dubrovnik,
Croatia, 16-20 May 2010
[4] WM. R. Brownlee and J. A. Elzi, “on Electric drives for steam-electric generating-
station auxiliaries (Nov. 1945)”, Electrical Engineering, Volume: 64, Issue: 11, pp 741
– 745
[5] R.M. Damar and J.P. Henschel, “on An Auxiliary Power System for a 500 TO
600MW Coal Power Plant (November 1981)”, IEEE Transactions on Power
Apparatus and Systems, Volume: PAS-100, Issue: 11, pp 4571 – 4577
[6] A. Raje, A. Raje and A. Chaudhary, “Fast Bus Transfer Systems – A System Solution
Approach”, NPSC, IIT Bombay, December 2008
[7] J.W. Gosling and D.F. Hunt, “Tutuka power station information manual – Auxiliary
electrical system”, Eskom Generation Group, March 1982
[8] J. Buchta, “Transient states simulation in power plant auxiliary electrical system”,
IEEE Electrical Power & Energy Conference, Halifax, NS, Canada, Aug. 2010
[9] J. Buchta, M. Pawlik and R. Szubert, “Simulation of auxiliary electrical system
working conditions during power plant transition to house load operation”, IEEE
Energy Conversion Congress and Exposition, Atlanta, GA, USA, November 2010
[10] S. Sato, M. Matsuda, T. Hashimoto, Y. Wakabayashi and A Hashimoto, “on Design
Features and Commissioning of the 700 MW Coal-Fired Boiler at the Tsurunga
Thermal Power Station No. 2” (October 2001)”, Mitsubishi Heavy Industries, Ltd,
Technical Review Volume 38 No.3, pp 106 - 110

127
[11] R.D. Pettigrew et al. (October 1993), “on Motor bus transfer”, IEEE Transactions on
Power Delivery, Volume: 8, Issue: 4, pp. 1747 – 1758.
[12] T. S. Sidhu, V. Balamourougan, M. Thakur, and B. Kasztenny, “A Modern Automatic
Bus Transfer Scheme”, IJCAS, vol. 3, No. 2 (special edition), pp. 376-385, June 2005
[13] T. R. Beckwith and C. J. Mozina “Motor Bus Transfer System Performance Testing
and the Search for a New Transfer Success Criterion”, PCIC, Houston, TX, USA,
October 2015
[14] Theodore Wildi, “Three-phase Induction Motors,” in Electrical Machines, Drives, and
Power Systems, 5th Edition, Upper Saddle River, New Jersey Columbus, Ohio,
Prentice Hall, 2002
[15] R. H. Daugherty (August 1982), “on Analysis of Transient Electrical Torques and
Shaft Toruqes in Induction Motors as a Result of Power Supply Disturbances”, IEEE
Transactions on Power Apparatus and Systems, Volume: PAS-101, Issue: 8, pp. 2826
– 2836
[16] Y. Akiyama, “Induction Motor Residual Voltage”, Industry Applications Society
Annual Meeting, October 1990
[17] C. C. Young and J. Dunki-Jacobs (1961) , “ on The concept of in-phase transfer
applied to industrial systems serving essential service motors”, Transactions of the
American Institute of Electrical Engineers, Part II: Applications and Industry,
Volume: 79, Issue: 6, pp. 508-518
[18] S. Kucuk and M. Sarihan, “Comparison and Simulation of Automatic Load Transfer
of Critical Industrial Electrical Systems”, ICEEE, Ankara, Turkey, April 2017
[19] A. Raje, A. Raje and J. Mccall, and A. Chaudhary, (January/February 2003), “On Bus
Transfer Systems: Requirements, Implementation, and Experiences”, IEEE
Transactions on Industry Applications, Volume: 39, 1, Pp. 34 – 44.
[20] G. Hunswadkar and N.R. Viju, “Considerations and Methods for an Effective Fast
Bus Transfer System”, PSPA, New Deli, India, December 2010
[21] T.W. Zhao, C. Mouton and L. Sevov , “on Accurate Performance of Residual Voltage
Transfer Schemes (Jan.-Feb. 2016)”, IEEE Transactions on Industry Applications,
Volume: 52 , Issue: 1, pp 653 – 660
[22] A. P. Gabba and J. D. Hill, “on Make Automatic Power Source Transfers a Success
for Your Plant (March/April 2001)”, IEEE Transactions on Industry Applications,
Vol. 37, No. 2, pp 423 – 433

128
[23] N. Fischer, B. K. Johnson, J. D. Law and A. G. Miles, “Induction motor modeling for
development of a secure in-phase motor bus transfer scheme”, IEMDC, Miami, FL,
USA, May 2017
[24] D. L. Hornak and D. W. Zipse, “Automated bus transfer control for critical industrial
processes (Sep/Oct 1991)”, IEEE Transactions on Industry Applications, Volume: 27,
Issue: 5, pp 862 – 871
[25] M. A. Zamani, M. R. D. Zadeh and T. S. Sidhu, “on A Compensated DFT-Based
Phase-Angle Estimation for Fast Motor-Bus Transfer Applications (November 2014)”,
IEEE Transactions on Energy Conversion, Volume: 30, Issue: 2, pp. 569 – 577
[26] D. G. Lewis and W. D. Marsh, “Transfer of Steam-Electric Generating-Station
Auxiliary Busses (January 1955)”, AIEE, Power Apparatus and Systems, Volume: 74,
Issue: 3, pp 322 – 334
[27] P. L. Ratnani and A. G. Thosar, “Mathematical Modelling of an 3 Phase Induction
Motor Using MATLAB/Simulink (June. 2014)”, IJMER, Volume 4, Issue 6, pp 62-67
[28] G. T. Orr, S. Cooper, C. J. Mozina, "High-speed transfer of two 4 KV motor bus
sources using a digital motor bus transfer system”, I&CPS, Tallahassee, FL, USA,
June 2010
[29] D.J. Hansen, C. R. Bell, G. W. Yerger, K. E. Shuman, “4160 Volt Bus Transfer
System Re-Design at Reliant Energy's Cheswick Generating Station”, ACPRE, Texas,
USA, March 2007
[30] R.H. Daugherty, “Bus transfer of AC induction motors, a perspective”, Petroleum and
Chemical Industry Conference, San Diego, CA, USA, Sept. 1989
[31] A. Wang, Z. Ling and W. Liu, “Residual Voltages Analysis in Reclosing Process for
Induction Machine”, World Congress on Intelligent Control and Automation,
Chongqing, China, June 25 - 27, 2008
[32] Y. Akiyama and Y. Niwa, “Multi induction motor connected network residual voltage
and it's back power”, ECCE, San Jose, CA, USA, Sept. 2009
[33] T. Kataoka, H. Uchida, T. Kai and T. Funabashi, “A method for aggregation of a
group of induction motor loads”, ICPST, Perth, WA, Australia, Australia, Dec. 2000
[34] P. Piromthum and A. Kunakorn, “A study of starting current due to a group of
induction motors using an aggregation model”, PEDS, Singapore, November. 2003
[35] Boiler Plant Manual, Eskom, Generation Skills Delivery, 2013

129
[36] D. Dave et al., “Dynamic simulation studies for boiler draft (July 2017)”, Elsevier
Science, Applied Thermal Engineering, Volume 121, pp 255-293
[37] P. Tanwar and B.S. Tanwar, “on Boiler Furnace Pressure Excursion and Set Points
(2010)”, International Journal of Computer Applications (0975 – 8887), Volume 1 –
No. 12, pp 14 – 16
[38] Boiler and Combustion Systems Hazards Code, NFPA 85, 2015
[39] Functional safety of electrical/electronic/programmable electronic safety-related
systems, IEC 61508, 2010
[40] Functional safety - Safety instrumented systems for the process industry sector, IEC
61511, 2003
[41] P.C. Krause, O. Wasyynczuk, and S.D. Sudhoff, Analysis of Electric Machinery,
IEEE Press, 2002
[42] N. Mohan, T.M. Undeland, and W.P. Robbins, Power Electronics: Converters,
Applications, and Design, John Wiley & Sons, Inc., New York, 1995
[43] R. J. Lee, P. Pillay and R. G. Harley, “D, Q Reference Frames for the Simulation of
Induction Motors (April 1984)”, Elsevier Science, Electric Power Systems Research,
Volume 85, issue 8, p 15-26
[44] P. Muralimanohar et. al., “Implementation of a microprocessor-based motor bus
transfer scheme”, PCIC, Philadelphia, PA, USA, October 2016
[45] T. Aboul-Seoud and J. Jatskevich, “Dynamic Modelling of Induction Motor loads for
Transient Voltage Stability Studies”, EPEC, Canada, Oct. 2008
[46] H.C. Stanley, “An Analysis of the Induction Motor (December 1938)”, IEEE,
Electrical Engineering, Volume: 57, Issue: 12, pp 751 – 757
[47] S. Zhang, C. Zhao and W. Tan, “The Study of Residual Voltage of Induction Motor
and the Influence of Various Parameters on the Residual Voltage”, ACPEE, Shanghai,
China, March 2017
[48] M. Toman, R. Cipin and M. Mach, “Application of acceleration method for evaluation
of induction motor torque-speed characteristics”, EEEIC / I&CPS, Milan, Italy, June
2017
[49] Short circuit currents in three phase AC systems, Examples for the calculation of short
circuit currents, IEC, 60909-4, 2001.
130
[50] G. W. Bottrell and L. Y. Yu, “on Motor Behavior through Power System Disturbances
(September 1980)”, IEEE Transactions on Industry Applications, Volume IA-16,
Issue: 5, pp 600 – 605
[51] A. Karakas, and F. Li, S. Adhikari, “Aggregation of multiple induction motors using
MATLAB-based software package”, IEEE/PES Power Systems Conference and
Exposition, Seattle, WA, USA, March 2009
[52] K. E. Yeager, “Bus transfer of multiple induction motor loads in a 400 megawatt fossil
power plant (September 1988)”, IEEE Transactions on Energy Conversion, Volume:
3, Issue: 3, pp 451 - 457
[53] R. H. PARK, “Two Reaction Theory of Synchronous Machines Generalized Method
of Analysis”, AIEE, New York, January 1929
[54] A. Ukil, V. H Shah and B. Deck, “Fast computation of arctangent functions for
embedded applications: A comparative analysis”, ISIE, Gdansk, Poland, August 2011
[55] S. S. Mulukutla, E. M. Gulachenski, “A critical survey of considerations in
maintaining process continuity during voltage dips while protecting motors with
reclosing and bus-transfer practices (Aug 1992)”, IEEE Transactions on Power
Systems, Volume: 7, Issue: 3, pp 1299 – 1305
[56] Y. Guo, X. Chen and T. Zhang, “Robust phase unwrapping algorithm based on least
squares (December 2014)”, Optics and Lasers in Engineering, Volume 63, Pages 25-
29
[57] T. Petković, TPribanić and M. Đonliće, “Temporal phase unwrapping using
orthographic projection (March 2017)”, Optics and Lasers in Engineering, Volume 90,
Pages 34-47
[58] J. Xu, D. An, X. Huang, K and Ji, “A fast minimum discontinuity based phase
unwrapping method”, APSAR, Singapore, September 2015
[59] M.R. Iravani at al, “Modelling and Analysis Guidelines for Slow Transients (October
1995)”, IEEE Transactions on Power Delivery. Vol. 10, pp 1950 - 1955
[60] C. V. Watters, “A Simplified Procedure for Determining the Auxiliary Bus Voltage
and Angle During Bus Transfer (June 1981)”, IEEE Transactions on Power Apparatus
and Systems, Vol. PAS-100, pp 3066-3076
[61] M. Yalla, “Design of a High-Speed Motor Bus Transfer System (February 2010)”,
IEEE Transactions on Industry Applications, Volume: 46, Issue: 2, pp 612 – 619
131
[62] J. C. Das, “Effects of momentary voltage dips on the operation of induction and
synchronous motors (July/August 1990)”, IEEE Transactions on Industry
Applications, Volume: 26, Issue: 4, pp 711-718
[63] L. Sevov, U. Khan and Z. Zhang, “Enhancing Power Transformer Differential
Protection to Improve Security and Dependability (May-June 2017)”, IEEE
Transactions on Industry Applications, Volume: 53, Issue: 3, pp 2642 – 2649
[64] Y. Akiyama, “Induction motor residual voltage”, Industry Applications Society
Annual Meeting, Seattle, WA, USA, August 2002
[65] A. R. Kelly, “Induction-motor model for industrial power system computations (July
1962)”, Transactions of the AIEE, Part II: Applications and Industry, Volume: 81,
Issue: 3, pp 166 - 172
[66] N.M.B. Abdel-Rahim and A. Shaltout, “Torsional vibration control of large induction
motors using constant air gap flux scheme (August 2012)”, IET Electric Power
Applications, Volume: 6, Issue: 8, pp 545 – 552
[67] Standard for Rotating Electrical Machines - Part 1: Rating and Performance,
IEC60034-1, 2010
[68] P. Smit and G. Coetzee, "Power station electrical plant-auxiliary power system
training manual," Eskom Generation Group, 2008
[69] H.J. Holley, T.A. Higgins, P.L. Young and W.L. Snider, “on A comparison of
induction motor models for bus transfer studies (Jun 1990)”, IEEE Transactions on
Energy Conversion, Volume: 5, Issue: 2, pp 310 – 319
[70] E.L. Averill, “on Fast transfer test of power station auxiliaries (May 1977)”, IEEE
Transactions on Power Apparatus and Systems, Volume: 96, Issue: 3, pp 1004 – 1009
[71] L. Sevov, D. Allcock, R. Luna and J. Bowen, “Motor reacceleration to improve
process uptime”, PCIC, Toronto, ON, Canada, November 2011
[72] J. Dang, D. Liu, X Qi and Y. Liu, “Discussion of Auxiliary Power Transfer”,
IEEE/PES Transmission & Distribution Conference & Exposition: Asia and Pacific,
Dalian, China, December 2005
[73] J. Buchta and M. Pawlik, “Electrical drives in high-efficient coal-fired power plants”,
International Symposium on Power Electronics, Electrical Drives, Automation and
Motion, Ischia, Italy, June 2008
[74] P. Smit and G. Coetzee, "Electrical machines training manual," Eskom Generation
Group, 2008

132
[75] J.W. Gosling, “Lethabo power station information manual – Auxiliary electrical
system”, Eskom Generation Group, March 1983
[76] G.M. Ramos, “Kendal power station information manual – Auxiliary electrical
system”, Eskom Generation Group, March 1988
[77] G. Hou, P. Jiang, X. Z. and J. Zhang, “Modelling and simulation for boiler combustion
control system of 1000MW ultra-supercritical unit”, CCDC, Changsha, China, July
2014
[78] P. Subha Hency Jims et al 2017 IOP Conf. Ser.: Mater. Sci. Eng. 247 012006
[79] Standard for Draught Plant Protection Functions, Eskom, 240-89217730
[80] Undervoltage Protection Standard, Eskom standard 240-56361454, 2013
[81] V. Balamourougan, T. S. Sidhu, B. Kasztenny, and M. M. Thakur (June 2006) “on
Robust Technique for Fast and Safe Transfer of Power Plant Auxiliaries”, IEEE
Transactions on Energy Conversion, Volume: 21, Issue: 2, pp. 541 – 551.
[82] IEEE Standard 37-2, 2008, “IEEE Standard for Electrical Power System Device
Function umbers, Acronyms, and Contact Designations” Published by the Institute of
Electrical and Electronic Engineers Inc. NY, 2008.
[83] Medium voltage and low voltage protection Standard, Eskom standard 240-56357424,
2017
[84] IEEE Guide for AC Motor Protection, IEEE standard C37.96, 2012
[85] R. E. Cossé, Jr., J. E. Bowen and S. H. Kerr, “on Secondary Selective System
Residual Bus Transfer—A Modern Application Approach (January/February 2005)”,
IEEE Transactions on Industry Applications, Volume: 41, No. 1, pp. 112 – 119