local bus market study - kpmg · pdf filelocal bus market study report to the department for...
TRANSCRIPT
Local Bus Market
Study
Report to the Department for Transport
January 2016
www.kpmg.com/uk

Contents
Abstract 1
1 Executive summary 3
1.1 Introduction 3
1.2 Context 3
1.3 Local bus market trends 4
1.4 Rationale for government intervention in the market 6
1.5 Government influence over the local bus market 8
1.6 Developing the case to intervene in the market 10
1.7 Final thoughts 12
2 This report 13
2.1 Objectives 13
2.2 Approach 13
3 Market overview 15
3.1 Background 15
3.2 Current market structure 17
3.3 Market trends 18
3.4 Geographical variation in demand 35
3.5 Stakeholder perspectives 42
3.6 Summary and discussion 54
4 Rationale for government intervention 56
4.1 Introduction 56
4.2 Stakeholder needs and objectives 56
4.3 Market imperfections 59
4.4 Prevalence of market imperfections 60
4.5 Summary and discussion 62
5 Government influence over the bus market 64
5.1 Introduction 64
5.2 Bus service attributes 64
5.3 Government policy levers 67
5.4 Influence of government policies on local bus services 69
5.5 Stakeholder perspectives 75
5.6 Summary and discussion 89
6 Developing the case to intervene in the market 91
6.1 Introduction 91
6.2 QCS Public interest criteria 91
6.3 Establishing a case for regulatory change 92
6.4 Department for Transport business case 92
6.5 Summary and discussion 100
Appendix 1 Stakeholder interviews 102
Appendix 2 Stakeholder questions 103

Important notice
This report has been prepared on the basis set out in our Proposal addressed to the Department for
Transport (‘the Client’) dated 23/02/2015 (the ‘Services Contract’) and should be read in conjunction
with the Services Contract (and the Contract Award Letter dated 12/03/2015).
Nothing in this report constitutes a valuation or legal advice.
We have not verified the reliability or accuracy of any information obtained in the course of our work,
other than in the limited circumstances set out in the Services Contract.
This Report has not been designed to be of benefit to anyone except the Client. In preparing this
Report we have not taken into account the interests, needs or circumstances of anyone apart from
the Client, even though we may have been aware that others might read this Report. We have
prepared this report for the benefit of the Client alone.
This Report is not suitable to be relied on by any party wishing to acquire rights against KPMG LLP
(other than the Client) for any purpose or in any context. Any party other than the Client that obtains
access to this Report or a copy (under the Freedom of Information Act 2000, the Freedom of
Information (Scotland) Act 2002, through the Client’s Publication Scheme or otherwise and chooses
to rely on this Report (or any part of it) does so at its own risk. To the fullest extent permitted by law,
KPMG LLP does not assume any responsibility and will not accept any liability in respect of this
Report to any party other than the Client.
In particular, and without limiting the general statement above, since we have prepared this Report
for the benefit of the Client alone, this Report has not been prepared for the benefit of any other
person or organisation who might have an interest in the matters discussed in this Report.

© 2016 KPMG LLP, a UK limited liability partnership and a member firm of the KPMG network of independent member firms affiliated with KPMG International
Cooperative (“KPMG International”), a Swiss entity. All rights reserved. 1
List of abbreviations
AVL Automatic Vehicle Location
BBAF Better Bus Areas fund
BSOG Bus Service Operators Grant
CBA Cost Benefit Analysis
CC Competition Commission
DDA Disability Discrimination Act
DfT Department for Transport
EU European Union
IA Impact Assessment
ITA Integrated Transport Authority
KPI Key Performance Indicator
LA Local Authority
LSTF Local Sustainable Transport Fund
LTA Local Transport Authority
MOT Multi-Operator Ticketing
PTE Passenger Transport Executive
QCS Quality Contracts Scheme
QPS Quality Partnership Scheme
RPC Regulatory Policy Committee
RTPI Real Time Passenger Information
SQP Statutory Quality Partnership
VQP Voluntary Quality Partnership
WPL Workplace Parking Levy

© 2016 KPMG LLP, a UK limited liability partnership and a member firm of the KPMG network of independent member firms affiliated with KPMG International
Cooperative (“KPMG International”), a Swiss entity. All rights reserved. 2
Abstract
This report
The Department for Transport engaged KPMG to gather information to provide insight into the local
bus market in England outside of London. To that end, we identify three key areas of interest in this
report: market trends, stakeholder objectives and alternative ways in which the government
influences market outcomes. Our report specifically does not undertake an appraisal of alternative
market interventions, consider wider transport policy issues or make policy recommendations.
1. Market trends
Passenger demand for bus services in England outside of London fell almost continuously from the
time of deregulation to the mid-2000s. Since then overall passenger demand has remained relatively
stable albeit with considerable variation across local bus markets reflecting differences in socio-
demographic factors, land use, the relative attractiveness of alternative modes of transport, wider
transport policy and government expenditure, as well as the performance of local bus operators.
Key observations to note are that: approximately 20% of services are financially supported and
tendered by local authorities; levels of passenger satisfaction are high; fares have increased at a
faster rate than general inflation but reflect changes in operating costs; and service mileage has fallen
largely as a result of a reduction in government funding for supported services. Operators have
invested in vehicles and service quality but overall performance is heavily dependent on levels of road
congestion and local traffic management policies.
2. Stakeholder objectives
Local authority and bus operator objectives are reasonably well aligned and centred on market growth
but sometimes differences exist between stakeholders on the best way to achieve those objectives.
The Localism Act 2011 allows local authorities to make the case for new powers and funding to
support economic growth in their local areas. The powers and funding mechanisms granted to local
authorities differ across areas, but transport is a key issue for the devolution agenda. The devolution
agenda, together with financial pressures brought about by austerity, have stimulated discussion on
the role of the government in the provision of local bus services.
3. Government intervention in the market
There is a range of policy levers available to government to influence demand and supply in local bus
markets. In most instances the policy levers available in de-regulated markets enable local authorities
and operators to meet their objectives. Where those objectives cannot be met, local authorities have
additional powers to establish formal and informal partnerships with operators or to introduce Quality
Contracts Schemes, sometimes referred to as franchising.
The franchise approach offers the authority even greater influence over the bus market, including
greater control over fares and services, and branding and marketing. However this comes at the cost
of imposing greater resource demands and financial and delivery risks on the authority.
Future developments
The Buses Bill announced in The Queen’s Speech 2015 is expected to provide additional powers to
local authorities to influence local bus services, potentially including the option to introduce bus
franchising. At the time of writing, the Government is developing the content of the Bill.
For many local authorities the best option may be to do nothing. Where there is pressure for change,
there is a need to carefully consider the impact of interventions on passengers, operators and local
authorities. Each local bus market is unique and each requires a tailored approach to help it deliver
local objectives.

© 2016 KPMG LLP, a UK limited liability partnership and a member firm of the KPMG network of independent member firms affiliated with KPMG International
Cooperative (“KPMG International”), a Swiss entity. All rights reserved. 3
1 Executive summary
1.1 Introduction
The Department for Transport (DfT) engaged KPMG to gather information to provide insight into the
local bus market in England outside of London.
To that end, our work considers the challenges and opportunities facing local bus markets by
analysing market trends, reviewing stakeholder objectives and the extent to which the government
can influence market outcomes. It is based on publicly available information, supported by a series of
25 structured interviews with stakeholders selected by the DfT from the following groups:
■ Local transport authorities in metropolitan areas1.
■ Local transport authorities outside of metropolitan areas.
■ Large bus operating groups.
■ Small, independent bus operators.
■ Bus operators in London.
■ Trade organisations and passenger representatives.
Throughout this report we use the term Local Transport Authority (LTA) to refer to local government
bodies which are responsible for transport in local areas. Where it is necessary to separately identify
LTAs in metropolitan areas from LTAs outside of metropolitan areas we refer to Passenger Transport
Executives (PTEs) and Local Authorities (LAs) respectively.
Our work specifically does not undertake an appraisal of alternative market interventions, consider
wider transport policy issues or make policy recommendations.
1.2 Context
De-regulation and privatisation
Local bus services outside of London were de-regulated and privatised under the 1985 Transport Act.
The Act abolished road service licensing and allowed on-road competition between operators. It also
provided for the privatisation of the National Bus Company and Scottish Bus Group and required local
authorities to transfer municipal bus operations to separate arm’s length companies.
The market model remained unchanged until the Transport Act 2000 provided legislation for local
transport authorities (LTAs) to make Quality Partnership Schemes (QPS) and Quality Contracts
Schemes (QCS). Under a QPS the LTA invests in improved facilities at specific locations along bus
routes (e.g. bus stops or bus lanes) and operators who wish to use those facilities undertake to
provide services of a particular standard when using them (e.g. new buses, or driver training
standards). Under a QCS the LTA determines what local services should be provided and grants
operators exclusive rights to supply services in the area to which the contract relates, subject to
meeting the standards prescribed by the authority 2. The legislative provisions for QPS and QCS were
amended under the Local Transport Act 2008 to make them easier to implement.
Whilst the QPS approach has been relatively widely adopted, there are currently no Quality Contracts
Schemes in operation. Proposals for a QCS for Tyne and Wear were developed by Nexus and
1 Local transport authorities in metropolitan areas include the five Passenger Transport Executives (Transport for Greater
Manchester, Merseytravel, South Yorkshire PTE, Nexus and Centro) and the West Yorkshire Combined Authority.
2 Competition for exclusive rights to operate services means that Quality Contracts Schemes are sometimes referred to as bus
franchising. For convenience, we refer to Quality Contracts Schemes and franchising interchangeably in this report.

© 2016 KPMG LLP, a UK limited liability partnership and a member firm of the KPMG network of independent member firms affiliated with KPMG International
Cooperative (“KPMG International”), a Swiss entity. All rights reserved. 4
assessed by a Quality Contracts Scheme Board. The QCS Board published its opinion of the
proposed scheme on 3 November 2015 concluding that the scheme did not meet all of the public
interest test criterion3. The West Yorkshire Combined Authority is developing and evaluating both
partnership and franchising approaches.
Competition commission market investigation
Following referral by the Office of Fair Trading in 2010, the Competition Commission (CC) undertook
a review of the local bus market outside of London. The CC Market Investigation considered the
effectiveness of competition in the bus market and the potential for consumer detriment from its
structure and operation. Whilst the CC’s investigation was extensive, its focus was on market
competition and it did not specifically include wider policy considerations.
The CC estimated that the total detriment to consumers and taxpayers as a result of adverse effects
on competition was in the range of £115 million to £305 million per year. These costs did not include
the loss of social and wider economic benefits as a result of reduced output and other problems in
the market.
The CC concluded that this detriment could best be remedied through removing barriers to entry and
improving competition in the market and made several recommendations to this effect in relation to
ticketing, operator behaviour, access to bus stations, supported services, effective competition
enforcement, partnerships, payment of the Bus Service Operators Grant (BSOG) and
wider incentives.
The CC considered the merits of the introduction of a franchise based system in local markets and
determined that whilst this model could provide benefits in some cases, it would also be inferior to a
market with stronger head-on competition and was likely to suffer from similar problems related to
barriers to entry. It concluded that the extent to which area wide franchising could address the
consumer detriment arising from a lack of competition in local markets would depend on the intensity
of competition between operators to win a franchise, which in turn depends upon the incentives and
opportunities for bidding for the franchise, which could be influenced by factors such as the inherent
levels of competition, design of the franchise system and capability of the LTA.
Devolution to local government in England
The Localism Act 2011 introduced the Core Cities Amendment which allowed local councils to make
the case for new powers and funding to support economic growth in their local areas. The powers
and funding mechanisms granted to local authorities differ across each area, but transport is a key
issue for the devolution agenda. Greater Manchester, for example, has been offered greater powers
over its local bus market and the Devolution Deal for Cornwall includes proposals which will see the
Council become the first rural authority in the country to be given powers to franchise bus services.
The Buses Bill announced in The Queen’s Speech 2015 is expected to provide additional powers to
local authorities to influence local bus services, potentially including the option to introduce bus
franchising. At the time of writing, the Government is developing the content of the Bill.
1.3 Local bus market trends
The local bus market is complex with demand and supply being influenced by multiple factors, some
of which are controlled by operators, others influenced by LTAs and others which are external to the
market. Some local markets are doing relatively well whilst others are doing less well. Additional
details of market trends are presented in Section 3 of this report.
3 Traffic Commissioners for Great Britain (2015) Quality Contract Scheme (QCS) Board report on the proposed Tyne and Wear
QCS, November 2015. https://www.gov.uk/government/publications/quality-contract-scheme-qcs-board-report-on-the-
proposed-tyne-and-wear-qcs
© 2016 KPMG LLP, a UK limited liability partnership and a member firm of the KPMG network of independent member firms affiliated with KPMG International
Cooperative (“KPMG International”), a Swiss entity. All rights reserved. 5
Passenger demand
Passenger demand for bus services in England outside of London fell almost continuously from the
time of deregulation to the mid-2000s. Since then overall passenger demand has remained relatively
stable albeit with considerable variation across local bus markets reflecting differences in socio-
demographic factors, land use, the relative attractiveness of alternative modes of transport, wider
transport policy and government expenditure, as well as the performance of local bus operators.
This aggregate trend in demand contrasts with trends in London where demand remained relatively
constant between the mid-1980s and the mid-1990s before increasing steadily until the late-2000s.
Whilst differences in bus demand between London and other areas in England are marked, so are the
differences in the factors that influence demand. It is therefore difficult to draw a firm conclusion on
the influence of the market ‘model’ on relative market performance. One thing is clear however, the
growth in passenger demand in London was helped by a step change in the quality of service offered
and a step change in public sector investment and expenditure on local bus services.
Passenger satisfaction
Levels of passenger satisfaction are high across key metrics and across local authority areas. There
are also signs that satisfaction scores are improving, with overall passenger satisfaction levels
increasing from 85% to 88% over the last four years. There were however some concerns raised
during the stakeholder interviews that high passenger satisfaction levels potentially reflect low
passenger expectations rather than high service quality. It was also noted that the sample of
respondents used to determine satisfaction ratings does not include those who choose not to travel
by bus. Identifying the factors that deter non-users from catching the bus could provide additional
insight on the quality of local bus services.
Bus fares
Bus fares for services in England outside of London have risen at a higher rate than general inflation
since 2005 and have risen at a significantly faster rate in metropolitan areas than in non-metropolitan
areas. It is important to note however that fares tend to follow trends in operating costs which have
also increased at a faster rate than inflation.
Operating costs
Operating costs are largely driven by labour and fuel costs and both have risen substantially over
recent years resulting in a 22% increase in operating costs per vehicle mile and 14% increase per
passenger journey since 2004/05. Much of this increase may have been outside operators’ control –
wage inflation may be explained by a shortage of drivers coupled with increased labour demand,
rising pension costs and environmental regulations. Operating costs per vehicle mile are higher, but
higher average load factors mean that operating costs per passenger journey are lower in
metropolitan areas relative to non-metropolitan areas. Costs have increased at similar rates across
both metropolitan and non-metropolitan areas.
Service miles
Arguably the most important market trend in recent years is the reduction in total vehicle miles in
both metropolitan and non-metropolitan areas, driven largely as a result of a reduction in funding for
supported services and a reduction to the level of subsidy provided to operators in the form of BSOG.
Between 2009/10 and 2013/14 supported service mileage fell by around 22% in metropolitan areas
and 24% in non-metropolitan areas. Whilst the reduction in vehicle miles does not appear to have led
to a proportional reduction in patronage, anecdotal evidence suggests that service reductions have
had a disproportionately large impact on those in less densely populated areas and those travelling
outside of core operating times. Anticipated reductions to local authority budgets as part of the
Spending Review 2015 are likely to place additional pressure on government expenditure on local bus
services potentially leading to further reductions in supported service mileage.
© 2016 KPMG LLP, a UK limited liability partnership and a member firm of the KPMG network of independent member firms affiliated with KPMG International
Cooperative (“KPMG International”), a Swiss entity. All rights reserved. 6
Stakeholder views on market trends
Interviews with stakeholders identified markedly different views on the performance of the current
market, the potential of existing policy measures to improve performance, and the potential impacts
of greater regulation on outcomes for passengers.
Stakeholders identified priorities to increase patronage including improved punctuality, easy to
understand networks, integrated ticketing, improved passenger information, higher frequency
services and investment in transport infrastructure. They also expressed concerns over declining
levels of government expenditure on local bus services and uncertainty over market regulation.
Stakeholders agreed that greater coordination of ticketing and services between operators and
modes could provide benefits for passengers in some situations however many also noted that there
were trade-offs to be made between coordination and competition. The importance of each of these
issues for specific local authorities tended to reflect the challenges facing their local markets.
1.4 Rationale for government intervention in the market
Developing the rationale to support government intervention in the market involves consideration of
stakeholder objectives and potential market imperfections. Further discussion on the rationale for
government intervention in the market is presented in Section 4 of this report.
Stakeholder objectives
LTAs, operators and passengers all want long-term market growth, improved network performance,
high service quality and innovation. Passengers and LTAs desire high levels of accessibility, service
integration between operators and modes, and network stability. LTAs and operators have an interest
in achieving modal shift, maintaining good working relationships and investment in infrastructure.
Other objectives are primarily the concern of specific stakeholder groups, although that is not to say
that they are exclusively the concern of those stakeholders. For operators, they include taking market
share, providing a return to investors and having commercial freedom. For local authorities they
include delivering wider transport and spatial policy objectives, wider economic, social and
environmental improvements, as well as achieving value for money from capital and revenue
expenditure. For passengers, they include achieving better value for money and certainty over fares.
Potential misalignments in stakeholder objectives could support the case for further government
intervention in the bus market, especially in areas where the achievement of policy objectives is
expected to provide economic benefits that exceed the costs and risks of regulatory changes. The
key finding of this analysis, however, is that in most areas there is a good overlap between the
objectives of different stakeholders.
Market imperfections
There may be occasions where markets do not deliver an efficient allocation of resources for a variety
of reasons that economists refer to as ‘market failures’ or ‘market imperfections’. For de-regulated
local bus markets we have identified four potential sources of market imperfection, including:
■ Network economies relating to service coordination, ticket integration and joint marketing.
■ Misaligned incentives between operators and the infrastructure provider/manager.
■ Lack of competition or ability for new entrants to enter the market.
■ Economic, social and environmental benefits that occur to society as a by-product of bus travel
but are not captured fully by private bus operators.
Each type of market imperfection is discussed further below.

© 2016 KPMG LLP, a UK limited liability partnership and a member firm of the KPMG network of independent member firms affiliated with KPMG International
Cooperative (“KPMG International”), a Swiss entity. All rights reserved. 7
Network economies
Effective bus services connect people to the places where they want to go and in many situations
this requires a coordinated and integrated network of services and routes. Where services are
provided by competing operators, the coordination of timetables, fares and ticketing arrangements is
complex and unless it is carefully managed it could potentially be in breach of Competition Law.
Where there is a need, government intervention can help to coordinate services and align fares and
ticketing to help passengers transfer seamlessly between services provided by different operators.
Misaligned incentives
The delivery of a high quality bus network generally requires partnership working between those who
are responsible for providing and maintaining transport infrastructure and managing road network
performance, and those who are responsible for operating the bus services themselves. The
separation of these interrelated activities and lack of formal or informal arrangements on how to
manage the interface between them can lead to a misalignment of incentives.
For example, operators have limited incentives to unilaterally invest in the network where this
investment can be used by their competitors. Similarly LTAs may have limited incentives to invest in
bus infrastructure where they cannot be sure that the level of service provided by operators using the
facility will be maintained or that the benefits of the investment will ultimately flow to passengers
and the wider community. There may also be conflicts or misaligned incentives associated with
investment in other transport schemes (such as light rail) for which competition from bus services
could impede the realisation of scheme benefits.
Where there is a need, government intervention can reduce the misalignment of incentives to invest
in infrastructure by establishing formal or informal agreements between the LTA and operators.
Lack of competition or ability for new entrants to enter the market
A lack of effective, sustainable competition between operators for passengers could lead to higher
fares, lower output, reduced service quality, reduced innovation and higher operator profits relative to
those delivered by a more competitive market. A lack of effective competition could also lead to
inefficiencies in the market for supported services.
Whilst on-road competition is relatively scarce, the market is sometimes regarded as being
‘contestable’ with the threat of market entry providing an incentive to operators and the market to
work efficiently. Competition from other modes and from cars in particular will also provide an
incentive for the market to work efficiently. The CC however could not find evidence to support
this view.
Where there is a need, government intervention can protect passenger interests by providing
favourable conditions for competition to arise or by regulating market power where competition
is not sustainable.
Wider economic, social and environmental benefits
Bus services can generate wider economic, social and environmental benefits which can mean that it
is economically efficient to increase supply above the levels determined by the commercial market.
Buses connect people to jobs and customers to businesses, they provide access to essential
services, promote social inclusion and provide environmental improvements by encouraging a switch
from private to public transport.
Where these wider benefits or ‘positive externalities’ exist, government can improve market
efficiency by targeting support to expand supply and/or keep fares lower than they would
otherwise be.
© 2016 KPMG LLP, a UK limited liability partnership and a member firm of the KPMG network of independent member firms affiliated with KPMG International
Cooperative (“KPMG International”), a Swiss entity. All rights reserved. 8
The prevalence of the market imperfections identified above and their impacts on local markets will
vary from place to place, depending on:
■ Travel patterns and behaviours, the complexity of the network and requirement to make multi-
stage, multi-operator trips.
■ The level of integration between infrastructure and operations, including the quality of the road
network, levels of congestion, and availability of bus lanes and priority measures.
■ The level of market power held by operators which in turn will be influenced by the number of
operators, competition from other modes of transport, and the extent to which the market
is contestable.
■ The relative importance of generating wider economic, social and environmental benefits, and the
level of investment in complementary transport and spatial planning.
An assessment of each of these factors might reveal that there are particular issues with the
performance of a local market which in turn might be indicative of a market imperfection. In practice
the assessment of market imperfections is complicated by the fact that the imperfections are not
mutually exclusive and at times may work in opposite directions, for example a lack of competition
could lead to better coordination and integration of services and ticketing.
1.5 Government influence over the local bus market
De-regulated model
Under the de-regulated model, LTAs have a range of policy levers which can be used to influence the
supply and demand of local bus services, to mitigate against market imperfections and achieve their
wider policy objectives. Further details on the ways in which the government can influence market
outcomes can be found in Section 5 of this report.
Policy levers applied nationally include:
■ Taxes and subsidy (including BSOG).
■ Statutory concessionary travel.
■ Licensing and quality regulation.
■ Competition law.
■ Best practice guidance.
Policy levers applied locally include:
■ Supported services.
■ Discretionary concessionary travel.
■ Targeted capital funding.
■ Planning, infrastructure investment and traffic management.
■ Highway demand management.
■ Municipal bus operator services.
The ability to provide supported services, invest in bus priority measures and offer discretionary
concessionary travel, in addition to the policy measures applied at a national level by the DfT, mean
that LTAs can have influence on many aspects of the bus market. However, there are several
aspects of local bus services over which LTAs have little direct influence, including: the level and
structure of fares (for non-concessionary passengers), integrated ticketing, the stability of the
network, branding and marketing, and the overall integration of the bus network into wider transport
policy. Where government influence over these aspects of local bus services is important to
© 2016 KPMG LLP, a UK limited liability partnership and a member firm of the KPMG network of independent member firms affiliated with KPMG International
Cooperative (“KPMG International”), a Swiss entity. All rights reserved. 9
achieving objectives, the LTA may seek greater influence through partnership working with operators
or the introduction of a bus franchise.
It is also important to recognise the influence of other local authority policies on local bus markets, for
example wider transport, land-use and economic policies. Whilst important to local bus services,
these policies are often the responsibility of other parts of local authorities and are not always fully
coordinated.
Partnerships
The partnership model can strengthen the ability of the LTA to influence the demand and supply of
local bus services and can be used to achieve a wider range of objectives by bringing LTAs and
operators together to develop the market. To some extent partnerships can provide the LTA with
greater influence in comparison to the status quo over fares, ticketing, network integration and
stability, but there are limits to what can be achieved. Partnerships generally require a shared
understanding of the market, common objectives and the ability of each partner to provide incentives
to the other – typically local authorities providing enhanced infrastructure and traffic management and
operators providing enhanced vehicles and services. Effective negotiation within a partnership can be
hindered where there are multiple operators with conflicting interests, where relationships are not
well developed, where there is an imbalance in what each partner can offer or where there is a lack
of political support for the partnership approach.
The partnership approach retains many of the positive features of the de-regulated model including
maintaining the incentives for operators to meet the needs of passengers through efficiency and
innovation, whilst at the same time responding to the priorities of the LTA. However, even where
partnerships are successful, there are some features that cannot easily be delivered such as
integrated fares and services, and common branding and marketing.
Franchising
The franchising approach (under a gross cost contract) offers the LTA greater influence over the
demand and supply of local bus services, including greater control over the integration of fares and
services and branding and marketing, however this comes at the cost of imposing greater financial
risk on the LTA and weakening operator incentives to respond to changing market conditions, as well
as costs associated with transitioning from current arrangements to an alternative market model.
There are also concerns that unless contracts are attractive to bidders (including potential new
entrants), competition for contracts may not be efficient and that competitive incentives may be
reduced especially over longer contract durations. Some of these disadvantages however will likely
be able to be mitigated through careful contract design.
The policy levers available under franchising provide the LTAs with scope to address three of the four
potential market imperfections including: the need to integrate fares and services and provide
common branding and marketing; the need to align incentives between bus operators and the
infrastructure provider; and the scope to realise the wider economic, social and environmental
benefits from expanding the demand for and supply of local bus services. However, whilst the
government can help to create conditions to support sustainable competition for the market, it is
ultimately up to operators to decide whether or not to bid for contracts.
Stakeholder views on government intervention
Many stakeholders were wary of the long term effects of greater political influence over the design
of the bus market and the potential adverse effects on efficiency and the design of services. Some
were sceptical that franchising would increase competition and most of the LAs consulted were
content or even pleased with the performance of their local market and would not choose to pursue
the franchise model without significant additional funding from central government or other sources
to offset the risks.

© 2016 KPMG LLP, a UK limited liability partnership and a member firm of the KPMG network of independent member firms affiliated with KPMG International
Cooperative (“KPMG International”), a Swiss entity. All rights reserved. 10
PTEs were generally more positive about the prospect of franchising for their local markets. They
were more likely to highlight the need for greater integration and coordination of the bus market with
the wider transport network and the importance of achieving specific objectives such as the
introduction of passenger information, integrated ticketing, standardised fares, centralised
information, and control over changes to the bus markets. These factors were seen as critical to the
success of the bus market and could only be achieved through franchising. PTEs were also more
likely to be dissatisfied with the performance of their local markets and highlighted the limits and
difficulties of partnership working, complexities of competition law and adverse effects of
competition on the performance on their local market.
Operators were generally sceptical about the potential benefits of franchising and highlighted a range
of risks associated with LTA control of the bus market, although some smaller operators and
potential new entrants did see an opportunity for franchises to level the playing field between
operators and improve competition in some areas. Most stated that LTAs had underestimated the
costs of running a franchise and the benefits of commercial incentives in the current market. Most
saw considerable benefits to current partnership arrangements by balancing risks and incentives
between the private and public sector and retaining commercial influence over the design of services.
Many highlighted practical issues such as the potential for labour costs to increase as result of
standardisation of bus drivers pay and terms and conditions of employment, and the importance of
access to strategic facilities such as depots for effective franchise competition.
At least in part, the desire for greater LTA influence over local bus services is guided by the extent to
which bus services are regarded as providing services to passengers (as a retail business) versus
their importance to the overall transport network (as a public utility).
1.6 Developing the case to intervene in the market
Proposals to intervene in the local bus market through the introduction of alternative market models
should be supported by a compelling case for change. As with the appraisal of other government
policies, projects or programmes, the Treasury’s five case model outlined in the ‘Green Book’
provides a suitable framework to appraise the potential impacts of changes to market regulation. The
framework asks whether the intervention:
■ Fits with wider public policy objectives (strategic case).
■ Demonstrates value for money (economic case).
■ Can be procured and is commercially viable (commercial case).
■ Is financially affordable (financial case).
■ Can be delivered (management case).
The framework is currently applied by the DfT to support transport policy and investment decisions
and is recommended by the Regulatory Policy Committee (RPC) for appraising regulatory change
across government departments.
If the Green Book framework is used to appraise intervention in the local bus market, it will be
important to make sure that decision-makers satisfy themselves that the potential benefits arising
from the scheme outweigh the potentially adverse impacts (part of the economic case). Following
RPC advice, they will need to challenge the presumption that regulation is the answer by asking:
■ Has a market imperfection or regulatory failure been clearly identified that necessitates the need
for government intervention?
■ Have non-regulatory alternatives been considered to correct the cause of the market imperfection
and, if not, has sufficient justification been provided to explain why this would not be a
viable option?

© 2016 KPMG LLP, a UK limited liability partnership and a member firm of the KPMG network of independent member firms affiliated with KPMG International
Cooperative (“KPMG International”), a Swiss entity. All rights reserved. 11
■ Has the ability of the regulatory intervention to correct the causes of market imperfection been
clearly demonstrated and any potential unintended consequences and/or behavioural impacts
taken into account?
Changing the structure of the market and the way it is regulated will have wide ranging impacts
which are difficult to assess and quantify and which might only become apparent over the longer
term. Some of these impacts such as the potential to rationalise routes could be measured, others
such as the potential for increased competition could be assumed but are much more difficult to
predict as they depend upon the response of operators. Others such as the long term effects of
reducing commercial incentives in the bus market and increasing political influence over fares and
timetables are very hard to predict in a meaningful way.
For this reason, the overall policy assessment is very important to assessing the case for change and
local decision-makers should place appropriate weight on evidence given the wide range of
uncertainties. Only where the strategic policy tests are met should decision-makers consider the
detailed costs and benefits of the proposals – which will of course remain subject to
considerable uncertainty.
In a period of reduced government budgets, there is a trade-off to be made between making
strategic investments to support long-term economic growth and managing more immediate budget
constraints. In relation to the latter, reductions to local authority budgets prompt an examination of
potential efficiency savings arising from co-ordinating services provided by different government
departments including health, social care and education.
Stakeholder views on franchising
The responses to the stakeholder interviews suggest that if franchising is to be introduced it is likely
to be more viable where:
■ The LTA has a desire to invest heavily in bus services as a policy tool to enhance local transport
and economic performance, by reducing fares and improving service quality on a network wide
basis rather than ‘filling in the gaps’ of the commercial network or targeting individual corridors in
a more ad-hoc manner.
■ Bus services are important for the overall performance of the transport network, reducing
congestion and achieving modal shift.
■ Trip patterns are complex and there is a need for better integration between bus service and other
modes of transport to improve public perceptions of the quality of bus services.
■ There is a lack of competition in the market, services are of low quality and there is a good
prospect of effective competition for a franchise. This would require a relatively large contract
size, access to strategic assets such as depots and a well-designed and delivered procurement
process.
■ There is an integrated transport policy with land use, road network and parking policy designed to
support bus services.
■ Existing policy measures such as the partnership model have failed to achieve stakeholder
objectives.
■ There is stable political support, a commitment and ability to fund improvements in services and
the ability to manage the additional revenue liability created by the franchise.
■ The LTA area is relatively large, with sufficient resources and skills to design and run
franchise services.
■ Transitional risks can be effectively managed to prevent undermining bus market performance in
the medium term.

© 2016 KPMG LLP, a UK limited liability partnership and a member firm of the KPMG network of independent member firms affiliated with KPMG International
Cooperative (“KPMG International”), a Swiss entity. All rights reserved. 12
Across stakeholders there was general agreement that franchising was not the only solution to
issues in local markets. LTAs could make better use of existing policy levers and the partnership
model could also be strengthened to improve outcomes by granting LTAs greater influence over
operators conduct and market entry.
Further discussion on establishing the case to intervene in the market is presented in Section 6 of
this report.
1.7 Final thoughts
Where de-regulated markets fail to deliver stakeholder objectives, both partnership and franchising
approaches can provide an additional set of policy levers to influence market outcomes, especially in
areas that need greater integration between infrastructure, traffic management and bus operations.
However, the franchising approach provides greater flexibility for authorities to influence market
outcomes, subject to budget constraints.
In many instances the partnership approach works well, providing LTAs and operators with a great
deal of flexibility to influence the demand and supply of local bus services. What is missing however
is the ability of the LTA to incentivise operators to enter into binding agreements where the LTA has
limited funds to improve infrastructure and/or improve traffic management, at least in the short term.
Stakeholders need to give more thought to how operators and LTAs can provide and respond to
incentives. This is at the heart of the operation of other networked infrastructure where there is
increasing interest in ‘goal-based’ approaches to market organisation as opposed to ‘prescriptive’
approaches. In the goal-based approach, the government’s role is simply to specify what it wants the
market to deliver for the funds available and to provide the right conditions for the market to do so. It
is then up to individual operators to meet customer needs and deliver services that contribute to
wider government objectives.
Whatever approach is adopted, it is clear that passengers respond positively to high quality services
and low fares. If the objective is to grow the market then creating a stable environment to invest in
services with balanced risks and rewards for LTAs and operators is likely to be part of the solution.
Where the level of investment needed to secure wider economic benefits cannot be funded through
the farebox, additional taxpayer funding is inevitable.
For many local authorities the best option may be to do nothing. Where there is pressure for change,
there is a need to carefully consider the impact of interventions on passengers, operators and local
authorities. Each local bus market is unique and each requires a tailored approach to help it deliver
local objectives.

© 2016 KPMG LLP, a UK limited liability partnership and a member firm of the KPMG network of independent member firms affiliated with KPMG International
Cooperative (“KPMG International”), a Swiss entity. All rights reserved. 13
2 This report
2.1 Objectives
The Department for Transport (DfT) engaged KPMG to gather information to provide insight into the
local bus market in England outside of London.
It is important to note that the local bus market is complex, context specific and influenced by
many factors. Our work specifically does not undertake an appraisal of alternative market
interventions, consider wider transport policy issues or make policy recommendations. It also does
not cover operator margins in detail.
2.2 Approach
Our work considers the challenges and opportunities facing local bus markets by analysing market
trends, reviewing stakeholder objectives and the extent to which the government can influence
market outcomes. It is based on publicly available information, supported by a series of 25 structured
interviews with stakeholders selected by the DfT from the following groups:
■ Local transport authorities in metropolitan areas4.
■ Local transport authorities outside of metropolitan areas.
■ Large bus operating groups.
■ Small, independent bus operators.
■ Bus operators in London.
■ Trade organisations and passenger representatives.
As noted in the Executive Summary, throughout this report we use the term Local Transport
Authority (LTA) to refer to local government bodies which are responsible for transport in local areas.
Where it is necessary to separately identify LTAs in metropolitan areas from LTAs outside of
metropolitan areas we refer to Passenger Transport Executives (PTEs) and Local Authorities (LAs)
respectively.
The interviews were separated into three parts:
■ Market analysis – Questions related to stakeholder objectives for the market, existing problems
and potential solutions, passenger needs and the best ways to increase bus patronage. This
section also included questions on stakeholders’ desire for specific features such as ticketing
integration, coordination and competition.
■ Market models – Questions related to the pros and cons associated with changes to the existing
de-regulated market structure and where/when such changes could be beneficial.
■ Impacts of regulation – Questions related to the impacts of a more regulated bus market overall
and on specific features of the market performance such as service quality, operating costs,
innovation and the costs and risks for the LTA.
Where possible, interviews were conducted in person. Interviews lasted up to two hours with
respondents given the option to provide additional written feedback.
A list of the organisations who participated in the work and details of the questions asked are
included in the Appendix.
4 The five Passenger Transport Executives and West Yorkshire Combined Authority.

© 2016 KPMG LLP, a UK limited liability partnership and a member firm of the KPMG network of independent member firms affiliated with KPMG International
Cooperative (“KPMG International”), a Swiss entity. All rights reserved. 14
The remainder of the report is structured as follows:
■ Section 3 provides an overview of the market. It provides some background to the local bus
market, a brief description of its structure and an overview of market trends in broad market
segments. It considers the drivers of market performance and provides a summary of stakeholder
perspectives on the market.
■ Section 4 identifies stakeholder needs and objectives before reviewing the scope for under-
performance relative to objectives arising as a result of market imperfections.
■ Section 5 describes the range of policy levers available to local and central government to
influence market demand and supply. The policy levers include those available in de-regulated
markets, those available under partnerships and those available under franchising.
■ Section 6 sets out a framework to review the factors that need to be taken into account when
considering intervening in the market.

© 2016 KPMG LLP, a UK limited liability partnership and a member firm of the KPMG network of independent member firms affiliated with KPMG International
Cooperative (“KPMG International”), a Swiss entity. All rights reserved. 15
3 Market overview
3.1 Background
3.1.1 De-regulation and privatisation
Local bus services outside of London were de-regulated and privatised under the 1985 Transport Act.
The Act abolished road service licensing and allowed on-road competition between operators. It also
provided for the privatisation of the National Bus Company and Scottish Bus Group, and required local
authorities to transfer municipal bus operations to separate arm’s length companies.
The market model remained unchanged until the Transport Act 2000 provided legislation for local
transport authorities (LTAs) to make Quality Partnership Schemes (QPS) and Quality Contracts
Schemes (QCS). Under a QPS the LTA invests in improved facilities at specific locations along bus
routes (e.g. bus stops or bus lanes) and operators who wish to use those facilities undertake to
provide services of a particular standard when using them (e.g. new buses, or driver training
standards). Under a QCS the LTA determines what local services should be provided and grants
operators exclusive rights to supply services in the area to which the contract relates, subject to
meeting the standards prescribed by the authority. The legislative provisions for QPS and QCS were
amended under the Local Transport Act 2008 to make them easier to implement.
Whilst the QPS approach has been relatively widely adopted, there are currently no Quality Contracts
Schemes in operation. Proposals for a QCS for Tyne and Wear were developed by Nexus and
assessed by a Quality Contracts Scheme Board. The QCS Board published its opinion of the
proposed scheme on 3 November 2015 concluding that the scheme did not meet all of the public
interest test criterion. The West Yorkshire Combined Authority is developing and evaluating both
partnership and franchising approaches.
3.1.2 Competition commission market investigation
After 20 years of de-regulated operations, the DfT noted in 2006 that: ‘the existing de-regulated
regime has succeeded in controlling costs, encouraged industry led innovation and, in some places,
has led to increased responsiveness to passenger needs. But one of its chief aims of on-road
competition has not been sustained. Indeed it is doubtful whether this aim was ever realistic in the
longer term, except in rare circumstances’5.
Following referral by the Office of Fair Trading in 2010, the Competition Commission (CC) undertook
a review of the local bus market outside of London. The CC Market Investigation considered the
effectiveness of competition in the bus market and the potential for consumer detriment from its
structure and operation.
Reporting in 2011, the CC identified market imperfections leading to reduced quality of service,
increased fares and higher costs for local authorities. The CC’s findings included:
■ Head-to-head competition in the supply of local bus services was uncommon.
■ Many local markets exhibit persistently high levels of concentration.
■ Ongoing sustained head-to-head competition, where present, delivers significant benefits to
customers.
■ But head-to-head competition can result in periods of intense short lived rivalry, eventually leading
to the exit of an operator.
5 Department for Transport (2006) Putting passengers first, December 2006, p34
© 2016 KPMG LLP, a UK limited liability partnership and a member firm of the KPMG network of independent member firms affiliated with KPMG International
Cooperative (“KPMG International”), a Swiss entity. All rights reserved. 16
■ This creates a barrier to entry and expansion reducing the competitive constraint from potential
competition and new entry.
■ The market displays geographic segmentation.
■ Competition in the supply of local bus services is not effective in local markets where head-to-
head competition does not exist.
■ Four features of the market make head-to-head competition difficult, including:
– High levels of market concentration
– Barriers to entry and expansion
– Customer conduct in choosing between buses
– Operators avoiding competing with other operators.
■ In most cases the market for the tendering of contracts for supported services worked well, but in
some cases competition was impaired.
The CC estimated that the total detriment to consumers and taxpayers as a result of adverse effects
on competition was in the range of £115 million to £305 million per year. These costs did not include
the loss of social and wider economic benefits as a result of reduced output and other problems in
the market.
The CC concluded that this detriment could best be remedied across the market as a whole by
removing barriers to entry and improving competition in the market and made several
recommendations to this effect in relation to ticketing, operator behaviour, access to bus stations,
supported services, effective competition enforcement, partnerships, payment of the Bus Service
Operators Grant (BSOG) and wider incentives.
The CC considered the merits of the introduction of a franchise based system in local markets and
determined that whilst this model could provide benefits in some cases, it would also be inferior to a
market with stronger head-to-head competition and was likely to suffer from similar problems related
to barriers to entry. It concluded that the extent to which area wide franchising could address the
consumer detriment would depend on the intensity of competition between operators to win a
franchise, which in turn depends upon the incentives and opportunities for bidding for the franchise,
which could be influenced by factors such as the inherent levels of competition, design of the
franchise system and capability of the LTA.
In summary the CC considered that the competitive outcomes desired of the franchise model could
be achieved more proportionately through improving competition in the market but noted that LTAs
have wider social and policy objectives – outside of the CC’s scope – which could make franchising
more desirable in some situations where competition does not deliver wider social and economic
objectives for local areas.
3.1.3 Devolution to local government in England
The Localism Act 2011 introduced the Core Cities Amendment which allowed local councils to make
the case for new powers and funding to support economic growth in their local areas. As a result of
this the Government entered into a range of City and Growth deals with local authorities, including
providing additional funding for transport and infrastructure projects. These deals involved new
funding powers and devolution for local areas, in exchange for measures to strengthen governance
and scrutiny over local spending. This has also led to the establishment of several new Combined
Authorities – representing multiple local authorities in functional economic areas.
The powers and funding mechanisms granted to local authorities differ across each area, but
transport is a key issue for the devolution agenda. Greater Manchester, for example, has been
offered greater powers over its local bus market and the Devolution Deal for Cornwall includes
proposals which will see the Council become the first rural authority in the country to be given
powers to franchise bus services.

© 2016 KPMG LLP, a UK limited liability partnership and a member firm of the KPMG network of independent member firms affiliated with KPMG International
Cooperative (“KPMG International”), a Swiss entity. All rights reserved. 17
The Buses Bill announced in The Queen’s Speech 2015 is expected to provide additional powers to
local authorities to influence local bus services, potentially including the option to introduce bus
franchising.
3.2 Current market structure
Figure 1 shows the key interactions between central government, LTAs and operators in the de-
regulated market. In brief:
■ Operators identify commercially feasible opportunities and register services with the Traffic
Commissioner. After a registration period usually equal to 56 days, the operator is free to operate
those services on a commercial basis. The operator sets fares, takes commercial risk and can face
on-road competition from other registered services and competition from other modes of
transport.
■ LTAs review the network of commercially registered services and where funding is available it
identifies and tenders additional services which they consider to be socially necessary. They
provide bus service information to passengers, run discretionary ticketing schemes, reimburse
operators for carrying concessionary passengers and decide whether to provide additional
concessions over and above those required by statute. They also invest in infrastructure, manage
the road network and have statutory responsibilities in relation to school transport.
■ Central government provides BSOG to operators to help cover fuel costs for commercial services
and devolve BSOG payments to LTAs to cover fuel costs on supported services. Central
government also provides ‘grants’ to local authorities that includes payment for non-major scheme
infrastructure, supported services and statutory concessionary travel.
■ The Traffic Commissioner licences operators, registers commercial services and regulates
operator service punctuality6. Service quantity and fares are not regulated.
Figure 1: The de-regulated local bus market model
Source: KPMG Analysis
6 Bus companies must ensure that 95% of their services are no more than one minute early or five minutes late or they will
face fines of up to £350 per vehicle.
Traffic
Commissioner
Local Transport
Authority (LTA)
Central
Government
Bus
Operators
Infrastructure, traffic
management and
service information
Passengers
Fares
BSOG for commercial
services
Taxes
Licencing and
regulation
Operators register
commercial services
Concessionary travel
reimbursement
Competitively tender
supported services
Block grant, BBAF,
LSTF etc
BSOG for supported
services
Local transport
policy

© 2016 KPMG LLP, a UK limited liability partnership and a member firm of the KPMG network of independent member firms affiliated with KPMG International
Cooperative (“KPMG International”), a Swiss entity. All rights reserved. 18
Commercially registered services are provided on a commercial basis, although operators receive
government support in the form of BSOG and are reimbursed on a ‘no better, no worse off’ basis for
carrying concessionary passengers. BSOG is paid to operators of eligible local bus services to help
them recover some fuel costs. The amount each bus company receives is based on their annual fuel
consumption and currently accounts for approximately 8% of operating costs.
LTAs have no direct control over commercially registered services but they can exert influence on
commercial service quality through investment in infrastructure, traffic management measures,
parking and other local transport policies. LTAs can however provide financial support to services that
they consider as being socially necessary but are not commercially registered. Where funding is
available, supported services are competitively tendered on either a gross or net cost basis.
According to the CC review, 58% of LTAs reported that they generally invited tenders on a net cost
basis only, 15% on a gross cost basis only, and 25% said they invited tenders using either gross or
net cost contracts.
Under existing legislation, LTAs can become more involved in the delivery and development of local
bus services through partnerships and franchising. Details of the range of policy levers available to
government to intervene in the local bus market are presented in Section 5 of this report.
3.3 Market trends
In this section we consider the performance of the market across a series of key metrics including:
passenger demand, passenger satisfaction, fares, operating costs, service miles, network stability,
fleet quality and government expenditure. The purpose of the analysis is to provide context to the
discussion on government intervention in local bus markets in Section 4.
We have assembled and analysed data on the local bus market, including:
■ DfT Bus statistics.7
■ Transport Focus statistics.8
■ National Travel Survey statistics.9
■ Census data.10
Each of these datasets provides information on the performance of different aspects of the local bus
market. The DfT Bus Statistics and National Travel Survey provides analysis of long term trends,
covering factors including demand, costs and fares across different geographic areas. Transport
Focus reports on passenger opinions on bus service provision across local authorities providing
information on different aspects of service quality. Census data provides spatially detailed social
economic information which is useful for considering wider factors which affect the performance of
the bus market such as car ownership and income.
It is important to note that the data that we have assessed is at a relatively aggregate level, reported
at national and regional levels or by area type. We also note that alternative data items are recorded
and presented across different geographies and time periods. Where possible, we present the entire
data available but care is required to compare like with like when making comparisons across data
items.
7 Available at: https://www.gov.uk/government/collections/bus-statistics
8 Available at: http://data.transportfocus.org.uk/bus/
9 Available at: https://www.gov.uk/government/collections/national-travel-survey-statistics
10 Available at: http://www.ons.gov.uk/

© 2016 KPMG LLP, a UK limited liability partnership and a member firm of the KPMG network of independent member firms affiliated with KPMG International
Cooperative (“KPMG International”), a Swiss entity. All rights reserved. 19
3.3.1 Demand
Buses are the most widely used form of public transport in England. Overall, there were around 4.7
billion bus journeys made in England in 2013/14, up from a low point of 3.7 billion in 1993, but down
on demand in the 1980s. A breakdown of total journeys in England, London, metropolitan and non-
metropolitan areas is shown in Figure 2.
Figure 2: Total bus passenger journeys since 1982
Source: DfT Bus Statistics Table BUS0103.
Figure 2 shows that, on aggregate, levels of passenger demand outside of London fell almost
continuously from the time of deregulation to the mid-2000s and since then have remained relatively
stable, with modest growth from increased take-up of concessionary travel and modest reductions
reflecting macro-economic conditions. Demand in London followed a rather different trend with
demand remaining relatively constant between the mid-1980s and mid-1990s before steadily
increasing until the late-2000s.
Figure 3 shows the average number of bus trips per person per year between 1991/92 and 2013/14
by area type. Over the period, the average number of bus trips per person per year has declined from
133 to 87 in metropolitan areas and from 44 to 33 in non-metropolitan areas. In London, the average
number of bus trips per person per year has increased from 168 to 283 over the same period.
Figure 3: Bus passenger journeys per person since 1991/92
Source: DfT Bus Statistics Table BUS0103.
0
1,000
2,000
3,000
4,000
5,000
6,000
1982
1983
1984
1985/86
1986/87
1987/88
1988/89
1989/90
1990/91
1991/92
1992/93
1993/94
1994/95
1995/96
1996/97
1997/98
1998/99
1999/00
2000/01
2001/02
2002/03
2003/04
2004/05
2004/05
2005/06
2006/07
2007/08
2008/09
2009/10
2010/11
2011/12
2012/13
2013/14Pa
ssen
ge
r jo
urn
eys (
millio
n)
England London
English metropolitan areas English non-metropolitan areas
0
50
100
150
200
250
300
1991/92
1992/93
1993/94
1994/95
1995/96
1996/97
1997/98
1998/99
1999/00
2000/01
2001/02
2002/03
2003/04
2004/05
2004/05
2005/06
2006/07
2007/08
2008/09
2009/10
2010/11
2011/12
2012/13
2013/14
Trip
s p
er p
erso
n
English metropolitan areas English non-metropolitan areas England outside London London

© 2016 KPMG LLP, a UK limited liability partnership and a member firm of the KPMG network of independent member firms affiliated with KPMG International
Cooperative (“KPMG International”), a Swiss entity. All rights reserved. 20
It is important to note that there is considerable variation in patterns of demand between areas
arising from differences in socio-demographic factors, land use, the relative attractiveness of
alternative modes of transport, wider transport policy and expenditure, as well as the performance of
local bus operators. Whilst differences in bus demand between London and the rest of England are
marked, so are the differences in the factors that influence demand. It is therefore difficult to draw
conclusions on the influence of the market model on relative performance.
3.3.2 Passenger satisfaction
Transport Focus conducts an annual survey across local transport authorities to establish levels of
passenger satisfaction with local bus services. The latest annual bus survey took place in autumn
2014 across 23 local authority areas and the results were published in March 2015. The survey data
reveals that overall satisfaction with bus journeys ranges from 83% to 93%, averaging 88% and
suggesting overall high levels of satisfaction with bus services.
Table 1 provides a summary of key satisfaction metrics across local authority areas. Overall
satisfaction, convenience and accessibility, bus stop condition, journey time and passenger
information all score highly in terms of passenger satisfaction, whereas punctuality and value for
money show lower average levels of satisfaction but also show greater variability between areas.
Table 1: Passenger satisfaction with local bus services (2014)11
2014
passenger
satisfaction
Overall
satisfaction
Convenience
/accessibility
Bus stop
condition
Journey
time
Route/
destination
information Punctuality
Value for
money
Average 88% 89% 88% 86% 86% 77% 62%
Max 93% 93% 90% 92% 92% 86% 73%
Min 83% 84% 74% 80% 83% 67% 45%
Range 10% 9% 16% 12% 9% 19% 28%
Source: KPMG analysis of Transport Focus data.
Table 2 shows the variation in overall passenger satisfaction across local authority areas. Overall
satisfaction is highest in York (93%), Nottinghamshire (93%) and Norfolk (92%); and lowest in
Greater Manchester (85%), West England Partnership (84%) and Milton Keynes (83%).
The survey has been in the current format since 2011, with minor variations in the questions. In each
year different locations have been surveyed making it difficult to establish trends in specific areas. A
comparison of the average survey results from 2011 up to 2014 shows that overall bus passenger
satisfaction has improved over the last four years from 85% to 88%.
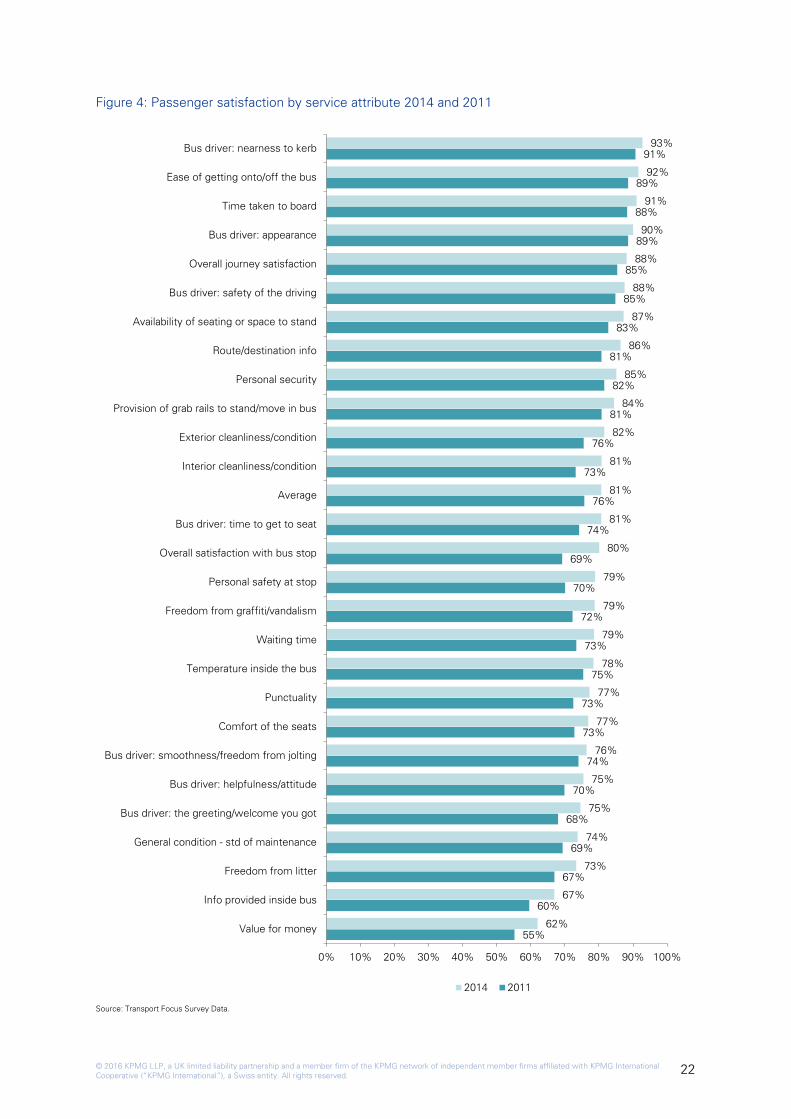
Figure 4 shows how scores for specific aspects of passenger satisfaction have changed between
2011 and 2014 with improvements recorded across all aspects.
A comparison with other public transport modes shows that satisfaction with bus services is
generally higher than with rail services (81% in 2014) and slightly lower than with tram services
(90% in 2013).
11 Passenger satisfaction is defined as the percentage of bus users stating that they are either satisfied or very satisfied with
services.

© 2016 KPMG LLP, a UK limited liability partnership and a member firm of the KPMG network of independent member firms affiliated with KPMG International
Cooperative (“KPMG International”), a Swiss entity. All rights reserved. 21
Table 2: Passenger satisfaction by local authority (Overall Journey Satisfaction)
Local authority 2011 2012 2013 2014
York 88% 93%
Nottinghamshire 87% 93%
Norfolk 87% 89% 92%
Suffolk 86% 93% 91%
Tyne & Wear 91% 87% 90% 90%
Gloucestershire 90%
Mersey 86% 87% 89% 90%
Devon 90% 90% 90%
Nottingham City 91% 92% 89%
Tees Valley 85% 87% 88% 88%
Blackpool 89% 88%
Medway 88%
Staffs 85% 87%
Essex 83% 79% 83% 87%
South Yorkshire 86% 83% 89% 87%
Kent 84% 90% 87%
West Midlands 81% 79% 86% 87%
Oxfordshire 91% 86%
Thurrock 87% 84% 86%
West Yorkshire 85% 85% 88% 86%
Greater Manchester 84% 84% 86% 85%
West England Partnership 84% 82% 83% 84%
Milton Keynes 73% 84% 83%
Bournemouth/Poole 87%
County Durham 83%
Dorset 88%
East Sussex 88%
Herts 84%
Kingston Upon Hull 85%
Lancaster 87% 88%
Leicester City 85%
Northamptonshire 83%
Northumberland 79% 85%
Stoke on Trent 79%
Surrey 88%
Warrington 87%
Worcestershire 83%
Average 85% 84% 87% 88%
Source: Transport Focus Survey Data.
© 2016 KPMG LLP, a UK limited liability partnership and a member firm of the KPMG network of independent member firms affiliated with KPMG International
Cooperative (“KPMG International”), a Swiss entity. All rights reserved. 22
Figure 4: Passenger satisfaction by service attribute 2014 and 2011
Source: Transport Focus Survey Data.
55%
60%
67%
69%
68%
70%
74%
73%
73%
75%
73%
72%
70%
69%
74%
76%
73%
76%
81%
82%
81%
83%
85%
85%
89%
88%
89%
91%
62%
67%
73%
74%
75%
75%
76%
77%
77%
78%
79%
79%
79%
80%
81%
81%
81%
82%
84%
85%
86%
87%
88%
88%
90%
91%
92%
93%
0% 10% 20% 30% 40% 50% 60% 70% 80% 90% 100%
Value for money
Info provided inside bus
Freedom from litter
General condition - std of maintenance
Bus driver: the greeting/welcome you got
Bus driver: helpfulness/attitude
Bus driver: smoothness/freedom from jolting
Comfort of the seats
Punctuality
Temperature inside the bus
Waiting time
Freedom from graffiti/vandalism
Personal safety at stop
Overall satisfaction with bus stop
Bus driver: time to get to seat
Average
Interior cleanliness/condition
Exterior cleanliness/condition
Provision of grab rails to stand/move in bus
Personal security
Route/destination info
Availability of seating or space to stand
Bus driver: safety of the driving
Overall journey satisfaction
Bus driver: appearance
Time taken to board
Ease of getting onto/off the bus
Bus driver: nearness to kerb
2014 2011

© 2016 KPMG LLP, a UK limited liability partnership and a member firm of the KPMG network of independent member firms affiliated with KPMG International
Cooperative (“KPMG International”), a Swiss entity. All rights reserved. 23
3.3.3 Fares
Figure 5 shows fares indices by area type set against inflation. Between 2005 and 2014 fares
increased cumulatively in real terms by:
■ 23% in London.
■ 12% in England outside London.
■ 24% in metropolitan areas.
■ 4% in non-metropolitan areas.
Figure 5: Fares index (2005 = 100)
Source: DfT Bus statistics BUS0405a.
Within London, fares are set by the Mayor. Outside of London, fares are set for commercial services
by operators based on operating costs and market conditions. For supported services based on gross
cost contracts they are set by the LTA.
Figure 6 shows the relationship between fares and operating costs per journey for England (outside
of London), metropolitan areas and non-metropolitan areas since 2004/05. The charts show that fare
levels broadly follow trends in operator costs per journey – with some divergence in 2009/10 in
metropolitan areas.
Between 2005/06 and 2013/14 bus fares in England (outside of London), increased by the same rate
as increases in operating costs, with fares in metropolitan areas increasing at a faster rate than costs
and fares in non-metropolitan areas increasing as a slower rate than costs.
50.0
70.0
90.0
110.0
130.0
150.0
170.0
190.0
1995
1996
1997
1998
1999
2000
2001
2002
2003
2004
2005
2006
2007
2008
2009
2010
2011
2012
2013
2014
2005 =
100
RPI London Met areas Non-met areas England outside London

© 2016 KPMG LLP, a UK limited liability partnership and a member firm of the KPMG network of independent member firms affiliated with KPMG International
Cooperative (“KPMG International”), a Swiss entity. All rights reserved. 24
Figure 6: Trends in fares and operating costs per journey – England (outside of London), metropolitan
and non-metropolitan areas
Source: DfT Bus Statistics 2014, BUS0407b.
98100
107
100102
111
108
107
110
111
98
100
104
105 106
108 107
108
112
111
80.0
85.0
90.0
95.0
100.0
105.0
110.0
115.0
120.0
125.0
130.0
2004/05 2005/06 2006/07 2007/08 2008/09 2009/10 2010/11 2011/12 2012/13 2013/14
In
de
x 2005/06 =
100
England (outside of London)
Fares Cost per journey
98
100
109
106
109
123
119120
124 124
99
100
107
110111
114116
113
117
114
80.0
85.0
90.0
95.0
100.0
105.0
110.0
115.0
120.0
125.0
130.0
2004/05 2005/06 2006/07 2007/08 2008/09 2009/10 2010/11 2011/12 2012/13 2013/14
In
de
x 2005/06 =
100
Metropolitan areas
Fares Cost per journey
98100
105
95 96
103
100
98
101
103
97
100101
101100
102
99
103
106107
80.0
85.0
90.0
95.0
100.0
105.0
110.0
115.0
120.0
125.0
130.0
2004/05 2005/06 2006/07 2007/08 2008/09 2009/10 2010/11 2011/12 2012/13 2013/14
In
de
x 2005/06 =
100
Non-metropolitan areas
Fares Cost per journey

© 2016 KPMG LLP, a UK limited liability partnership and a member firm of the KPMG network of independent member firms affiliated with KPMG International
Cooperative (“KPMG International”), a Swiss entity. All rights reserved. 25
3.3.4 Operating costs
Figure 7 shows that operating costs per journey in England (outside of London) have risen by 14% in
real terms from £1.17p per journey in 2004/05 to £1.33 per journey in 2013/14. Operating costs in
metropolitan areas have increased by 15% over this period compared to 10% in non-metropolitan
areas. Costs per journey are materially higher in non-metropolitan areas primarily due to differences in
passenger loadings and trip lengths.
Figure 7: Operating costs per journey (2013/14 prices)
Source: DfT Bus Statistics BUS0407a.
Figure 8 shows operating costs per vehicle mile in England (outside of London) have increased by
22% from £2.54 in 2004/05 to £3.09 in 2013/14. Over the same period, costs per vehicle mile have
increased by 20% in metropolitan areas and 23% in non-metropolitan areas. Costs per mile are
around 8% higher in metropolitan areas compared with costs in non-metropolitan areas. This
difference could be related to higher levels of congestion and slower running speeds in
metropolitan areas.
Figure 8: Operating costs per mile (2013/14 prices)
Source: DfT Bus Statistics BUS0407b.
97 98
105108 109
112114
111
115112
138
142144 143 142
145
141
146
150152
117120
125 126 127129 128
130
134 133
60
70
80
90
100
110
120
130
140
150
160
2004/05 2005/06 2006/07 2007/08 2008/09 2009/10 2010/11 2011/12 2012/13 2013/14
In
de
x 2005/06 =
100
Met areas Non-met areas England outside London
269 271
293
313320
328328
317
325 324
244
250
273 275
281
288
280
291 292
299
254258
281
290
296
303
298301
305 309
200
220
240
260
280
300
320
340
2004/05 2005/06 2006/07 2007/08 2008/09 2009/10 2010/11 2011/12 2012/13 2013/14
pe
nce/veh
icle m
ile
Metropolitan areas Non-metroplitan areas England outside London

© 2016 KPMG LLP, a UK limited liability partnership and a member firm of the KPMG network of independent member firms affiliated with KPMG International
Cooperative (“KPMG International”), a Swiss entity. All rights reserved. 26
Fuel costs typically account for around 17% of total operating costs and labour costs typically account
for around 60%12
. Both have increased over the recent past.
Between 2000 and 2013 average diesel costs for operators rose from 41p per litre to 86p per litre
(2013 prices). The changes reflect changes in the price of oil as well as changes in taxation13
. Driver
wages have increased by 21% in real terms from £391 per week in 2000 to £472 per week in 2013,
with the rate of increase slowing in recent years. Driver wages have risen faster than the economy
wide average (8% in real terms). Driver earnings were around 68% of the average wage in 2000 but
have grown to around 76% in 201414
.
Labour productivity in the bus market in England (outside of London) is around 13,200 vehicle miles
per member of staff. It is 4% higher in non-metropolitan areas compared with metropolitan areas.
Labour productivity increased by 1% between 2004/5 and 2013/14 with a 3% increase in
metropolitan areas and a 1% fall in non-metropolitan areas.
Figure 9: Labour productivity – Total vehicle miles/total staff
Source: DfT Bus Statistics BUS0701 and 0205a.
3.3.5 Service miles
In 2013/14 supported services contributed 19% of total service miles in England (outside of London).
This estimate was lower for metropolitan areas (13%) than it was for non-metropolitan areas (22%).
Between 1987/88 and 2013/14 total vehicle miles in England (outside of London), including
commercial and supported service miles, fell by 2% from 1.014 billion miles to 0.993 billion miles.
Commercial services fell by 4% and supported services grew by 9%.
There are marked differences between metropolitan and non-metropolitan areas. Figure 10 shows a
longer term decline in local authority supported mileage in metropolitan areas and a long term
increase in local authority supported mileage in non-metropolitan areas. Both area types however
have experienced a sharp decline in supported services over the last five years largely reflecting cuts
to government funding. Between 2009/10 and 2013/14 supported service mileage fell by around
22% in metropolitan areas and 24% in non-metropolitan areas. These reductions were offset by
small increases in commercial service miles in non-metropolitan areas. The reduction in vehicle miles
does not appear to have led to a proportional reduction in patronage although anecdotal evidence
suggests that service reductions have had a disproportionately large impact on those in less densely
12 TAS Bus Industry Performance Monitor Autumn 2014, figure 6-1
13 TAS Bus Industry Performance Monitor Autumn 2014, figure 6-5
14 DfT Bus Statistics BUS0703b
10,500
11,000
11,500
12,000
12,500
13,000
13,500
14,000
14,500
2004/05 2005/06 2006/07 2007/08 2008/09 2009/10 2010/11 2011/12 2012/13 2013/14
Veh
icle m
iles/staff
Met areas Non-met areas England outside London

© 2016 KPMG LLP, a UK limited liability partnership and a member firm of the KPMG network of independent member firms affiliated with KPMG International
Cooperative (“KPMG International”), a Swiss entity. All rights reserved. 27
populated areas and those travelling outside of core operating times.
Figure 10: Bus service mileage index
Source: DfT Bus Statistics BUS0205a.
50
60
70
80
90
100
110
120
130
Veh
icle m
iles in
de
x –
2005/06 =
100
England (outside of London)
Commercial Local authority supported Total
50
60
70
80
90
100
110
120
130
140
Veh
icle m
iles in
de
x –
2005/06 =
100
Metropolitan areas
Commercial Local authority supported Total
50
60
70
80
90
100
110
120
130
Veh
icle m
iles in
de
x –
2005/06 =
100
Non-metropolitan areas
Commercial Local authority supported Total

© 2016 KPMG LLP, a UK limited liability partnership and a member firm of the KPMG network of independent member firms affiliated with KPMG International
Cooperative (“KPMG International”), a Swiss entity. All rights reserved. 28
3.3.6 Network stability
Data from the Traffic Commissioners annual report indicates that the number of bus service
variations has fallen from around 9,900 per year in 2002/03 to around 9,000 per year in 2013/14
(shown on the left hand axis of Figure 11).
Because the total number of service has actually declined by 18% over this period, the average
number of variations per service has increased from 0.42 to 0.47 (shown on the right hand axis of
Figure 11).
Figure 11: Number of new and cancelled services and service variations
Source: KPMG analysis of Traffic Commissioners Annual Reports.
3.3.7 Fleet quality
Figure 12 shows the average age of vehicles has remained relatively stable over recent years at
around eight years. The average vehicle age is slightly lower in metropolitan areas than it is for non-
metropolitan areas.
Figure 12: Average age of vehicles
Source: DfT Bus Statistics, BUS06.
There have been steady improvements to the fleet with regard to access for those with physical and
mobility impairments, CCTV coverage, automatic vehicle location (AVL) and smartcard (ITSO) readers
driven in part by government incentives. The proportion of vehicles with these features has increased
0.00
0.10
0.20
0.30
0.40
0.50
0.60
0
2,000
4,000
6,000
8,000
10,000
12,000
2002/03 2003/04 2004/05 2005/06 2006/07 2007/08 2008/09 2009/10 2010/11 2011/12 2012/13 2013/14
Variatio
ns p
er service
# o
f n
ew
service/variatio
ns
New Variations Cancelled Ratio of variations to services
0
2
4
6
8
10
2005/06 2006/07 2007/08 2008/09 2009/10 2010/11 2011/12 2012/13 2013/14
Averag
e a
ge
London Mets Non-mets England outside London

© 2016 KPMG LLP, a UK limited liability partnership and a member firm of the KPMG network of independent member firms affiliated with KPMG International
Cooperative (“KPMG International”), a Swiss entity. All rights reserved. 29
across all areas with higher rates of adoption in metropolitan areas relative to non-metropolitan areas
(Table 3).
Table 3: Percent of buses with low floors, CCTV, AVL and ITSO smart card readers
Percentage of vehicles
with London
England
(outside of
London) Mets Non Mets
Low floors/access 99 93 97 91
CCTV 98 77 89 70
AVL 99 90 96 86
ITSO 100 86 92 82
Source: DfT Bus statistics BUS0604-7.
Whilst these statistics show the take-up of technology across the fleet they do not show the extent
to which the equipment is actually utilised. According to the ITSO website15
as of 1 January 2015,
1,160 different types of concessionary and commercial tickets are supported on the system with
21,500 buses in England outside London using ITSO compatible equipment.
3.3.8 Government expenditure
Revenue expenditure
Government expenditure on local bus services includes: financial support for socially necessary
services, reimbursement to operators for carrying concessionary passengers and BSOG payments.
Figure 13 shows that between 1999/00 and 2013/14, total government support in England (outside of
London) increased by 34% in real terms from £1,032 million to £1,378 million in 2013/14 prices. Most
of this increase is related to increases in concessionary travel which increased by 97% over the same
period. Offsetting this, there was an 18% decline in BSOG. Concessionary travel support increased
by 65% in 2006/7 following the introduction of concessionary travel for older and disabled people
following the Concessionary Bus Travel Act in 2007.
Figure 13: Government revenue expenditure – (2013/14 prices)
15 https://www.itso.org.uk/about-us/facts-and-figures/
272 260 305 310 315 331 347 376 372 413 411 417 424 411 389 361 336 318
396 395410 408 409 418 402 405 425 396
657719
826 850 854807 806 804
230 222257 314 343 326 322 317 314 322
316330
344 343 329328
262 256
0
200
400
600
800
1,000
1,200
1,400
1,600
1,800
1996/97
1997/98
1998/99
1999/00
2000/01
2001/02
2002/03
2003/04
2004/05
2005/06
2006/07
2007/08
2008/09
2009/10
2010/11
2011/12
2012/13
2013/14
£ M
illio
n
England (outside of London)
Net public support Concessionary travel BSOG

© 2016 KPMG LLP, a UK limited liability partnership and a member firm of the KPMG network of independent member firms affiliated with KPMG International
Cooperative (“KPMG International”), a Swiss entity. All rights reserved. 30
Source: DfT Bus Statistics BUS0502b.
There have been significant differences in the level of revenue expenditure in different areas:
■ Non-metropolitan areas have seen a large increase in expenditure which has risen by 67% from
£516 million in 1999/00 to £864 million in 2013/14. This is mainly driven by a 247% increase in
expenditure on concessionary travel.
■ Metropolitan areas have seen a slight decrease over the same period falling from £516 million to
£514 million. This is primarily due to lower growth in expenditure on concessionary travel which
was by and large already provided before the statutory requirements were introduced.
These expenditure patterns are summarised in Figure 14 for England, London, England (outside of
London), metropolitan and non-metropolitan areas. The increase in expenditure in London from 2000
corresponds to heavy investment in service levels and increased demand.
152 138 152 137 141 144 136 142 128 140 152 152 154 148 134 137 127 122
250248
267265 264 258
245 240 263 230
293 302 319 334325 311 310 304
8887
97 114 125 120118 114 113
114
113 118122 119
114 11491 88
0
100
200
300
400
500
600
700
1996/97
1997/98
1998/99
1999/00
2000/01
2001/02
2002/03
2003/04
2004/05
2005/06
2006/07
2007/08
2008/09
2009/10
2010/11
2011/12
2012/13
2013/14
£ M
illio
nMetropolitan areas
Net public support Concessionary Travel BSOG
119 121 152 172 174 187 212 235 244 274 259 265 270 263 256 224 210 195
146 147143 144 146 160 157
165 162167
364417
507 515 530496 496 500
142 135159
200 217 205 204204 202
208
203
211
222 224 215
214172 169
0
200
400
600
800
1,000
1,200
1996/97
1997/98
1998/99
1999/00
2000/01
2001/02
2002/03
2003/04
2004/05
2005/06
2006/07
2007/08
2008/09
2009/10
2010/11
2011/12
2012/13
2013/14
£ M
illio
n
Non-Metropolitan areas
Net public support Concessionary travel BSOG

© 2016 KPMG LLP, a UK limited liability partnership and a member firm of the KPMG network of independent member firms affiliated with KPMG International
Cooperative (“KPMG International”), a Swiss entity. All rights reserved. 31
Figure 14: Total estimated revenue expenditure by area (2013/14 prices)
Source: DfT Bus Statistics BUS0502b.
Figure 15 shows total revenue expenditure per passenger journey between 2004/05 and 2013/14.
Non-metropolitan areas have the greatest revenue expenditure, currently around 66p per journey,
with metropolitan areas spending 51p per journey. The divergence in the level of expenditure
between metropolitan and non-metropolitan areas since 2005/6 is largely related to changes in
concessionary travel.
Figure 15: Revenue expenditure per passenger journey (2013/14 prices)
Source: DfT Bus Statistics BUS0503b.
Revenue expenditure per vehicle mile shows a slightly different pattern. Between 2003/04 and
2013/14 revenue expenditure per vehicle mile increased by 31%. Expenditure in non-metropolitan
areas increased by 45% compared to 13% in metropolitan areas over this period. Metropolitan areas
receive higher levels of expenditure at £1.51 per vehicle mile in 2013/14 compared to £1.32 for
non-metropolitan areas. The differences between areas reflect differences in average occupancy and
average speeds, as well as changes in the availability of concessionary travel.
0
500
1,000
1,500
2,000
2,500
3,000
£ M
illio
n
England London English metropolitan areas
English non-metropolitan areas England outside London
0
10
20
30
40
50
60
70
80
90
2004/05 2005/06 2006/07 2007/08 2008/09 2009/10 2010/11 2011/12 2012/13 2013/14
Pe
nce\p
assen
ge
r jo
urn
ey
Mets Non-mets

© 2016 KPMG LLP, a UK limited liability partnership and a member firm of the KPMG network of independent member firms affiliated with KPMG International
Cooperative (“KPMG International”), a Swiss entity. All rights reserved. 32
Figure 16: Revenue expenditure per vehicle mile (total) (2013/14 prices)
Source: DfT Bus Statistics BUS0205 and BUS052b.
Considering only supported services, government expenditure per vehicle mile is highest for
metropolitan areas at £2.71, relative to £1.37 in non-metropolitan areas (Figure 17). Metropolitan
areas have also shown a slight increase in expenditure, rising by 3% from 2003/04 and 2013/14
compared to -11% in non-metropolitan areas. There has been a 17% increase in the level of tender
support for metropolitan areas since 2010/11.
Figure 17: Government expenditure for supported services per tendered service mile
Source: DfT Bus Statistics BUS0205 and BUS052b.
Figure 18 shows that there are large variations in the proportion of service miles supported by local
authorities. Across all local authorities the average proportion of tendered route vehicle mileage is
21%. For PTE areas the average is lower at 13%.
0.00
0.20
0.40
0.60
0.80
1.00
1.20
1.40
1.60
1.80
2003/04 2004/05 2005/06 2006/07 2007/08 2008/09 2009/10 2010/11 2011/12 2012/13 2013/14
£ p
er veh
cile m
ile
Mets Non-Mets England outside London
0.00
0.50
1.00
1.50
2.00
2.50
3.00
3.50
2003/04 2004/05 2005/06 2006/07 2007/08 2008/09 2009/10 2010/11 2011/12 2012/13 2013/14
£ p
er veh
cile m
ile
Mets Non-Mets England outside London

© 2016 KPMG LLP, a UK limited liability partnership and a member firm of the KPMG network of independent member firms affiliated with KPMG International
Cooperative (“KPMG International”), a Swiss entity. All rights reserved. 33
Figure 19 provides a ranking of the sum of revenue support for supported services and concessionary
fare reimbursement per vehicle mile by local authority area. Given variation between years, the
estimates of expenditure are averaged over the last four years and reported in 2013/14 prices.
Estimates of vehicle miles are for 2013/14 only. The chart shows significant variation in the level of
expenditure ranging from 2p in Stoke and Derby to £1.19 in West Berkshire. The average across the
local authorities is 35p, PTE areas tend to pay slightly more with an average of 38p.
Differences in support between areas reflect differences in demographics, concessionary
travel policy, the commercial strength of the local bus, network conditions and competition
between operators.

© 2016 KPMG LLP, a UK limited liability partnership and a member firm of the KPMG network of independent member firms affiliated with KPMG International
Cooperative (“KPMG International”), a Swiss entity. All rights reserved. 34
Figure 18: Proportion of total service miles
supported by the local authority (left hand chart)
Figure 19: Net support and concessionary travel
per vehicle mile (right hand chart)
Source: DfT Bus Statistics BUS0208a. Source: DfT Bus Statistics BUS0208a and BUS0505b.
0 10 20 30 40 50 60 70
West Berkshire
North East Lincolnshire
Wiltshire
Rutland
Surrey
Lincolnshire
North Lincolnshire
Herefordshire, County of
Shropshire
South Gloucestershire
Kingston upon Hull, City of
Wokingham
Gloucestershire
Cheshire East
North Yorkshire
Devon
Warwickshire
Windsor and Maidenhead
Central Bedfordshire
Worcestershire
Cheshire West and Chester
East Riding of Yorkshire
Leicestershire
Cornwall
Bracknell Forest
Dorset
Lancashire
Nottinghamshire
Northumberland
Somerset
Derbyshire
Poole
Norfolk
Suffolk
East Sussex
Buckinghamshire
Hampshire
Oxfordshire
Staffordshire
Kent
Hertfordshire
Essex
Medway
Greater Manchester ITA
Merseyside ITA
Bath and North East Somerset
Durham
Milton Keynes
Bristol, City of
Cumbria
Blackburn with Darwen
Reading
Stockton-on-Tees
Peterborough
Bedford
West Yorkshire ITA
Luton
West Sussex
Cambridgeshire
York
Thurrock
Halton
Swindon
Nottingham
Plymouth
South Yorkshire ITA
Northamptonshire
Telford and Wrekin
West Midlands ITA
Tyne and Wear ITA
Warrington
Isle of Wight
Brighton and Hove
Southend-on-Sea
Stoke-on-Trent
Slough
Bournemouth
Portsmouth
Southampton
North Somerset
Middlesbrough
Torbay
Blackpool
Redcar and Cleveland
Darlington
Derby
Leicester
Hartlepool
% of supported services
0 0.20 0.40 0.60 0.80 1.00 1.20
West Berkshire
Surrey
Wiltshire
Herefordshire, County of
South Gloucestershire
Rutland
Cheshire East
Somerset
Windsor and…
Worcestershire
Shropshire
Nottinghamshire
Greater Manchester ITA
Wokingham
Cheshire West and…
East Riding of Yorkshire
Suffolk
Milton Keynes
Hampshire
Cornwall
Bedford
Bracknell Forest
North Yorkshire
West Yorkshire ITA
East Sussex
Derbyshire
Dorset
Warrington
Merseyside ITA
Essex
Medway
Central Bedfordshire
Lincolnshire
Leicestershire
Hertfordshire
Warwickshire
Lancashire
Bristol, City of
Poole
Staffordshire
Devon
Blackburn with Darwen
Halton
Gloucestershire
Kent
Oxfordshire
North Lincolnshire
Peterborough
Cambridgeshire
South Yorkshire ITA
West Midlands ITA
Tyne and Wear ITA
Durham
Norfolk
Cumbria
North Somerset
Redcar and Cleveland
West Sussex
Stockton-on-Tees
Northamptonshire
Buckinghamshire
Reading
Telford and Wrekin
Slough
Swindon
Plymouth
Portsmouth
York
Southampton
Bath and North East…
Brighton and Hove
Isle of Wight
Kingston upon Hull,…
Leicester
Northumberland
Hartlepool
Darlington
Nottingham
Torbay
Blackpool
Bournemouth
Middlesbrough
Southend-on-Sea
North East Lincolnshire
Derby
Stoke-on-Trent
Luton
Thurrock
£ per vehicle mile
NA NA
NA

© 2016 KPMG LLP, a UK limited liability partnership and a member firm of the KPMG network of independent member firms affiliated with KPMG International
Cooperative (“KPMG International”), a Swiss entity. All rights reserved. 35
Capital expenditure
Based on public expenditure statistics available from 2005/06, local government capital expenditure
on local public transport in England increased from £389 million in 2007/08 to £865 million in 2009/10.
It then remained relatively stable between 2009/10 and 2011/12, before falling slightly in 2012/13 and
increasing again in 2013/14.
Figure 20: Government capital expenditure on public transport (2013 prices)
Source: DfT Transport Expenditure TSGB1302.
It is however important to note that data shows capital expenditure on all of local public transport
projects and not just local bus infrastructure. By its nature, this type of expenditure is infrequent and
often concentrated on specific schemes. It is therefore difficult to draw conclusions on spending on
local bus schemes.
That said, in order to promote improvements in local bus services, central government has made
available specific funds for either bus infrastructure, technology improvements or new vehicles. The
most relevant recent funds introduced by the government are the Better Bus Area fund, with £70
million allocated, and the Green Bus Fund, with £88 million allocated. The Growth Deals announced
in 2014 also included local bus infrastructure projects.
3.4 Geographical variation in demand
Given the importance of maintaining high levels of demand to achieving stakeholders’ commercial,
economic, social and environmental objectives (see Section 4.2), this section of the report
considers the factors that influence demand and why the performance of the bus market differs
between areas.
The geographical variation in the bus market share for the journey to work is shown in Figure 21. As
might be expected, bus services have a higher market share in densely populated areas and a lower
share in less densely populated areas. Of the 348 districts assessed, 101 districts have bus shares
under 2.5% and 18 districts have bus market shares over 15%. The un-weighted average market
share across all districts is 6%.
446410
389
436
865839 847
720
1079
0
200
400
600
800
1000
1200
2005/06 2006/07 2007/08 2008/09 2009/10 2010/11 2011/12 2012/13 2013/14
£ m
illio
n

© 2016 KPMG LLP, a UK limited liability partnership and a member firm of the KPMG network of independent member firms affiliated with KPMG International
Cooperative (“KPMG International”), a Swiss entity. All rights reserved. 36
Figure 21: Bus mode share for the journey to work
Source: KPMG analysis of 2011 Census journey to work data by district
Table 4 shows the top and bottom ranked local authority areas in terms of bus trips per person.
Outside London, the highest levels of bus trips per person are found in Brighton and Hove and
Nottingham, where journeys per person per year were above 150 in 2013/14. The lowest levels of
bus use are found in rural and smaller urban areas.
Importantly, Table 4 also shows variation in trip rates within areas between 2009/10 and 2013/14,
suggesting that individual markets experience significant variation in demand over time.
Manchester
Merseyside
Nottingham
Leicester
West Midlands
Tyne and Wear
Hull
Bournemouth
Brighton and Hove
Reading
Oxford

© 2016 KPMG LLP, a UK limited liability partnership and a member firm of the KPMG network of independent member firms affiliated with KPMG International
Cooperative (“KPMG International”), a Swiss entity. All rights reserved. 37
Table 4: Bus journeys per person by local authority (ranked top and bottom)
Rank Local authority Trips pp 2009/10 Trips pp 2013/14 Change
Top 10 local authorities
1 Brighton and Hove 154.0 164.7 7%
2 Nottingham 162.8 157.0 (4)%
3 Reading 108.3 111.1 3%
4 Tyne and Wear ITA 118.7 109.4 (8)%
5 West Midlands ITA 116.8 100.9 (14)%
6 Bournemouth 89.5 96.4 8%
7 Kingston upon Hull, City of 101.9 93.2 (9)%
8 Merseyside ITA 98.6 90.0 (9)%
9 Leicester 106.0 81.2 (23)%
10 Greater Manchester ITA 84.0 80.1 (5)%
Bottom 10 local authorities
79 Cornwall 19.8 18.5 (7)%
80 Shropshire 19.9 17.5 (12)%
81 Somerset 18.6 16.4 (12)%
82 Bracknell Forest 18.8 16.3 (13)%
83 Cheshire East 14.7 15.3 4%
84 Herefordshire, County of 17.0 15.0 (12)%
85 Central Bedfordshire 15.6 14.0 (10)%
86 Wokingham 13.0 13.3 2%
87 Windsor and Maidenhead 16.1 11.6 (28)%
88 Rutland 8.0 10.6 33%
Average all local authorities 49.2 46.5 (5)%
Source: DfT Bus Statistics Table BUS0110a.
3.4.1 What drives geographic variation in bus use
There are a range of factors that have an important influence on the demand for local bus services,
only some of which can be influenced by operators and LTAs. The factors include, but are not
necessarily limited to:
■ Socioeconomic characteristics of service catchment areas.
■ Land use patterns and controls.
■ Attractiveness of bus relative to other modes of transport.
■ Local and national transport policy and expenditure.
■ Market structure and operator conduct.
■ Relationships between LTA and operators.

© 2016 KPMG LLP, a UK limited liability partnership and a member firm of the KPMG network of independent member firms affiliated with KPMG International
Cooperative (“KPMG International”), a Swiss entity. All rights reserved. 38
Socioeconomic characteristics
The socioeconomic characteristics of service catchment are an important driver of demand. Whilst
many of the relationships between bus demand and individual demand drivers are complex, there is
empirical evidence to suggest that the following socioeconomic characteristics are likely to be
important: levels of private vehicle ownership, the composition of the population (including the
number of students), household income and employment levels.16,17
Importantly, the relationships
between these variables and land use patterns in particular will influence the strength and vibrancy of
city/town centres and subsequently the demand for public transport.
Figure 22 shows a strong association between car ‘ownership’ and the demand for bus travel. Whilst
the causality of the relationship may not be absolutely certain, data from the Department for
Transport’s National Travel Survey shows that once a household acquires a vehicle, the number of
times they use the bus dramatically reduces.
Figure 22: Bus journeys per person (2013) against % of households without access to a car (2011)
Land-use patterns
The relationship between land-use and public transport is complex, incorporating aspects of
settlement size, mix of land-use, availability of local facilities, dwelling types, complexity of transport
networks, parking availability and population density, for example.
Whilst the relationships between the different aspects of land-use are complex, Figure 23 shows that
areas with high population density tend to have higher levels of bus use with an additional 1,000
people per square km associated with an additional 13 trips per head on average.
16 Balcombe et al (2004) The demand for public transport: a practical guide, TRL Report TRL593
17 Dargay, J.M and Hanly, M. (2002) The demand for local bus services in England. Journal of Transport Economics and Policy
Bournemouth
Brighton and Hove
Cumbria
Greater Manchester ITA
Kingston upon Hull, City of
LeicesterMerseyside ITA
Middlesbrough
Nottingham
Oxfordshire
Plymouth
Reading
Rutland
Southend-on-Sea
Stoke-on-TrentTorbay
Tyne and Wear ITA
West Midlands ITA
West Yorkshire ITA
y = 286.63x - 19.804
R² = 0.6455
0.0
20.0
40.0
60.0
80.0
100.0
120.0
140.0
160.0
180.0
0% 5% 10% 15% 20% 25% 30% 35% 40% 45% 50%
Bu
s jo
urn
eys p
er p
erso
n (2013)
% of households without access to a car (2011)
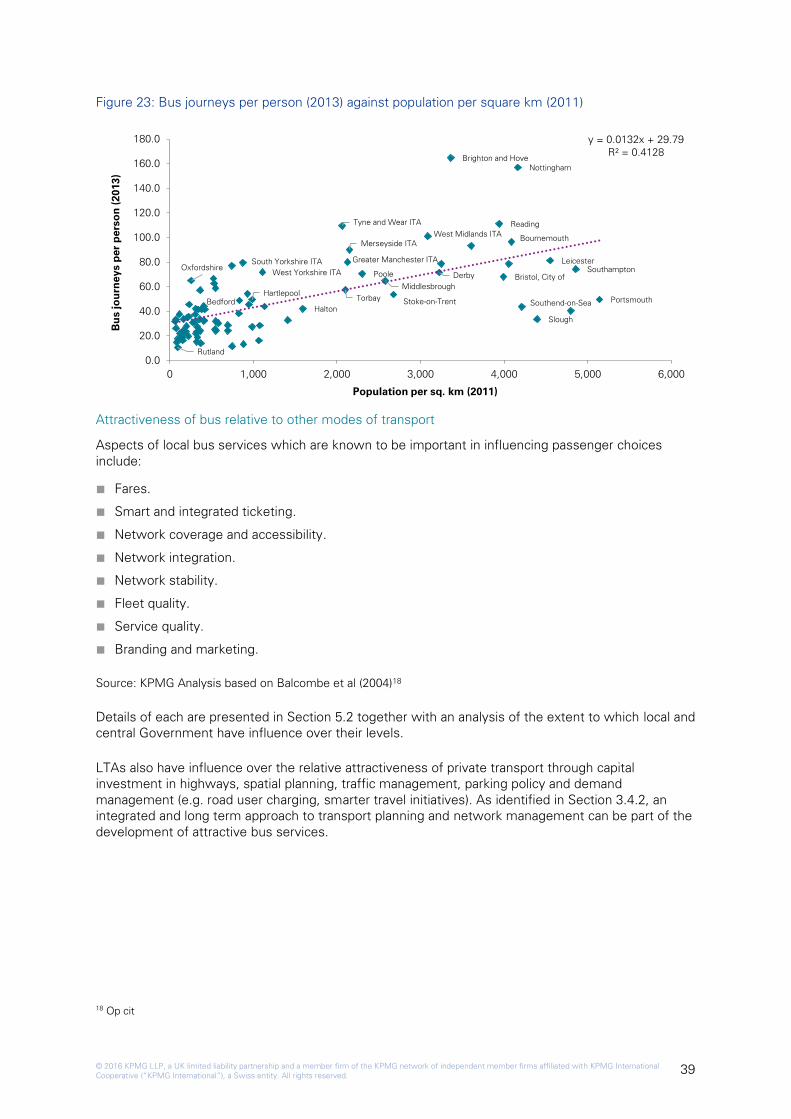
© 2016 KPMG LLP, a UK limited liability partnership and a member firm of the KPMG network of independent member firms affiliated with KPMG International
Cooperative (“KPMG International”), a Swiss entity. All rights reserved. 39
Figure 23: Bus journeys per person (2013) against population per square km (2011)
Attractiveness of bus relative to other modes of transport
Aspects of local bus services which are known to be important in influencing passenger choices
include:
■ Fares.
■ Smart and integrated ticketing.
■ Network coverage and accessibility.
■ Network integration.
■ Network stability.
■ Fleet quality.
■ Service quality.
■ Branding and marketing.
Source: KPMG Analysis based on Balcombe et al (2004)18
Details of each are presented in Section 5.2 together with an analysis of the extent to which local and
central Government have influence over their levels.
LTAs also have influence over the relative attractiveness of private transport through capital
investment in highways, spatial planning, traffic management, parking policy and demand
management (e.g. road user charging, smarter travel initiatives). As identified in Section 3.4.2, an
integrated and long term approach to transport planning and network management can be part of the
development of attractive bus services.
18 Op cit
Bedford
Bournemouth
Brighton and Hove
Bristol, City ofDerby
Greater Manchester ITA
Halton
Hartlepool
Leicester
Merseyside ITA
Middlesbrough
Nottingham
Oxfordshire
Poole
Portsmouth
Reading
Rutland
Slough
South Yorkshire ITA
Southampton
Southend-on-SeaStoke-on-TrentTorbay
Tyne and Wear ITA
West Midlands ITA
West Yorkshire ITA
y = 0.0132x + 29.79
R² = 0.4128
0.0
20.0
40.0
60.0
80.0
100.0
120.0
140.0
160.0
180.0
0 1,000 2,000 3,000 4,000 5,000 6,000
Bu
s jo
urn
eys p
er p
erso
n (2013)
Population per sq. km (2011)

© 2016 KPMG LLP, a UK limited liability partnership and a member firm of the KPMG network of independent member firms affiliated with KPMG International
Cooperative (“KPMG International”), a Swiss entity. All rights reserved. 40
Local and national transport policy and expenditure
Wider elements of transport policy can have an important effect on the performance of the bus
market. LTAs have a range of policy options available to them including the use of voluntary and
statutory partnerships which can be used to achieve some degree of coordination in the local market.
The LTA also has an important role in wider transport policy through for example the provision of bus
stops and bus infrastructure such as bus priority and signalling (towns such as York and Reading
operate park and ride sites for example), information and marketing material, the introduction of
integrated or smarter ticketing and the general local coordination and marketing of the bus network.
The LTA also has a key role in designing transport projects and bidding for central government
funding as well as the management of the local road network which can have an effect on the
efficiency of bus services. The focus of an LTA on the use of bus services in a local area is a key
factor in the success of the bus market.
Market structure and operator conduct
The structure of the local market and the performance of operators is key to a successful bus market.
This depends on several factors – the number of competitors in the local area, their conduct, their
performance in meeting passenger needs and the general approach and success of the local
operators in competing with car and other modes of transport. There is a wide variation of approach
between operators and some appear more successful than others for example in the marketing,
branding and pricing of bus services to meet local needs. There are differences for example in the
level and quality of information that operators collect on passengers preferences and service quality
performance. Competition can play an important role in this process, although market contestability
rather than on-road competition may also be effective (see Section 4.4).
Relationships between LTA and operators
Relationships between operators and LTAs differ between areas. Some LTAs have much better
relationships with bus operators than others. Good relationships between the two parties can help
the bus market to achieve better outcomes for all stakeholders by improving mutual understanding
between groups over objectives, opportunities and constraints. For example sharing information on
points of congestion, new developments and other planning information available to LTAs can assist
operators in planning services. Bids for government funding often require joint working between
operators and LTAs.
3.4.2 Case studies
As noted in Section 3.4.1 there are various reasons why some areas have higher levels of bus
demand than others, some of these relate to the specific features of the local market, some relate to
operator conduct and some relate to LTA policy and expenditure. To bring the different strands of
analysis together we set out below details for two case study markets which experience high
demand for services: Brighton and Hove and Nottingham.
Brighton and Hove
Brighton and Hove has the highest rate of bus use per person of all the LTA areas outside of London,
with each person taking an average of 165 trips per year in 2013/14. A review of the area suggests
this is the result of favourable socio-economic and geographic conditions supported by high levels of
effective public and private investment, occurring within a long standing partnership agreement.
Socio-economic and geographic conditions are positive with low level car ownership and high
population density. Almost all (93%) of routes in the area are run on a commercial basis whilst at the
same time the market is highly concentrated with the largest operator having 94% of the market.
These underlying market characteristics imply Brighton and Hove should have a high level of bus use,
however they do not fully explain why demand should be significantly higher than similar areas.

© 2016 KPMG LLP, a UK limited liability partnership and a member firm of the KPMG network of independent member firms affiliated with KPMG International
Cooperative (“KPMG International”), a Swiss entity. All rights reserved. 41
In explaining this higher level of bus use the Council has stated it is the result of sustained public and
private investment which has helped to facilitate a virtuous circle. In particular, some private
operators have highlighted the bus priority measures introduced by the council as a key factor
enabling them to expand services. Some of the notable investments have been in smart cards, night
services and ‘talking’ bus stops. Furthermore in 2011, Brighton City Council, in conjunction with
Brighton & Hove Bus Company, successfully bid for £3.4 million of government funding from the DfT
to introduce a series of bus service improvements in parts of the city. This included the introduction
of new bus lanes and wider accessibility improvements.
Car policies may also have had a positive impact on bus use, as local parking charges are set, at least
in part, to help encourage public transport use. As such, in 2004, parking charges were increased to
be more expensive than the cost of a daily travel pass on the local bus network.
Operators have also made investments in services and have been innovative in the manner of
branding and advertising they have adopted19
. Currently, the main operator has a wide range of
technological advanced offerings such as: real time passenger information (RTPI), a mobile app with
live journey times, smart ticketing, a website with a journey planner, and free Wi-Fi on certain routes.
A well-established partnership has existed between the council and the main operator which was set
up informally in 1997. This was cited as an example of good practice by the House of Commons
Select Committee on Transport in 2006. As part of this partnership, it was agreed that the operator
and the local authority would have defined responsibilities, as set out in Table 5. It is likely that the
partnership approach has helped to facilitate effective public and private investment and encouraged
higher levels of bus use.
Table 5: Brighton Voluntary Bus Partnership roles and responsibilities
Bus operator Local authority
Value for money fares Bus Priority measures
Investment in new vehicles Parking restrictions
Frequent services Infrastructure improvements at bus stops
Good marketing message Real Time Information/satellite tracking
Investment in staff training Traffic regulation enforcement
Nottingham
Nottingham has the second highest bus usage per person of an LTA outside of London, with 157
average journeys made per person in 2013/14. The area has favourable socio-economic and
geographic characteristics. It has the third lowest level of households with access to a car and
seventh highest population density in England, a vibrant city centre, limited local rail services and well
regarded local bus operators. Around 88% of the bus network is run commercially, with most of this
operated by the municipal bus operator – Nottingham City Transport20
– which supplies 79% of the
market and operates at arm’s length from the Council.
Nottingham is the only city to have implemented a workplace parking levy (WPL) and the first to
introduce an area based Statutory Bus Quality Partnership Scheme (SQP). The WPL requires large
businesses in the city to pay an annual levy of £375 for every workplace car park space above a
threshold. The levy is not seen as a way to manage demand but rather as a way to raise funds to
support other transport projects including the construction of the Nottingham Express Transit tram
19 http://www.buses.co.uk/information/onthebus.aspx
20 Nottingham City Transport is also well regarded as an operator, twice winning Operator of the Year at the UK Bus Awards, based on
a strong track record of investment, growth and commercial innovation supported by high levels of mystery traveller scores.

© 2016 KPMG LLP, a UK limited liability partnership and a member firm of the KPMG network of independent member firms affiliated with KPMG International
Cooperative (“KPMG International”), a Swiss entity. All rights reserved. 42
service. The availability of such services is likely to make the use of public transport more attractive
to residents.
The SQP covers the entire city centre area covering around 100 bus stops and two bus stations. It
regulates the number and quality of buses using each bus stop and provides a free shuttle bus across
the centre so that other services can cut short their routes to the edge of the centre, reducing
congestion in the central area.
The city has also been very successful in securing funding for transport projects from central
government. It has secured funding through the Better Bus Area, City Deal, LSTF and the Green Bus
Fund. These funds have all been used to support the development of the bus market. The Better Bus
Area fund granted the city around £11 million – one of the largest amounts granted to any local
authority – to improve bus services in the city through investment in bus priority, signal priority and
development of the cities smartcard and real-time information systems. The city has also adopted a
wide range of transport policy options, including formal plans related to:
■ Public transport information 2014-19.
■ Bus Strategy 2014-18.
■ Cycle Action Plan.
■ Smart card and integrated ticketing strategy.
■ Rights of way improvement plan.
In addition the city operates a successful park and ride service linking two sites and a tram service to
two non-central major hospitals. The council also operates the Linkbus network of 50 branded routes
through minimum cost tenders. These routes are equipped with RTPI, smart cards and bus priority
measures. The network is supported with 10 funding partners including colleges, hospitals and
major employers.
3.5 Stakeholder perspectives
We undertook interviews with 25 stakeholders who provided views on the challenges and
opportunities faced by local bus markets in England.
In the following table we provide a summary of stakeholder views with regards to objectives for the
market and performance of the market. It is important to note that the analysis reported here is
qualitative rather than quantitative. It reflects the range of views expressed but strictly does not
reflect the views of any specific individual or organisation. The summary has not been endorsed or
approved by any of the respondents. In many cases, there was no consensus on certain topics
across stakeholder groups.
.

© 2016 KPMG LLP, a UK limited liability partnership and a member firm of the KPMG network of independent member firms affiliated with KPMG International Cooperative (“KPMG International”), a Swiss entity. All rights reserved.
43
Table 6: Summary of stakeholder perspectives on market analysis
Q1. What are your objectives for the bus market?
LTAs and operators noted a range of objectives but there was consistency on several points including the need to maintain or expand local bus networks
and levels of usage, to utilise buses to achieve wider economic and social objectives and to improve the appeal of bus services relative to other modes to
reduce congestion and achieve wider transport objectives. Whilst there was good alignment between stakeholder objectives there are potentially some
tensions between value for money for public expenditure and operator returns.
■ Grow the market, make long term investments
■ Make a profit/return to shareholders
■ Supporting communities and wider benefits e.g.
environmental benefits
■ Achieve modal shift
■ Understand passengers needs
■ Support economic growth
■ Increase patronage
■ Preserving accessibility (maintain/increase network
coverage)
■ Improve VfM
■ Grow the market
■ Provide a return to investors through profits
■ Offer high quality products based on customer knowledge
Large operators
PTEs
Other operators
■ Provide access to health care, jobs, schools and key
services
■ Get best value from tendered services
■ Grow the network
■ Improve accessibility
■ For buses to play a greater role in local transport
■ Achieving growth
■ Understand and meet passenger needs
Local authorities
Associations

© 2016 KPMG LLP, a UK limited liability partnership and a member firm of the KPMG network of independent member firms affiliated with KPMG International Cooperative (“KPMG International”), a Swiss entity. All rights reserved.
44
Q2a. What currently works well, and why?
Most stakeholder groups agreed that in general levels of passenger satisfaction across the country are high and the commercial aspects of the market
generally provide benefits to passengers through promoting innovation, service quality, flexibility and efficiency. There was consensus that there was a
great deal of variability across the bus market from one region to another particularly amongst the local authorities, and that there are many examples of
high performing markets where high levels of passenger growth are being experienced.
■ The ability to respond quickly to market demands
■ Passenger satisfaction levels are very high
■ There are lots of regional examples where high passenger
growth is occurring
■ Market forces driving efficient use of assets, and keeping
prices down
■ Some good relationships with operators through
partnerships
■ Vehicle investment
■ Customer satisfaction
■ Innovation and investment to meet customer needs
■ Relationship with and understanding of customer needs,
and the speed at which these can be met through the
current model
■ The quality of the offering and customer satisfaction scores
Large operators
PTEs
Other operators
■ There are some good relationships between LA, operators
and other stakeholders
■ Some good examples of growth that have been achieved,
notably in Brighton and Cambridgeshire
■ There’s a great deal of variation from one region to another
■ Factors identified include:
– Where there’s a good partnership with shared aims
between operators and LA
– ‘Good’ bus markets tend to be in big cities
– Where buses are key to achieving local aims it drives
input from the LA
■ Overall satisfaction with the market is high
Local authorities
Associations

© 2016 KPMG LLP, a UK limited liability partnership and a member firm of the KPMG network of independent member firms affiliated with KPMG International Cooperative (“KPMG International”), a Swiss entity. All rights reserved.
45
Q2b. What currently doesn’t work well, and why?
In respect of the elements of the market that weren’t felt to be working well, large operators noted a lack of investment in traffic management, sub-
optimal use of partnerships and limitations under Competition Law as to how coordination of services can be achieved. PTEs noted a decline in passenger
demand arising in part from fragmentation and complexity of services. Passenger value for money was also highlighted as an issue based on Transport
Focus survey data.
■ Investment in priority schemes, sufficient emphasis on
journey times and reliability
■ There are no incentives for highways authorities to provide
reliable infrastructure
■ Competition issues limit to what can be achieved between
operators
■ Volume of passenger decline, and bus performance
compared to other modes of public transport
■ Gaps in service offering for young people
■ Complex fares and fragmented ticketing products
■ Integration with other modes of transport
■ Road space utilisation, not enough bus priority schemes
■ Not enough focus on the infrastructure to provide punctual
services
■ LA tendering of supported services is wasteful and slow
Large operators
PTEs
Other operators
■ Cuts to funding resulting in fewer tendered services
■ Lack of competition for tendered services
■ Number of changes that operators make to services in a
year
■ The image of the bus does not reflect its role in society.
■ Large variation in quality across the country
■ There’s too much short-term thinking in the industry
particularly with respect to fares structures
■ Bus services don’t respond well to shifts in population and
travel patterns, for example the lengthening of the evening
peak
■ Development and incubation of competition
Local authorities
Associations

© 2016 KPMG LLP, a UK limited liability partnership and a member firm of the KPMG network of independent member firms affiliated with KPMG International Cooperative (“KPMG International”), a Swiss entity. All rights reserved.
46
Q3. What do passengers want that isn’t currently being delivered?
There was general consensus amongst operators and LTAs that passengers want punctual, reliable services with consistent journey times, and simplified
ticketing and the wider availability of interoperable tickets. Some stakeholders also identified a desire for simplified and consolidated information on
journey timetables and route maps.
■ Consistency of journey time
■ Reduced journey time/increase route speed
■ Simplification of ticketing, particularly across all operators
■ Expand provision of attractive services on vehicle e.g. Wi-Fi
and charging points.
■ Simple ticketing
■ Value for money, particularly for young people where there
is a lack of discount products, and where more than one
operator is used
■ Better access to information and clarity of information
■ Reliability/punctuality of services
■ Additional services/frequencies which aren’t always
commercial e.g. weekend and evening services
■ Greater simplicity of services and fares
■ Value for money is not that high on customer priority list
Large operators
PTEs
Other operators
■ Punctuality and reliability are a common issue
■ Increased services in weekends and evenings
■ Fares levels are not seen as a significant issue
■ Smart ticketing
■ Better access to information and data
■ Simpler fares structures
■ Multi –modal ticketing
■ Services which better reflect passenger needs e.g. later
evening services and weekends
■ More punctual services
Local authorities
Associations

© 2016 KPMG LLP, a UK limited liability partnership and a member firm of the KPMG network of independent member firms affiliated with KPMG International Cooperative (“KPMG International”), a Swiss entity. All rights reserved.
47
Q4. What is the best way to increase bus patronage?
■ Improving journey time speed and reliability
■ Keep costs down compared to other modes of transport
■ London:
■ Growth is not unique to London, there are lots of examples
of high performing bus networks outside of London
■ There are many specific factors to London which determine
the market:
– It’s economic and population growth
– Congestion charging and high parking charges
– Political will
– High level of subsidy
– Oyster card
– Level of information
■ Make the system simple to understand
■ Take control of fares
■ Replicate what TfL have done
■ Make the offer more inviting, become more customer centric
■ There are many specific factors in London which determine
the market:
– Congestion charging
– Volume of passengers
– Very clear network and information availability
– Political decision to invest/heavily subsidise
■ Simplicity of offering and integration
Large operators PTEs

© 2016 KPMG LLP, a UK limited liability partnership and a member firm of the KPMG network of independent member firms affiliated with KPMG International Cooperative (“KPMG International”), a Swiss entity. All rights reserved.
48
Q4. What is the best way to increase bus patronage? (cont.)
There were divergent opinions on how the market could be encouraged to grow, which largely reflect the issues that the various stakeholders experience
locally. Common points included: better punctuality, introduction of an easy to understand network, better integrated ticketing and information for
passengers, simpler routes and higher frequencies and investment in bus infrastructure are key to achieving patronage growth.
There was a high degree of consensus across all stakeholders as to the particular reasons why the London bus market has grown to the extent that it has,
with most recognising that it is a unique market with strong political will to invest in all forms of public transport.
■ Passenger’s biggest concern is punctuality
■ Many factors are outside of the bus industry’s control for
example reduced city centre jobs and shopping
■ Cars are the main competition, and in addition they cause
congestion. Curbing car use and promoting public transport
would help. This can be done if buses allow users to be
more productive e.g. through Wi-Fi
■ London is a unique market. There are lots of factors not
seen elsewhere:
– Funding/level of subsidy
– Low car ownership and usage
– Bus-only infrastructure
– Congestion charging
■ Socio-economic factors
Other operators
■ There have been examples of good growth in some LA.
Where this has occurred this has been due to:
■ Increasing punctuality and reliability by use of guided
busways
■ Greater investment in infrastructure e.g. bus stops
■ Use of kick-start funding to allow the commercial network to
develop new routes
■ Need to develop a simple easy to use network with good
access to information e.g. RTI
■ Improve quality and consistency of services, give
passengers confidence in using bus services
■ Bus use has typically grown where there is an environment
which has helped it, e.g. expensive parking, high population
density
■ Having strong political will to use buses to resolve wider
economic, social and environmental issues
■ London is unique in the level of subsidy it receives. Other
LA could achieve similar outcomes with this level of subsidy
■ Operator profit levels are lower in London, however this is
due to accounting treatments over a franchise period. This
probable accounts for 50% of the profit gap between
London operators and regional operators
■ London has many unique factors:
– Interchange opportunities
– High frequency services
– High population density
– Fully integrated ticketing
Local authorities
Associations
■ Reductions in fares
■ In some cases high levels of growth have been achieved,
but from a low starting point.
■ Good relationships with bus operators and active
engagement over issues for the market
Local authorities
(cont.)

© 2016 KPMG LLP, a UK limited liability partnership and a member firm of the KPMG network of independent member firms affiliated with KPMG International Cooperative (“KPMG International”), a Swiss entity. All rights reserved.
49
Q5. Is greater coordination of services between operators desirable and, if so, how can it be achieved?
There was broad agreement that greater coordination of services between operators is desirable in some areas, although operators, PTEs and local
authorities often stated that there were trade-offs between coordination, competition and innovation. Many stakeholders identified that Competition Law,
or the perceived threat of Competition Law limited what could be achieved by operators and that LTAs need to take a leading role in achieving greater
coordination of services to reduce this risk. Some stakeholders stated that the benefits of greater coordination depended on the needs of passengers and
market structure. PTEs highlighted that there are limits to what can be achieved under the current regulatory model in terms of fares structures for
example and some stated that further integration could only be achieved by limiting or removing competition.
■ There is wasteful competition e.g. overbussing, which
doesn’t benefit passengers and constructive competition
which gives better headways and pricing
■ Partnership agreements have been used to deliver better
outcomes through constructive competition, although due to
restrictions in competition law these need to be brokered by
LA
■ Competition keeps operators on their toes and keeps prices
low
■ Whilst some planning may look good on paper i.e. every
service integrated, it may not reflect what the customer
wants
■ This is essential but there’s only so much that co-ordination
of services under the existing model can do
■ There needs to be powers to get rid of multiple operators on
the same route
■ MOT is key. Customers want a single product with the same
specification
■ Competition law makes this difficult for operators to achieve
Large operators
PTEs
■ In some cases QPS have acted to entrench a dominant
operator’s position
■ Operators fear competition law. Greater guidance or
examples of what can be achieved would be useful
Other operators
(cont.)
■ In some cases, although in small urban areas there is little
need for this as there are either a dominant operator which
is already well integrated or not much overlap between
operators
■ Simpler legislation such as use of qualifying agreements
without the need for complicated partnership working
arrangements help with this
■ There are potentially issues with resourcing, in terms of staff
and subsidies (for weekend and evening services)
Local authorities
■ Yes it’s essential for efficient operations, and to prevent
operators wasting competition
■ Branding can be important to customers in making services
more recognisable
■ There a constraint of competition law, or the perception that
it is an issue. Greater guidance is needed
■ It’s surprising that partnerships aren’t used more to deliver
greater co-ordination
Associations
■ In some circumstances. This was a greater issue when
there were significant ‘bus wars’ between operators. It isn’t a
desire of customers
Other operators

© 2016 KPMG LLP, a UK limited liability partnership and a member firm of the KPMG network of independent member firms affiliated with KPMG International Cooperative (“KPMG International”), a Swiss entity. All rights reserved.
50
Q6. Is greater integration in ticketing desirable and, if so, how can it be achieved?
All stakeholders agreed that greater integration was desirable in most areas, but there were different views on the value of multi-operator ticketing (MOT)
to passengers, trade-offs between integration and competition and how greater integration could be achieved. MOTs are seen as important products, but
it was felt that they are not always used in the best interests of passengers, with premiums either being too high, or the availability and pricing of tickets
acting as a barrier to competitors entering the market.
■ There are a large number of multi-operator ticketing (MOT)
schemes available. It has been suggested that between 65-
86% of the population have MOT available to them
■ However in some areas take up has been slow
■ It makes commercial sense for operators to provide better
access to public transport
■ Use of smart technology is key to uptake
■ Yes it is highly desirable, but it can’t be achieved under the
existing model
■ It can be delivered under the existing legislation, but not with
certainty
■ There are different levels of integration for example at a high
level agreeing definitions of weekly, monthly products
■ MOT premiums may be used by operators as a barrier to
entry
■ Demand varies by region. It’s not a priority of all customers,
therefore it shouldn’t be delivered ‘at all costs’
■ Smartcard implementation requires co-ordination (through a
contract) otherwise it will only happen when it is in the
operators’ interests
■ Incumbent travel card products are a barrier to entry as it’s
very difficult to change passenger habits
Large operators
PTEs
Other operators
■ In some cases MOT are seen as a key passenger
requirement
■ However in other regions they are a niche product with little
demand due to regional geography and market
segmentation
■ Simple scheme which allowed operators to share revenue
would help. However there needs to be a balance between
achieving integration and operators not losing revenue,
otherwise it won’t succeed.
■ Passengers don’t always want to undertake complex
journeys using public transport
■ Yes this is desirable, but the premium charged can’t be so
great as to reduce take up
■ ITSO ticketing is already obsolete with use of contactless,
phone payments etc.
Local authorities
Associations
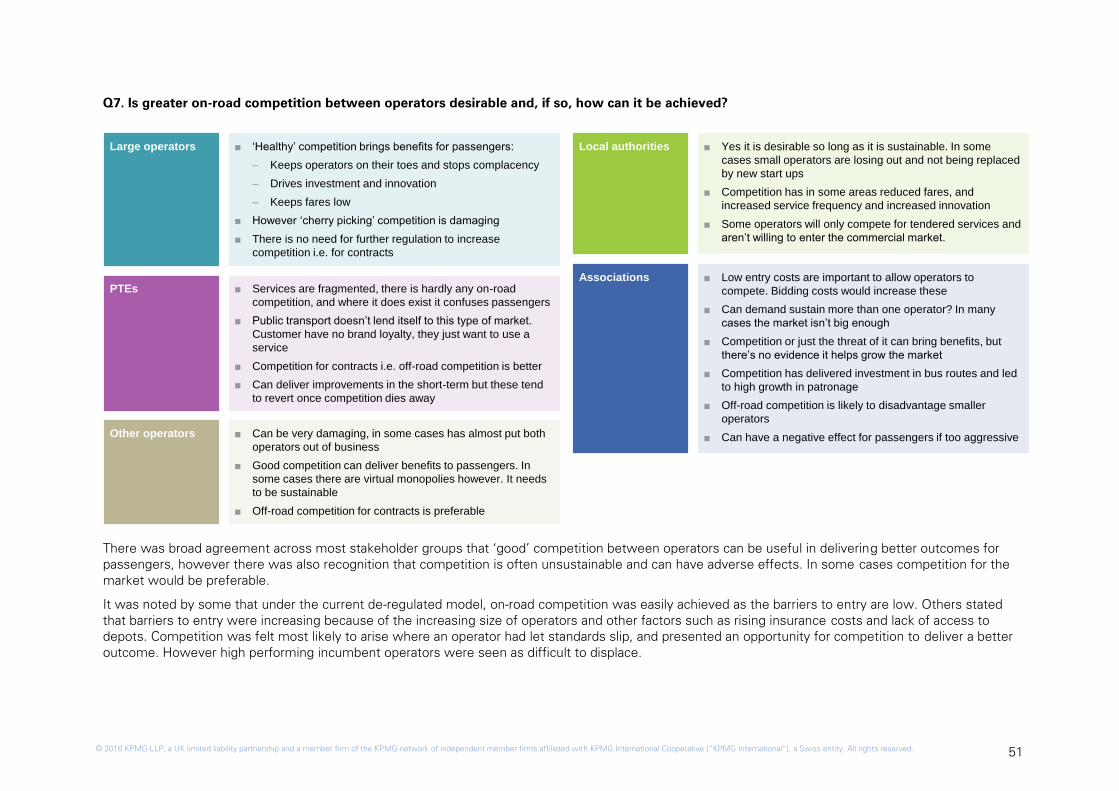
© 2016 KPMG LLP, a UK limited liability partnership and a member firm of the KPMG network of independent member firms affiliated with KPMG International Cooperative (“KPMG International”), a Swiss entity. All rights reserved.
51
Q7. Is greater on-road competition between operators desirable and, if so, how can it be achieved?
There was broad agreement across most stakeholder groups that ‘good’ competition between operators can be useful in delivering better outcomes for
passengers, however there was also recognition that competition is often unsustainable and can have adverse effects. In some cases competition for the
market would be preferable.
It was noted by some that under the current de-regulated model, on-road competition was easily achieved as the barriers to entry are low. Others stated
that barriers to entry were increasing because of the increasing size of operators and other factors such as rising insurance costs and lack of access to
depots. Competition was felt most likely to arise where an operator had let standards slip, and presented an opportunity for competition to deliver a better
outcome. However high performing incumbent operators were seen as difficult to displace.
■ ‘Healthy’ competition brings benefits for passengers:
– Keeps operators on their toes and stops complacency
– Drives investment and innovation
– Keeps fares low
■ However ‘cherry picking’ competition is damaging
■ There is no need for further regulation to increase
competition i.e. for contracts
■ Services are fragmented, there is hardly any on-road
competition, and where it does exist it confuses passengers
■ Public transport doesn’t lend itself to this type of market.
Customer have no brand loyalty, they just want to use a
service
■ Competition for contracts i.e. off-road competition is better
■ Can deliver improvements in the short-term but these tend
to revert once competition dies away
■ Can be very damaging, in some cases has almost put both
operators out of business
■ Good competition can deliver benefits to passengers. In
some cases there are virtual monopolies however. It needs
to be sustainable
■ Off-road competition for contracts is preferable
Large operators
PTEs
Other operators
■ Yes it is desirable so long as it is sustainable. In some
cases small operators are losing out and not being replaced
by new start ups
■ Competition has in some areas reduced fares, and
increased service frequency and increased innovation
■ Some operators will only compete for tendered services and
aren’t willing to enter the commercial market.
■ Low entry costs are important to allow operators to
compete. Bidding costs would increase these
■ Can demand sustain more than one operator? In many
cases the market isn’t big enough
■ Competition or just the threat of it can bring benefits, but
there’s no evidence it helps grow the market
■ Competition has delivered investment in bus routes and led
to high growth in patronage
■ Off-road competition is likely to disadvantage smaller
operators
■ Can have a negative effect for passengers if too aggressive
Local authorities
Associations
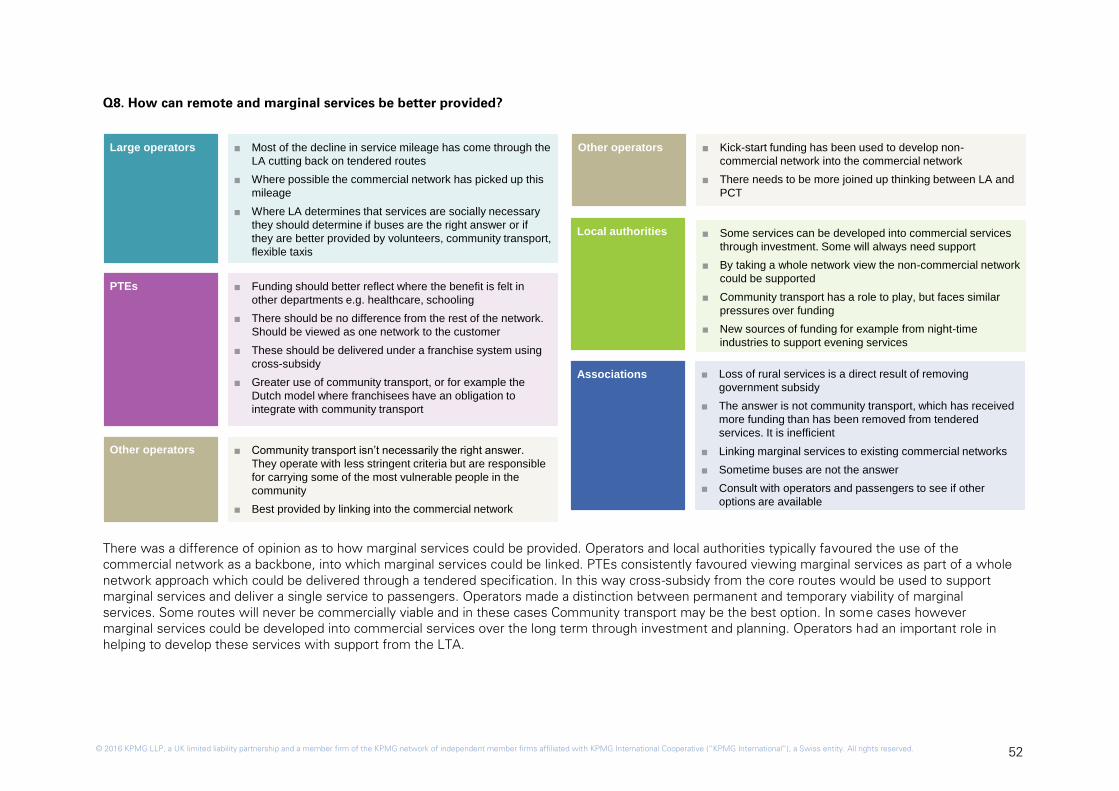
© 2016 KPMG LLP, a UK limited liability partnership and a member firm of the KPMG network of independent member firms affiliated with KPMG International Cooperative (“KPMG International”), a Swiss entity. All rights reserved.
52
Q8. How can remote and marginal services be better provided?
There was a difference of opinion as to how marginal services could be provided. Operators and local authorities typically favoured the use of the
commercial network as a backbone, into which marginal services could be linked. PTEs consistently favoured viewing marginal services as part of a whole
network approach which could be delivered through a tendered specification. In this way cross-subsidy from the core routes would be used to support
marginal services and deliver a single service to passengers. Operators made a distinction between permanent and temporary viability of marginal
services. Some routes will never be commercially viable and in these cases Community transport may be the best option. In some cases however
marginal services could be developed into commercial services over the long term through investment and planning. Operators had an important role in
helping to develop these services with support from the LTA.
■ Funding should better reflect where the benefit is felt in
other departments e.g. healthcare, schooling
■ There should be no difference from the rest of the network.
Should be viewed as one network to the customer
■ These should be delivered under a franchise system using
cross-subsidy
■ Greater use of community transport, or for example the
Dutch model where franchisees have an obligation to
integrate with community transport
■ Community transport isn’t necessarily the right answer.
They operate with less stringent criteria but are responsible
for carrying some of the most vulnerable people in the
community
■ Best provided by linking into the commercial network
Large operators
PTEs
Other operators
■ Some services can be developed into commercial services
through investment. Some will always need support
■ By taking a whole network view the non-commercial network
could be supported
■ Community transport has a role to play, but faces similar
pressures over funding
■ New sources of funding for example from night-time
industries to support evening services
■ Loss of rural services is a direct result of removing
government subsidy
■ The answer is not community transport, which has received
more funding than has been removed from tendered
services. It is inefficient
■ Linking marginal services to existing commercial networks
■ Sometime buses are not the answer
■ Consult with operators and passengers to see if other
options are available
Local authorities
Associations
■ Kick-start funding has been used to develop non-
commercial network into the commercial network
■ There needs to be more joined up thinking between LA and
PCT
Other operators■ Most of the decline in service mileage has come through the
LA cutting back on tendered routes
■ Where possible the commercial network has picked up this
mileage
■ Where LA determines that services are socially necessary
they should determine if buses are the right answer or if
they are better provided by volunteers, community transport,
flexible taxis

© 2016 KPMG LLP, a UK limited liability partnership and a member firm of the KPMG network of independent member firms affiliated with KPMG International Cooperative (“KPMG International”), a Swiss entity. All rights reserved.
53
Q9. What would drive greater investment in the bus market, both from operators and local authorities?
All stakeholder groups identified that greater certainty would drive investment and innovation. In the case of operators, they cited that they needed to
have certainty over the future regulation of the bus market, particularly with the prospect of market interventions such as quality contracts. LAs and PTEs
noted that they needed greater certainty over the provision of services from operators in the future to make sure that investment would not be wasted if
services were cancelled. Where both operators and LTAs could be more certain of future outcomes investment was thought to be likely to increase.
■ Investment levels are already high
■ Commercial entities are better at innovation than public
sectors
■ If there is a viable market, investment will follow
■ Greater LA investment would come through devolution, but
not greater regulation
■ There needs to be certainty and good market conditions, not
regulatory interference
■ Greater certainty will give operators the incentive to invest.
In the medium term the threat of QC will prevent investment
Large operators
PTEs
Other operators
■ Greater certainty over funding would be beneficial
■ Market stability is also required for both parties to invest
■ Government investment is required to drive innovation in the
industry, it won’t be provided by competition alone
■ Quantification of environmental and social gains
■ There needs to be greater certainty
■ Some ‘innovations’ are just re-branding, a reflection that
operators face risks to market operation
■ Procurement of tendered services on price alone reduces
innovation and investment
■ Not all LA and operators have aligned objectives which
reduces competition
■ Longer term planning of investment decisions
Local authorities
Associations
■ De-regulation is the best model to drive investment. Why
would a franchise contract drive investment. TfL are hard to
take an idea to
■ Innovation is more about people, rather than the system
under which they operate
■ Sharing examples of best practice to demonstrate what can
be achieved and give confidence
Other operators
■ The pace of innovation is slow compared to the pace of
people’s lifestyles
■ There needs to be better alignment between the LA and the
operator
■ The LA needs a credible business case to invest, they don’t
always get the certainty that operators will continue to use
infrastructure. I.e. where there is no contractual framework
■ Levels of innovation are inconsistent, and doesn’t seem to
be spread across large owning groups

© 2016 KPMG LLP, a UK limited liability partnership and a member firm of the KPMG network of independent member firms affiliated with KPMG International
Cooperative (“KPMG International”), a Swiss entity. All rights reserved. 54
3.6 Summary and discussion
The local bus market is complex with demand and supply being influenced by multiple factors, some
of which are controlled by operators, others influenced by LTAs and others which are external to the
market. Some local markets are performing relatively well at increasing passenger numbers whilst
others are doing less well.
Passenger demand for bus services in England outside of London fell almost continuously from the
time of deregulation to the mid-2000s. Since then overall passenger demand has remained relatively
stable albeit with considerable variation across local bus markets reflecting differences in socio-
demographic factors, land use, the relative attractiveness of alternative modes of transport, wider
transport policy and government expenditure, as well as the performance of local bus operators.
This aggregate trend in demand contrasts with trends in London where demand remained relatively
constant between the mid-1980s and the mid-1990s before increasing steadily until the late-2000s.
Whilst differences in bus demand between London and other areas in England are marked, so are the
differences in the factors that influence demand. It is therefore difficult to draw a firm conclusion on
the influence of the market ‘model’ on relative market performance. One thing is clear however, the
growth in passenger demand in London was helped by a step change in the quality of service offered
and a step change in public sector investment and expenditure on local bus services.
Levels of passenger satisfaction are high across key metrics and across local authority areas. There
are also signs that satisfaction scores are increasing over time, with overall passenger satisfaction
levels increasing from 85% to 88% over the last four years. Passenger satisfaction levels vary across
metrics ranging from 92% for aspects of bus operations to 62% for value for money. There were
however some concerns raised during the stakeholder interviews that passenger satisfaction levels
are high in many areas, potentially reflecting low passenger expectations rather than high service
quality. It was also noted that the sample population used to determine satisfaction ratings by
definition does not include those who choose not to travel by bus. Identifying the factors that deter
non-users from catching the bus could provide additional insight on the quality of local bus services.
Bus fares for services in England outside of London have risen at a higher rate than general inflation
since 2005 and have risen at a significantly faster rate in metropolitan areas than in non-metropolitan
areas. It is important to note however that fares tend to follow trends in operating costs which have
also increased at a faster rate than inflation.
Operating costs are largely driven by labour and fuel costs and both have risen substantially over
recent years resulting in a 22% increase in operating costs per vehicle mile and 14% increase per
passenger journey since 2004/05. Operating costs per vehicle mile are higher in metropolitan areas,
but higher average load factors mean that operating costs per passenger are lower in metropolitan
areas relative to non-metropolitan areas. Overall costs have increased at similar rates across both
metropolitan and non-metropolitan areas.
Arguably the most important market trend in recent years is the reduction in total vehicle miles in
both metropolitan and non-metropolitan areas, driven largely as a result of a reduction in funding for
supported services and a reduction to the level of subsidy provided to operators in the form of the
Bus Service Operators Grant (BSOG). Between 2009/10 and 2013/14 supported service mileage fell
by around 22% in metropolitan areas and 24% in non-metropolitan areas. Whilst the reduction in
vehicle miles does not appear to have led to a proportional reduction in patronage, anecdotal
evidence suggests that service reductions have had a disproportionately large impact on those in less
densely populated areas and those travelling outside of core operating times. Anticipated reductions
to local authority budgets as part of the Spending Review 2015 are likely to place additional pressure
on government expenditure on local bus services potentially leading to further reductions in
supported service mileage.

© 2016 KPMG LLP, a UK limited liability partnership and a member firm of the KPMG network of independent member firms affiliated with KPMG International
Cooperative (“KPMG International”), a Swiss entity. All rights reserved. 55
Based on this analysis of relatively aggregate trends, there is no single issue that stands out as a
driver of changing bus demand in England (outside of London). Some of the differences in demand
between markets can be explained by external factors such as the socioeconomic characteristics of
markets and land-use patterns, others are related to the attractiveness of bus relative to other modes
which in turn is influenced by operator conduct and government policy, and others relate to the
interactions between these factors and the strengths of the people involved.
In the next section of the report we consider the needs and objectives of passengers, LTAs and
operators, and identify conditions where there may be a case for government intervention in
the market.

© 2016 KPMG LLP, a UK limited liability partnership and a member firm of the KPMG network of independent member firms affiliated with KPMG International
Cooperative (“KPMG International”), a Swiss entity. All rights reserved. 56
4 Rationale for government intervention
4.1 Introduction
In this section we examine the rationale for government intervention in the local bus market by
considering stakeholder needs and objectives and potential market imperfections.
4.2 Stakeholder needs and objectives
Building on information from the stakeholder interviews (Section 3.5), we review publicly available
information on stakeholder objectives and examine the extent to which government, operator and
passenger objectives align and where potential conflicts arise.
Passenger needs
Market research on passenger experience (see Table 7 for examples), suggests that passengers
value punctuality, reliability, service frequency, available seats, integrated ticketing, network coverage
and value for money, amongst other things. Passengers dislike frequent changes to timetables and
routes.
Table 7: Market research on passenger experience
What passengers value Source
In this survey, improved punctuality was ranked as the first priority for
passengers, followed by improved frequency and better chance of getting a
seat to make bus services better.
‘Bus passenger priorities for
improvement’, Passenger
Focus (2010)
Reliability is the most frequent cause of complaint about local bus services in
England, based on an annual survey undertaken by Bus Users UK. This
suggested that bus punctuality is a major issue and that passengers desire
bus services to be more reliable.
‘Bus users annual report’, Bus
Users UK (2013)
An EU-wide survey on the quality of transport showed that the main reasons
for choosing a specific mode of transport in the UK are convenience (73% of
respondents), speed (11%), fare (11%), and available facilities (8%).
According to this survey, improving price of seasonal tickets (30%),
frequency (20%), coverage (18%) are the best ways to encourage people to
switch to public transport in the UK.
‘Quality of Transport’,
Eurobarometer (2014)
Bus passengers generally do not have preferences on the type of operating model or type of market
regulation and are often unaware of how services are provided. Many think that local authorities
should have some degree of involvement in the provision of bus services and tend to like the idea of
partnerships21
.
LTA objectives
Table 8 shows a summary of LTA objectives for the local bus market based on analysis of a selection
of Local Transport Plans22
and findings reported as part of the CC’s market investigation.
21 Passenger Focus, 2013, Giving passengers a voice on bus services,
http://www.transportfocus.org.uk/research/publications/giving-passengers-a-voice-in-bus-services
22 Including: West Yorkshire Transport Plan 2011-2026; Leeds City Region Transport Strategy (2009); South Yorkshire ITA
Vision for Bus in South Yorkshire (2010); Sheffield City Region Transport Strategy 2011-2026; Greater Nottingham Bus Strategy
2006/7 – 2010/11; Centro – Transforming bus travel

© 2016 KPMG LLP, a UK limited liability partnership and a member firm of the KPMG network of independent member firms affiliated with KPMG International
Cooperative (“KPMG International”), a Swiss entity. All rights reserved. 57
Table 8: LTA objectives and sub objectives for the bus market
Objectives Examples/sub objectives
Supporting economic
growth
■ Targeting and priority of areas of high congestion and economic growth for
transport access improvements.
■ Focus on connectivity and access to services and employment.
■ Integration of transport with land use planning.
Reducing congestion
and carbon emissions
and achieving modal
shift
■ Investment in public transport and wider initiatives such as smarter choices,
public transport information, personal transport planning to achieve mode shift.
■ Investment in green technology.
■ Use of wider policy initiatives such as park and ride, workplace parking levy,
parking strategies and traffic management to achieve mode shift.
■ Delivery of transport infrastructure – bus priority measures for example.
■ Reducing fares for vulnerable groups.
Improving public
transport accessibility,
safety and promoting
wider social inclusion
■ Focus on overall network coverage, timetables, journey times and service
reliability and quality of infrastructure.
■ Provision of supported services on non-commercially viable routes.
■ Support of concessionary travel for vulnerable groups.
■ Use of CCTV, lighting and other safety measures at bus stations and stops to
improve safety.
■ Improving access for people with reduced levels of mobility.
Improving service
quality and
integration
■ Introduction of smart ticketing, simplified fares, common branding, information
and marketing material (such as route maps).
■ Consistent standards in terms of bus service quality.
■ Integration with rail and other modes.
■ Desire to minimise changes to services.
■ Consultation with passengers over changes to services.
■ Monitoring of performance standards and LTP targets.
■ Improving awareness and perceptions of public transport options.
Achieving value for
money for public funds
■ Achieving value for money from supported services.
■ Improving coordination of tendered routes, reducing duplication.
■ Achieving coordination with other public transport services such as rail and
tram services.
Source: KPMG analysis based on various sources.
The analysis suggests that LTAs regard bus services as an important part of local transport provision
and as important for the achievement of wider economic, social and environmental policy objectives.
LTAs generally want to arrest the decline in service availability and bus patronage that have occurred
in some areas but there are a range of views over how this can be achieved.
The PTE areas in particular have noted a need for greater integration between bus services and
between modes, including through the development and promotion of integrated ticketing. Transport
for Greater Manchester and the North East Combined Authority have both set out aspirations to
introduce a franchise-type model for the local bus market, although through different processes.
South Yorkshire PTE has opted to focus on developing its bus market through a Quality Partnership
and West Yorkshire Combined Authority is considering the merits of both options. Each of these
areas has a specific rationale for seeking to make changes to the bus market based on a desire to
improve network performance and to achieve specific local policy objectives.

© 2016 KPMG LLP, a UK limited liability partnership and a member firm of the KPMG network of independent member firms affiliated with KPMG International
Cooperative (“KPMG International”), a Swiss entity. All rights reserved. 58
All have highlighted the need to provide a more integrated and coordinated service over which local
authorities can have greater influence. This includes the ability to introduce shared ticketing and
common marketing information as well as having greater influence over changes to bus services.
The impacts of bus services on economic, social and environmental policy outcomes23
is central to
understanding the desire of some LTAs to obtain greater control or influence over local bus services.
Operator objectives
Table 9 provides a summary of operator objectives for the local bus market. It is based on analysis
reported by the CC and a review of operator annual reports24
.
Table 9: Operator objectives and examples of behaviour
Objectives Examples
Commercial returns
on investment
■ Targets for profit and revenue growth and acquisitions.
Working with LTAs to
influence local policy
and investment,
achieving growth and
modal shift
■ Widespread adoption of partnership models, competition with car.
■ Fare reduction strategies and network reviews.
■ Participation in BBA area bids and other government initiatives.
Managing operating
costs
■ Managing pension, fuel, accident claim and bid costs.
■ Senior management restructuring.
■ Investment in fuel efficiency.
■ Disposal of depots.
Maintaining
operational flexibility
■ Responses to Tyne and Wear quality contracts proposal.
■ Widespread adoption of partnership models.
Compliance with
regulatory targets,
such as disability
access and
environmental targets
■ Green fleet and DDA targets noted in annual reports.
■ Targets for Euro 3 vehicle emission standards.
Improving passenger
satisfaction and
innovation
■ Investment in new fleets of buses.
■ Innovations including apps, Wi-Fi, USB chargers and social media profiles.
■ Introducing multi-operator ticketing and smart cards.
■ Monitoring of Transport Focus and other surveys.
■ Research and development (Bus driver research index for example).
Wider corporate
responsibility
■ Range of initiatives such as Carbon Trust Triple standards, Fair Tax Mark.
■ Discounts for job seekers, children and young people, Sunday morning.
■ Recycling targets.
■ Cycle awareness programs for drivers.
Protection of ‘core
territories’, deterrence
of competitors
■ The CC investigation identified some adverse behaviours in some cases to
protect ‘core territories’.
Source: KPMG analysis of CC local bus market investigation and operators’ annual reports.
23 PTEG (2013) The Case for the Urban Bus - the economic and social benefits of investing in the urban bus.
http://www.pteg.net/resources/types/reports/case-urban-bus-economic-and-social-benefits-investing-urban-bus
24 Including: Stagecoach, Arriva, Go-ahead Group, First Group, National Express

© 2016 KPMG LLP, a UK limited liability partnership and a member firm of the KPMG network of independent member firms affiliated with KPMG International
Cooperative (“KPMG International”), a Swiss entity. All rights reserved. 59
Analysis of stakeholder needs and objectives
LTAs, operators and passengers all want long term market growth, improved network performance,
high service quality and innovation. Passengers and LTAs desire high levels of accessibility, service
integration and network stability. LTAs and operators have an interest in achieving modal shift,
maintaining good working relationships and investment in infrastructure.
Other objectives are primarily the concern of specific stakeholder groups, although that is not to say
that they are exclusively the concern of those stakeholders. For operators, these include taking
market share, providing a return to investors and having commercial freedom. For local authorities
these include delivering wider transport and spatial policy objectives, wider economic, social and
environmental improvements, as well as value for money from capital and revenue expenditure. For
passengers, these include achieving better value for money and certainty over fares.
Potential misalignments in objectives could support the case for further government intervention in
the bus market, especially in areas where the achievement of policy objectives is expected to provide
economic benefits that exceed the costs and risks of regulatory changes. The key finding of this
analysis, however, is that in most areas there is a good overlap between stakeholder objectives but
potential differences in the best way to achieve those objectives.
4.3 Market imperfections
There may be occasions where markets do not deliver an efficient allocation of resources due to a
variety of reasons that economists refer to as ‘market failures’ or ‘market imperfections’. For de-
regulated local bus markets we have identified four potential sources of market imperfection,
including:
■ Network economies relating to service coordination, ticket integration and joint marketing.
■ Misaligned incentives between operators and the infrastructure provider/manager.
■ Lack of competition or ability for new entrants to enter the market.
■ Wider economic, social and environmental benefits.
Each type of market imperfection is discussed further below.
Network economies
Effective bus services connect people to the places where they want to go and in many situations
this requires a coordinated and integrated network of services and routes. Where services are
provided by competing operators, the coordination of timetables, fares and ticketing arrangements is
difficult and unless it is carefully managed it could potentially be in breach of Competition Law.
Government intervention in the market may therefore be needed to coordinate services and
align fares and ticketing to help passenger transfer seamlessly between services provided by
different operators.
Misaligned incentives
The delivery of a high quality bus network generally requires partnership working between those who
are responsible for providing and maintaining transport infrastructure and managing road network
performance, and those who are responsible for operating the bus services themselves. The
separation of these interrelated activities and lack of formal or informal arrangements on how to
manage the interface between them can lead to a misalignment of incentives.

© 2016 KPMG LLP, a UK limited liability partnership and a member firm of the KPMG network of independent member firms affiliated with KPMG International
Cooperative (“KPMG International”), a Swiss entity. All rights reserved. 60
For example, operators have limited incentives to unilaterally invest in the network where this
investment can be used by their competitors. Similarly LTAs may have limited incentives to invest in
bus infrastructure where they cannot be sure that the level of service provided by operators using the
facility will be maintained or that the benefits of the investment will ultimately flow to passengers
and the wider community. There may also be conflicts or misaligned incentives associated with
investment in other transport schemes (such as light rail) for which competition from bus services
could impede the realisation of scheme benefits.
Government intervention in the market may therefore be needed to reducing the misalignment of
incentives to invest in infrastructure by establishing formal or informal agreements between the LTA
and operators.
Lack of competition or market or ability for new entrants to enter the market
A lack of effective, sustainable competition between operators for passengers could lead to higher
fares, lower output, reduced service quality, reduced innovation and higher operator profits relative to
those delivered by a more competitive market. A lack of effective competition could also lead to
inefficiencies in the market for supported services.
Whilst on-road competition is relatively scarce, the market is sometimes regarded as being
‘contestable’ with the threat of market entry providing an incentive to operators and the market to
work efficiently. Competition from other modes and from cars in particular could provide an incentive
for the market to work efficiently. Whilst the CC could not find evidence to support this view there is
a strong relationship between car ownership and bus use at the household level.
Government intervention in the market may be necessary to protect passenger interests by providing
favourable conditions for competition to arise or by regulating market power where competition is not
sustainable.
Wider economic, social and environmental benefits
Bus services can generate wider economic, social and environmental benefits which can mean that it
is economically efficient to increase supply above the levels determined by the commercial market.
Buses connect people to jobs and customers to businesses, they provide access to essential
services, promote social inclusion and provide environmental improvements by encouraging a switch
from private to public transport. Where these wider benefits or ‘positive externalities’ exist,
government can improve market efficiency by expanding supply and/or keeping fares lower than they
would otherwise be.
4.4 Prevalence of market imperfections
The prevalence of the market imperfections identified above and their impacts on local markets will
vary from place to place depending on:
■ Travel patterns and behaviours, the complexity of the network and requirement to make multi-
stage, multi-operator trips.
■ The level of integration between infrastructure and operations, including the quality of the road
network, levels of congestion, and availability of bus lanes and priority measures.
■ The level of market power held by operators which in turn will be influenced by the number
of operators, competition from other modes of transport, and the extent to which the market
is contestable.
■ The relative importance of generating wider economic, social and environmental benefits, and the
level of investment in complementary transport and spatial planning.
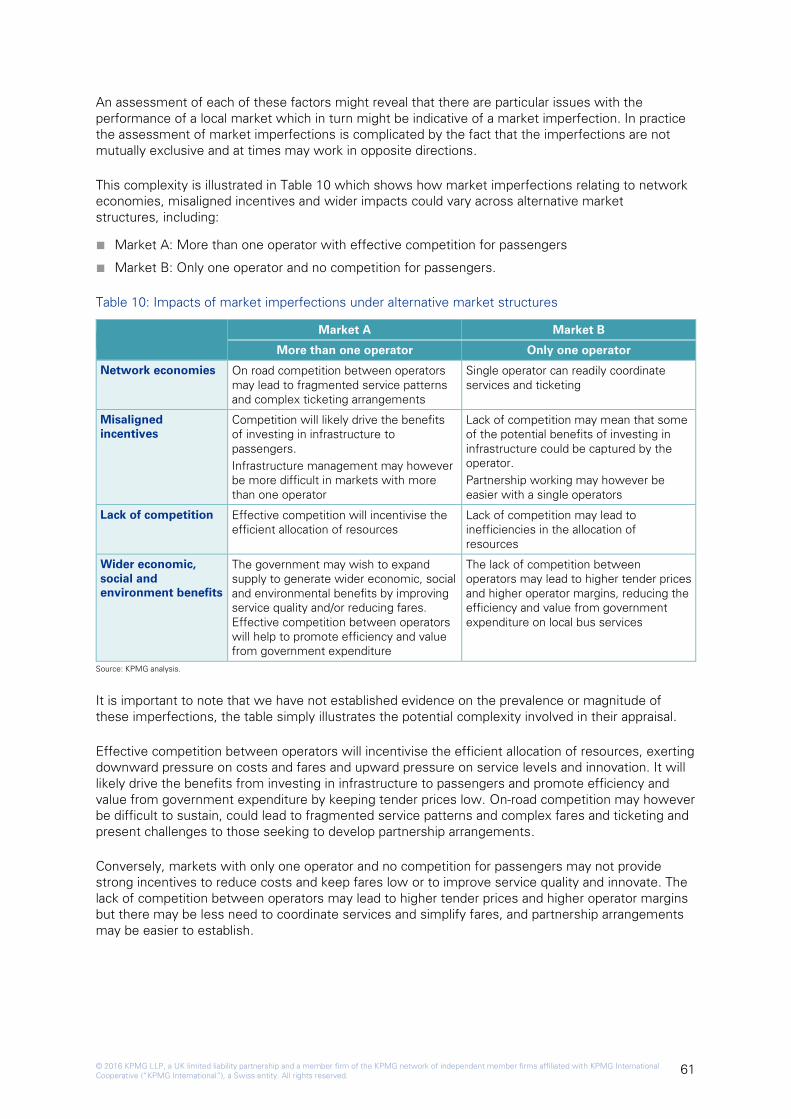
© 2016 KPMG LLP, a UK limited liability partnership and a member firm of the KPMG network of independent member firms affiliated with KPMG International
Cooperative (“KPMG International”), a Swiss entity. All rights reserved. 61
An assessment of each of these factors might reveal that there are particular issues with the
performance of a local market which in turn might be indicative of a market imperfection. In practice
the assessment of market imperfections is complicated by the fact that the imperfections are not
mutually exclusive and at times may work in opposite directions.
This complexity is illustrated in Table 10 which shows how market imperfections relating to network
economies, misaligned incentives and wider impacts could vary across alternative market
structures, including:
■ Market A: More than one operator with effective competition for passengers
■ Market B: Only one operator and no competition for passengers.
Table 10: Impacts of market imperfections under alternative market structures
Market A Market B
More than one operator Only one operator
Network economies On road competition between operators
may lead to fragmented service patterns
and complex ticketing arrangements
Single operator can readily coordinate
services and ticketing
Misaligned
incentives
Competition will likely drive the benefits
of investing in infrastructure to
passengers.
Infrastructure management may however
be more difficult in markets with more
than one operator
Lack of competition may mean that some
of the potential benefits of investing in
infrastructure could be captured by the
operator.
Partnership working may however be
easier with a single operators
Lack of competition Effective competition will incentivise the
efficient allocation of resources
Lack of competition may lead to
inefficiencies in the allocation of
resources
Wider economic,
social and
environment benefits
The government may wish to expand
supply to generate wider economic, social
and environmental benefits by improving
service quality and/or reducing fares.
Effective competition between operators
will help to promote efficiency and value
from government expenditure
The lack of competition between
operators may lead to higher tender prices
and higher operator margins, reducing the
efficiency and value from government
expenditure on local bus services
Source: KPMG analysis.
It is important to note that we have not established evidence on the prevalence or magnitude of
these imperfections, the table simply illustrates the potential complexity involved in their appraisal.
Effective competition between operators will incentivise the efficient allocation of resources, exerting
downward pressure on costs and fares and upward pressure on service levels and innovation. It will
likely drive the benefits from investing in infrastructure to passengers and promote efficiency and
value from government expenditure by keeping tender prices low. On-road competition may however
be difficult to sustain, could lead to fragmented service patterns and complex fares and ticketing and
present challenges to those seeking to develop partnership arrangements.
Conversely, markets with only one operator and no competition for passengers may not provide
strong incentives to reduce costs and keep fares low or to improve service quality and innovate. The
lack of competition between operators may lead to higher tender prices and higher operator margins
but there may be less need to coordinate services and simplify fares, and partnership arrangements
may be easier to establish.

© 2016 KPMG LLP, a UK limited liability partnership and a member firm of the KPMG network of independent member firms affiliated with KPMG International
Cooperative (“KPMG International”), a Swiss entity. All rights reserved. 62
Figure 24 provides an analysis of market concentration (as measured by the Herfindahl index25
)
against the number of bus journeys per person across local authority areas.
Figure 24: Bus journeys per person (2013) against Herfindahl Index
Source: DfT Bus Statistics Table BUS01001b
Taken at face value, this analysis suggests that on-road competition is not a necessary condition to
stimulate high levels of demand. This might be explained as follows:
■ Even where market concentration is high, markets remain contestable so that the abuse of
market power does not occur. Indeed, this was part of the rationale to support de-regulation set
out in the 1984 Buses White Paper.
■ Competition from other modes provides discipline to counter market power within bus markets.
Furthermore, a single operator may focus on growing the market through competition with other
modes rather than being distracted by competing against other operators for greater market
share.
■ Greater service integration and coordination may be easier to achieve in markets with fewer
operators, and where LTAs and operators can develop stronger relationships.
These factors suggests that whilst on-road competition might provide benefits through improving
market efficiency, it could actually detract from market performance by aggravating the other market
imperfections described above, making it more difficult to achieve network economies, alignment of
incentives and wider impacts.
4.5 Summary and discussion
There is a good deal of overlap between stakeholder objectives with a common aim to grow the
market by delivering affordable fares, high level of service quality and clear choices for passengers. In
turn, a high quality local bus service will contribute to the LTA’s wider transport, land-use and
economic objectives
The achievement of stakeholder objectives can be adversely influenced by a range of market
imperfections including:
■ Network economies relating to service coordination, ticket integration and joint marketing.
25 The Herfindahl Index is a measure of the degree of competition in a market. It ranges from 0% where there are a large
number of firms competing with each other to 100% where there is a single monopolistic producer.
Darlington
Durham
Redcar and Cleveland
Tyne and Wear ITA
Blackpool
Cheshire East
Warrington
Greater Manchester ITA
Merseyside ITA
East Riding of Yorkshire
York
South Yorkshire ITA
Leicester
Leicestershire
Nottingham
Rutland
Shropshire
West Midlands ITA
BedfordLuton
Suffolk
Brighton and Hove
East SussexPortsmouth
Reading
Surrey North Somerset
Poole
Swindon
0
20
40
60
80
100
120
140
160
180
0% 10% 20% 30% 40% 50% 60% 70% 80% 90% 100%
Bu
s jo
urn
eys p
er p
erso
n (2013)
Herfindahl Index

© 2016 KPMG LLP, a UK limited liability partnership and a member firm of the KPMG network of independent member firms affiliated with KPMG International
Cooperative (“KPMG International”), a Swiss entity. All rights reserved. 63
■ Misaligned incentives between operators and the infrastructure manager.
■ Lack of effective on-road competition or ability for new entrants to enter the market.
■ Wider economic, social and environmental benefits.
The impacts that each of these imperfections has on achieving stakeholder objectives is likely to vary
between areas, as is the degree of influence or control that stakeholders have to mitigate against
them. This is complicated by the observation that market imperfections can sometimes have
conflicting impacts, for example, low levels of on-road competition may increase operator market
power but can improve network economies.
The rationale for government intervention in the market will vary from place to place. It will depend
on the objectives for the market, the prevalence and impacts of market imperfections, and the costs
and benefits of alternative types of intervention.
In the next section we consider the range of policy levers available to local and national government
to influence the supply of local bus services.

© 2016 KPMG LLP, a UK limited liability partnership and a member firm of the KPMG network of independent member firms affiliated with KPMG International
Cooperative (“KPMG International”), a Swiss entity. All rights reserved. 64
5 Government influence over the
bus market
5.1 Introduction
In this section we consider the extent to which alternative policy levers can be used to correct
market imperfections and/or mitigate against their impacts.
Before intervening in the market however, the government must be clear that a problem exists and
that the benefits from intervening outweigh the costs. If the intervention is not right, it could do more
harm than good.
In the previous section we identified four different types of market imperfections that could constrain
the ability of the de-regulated local bus market in the efficient allocation of resources. These include:
■ Network economies relating to service coordination, ticket integration and joint marketing.
■ Misaligned incentives between operators and the infrastructure manager.
■ Lack of effective on-road competition or ability for new entrants to enter the market.
■ Wider economic, social and environmental benefits.
Correcting these imperfections and/or mitigating against their impacts could involve:
■ Coordinating services, ticketing and marketing.
■ Alliancing or partnership working between operators and the infrastructure provider.
■ Promoting competition and regulating anti-competitive behaviour.
■ Expanding output by reducing fares and/or increasing overall service quality.
We now explore the potential to make targeted interventions under de-regulated, partnership and
franchising approaches by considering the influence that government has on a range of attributes of
local bus services.
5.2 Bus service attributes
Table 11 provides a summary of 10 attributes of local bus services selected to cover a range of
aspects that are known to be important to passengers, operators and LTAs, together with some
general observations on the performance of each based on our analysis of market trends
(Section 3.3).
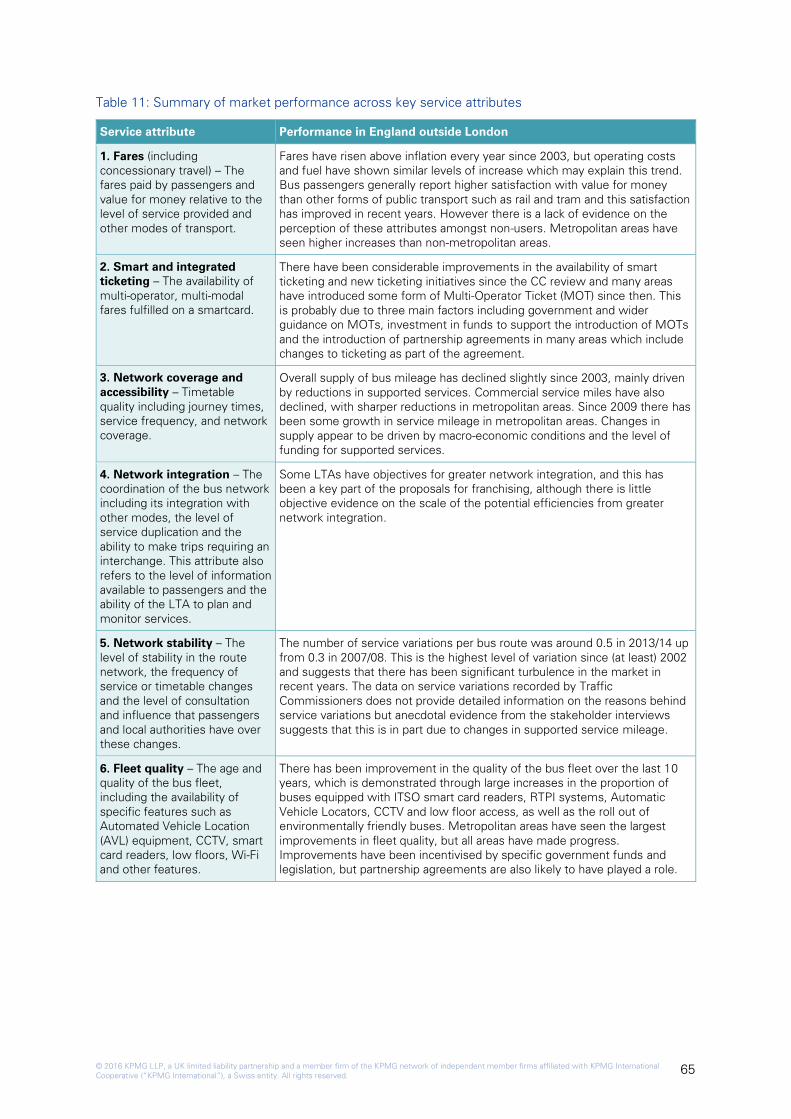
© 2016 KPMG LLP, a UK limited liability partnership and a member firm of the KPMG network of independent member firms affiliated with KPMG International
Cooperative (“KPMG International”), a Swiss entity. All rights reserved. 65
Table 11: Summary of market performance across key service attributes
Service attribute Performance in England outside London
1. Fares (including
concessionary travel) – The
fares paid by passengers and
value for money relative to the
level of service provided and
other modes of transport.
Fares have risen above inflation every year since 2003, but operating costs
and fuel have shown similar levels of increase which may explain this trend.
Bus passengers generally report higher satisfaction with value for money
than other forms of public transport such as rail and tram and this satisfaction
has improved in recent years. However there is a lack of evidence on the
perception of these attributes amongst non-users. Metropolitan areas have
seen higher increases than non-metropolitan areas.
2. Smart and integrated
ticketing – The availability of
multi-operator, multi-modal
fares fulfilled on a smartcard.
There have been considerable improvements in the availability of smart
ticketing and new ticketing initiatives since the CC review and many areas
have introduced some form of Multi-Operator Ticket (MOT) since then. This
is probably due to three main factors including government and wider
guidance on MOTs, investment in funds to support the introduction of MOTs
and the introduction of partnership agreements in many areas which include
changes to ticketing as part of the agreement.
3. Network coverage and
accessibility – Timetable
quality including journey times,
service frequency, and network
coverage.
Overall supply of bus mileage has declined slightly since 2003, mainly driven
by reductions in supported services. Commercial service miles have also
declined, with sharper reductions in metropolitan areas. Since 2009 there has
been some growth in service mileage in metropolitan areas. Changes in
supply appear to be driven by macro-economic conditions and the level of
funding for supported services.
4. Network integration – The
coordination of the bus network
including its integration with
other modes, the level of
service duplication and the
ability to make trips requiring an
interchange. This attribute also
refers to the level of information
available to passengers and the
ability of the LTA to plan and
monitor services.
Some LTAs have objectives for greater network integration, and this has
been a key part of the proposals for franchising, although there is little
objective evidence on the scale of the potential efficiencies from greater
network integration.
5. Network stability – The
level of stability in the route
network, the frequency of
service or timetable changes
and the level of consultation
and influence that passengers
and local authorities have over
these changes.
The number of service variations per bus route was around 0.5 in 2013/14 up
from 0.3 in 2007/08. This is the highest level of variation since (at least) 2002
and suggests that there has been significant turbulence in the market in
recent years. The data on service variations recorded by Traffic
Commissioners does not provide detailed information on the reasons behind
service variations but anecdotal evidence from the stakeholder interviews
suggests that this is in part due to changes in supported service mileage.
6. Fleet quality – The age and
quality of the bus fleet,
including the availability of
specific features such as
Automated Vehicle Location
(AVL) equipment, CCTV, smart
card readers, low floors, Wi-Fi
and other features.
There has been improvement in the quality of the bus fleet over the last 10
years, which is demonstrated through large increases in the proportion of
buses equipped with ITSO smart card readers, RTPI systems, Automatic
Vehicle Locators, CCTV and low floor access, as well as the roll out of
environmentally friendly buses. Metropolitan areas have seen the largest
improvements in fleet quality, but all areas have made progress.
Improvements have been incentivised by specific government funds and
legislation, but partnership agreements are also likely to have played a role.

© 2016 KPMG LLP, a UK limited liability partnership and a member firm of the KPMG network of independent member firms affiliated with KPMG International
Cooperative (“KPMG International”), a Swiss entity. All rights reserved. 66
Service attribute Performance in England outside London
7. Service quality – The overall
quality of the passenger
experience, including specific
aspects such as punctuality,
reliability, seat availability, driver
behaviour and vehicle and bus
stop cleanliness.
Evidence from Transport Focus shows that service quality has generally
improved and is high across most measures – with the exception of value for
money and punctuality, although DfT statistics suggest that average excess
waiting times have fallen. Punctuality and reliability are the aspects of service
that most concern passengers and these attributes account for 24% of
passenger complaints.
8. Innovation – The use of new
techniques, technology and
ideas in the delivery of bus
services. This includes both
technical innovation in
equipment, and service
innovation in the way that bus
services are run, marketed and
operated.
There is anecdotal evidence of innovation in bus services, such as delivery of
passenger Wi-Fi and new products and services to meet the needs of
specific groups such as students, tourists and commuters.
9. Branding and marketing –
The availability of common
branding and information
sources for the bus network,
including common points of
information, query and
complaint, maps and route
timetables and other
information.
Transport Focus indicates that uncoordinated branding can present a
challenge for passengers’ understanding of tickets and route networks,
suggesting issues with network cooperation over branding might exist. There
is evidence to suggest that where an LTA has invested in marketing, this has
a positive effect on bus use. Several LTAs have been able to introduce some
form of common branding, marketing and information sources as part of
partnership agreements.
10. Operating efficiency – The
ongoing management and
reduction of operating costs
through innovation, adoption of
best practice and measures to
improve the efficiency of the
bus network.
Bus costs per mile have increased by 24% in real terms since 2004, with
above inflation rises in labour and fuel being the main reasons. Much of this
increase may have been outside operators’ control – wage inflation may be
explained by a shortage of drivers coupled with increased labour demand,
rising pension costs and environmental regulations. There is little evidence to
suggest operators are not attempting to improve operational efficiency and
there are some examples of significant costs cutting including closing
pension schemes. There have been instances of labour disputes which may
be a factor in rising staff costs.
Source: KPMG analysis.

© 2016 KPMG LLP, a UK limited liability partnership and a member firm of the KPMG network of independent member firms affiliated with KPMG International
Cooperative (“KPMG International”), a Swiss entity. All rights reserved. 67
5.3 Government policy levers
5.3.1 Policy levers under the de-regulated model
Table 12 shows the range of policy levers available to central and local government under the de-
regulated model to influence service attributes, address issues facing the local bus market and to
help achieve stakeholder objectives.
Table 12: Policy levers under the de-regulated model
Policy levers
Policy levers applied nationally
Taxes and subsidy
(including BSOG)
BSOG is paid to operators to help them recover some fuel costs on commercial
services. The amount each bus company receives is currently based on annual
fuel consumption. The aim of BSOG is to benefit passengers by reducing fares
and increasing service levels. BSOG paid on supported services and in Better Bus
Areas is devolved to LTAs.
Concessionary travel Older and disabled passengers receive statutory concessionary travel. LTAs also
have the option to provide discretionary support for other groups such as school
children. These schemes aim to improve mobility for vulnerable groups and
reduce social exclusion.
Licensing and quality
regulation
Traffic Commissioners are responsible for the licensing and regulation of the bus
market. They are responsible for the enforcement of service reliability and
punctuality and require a minimum notice period regarding the introduction or
change in services. They also enforce operator compliance with SQP conditions
of use.
Competition Law Competition Law promotes or seeks to maintain market competition by regulating
anti-competitive conduct by operators. It could be applied in response to evidence
of anti-competitive behaviour by operators such as collusion – but also acts as a
general deterrent to such activity.
Best practice guidance The DfT has produced best practice guidance to support the market. Examples
include guidance on tendering service, guidance on multi-operator ticketing and
guidance on partnership working.
Policy levers applied locally
Supported services Where services are not commercially viable but socially necessary, LTAs have the
ability to introduce a service through a tender scheme, on a gross or net cost
basis. Supported services are widely used to support routes to isolated areas or
services that operate outside of core times.
Targeted capital funding LTAs can bid for central funding for capital investment for specific projects such
as the Green Bus Fund to accelerate the take-up of low carbon buses.
Planning, infrastructure
investment and traffic
management
LTAs have the ability (subject to budgetary constraints) to invest in bus priority,
traffic management and other infrastructure measures. These are schemes
intended to reduce delay and improve the operation of the network as a whole. It
may also be possible to use planning and development controls to influence land
use.
Highway demand
management
It is also possible for LTAs to introduce highway demand management via the use
of Road User Charging, parking controls and smarter travel initiatives, for
example.
Municipal bus operator
services
A small number of local authorities maintain ownership of local bus companies,
operating at arm’s length from direct local authority control but influenced by local
authority aims and objectives.
Source: KPMG analysis.

© 2016 KPMG LLP, a UK limited liability partnership and a member firm of the KPMG network of independent member firms affiliated with KPMG International
Cooperative (“KPMG International”), a Swiss entity. All rights reserved. 68
An important point to bear in mind when looking at the range of policy levers under government
control is that the policy levers sit in different government departments and different parts of local
authorities meaning that it may not always be possible to use the levers in a coordinated way. Given
transport’s reach across policy areas this may be inevitable, although more recently some authorities
have considered and piloted ‘total transport’ solutions which have sought to implement a cross-
sector approach to the delivery of supported public road passenger transport services. 26
5.3.2 Policy levers under Quality Partnerships
Under Quality Partnerships, LTAs and operators form agreements to work together to improve the
performance of the market. Partnership agreements include voluntary agreements and statutory
partnerships. Partnership agreements provide the potential for a much wider set of outcomes than
under the de-regulated approach.
Voluntary Quality Partnerships
The objective of a Voluntary Quality Partnership (VQP) is to encourage greater co-operation between
local authorities and operators, generally with the aim of increasing patronage, improving customer
experience and making targeted improvements to specific issues such as punctuality or service
frequency. LTAs usually make a contribution to improving infrastructure, traffic management,
ticketing integration, bus shelters, depots or marketing. In exchange, operators usually agree to
deliver various service quality standards.
Statutory Quality Partnerships
The Statutory Quality Partnership (SQP) model was introduced by the 2000 Transport Act. Under an
SQP an LTA (or two or more LTAs jointly) invest in improved facilities at specific locations along bus
routes (e.g. bus stops or bus lanes) and set conditions of use for these facilities. Operators who wish
to use those facilities must comply with the conditions of use, which can be wide ranging (e.g. new
buses, or driver training standards, slot access rights, service quality targets, access charges etc.).
The terms of use are enforced by the Traffic Commissioner.
The 2008 Act expanded the terms of the SQP model to allow an LTA to specify frequencies, timings
and maximum fares as part of the standard of service to be provided under a scheme. It also
provided safeguards preventing unrealistic conditions being placed on operators, and that their right
to make a fair commercial rate of return on their investment is not undermined. LTAs specify the
terms of an SQP but are constrained by what operators are willing to accept as the condition of use
for bus infrastructure.
The SQP model is intended to be used as a more formal and binding partnership arrangement
between operators and LTAs, usually within a tightly defined corridor, where the LTA is planning to
undertake investment.
5.3.3 Policy levers under franchising
The Transport Act 2000 gives powers to LTAs to enter into Quality Contracts27
for bus services,
under which the LTA (or two or more LTAs jointly) determines what local services should be provided
in the area to which the scheme relates, the standards to which they should be provided and any
additional facilities or services which should be provided in that area. Quality Contracts are expected
to be let by competitive tender and provide the successful bidder with exclusive rights to supply bus
services in the Quality Contract area. There are currently no Quality Contracts Schemes in operation
at the time of writing.
26 https://www.gov.uk/government/publications/total-transport-pilot-fund
27 Sometimes referred to as bus franchising

© 2016 KPMG LLP, a UK limited liability partnership and a member firm of the KPMG network of independent member firms affiliated with KPMG International
Cooperative (“KPMG International”), a Swiss entity. All rights reserved. 69
Under franchising the LTA takes responsibility for specifying and procuring local bus services. Subject
to funding and the form of contract, they can provide network stability, control over fares, service
frequency and quality, coordinated ticketing and service timings, and cross subsidise unprofitable
services with revenues from profitable services. They can however reduce commercial incentives to
respond to changing market conditions, reduce flexibility in supply and, depending on the nature of
the contract, make it difficult for small operators to compete – although the same could also be said
of some partnership models.
The specification of the contract will likely be important in providing operators and LTAs with the right
incentives to adopt behaviours that contribute to the objectives for the market. Central to this
specification is whether the contract seeks to deliver outputs, such as fare and service levels, or
outcomes, such as passenger satisfaction.
In the next section we consider the influence on service attributes of alternative policy levers under
de-regulated, partnership and franchising approaches.
5.4 Influence of government policies on local bus services
Table 13 provides a summary of the influence to the range of policy levers identified in Section 5.3 on
the bus service attributes described in Section 5.2.
Table 13: Relationship between existing policy levers and bus service attributes
Attribute/Policy
1. Fares
2. S
mart an
d
in
teg
rated
ticketin
g
3. N
etw
ork C
ov
erag
e
an
d A
ccessib
ility
4. N
etw
ork
In
teg
ratio
n
5. N
etw
ork stab
ility
6. Fleet q
uality
7. S
ervice q
uality
8. In
no
vatio
n
9. B
ran
d an
d
Marketin
g
10. O
peratin
g
efficien
cy
Policy levers applied nationally under de-regulation
Taxes & subsides (BSOG) - - - - - -
Statutory concessionary travel - - - - - - - -
Licensing & regulation - - - - - -
Competition Law - - - - - - - - -
Best practice guidance - - - - - - -
Policy levers applied locally under de-regulation
Supported services (gross cost) - - -
Supported services (net cost) - - - -
Discretionary concessionary travel - - - - - - - -
Targeted capital funding - - - - -
Planning, infrastructure
investment & traffic management - - - - - -
Demand management - - - - - - -
Policy levers under alternative market models
Partnerships
Franchising
In the following sections we provide a more detailed discussion of how central and local government
policies can influence the supply and demand of local bus services. The discussion considers the
influence that the government can have on each service attribute in turn under de-regulated,
partnership and franchising specifications.
Key: – Ability to determine, – Direct Impact, – Indirect Impact, – Minimal/No Impact

© 2016 KPMG LLP, a UK limited liability partnership and a member firm of the KPMG network of independent member firms affiliated with KPMG International
Cooperative (“KPMG International”), a Swiss entity. All rights reserved. 70
5.4.1 Fares
De-regulated model
Under the de-regulated model, outside of the tendered market, LTAs have limited ability to influence
the structure and level of fares, although they can fund discretionary concessionary travel. The
payment of BSOG by central government can help to keep fares lower than they otherwise might be
without it.
Evidence collected as part of our stakeholder interviews suggest that operators are deterred from
collaborating on fares because it may harm their commercial interests and could be in breach of
Competition Law.
Where local markets are competitive, market forces incentivise operators to keep fares low and
commercial pressures help manage the tension between delivering a simplified fare structure and
offering a range of products tailored to specific market segments. Local markets are however not
always contested and the CC estimated that a lack of competition could lead to fares above levels
that would otherwise apply.
Partnerships
The partnership model provides additional flexibility for an LTA to influence fares policy in the local
network including the maximum fare and the frequency of changes, but this has to be achieved
through negotiation with operators. Fares can be capped in a SQP but both approaches are subject to
Competition Law which may be a significant constraint and risk for LTAs and operators to achieving
desired outcomes. Partnership agreements can be unstable unless they are backed with
commitments or a strong relationship between the operator and LTA – for example with political
support for the agreement from the LTA. Operators take revenue risks on commercial services and
have to consider the risks of fares policy set or negotiated with the LTA within a VQP or SQP area.
Franchising
Under franchising the LTA can have complete flexibility and control over setting fares and is less
constrained by Competition Law. LTAs have flexibility over the level of revenue risk they are exposed
to through the use of net and gross cost contracts. Depending on the nature of the contract, this
could mean that LTAs take on additional fares risk associated with running all local bus services
rather than just supported services. This additional influence over fares however could help the LTA
deliver wider transport and social objectives especially when supported by strong fares governance
processes that provide long term structure and stability to periodic fares reviews.
5.4.2 Smart and integrated ticketing
De-regulated model
Under the de-regulated model, the LTA has limited ability to achieve ticketing integration through
policy levers outside of supported services. Achieving ticketing integration could be a particular
challenge in markets with a large number of operators. Creating incentives linked to BSOG payments
have influenced the installation of smart ticketing technology on board local buses but it does not
incentivise their use or the development of integrated ticketing.
Partnerships
Under the partnership approach the LTA has some ability to influence and increase the adoption of
multi-operator ticketing schemes (MOTs) and other ticketing products, but this will often require
negotiation through a partnership agreement, and may only be adopted by some operators.
Under the partnership approach, operators have limited incentives to provide integrated ticketing
outside of their own services as it creates additional commercial complexity and may increase
competition by removing a barrier to entry. Multi-operator ticketing often forms part of partnership

© 2016 KPMG LLP, a UK limited liability partnership and a member firm of the KPMG network of independent member firms affiliated with KPMG International
Cooperative (“KPMG International”), a Swiss entity. All rights reserved. 71
agreements, although such schemes often include a fare premium relative to operators own ticketing
products. Under the partnership approach the costs of MOTs are borne by operators.
Franchising
Under franchising the LTA has full control of ticketing and can introduce different fares structures
such as zonal fares. It can also fully integrate ticketing with other modes of transport. The revenue
risks associated with integrated ticketing are governed by the nature of the contract.
Under franchising an LTA has the potential to achieve efficiencies through the introduction of a single
unified ticketing system rather than multiple types. By doing this the LTA can eliminate premia, make
the bus network simpler and easier to understand.
5.4.3 Network coverage and accessibility
De-regulated model
Through supported services, LTAs can improve accessibility for local areas through directly funding
socially necessary services. They can also support particular social or geographic groups through
concessionary travel. They cannot however cross-subsidise routes from more profitable areas and
there may therefore be a separation between the commercial and non-commercial sections of the
bus network.
Partnerships
In the partnership approach LTAs have some ability to influence the design of the commercial route
network through negotiation with operators. For example the LTA may seek to agree changes in
route or timetables between different operators to improve coverage. The risks associated with the
design of the network lie mostly with operators. LTAs do incur some risks through the specification
of supported services and partnership agreements.
Operator incentives with regard to the design of the bus network are primarily commercial. Operators
may be influenced to consider wider issues through the partnership approach, but this will tend to be
driven by trade-offs with the LTA for greater investment for example.
In the partnership approach operators pay for the provision of commercial services and receive
revenues directly from passengers. LTAs pay for supported services and may receive revenues
depending on the contract. LTAs may also have some limited costs associated with VQPs or SQPs.
Franchising
Under franchising the LTA can take full control over the design of the bus network and can therefore
influence levels of network stability and accessibility. A bus franchise could potentially create
efficiencies through re-designing the bus network to spread bus services more evenly, reducing
'wasteful' competition or service duplication. It could also allow revenues from popular services to be
used to support service for which there is less demand. However, unless the network is suitably
managed, bus franchising could result in networks being less responsive to changing market
conditions, with greater reliance on cross-subsidy leading to lower levels of efficiency over the longer
term.
5.4.4 Network integration
De-regulated model
The LTA has limited ability to achieve high levels of network integration in the de-regulated model.
LTAs can undertake marketing and information provision on behalf of operators. The LTA is
sometimes viewed as responsible for the overall integration of the transport network, but has little
control of the commercial bus network.

© 2016 KPMG LLP, a UK limited liability partnership and a member firm of the KPMG network of independent member firms affiliated with KPMG International
Cooperative (“KPMG International”), a Swiss entity. All rights reserved. 72
Partnerships
In the partnership model the LTA can achieve some service integration and coordination of
information provision etc. through negotiation with operators. Some LTAs have been able to achieve
agreement over service frequencies, timing of changes to the bus network, and improved marketing
and information sharing about general bus services.
Operators are not always incentivised to provide network integration outside of their own commercial
networks, or with other modes such as rail/tram and park and ride. This means that network
integration is more difficult to achieve where there are more competitors in a local market.
Costs associated with network integration initiatives – Joint branding, RTPI, joint timetables, MOTs
etc. can be shared under the partnership approach.
Franchising
Under franchising the LTA has full control of bus services and can plan and improve network
integration by linking services with other modes of transport, and by providing greater long term
certainty over the bus network subject to funding. It can also more effectively link bus routes with
planning policy and wider transport as part of a transport/economic strategy or plan.
Operators are directly incentivised to achieve network integration through competition for supported
services. The LTA also has the potential to achieve a range of efficiency savings by improving the
coordination and integration of the bus network. This could be achieved by providing comprehensive
information on timetables, RTPI for all services and integration of bus services with other modes.
This could result in improved perceptions of the bus market and increases in patronage. The
franchising model will also provide the LTA with more information on demand, supply and other
factors which may be useful for wider planning purposes.
5.4.5 Network stability
De-regulated model
LTAs have limited ability to achieve network stability through existing policy levers. Operators are
free to make changes to the bus network based on commercial decisions.
Partnerships
Under the partnership model the LTA has no direct control of changes to the bus network timetable,
but can influence changes through negotiation with operators. There are several examples of
operators agreeing to only make route or timetable changes on specific days throughout the year –
allowing the LTA to undertake consultation and update route maps more easily.
Operators have mixed objectives – to maintain stability in their core network to encourage patronage
growth whilst allowing the network to evolve to improve efficiency and to respond to competitive
challenges. Operators may also use small changes to improve the operational performance of their
bus routes.
Franchising
Under franchising LTAs have complete control over the service timetable and can limit the frequency
of changes to improve the stability of the network.

© 2016 KPMG LLP, a UK limited liability partnership and a member firm of the KPMG network of independent member firms affiliated with KPMG International
Cooperative (“KPMG International”), a Swiss entity. All rights reserved. 73
Pressure to maintain a stable network of services could mean that services become less responsive
to market conditions and over time it is possible that the network design could become less efficient
than one developed by operators responding to commercial incentives. On the other hand, if
franchises are well managed, the LTA has an incentive to act in the public interest and may have a
better understanding of areas of future growth (based on planning applications for example) meaning
that it could better anticipate and serve new areas of demand.
Under franchising an LTA may be able to limit changes to the bus network which might improve
perceptions and stimulate additional patronage growth through providing a more stable network. On
the other hand this stability may increase costs by reducing the ability of the network to evolve in
response to changes in passenger demand resulting in higher costs, higher fares or reduced levels of
service.
5.4.6 Fleet quality
De-regulated model
LTAs can specify the quality of the fleet for supported services, and there are a range of DfT funds
and policy requirements which have helped to improve the level of fleet quality over recent years for
example with the Green Bus fund, DDA and emission requirements.
Partnerships
In the partnership approach, operators are free to choose the type of bus and equipment used for a
service based on commercial considerations. LTAs can have some influence through supported
services, VQPs, SQPs and through joint bids to DfT funds.
The commercial and delivery risks associated with setting levels of fleet quality lie with the operators
who face competition for passengers. Operators face incentives to provide the optimum level of
service quality to improve their commercial outcomes. They may also differentiate levels of fleet
quality between different markets based on market demand and passenger willingness to pay.
Franchising
Under franchising the LTA can specify all aspects of fleet quality which, subject to funding and fleet
availability, could help to standardise vehicle quality across franchise areas providing passengers with
greater certainty on what to expect.
5.4.7 Service quality
De-regulated model
Under the de-regulated model the LTA has limited ability to influence levels of service quality outside
of the tendered service market. Operators are free to determine levels of service quality – although
service punctuality is regulated by the Traffic Commissioner which can impose fines and other
penalties for late running service or low quality buses.
Partnerships
In a partnership approach, operators specify most aspects of service quality based on commercial
judgements, although an LTA can have some influence through supported services and partnership
agreements which can set targets or minimum standards for levels of service quality.
Operators also hold the revenue risks for setting the level of service quality and therefore face
stronger commercial incentives to set levels appropriately. They may also face incentives to
differentiate service quality to improve their competitive position relative to other operators –
resulting in greater variation in service quality.

© 2016 KPMG LLP, a UK limited liability partnership and a member firm of the KPMG network of independent member firms affiliated with KPMG International
Cooperative (“KPMG International”), a Swiss entity. All rights reserved. 74
Franchising
Under franchising, the LTA can define service quality as part of the contract specification, providing
operators with commercial incentives aligned to all aspects of operations. As with the specification of
vehicle quality, the level of service quality will be constrained by market conditions and the availability
of funding. Depending on the nature of the contract, the risk of incorrectly specifying service quality
sits with the LTA – the greater the LTA control the greater the risk.
5.4.8 Innovation
De-regulated model
Under the de-regulated model the LTA may have some limited influence over specific areas of
innovation through bidding for DfT funding for example – but there are no policy levers at a local level
which can be used to stimulate innovation in more direct ways – although the removal of barriers to
entry and promotion of competition could have a positive effect.
Partnerships
In the partnership model, operators have full control over the level of innovation they choose to
develop through research and development and ideas for new services and their delivery. LTAs have
little control over this except where specific innovations can be agreed, specified or encouraged as
part of a partnership agreement. Under the partnership model the costs of developing and trialling
new innovation will largely fall to the operators unless undertaken in conjunction with an LTA as part
of a partnership agreement.
Franchising
Depending on the nature of the contract, franchising can provide powerful incentives for bidders to
innovate to improve the quality of their franchise bids. Once a contract is won however, there may be
less scope to respond to changing market conditions or adopt new technologies, especially where
that change requires a variation to the contract. Without effective contractual change control
mechanisms, the longer the contract duration the greater the risk of inefficiencies incurred by a lack
of innovation.
5.4.9 Branding and marketing
De-regulated model
LTAs can undertake generic marketing of the bus market to promote awareness, but this is
hampered by the lack of certainty over the route network and the nature of competition between
operators – which can prevent common branding of services and timetable information. Operators
have some incentives to undertake marketing activities, but tend to focus on their own services
rather than the network as a whole.
Partnerships
Under the partnership approach, operators set their own branding and marketing policy which will be
distinct from other operators. The LTA may have some influence through partnership agreements but
this will often be secondary to operators own brands.
Franchising
Under franchising the LTA can take full control of marketing and branding across the whole bus
network. The LTA has stronger incentives to undertake network wide marketing and to adopt a
common brand for transport services to aid general awareness.
Under franchising there may be greater potential for place making/network branding which may help
to grow patronage for the overall network. Under the partnership model operators have limited
incentives to undertake this activity. Under franchising the LTA can also adopt a unified marketing

© 2016 KPMG LLP, a UK limited liability partnership and a member firm of the KPMG network of independent member firms affiliated with KPMG International
Cooperative (“KPMG International”), a Swiss entity. All rights reserved. 75
and branding strategy which has the potential to provide benefits by improving perceptions of the
market.
5.4.10 Operating efficiency
De-regulated model
In a well-functioning, de-regulated market, operators are incentivised to provide the right services and
to provide those services in an efficient way. As operating costs are strongly influenced by wage and
fuel costs, government interventions that improve the flow of traffic can materially impact on the cost
efficiency of bus operations.
Partnerships
Partnership agreements often focus on enhancing infrastructure and traffic management and as such
they provide opportunities to improve operating efficiencies. Operators are incentivised by both the
partnership agreement as well as competitive pressures to pass on operating efficiencies to
passengers through investing in vehicle and service quality.
Franchising
The potential impact of franchising on operating efficiency is complex. Greater service coordination
and integration has the potential to reduce the number of inefficient services arising from wasteful
competition and service duplications. However pressure to maintain network stability could mean
that unless networks are actively managed there is a greater risk that services will not respond to
changing market conditions. In addition, greater LTA control over networks could increase the
effectiveness of collective negotiation on employment terms and conditions resulting in higher wage
costs.
5.5 Stakeholder perspectives
As part of the stakeholder interviews, we asked about possible changes to the regulatory model for
bus services, as well as the strengths and weaknesses of partnership working and franchising. An
overview and summary of stakeholder responses to these questions is presented in the table below.
It is important to note that the discussions covered three broad types of market model including de-
regulated, partnerships and franchising. Whilst there are variations to each model we did not direct
respondents to discuss the pros and cons of specific variations.

© 2016 KPMG LLP, a UK limited liability partnership and a member firm of the KPMG network of independent member firms affiliated with KPMG International Cooperative (“KPMG International”), a Swiss entity. All rights reserved.
76
Table 14: Stakeholder perspectives
Q10. What changes, if any, are required to the way the local bus services are planned, funded and delivered?
There was a clear division between larger operators and PTEs in responding to this question, with all but one operator stating that the current de-regulated
model was the most appropriate method of delivering bus services, although some operators stated that they were comfortable with both models. PTEs
highlighted the important role of the bus network for local economic and social objectives and were generally seeking significant changes to the operating
model. PTEs highlighted that in large parts of the market there was no competition and it was difficult for an authority to influence the market.
■ Existing legislation provides a good coverage
■ Provides the option for a number of market types with
partnerships being the preferred option
■ Any change needs to be considered in relation to;
– High passenger satisfaction
– Operator’s investments in the network
– Success of partnerships
■ There needs to be changes, including to the power of LTAs,
objective of the market and funding
■ Uncertainty surrounds BSOG, concessionary fares and
capital funding
■ LAs have different needs and differing operating models
may be more appropriate for certain areas
■ No major changes identified
■ Most are operating in both commercial and tendered
markets
■ Funding levels and uncertainty over these are seen as an
issue, notably in relation to tendered services, BSOG and
concessionary fares
Large operators
PTEs
Other operators
■ Concerns regarding funding arrangements and a preference
for greater ring fenced funding
■ Partnership models were seen to be working where
mentioned
■ Pragmatic approach based on what will achieve objectives
■ Concerns over the ability of LTAs to manage network
planning, with operators seen as best placed to undertake
this task
■ Need for a network that is flexible and responds to public
demand
■ Would like to see greater support of the industry although
this is unlikely to happen for political reasons
■ Operators and Local Authorities need to better understand
their customers demands
Local authorities
Associations

© 2016 KPMG LLP, a UK limited liability partnership and a member firm of the KPMG network of independent member firms affiliated with KPMG International Cooperative (“KPMG International”), a Swiss entity. All rights reserved.
77
Q11. What are the strengths/weaknesses of Quality Partnerships?
There was broad agreement across all parties that partnership arrangements had delivered benefits in many cases, allowing all parties to benefit by
delivering to their strengths. Some smaller operators were less positive about partnerships stating that they strengthen barriers to entry and helped to
entrench dominant operators. LTAs and PTEs stated that there were often limits to what could be achieved through the partnership approach.
Operators were positive about the benefits of partnership working, and gave examples of where it was perceived to be delivering good outcomes. A
preference was expressed for voluntary partnerships, although it was noted that they don’t work in every area and there can be trust issues between the
parties. In addition one operator noted examples where partnership arrangements favoured a dominant operator and were potentially seen as anti-
competitive in this respect.
■ All parties bring specific expertise to the partnership
■ Committed attempt to improve service for customers
■ Don’t work everywhere and there can be trust issues
■ Improve understanding of the customers base
■ Can create real value for passengers through improving
services
■ Issues exist surrounding the risks and rewards of
undertaking a partnership
■ Might not allow for large enough changes to be noticeable to
stakeholders or to achieve objectives
■ All market participants can receive benefits
■ Preference for voluntary nature and belief that LTA needs to
be well resourced
■ Partnerships can favour dominant market players and could
be seen as anti-competitive
Large operators
PTEs
Other operators
■ Needs willing and engaged participants
■ Partnerships can be strong and create value in many
different areas
■ Can enable the sharing of information and ideas with
operators to improve the market
■ Lots can be achieved
■ Effective participants and good communication between
them is a requirement
■ Vulnerable to one-side changing its position or losing
interest
■ Can target hotspots within the network
Local authorities
Associations

© 2016 KPMG LLP, a UK limited liability partnership and a member firm of the KPMG network of independent member firms affiliated with KPMG International Cooperative (“KPMG International”), a Swiss entity. All rights reserved.
78
Q12. Where do Quality Partnerships work well and what factors are important to their success?
There was strong consensus that partnerships work well where there are shared objectives between all parties and good relationships between key
individuals. It was also noted by several stakeholders that good, committed people being involved from both operators and local authorities was important
to making partnerships work together with political sponsorship and stability over LTA policy objectives. Political support and stability was also often
highlighted as a key factor for success.
■ Work well where operators and LTA have shared objectives
and committed individuals
■ Can be applicable to many different areas
■ Oxford used as a good case study
■ Works well when LTA and major operators come together
with share objectives and have trust
■ Sheffield and Oxford cited as good case studies
■ Requires a stable local authority that has strong individuals
as well as political support
■ Information sharing is seen as important in their success
Large operators
PTEs
Other operators
■ Works well where you have shared objectives
■ Good people needed in both local authorities and operators
■ LTA needs to have the resources such as capital and staff
to make it work
■ Partnerships are easier where there is only one large
operator to deal with
■ Needs to have committed individuals in operators and local
authority
■ Mutual understanding is important and this can be improved
by information sharing
Local authorities
Associations

© 2016 KPMG LLP, a UK limited liability partnership and a member firm of the KPMG network of independent member firms affiliated with KPMG International Cooperative (“KPMG International”), a Swiss entity. All rights reserved.
79
Q13. What are the strengths/weaknesses of Quality Contracts?
There was a divergence of opinion between stakeholders over the relative strengths and weaknesses of greater regulation. LAs noted that franchising
could provide a range of benefits but were generally sceptical that such an approach would be appropriate for their local areas. PTEs were more positive
citing the greater ability to influence the market directly, greater accountability, stability and ability to achieve wider objectives such as integrated ticketing
and linking bus services with the planning system. Some smaller operators stated that there would be benefits from franchising because it would help to
level the playing field and improve competition, but most considered that the current de-regulated market would provide better outcomes for passengers.
■ Current system was viewed as providing a better outcome
■ Little evidence of market failure exists which would justify
there introduction
■ Only way to achieve network improvements, including,
simplified ticketing, ability to set fares and grow patronage
■ Cities should have the ability to plan their own transport
networks
■ LTAs don’t have the required skills
■ Expect that it would be difficult to introduce
■ Unlikely to be an effective as the deregulated model
■ Could deliver network planning and ticketing gains
Large operators
PTEs
Other operators
■ Unlikely to be appropriate for all areas
■ Number of benefits, notably greater coordination and less
wasteful competition
■ Some areas unlikely to have the resources or expertise
■ Franchising arrangements already exist in London, tendered
services and park and ride and can be used to facilitate
social objective aims
■ Commercial operators do a lot to improve the network
■ Could led to simplicity of decision making
Local authorities
Associations

© 2016 KPMG LLP, a UK limited liability partnership and a member firm of the KPMG network of independent member firms affiliated with KPMG International Cooperative (“KPMG International”), a Swiss entity. All rights reserved.
80
Q14. What factors are likely to be important for the success of Quality Contracts, and where might this model work well?
Operators noted that a regulated model is not required to improve services but there was a general consensus amongst others that the markets most
likely to benefit from a more regulated approach are the big cities where bus services have greater benefits for the wider transport network. Several
factors were often highlighted as success factors including – poor performance of the current market and good prospects of competition for franchised
services, an LTA with experience of planning and running transport services, potential for integration with other transport systems, political will to make
the system work and public desire to improve and willingness to pay for improved services.
■ Areas identified included London or areas where market
failure could be practically demonstrated
■ A regulated model is not required to improve service
■ Big cities were seen as most likely to benefit from a QC
■ Factors that were mentioned in deciding whether a QC was
appropriate included;
– Possessing a light rail network
– Political will
– Well-resourced LTA
– Economic geography
■ Political pressures likely to impact network
■ Mixed results based on evidence from Singapore and
Belfast
Large operators
PTEs
Other operators
■ Area needs to have enough critical mass, with community
support
■ Not expected to be implemented by those we spoke to who
prefer the current structure
■ In rural areas high level of tendered service occurs
■ Reliance on public funding creates a risk for stability
■ Only work in areas where the market is underperforming
based on passenger and voter expectations
■ Most likely to occur in large cities
■ Benefits could be achieved in deregulated market and some
inefficient pressures could exist
Local authorities
Associations
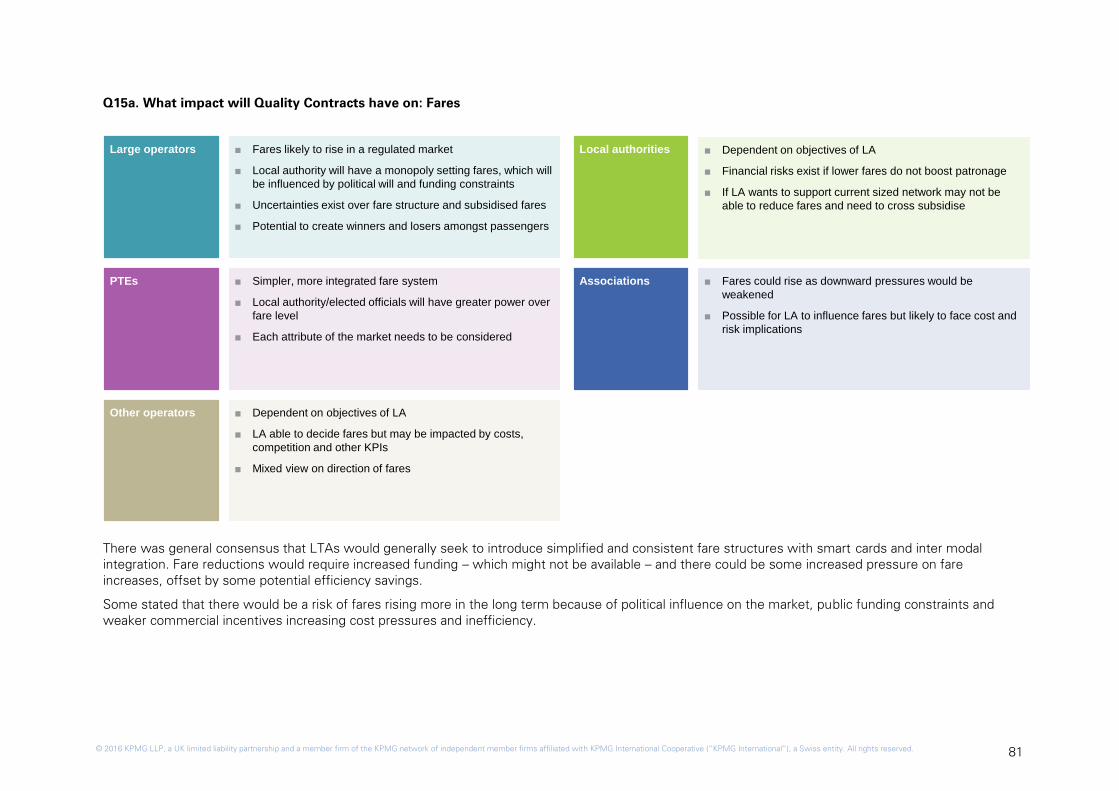
© 2016 KPMG LLP, a UK limited liability partnership and a member firm of the KPMG network of independent member firms affiliated with KPMG International Cooperative (“KPMG International”), a Swiss entity. All rights reserved.
81
Q15a. What impact will Quality Contracts have on: Fares
There was general consensus that LTAs would generally seek to introduce simplified and consistent fare structures with smart cards and inter modal
integration. Fare reductions would require increased funding – which might not be available – and there could be some increased pressure on fare
increases, offset by some potential efficiency savings.
Some stated that there would be a risk of fares rising more in the long term because of political influence on the market, public funding constraints and
weaker commercial incentives increasing cost pressures and inefficiency.
■ Fares likely to rise in a regulated market
■ Local authority will have a monopoly setting fares, which will
be influenced by political will and funding constraints
■ Uncertainties exist over fare structure and subsidised fares
■ Potential to create winners and losers amongst passengers
■ Simpler, more integrated fare system
■ Local authority/elected officials will have greater power over
fare level
■ Each attribute of the market needs to be considered
■ Dependent on objectives of LA
■ LA able to decide fares but may be impacted by costs,
competition and other KPIs
■ Mixed view on direction of fares
Large operators
PTEs
Other operators
■ Dependent on objectives of LA
■ Financial risks exist if lower fares do not boost patronage
■ If LA wants to support current sized network may not be
able to reduce fares and need to cross subsidise
■ Fares could rise as downward pressures would be
weakened
■ Possible for LA to influence fares but likely to face cost and
risk implications
Local authorities
Associations

© 2016 KPMG LLP, a UK limited liability partnership and a member firm of the KPMG network of independent member firms affiliated with KPMG International Cooperative (“KPMG International”), a Swiss entity. All rights reserved.
82
Q15b. What impact will Quality Contracts have on: Service quality
There was general consensus that service quality would be dependent on the specification of the franchise, but that material improvements would require
higher levels of investment by the LTA, which would be dependent on long term funding. Some stakeholders stated that service levels would become
more consistent with a minimum standard set by the LTA and others noted that a franchise system could improve service quality by allowing the LTA to
introduce KPI regimes and greater monitoring of bus services. LTAs would be able to exclude operators undercutting service levels leading to an overall
improvement in service quality. Some operators stated that service quality was a key part of their competitive strategy and would be undermined by the
introduction of a franchise. Operators have strong incentives to improve service quality and to set it at an appropriate level.
■ Based on funding commitment which seems unlikely to
increase
■ London has a £400m subsidy which goes mostly on service
improvements, other local authorities do not have the same
powers
■ Some ability to influence with KPIs within contract
■ Standards will be set in contract
■ Likely improvements include emissions standards, driver
training and minimum bus quality
■ Likely that service quality will decrease, as competition will
fall
■ In areas of very low quality improvements could be made
Large operators
PTEs
Other operators
■ Quality is based on funding levels
■ Improvements in timetables and minimum service levels
■ Status quo to slight improvements expected
■ Based more on LTA preference and less on competitive
incentives
Local authorities
Associations

© 2016 KPMG LLP, a UK limited liability partnership and a member firm of the KPMG network of independent member firms affiliated with KPMG International Cooperative (“KPMG International”), a Swiss entity. All rights reserved.
83
Q15c. What impact will Quality Contracts have on: Operating performance
Generally stakeholders agreed that operating performance could be improved under a franchise, but only if the LTA is willing and able to invest additional
resources in greater monitoring of bus services and managing KPI contracts with operators. Stakeholders differed over how likely this was. PTEs stated
that under a franchise they would have stronger incentives to invest in the bus network because of exposure to revenue risks, this would lead to
improvements in operating performance in the long term. Operators stated that they are already strongly incentivised to deliver good network
performance because of the risk of fines from Traffic Commissioners – this incentive would be weakened under a franchise. They also noted that there
are trade-offs between greater operating performance and overall efficiency.
■ Do LTAs have the ability to provide an effective network
■ Dependent on funding and how resources are allocated
■ Effective network will be provided
■ Incentive to provide better infrastructure
■ Limited impact
■ What incentives will be implemented in the contract
■ Dependent on local authorities
Large operators
PTEs
Other operators
■ Mixed impacts on reliability
■ Traffic commissioners already have ability to enforce
reliability and punctuality
Local authorities
Associations

© 2016 KPMG LLP, a UK limited liability partnership and a member firm of the KPMG network of independent member firms affiliated with KPMG International Cooperative (“KPMG International”), a Swiss entity. All rights reserved.
84
Q15d. What impact will Quality Contracts have on: Operating cost efficiency
PTEs often stated that a franchise system would create potential efficiencies through removing duplicated services and excess competition and reducing
operators’ profit margins by increasing competition to run services – particularly where there was market power. Operators generally stated that a
franchise system would result in higher costs over the long term. The main reason cited was that it would result in harmonisation of staff costs and
greater pressure from unions for pay rises. Some stakeholders stated that the reduction in commercial incentives and increased political influence over the
network could result in a reduction in efficiency over the long term due to a perceived reduced responsiveness of the sector to changing market condition.
■ Costs will likely increase as cost/regulation creep occurs
■ Wages will increase due to harmonisation
■ Issues regarding allocation of resources (buses life 15
years, contract only 5)
■ Operating efficiency would improve, although margins might
decrease
■ Efficiency gains can be reinvested in market
■ Most operators have similar cost base and incentives to
keep it low
■ Issues might exist limiting efficiency gains such as depot
location and TUPE
■ Examples given when large operators and municipal
operators are not as efficient as they could be
Large operators
PTEs
Other operators
■ Operating costs are likely to rise
■ Dependent on competition for contract and whether non-
commercial routes are continued
■ Local authorities will be reluctant to cut routes
■ Efficiency is driven by competition
■ London model suggests cost will go up based on increases
in staff bargaining power
Local authorities
Associations

© 2016 KPMG LLP, a UK limited liability partnership and a member firm of the KPMG network of independent member firms affiliated with KPMG International Cooperative (“KPMG International”), a Swiss entity. All rights reserved.
85
Q15e. What impact will Quality Contracts have on: Product and service innovation
PTEs generally considered that under a franchise they could incentivise greater innovation through contract specification and targeting particular aspects of
the bus market for improvements. Some LTAs stated that under franchising they could focus on delivering improvements in particular areas such as
ticketing and bus technology, but would probably lack the commercial incentives and abilities to encourage wider innovations in marketing, pricing and
service design for example. Operators were more sceptical about the benefits of a franchise on levels of innovation often stating that any improvement
would require additional funding for the LTA. They considered that franchising would undermine incentives for ongoing innovation and more commercial
aspects of innovation such as the marketing of services and pricing.
■ Operators provide more innovation currently
■ Opportunity to innovate would be limited to contract renewal
■ Wifi on buses in Manchester but not in London
■ Limited response to question
■ Operators would need to innovate to win bid
■ Innovation would be stifled
■ No incentive to innovate
Large operators
PTEs
Other operators
■ Not much difference
■ LTA can foster innovation, for example multi-operator tickets
■ Operators have driven innovation historically
■ Innovation can be led by operators or LTA, TfL
■ Innovation can be improved by reducing uncertainty,
ensuring well-funded and having the best people
Local authorities
Associations

© 2016 KPMG LLP, a UK limited liability partnership and a member firm of the KPMG network of independent member firms affiliated with KPMG International Cooperative (“KPMG International”), a Swiss entity. All rights reserved.
86
Q15f. What impact will Quality Contracts have on: Local Authority costs
Most stakeholders stated that LTA costs would increase significantly with franchising as a result of the need to develop additional procurement, design
and management functions and the QCS development costs which would require consultancy support and potential legal costs. There was also some
concern – particularly amongst LTAs about their current and future levels of staff and resourcing and their ability to manage franchise services based on
current resources. Some stakeholders stated that additional costs would be offset by efficiencies in the procurement and delivery of services, and that
wider economic benefits would also offset any additional financial costs. Operators often stated that LTAs and PTEs currently lack the skills and resources
to manage and run bus services. Some also stated that LTAs tended to underestimate the costs of operating bus services, the level of effort involved in
designing services and the level of risk they would have to bear under a franchise system.
■ Costs will increase for local authority
■ Local authority will become more bureaucratic as will need
to manage contracts and plan the network
■ Costs will be incurred but can be mitigated by experience
and use of technology
■ Not a major increase compared to what is already done
■ Expertise is required by LTAs which some possess and
some don’t
■ Increase in costs for LTAs based on procurement, planning
and monitoring
Large operators
PTEs
Other operators
■ Efforts by LTAs to become more efficient in recent years
■ Estimated cost to set up is £1m for some this could be
prohibitive
■ Extra staff would be needed
■ LTA costs will increase
■ Potential to be offset if wider benefits are considered and
areas are used to offset others
■ Would require additional resources and a boost to
experience of staff
Local authorities
Associations

© 2016 KPMG LLP, a UK limited liability partnership and a member firm of the KPMG network of independent member firms affiliated with KPMG International Cooperative (“KPMG International”), a Swiss entity. All rights reserved.
87
Q16. What are the risks in the delivery of Quality Contracts?
All stakeholders noted that there would be risks associated with the implementation of a regulated operating model. Common risks highlighted included
the risks associated with transition, implementation issues, legal challenge from operators, risks of political influence around elections, the need to make
changes to contracts in response to shocks, LTAs’ ability to cope with revenue risks and the potential for a lack of competit ion due to difficulties accessing
depots for example.
The risk which was highlighted by most parties was that of operator challenge to the process, with stakeholders citing the example of the reaction to
Nexus proposed quality contract scheme by operators. The risks identified included not just the ability to deliver the scheme, but also to significant
additional costs associated with a potential challenge.
■ LTA would have a lot more risk exposure
■ Network might become less adaptive as locked into a
contract
■ Lack of investment and asset stripping in the transition
period
■ Operator’s best placed to run market as experienced and
are flexible
■ Legal challenge by operators
■ Transition period is likely to be difficult based on expected
operator’s response
■ Uncertainty over financial risks of TUPE, depots and new
processes
■ Operator protests
■ Reduction in quality of market
■ Local characteristic issues based on decision makers, cross
boundary services and urban vs rural
Large operators
PTEs
Other operators
■ Financial risks to LTAs based on costs changing and
revenue predictions
■ Relevant to the local area based on passenger needs,
resources and political will
■ In areas where the current systems is working well and this
could be undermined by introduction of QC
■ Smaller areas would see a fall in competition
■ Operators might launch legal challenge or leave the market
■ Increased regulation could raise costs and reduce quality of
service
Local authorities
Associations

© 2016 KPMG LLP, a UK limited liability partnership and a member firm of the KPMG network of independent member firms affiliated with KPMG International Cooperative (“KPMG International”), a Swiss entity. All rights reserved.
88
Q17. Are there other operating models relevant to the delivery of local bus services?
There was a wide range of responses to this question with numerous ideas for improving bus market policy. One of the most common responses from
stakeholders was that partnership arrangements could be strengthened and that there could be better use of existing policy levers amongst LTAs to
resolve issues in local markets.
■ Partnerships models have been successful
■ Potential to increase their scope
■ Potential improvements in interaction between stakeholders
(Operators, LTAs, HA)
■ Partnership models have been tried and have not achieved
all objectives
■ Current system is not working
■ Greater use of park and ride, bus infrastructure etc
■ Greater coordination between market participants
■ Greater role for traffic management and traffic
commissioners
Large operators
PTEs
Other operators
■ Lots of potential to improve the market
■ Need to have a longer term view of market, considering all
the factors
■ Making it easier to have integrated transport that links in
with community transport and rail that has smart card
ticketing
■ More support for smaller operators and community sector
■ Reduced fuel tax for ‘greener modes’ of transport
■ Current legislation provides a number of policy options
■ LTAs have not fully explored current models
■ LTAs are not best placed to design the network
■ Improvements in transparency of data
Local authorities
Associations
© 2016 KPMG LLP, a UK limited liability partnership and a member firm of the KPMG network of independent member firms affiliated with KPMG International
Cooperative (“KPMG International”), a Swiss entity. All rights reserved. 89
5.6 Summary and discussion
Under the de-regulated model, LTAs have a range of policy tools which can be used to influence the
supply and demand for local bus services, to mitigate against market imperfections and achieve their
wider policy objectives. The ability to provide supported services, invest in bus priority measures and
offer concessionary travel, in addition to the policy measures applied at a national level by the DfT mean
that LTAs can have influence on various attributes of the bus market. However, there are several
attributes over which LTAs have little direct influence, including the level and structure of fares (for non-
concessionary passengers), integrated ticketing, the stability of the network, marketing and common
information and the overall integration of the bus network into wider transport policy. Where these
objectives are important, the LTA may seek greater influence. In principle this can be achieved through
two alternative approaches – partnership with operators or the introduction of a franchise.
The partnership model can strengthen the ability of the LTA to influence the demand and supply of
local bus services and can be used to achieve a wider range of objectives by bringing LTAs and
operators together to develop the market. To some extent partnerships can provide greater influence
over fares, ticketing, network integration and stability, but there are limits to what can be achieved
with this model. At their most successful, partnerships have been very effective at improving
services. However, success is likely to be limited to areas with strong working relationships between
parties. This may be more likely in areas with a single large operator, rather than multiple small
operators with competing interests.
The partnership approach retains many of the positive features of the de-regulated model including
maintaining the incentives for operators to meet the needs of passengers through innovation,
efficiency and ongoing development of the market through competition – whilst responding to the
objectives of the LTA. Funding and investment risks also remains with the operators. However,
even where partnerships are successful, there are some features that cannot easily be delivered.
This includes fully integrated fares and services, consistent branding and information for the network
as a whole.
The franchising approach (under a gross cost contract) offers the LTA greater influence over the
demand and supply of local bus services, including greater control over the integration of fares and
services and branding and marketing, however this comes at the cost of imposing greater financial
risk on the LTA and potentially weakening operator incentives at least in the short term to respond to
changing market conditions, as well as costs associated with transitioning from current arrangements
to an alternative market model. There are also concerns raised during stakeholder interviews that
competition for franchise contracts may not be efficient and that competitive incentives may be
reduced especially over longer contract durations. Some of these disadvantages however will likely
be able to be mitigated through careful contract design and arguably the LTA will be able to provide a
strong collective voice on behalf of the passenger.
The policy levers available under franchising provide the LTAs with scope to address three of the four
potential market imperfections including: the need to integrate fares and services and provide
common branding and marketing; the need to align incentives between bus operators and the
infrastructure provider; and the scope to realise the wider economic, social and environmental
benefits from expanding the demand for and supply of local bus services. However, whilst the
government can help to create conditions to support sustainable competition for the market, it is
ultimately up to operators to decide whether or not to bid for contracts.
Table 15 summarises the key differences between the partnership and franchising models (under a
gross cost contract) in terms of the ability to influence the market attributes and their effects on
different aspects of the bus market. In determining which approach is most suitable for specific local
markets, the benefits of giving the LTA greater influence to achieve its wider economic, social and
environmental objectives need to be set against the costs of potentially weakening commercial
incentives which will generally help to provide benefits in terms of innovation, efficiency and meeting
the needs of passengers over the long term.

© 2016 KPMG LLP, a UK limited liability partnership and a member firm of the KPMG network of independent member firms affiliated with KPMG International
Cooperative (“KPMG International”), a Swiss entity. All rights reserved. 90
Table 15: Main differences between partnership and franchising (gross cost) approach
Aspect Main differences between partnerships and franchising
Ability to
influence
Under franchising the LTA can: set fares, set fare structures, define services and timetables,
define levels of service quality, introduce integrated ticketing, introduce common marketing
and branding, limit changes to services and introduce innovations such as RTPI or AVL in a
comprehensive way. The LTA also gains the ability to integrate bus services with wider
policy such as land use planning and other modes of transport. The LTA may also gain
greater influence over the use of bus infrastructure and more flexibility in the design of
contracts for the use of that infrastructure (for example to access private finance). The ability
to make changes is limited by funding and operators willingness to bid for contracts defined
by the LTA.
Risk Depending on the nature of the contract, under franchising the LTA is exposed to revenue
and cost risk associated with any changes to the bus market. This places greater funding
risk on the LTA and also means that more of the bus network will be affected by any LTA
funding shocks or changes in local government priorities. The LTA is also responsible for the
overall operation of the bus network which will transfer delivery risk and liability from the
operator to the LTA.
Incentives Under franchising the incentives for stakeholders are altered significantly. Operators are
incentivised to meet the needs of the LTA rather than passengers. This allows the LTA to
incentivise a wider range of behaviours more comprehensively which could be used to
achieve wider policy objectives, but this also potentially weakens the link between market
outcomes and passenger preferences (although the LTA could proxy passenger needs).
LTAs exposure to revenue risk from the bus market may increase incentives for investment
in bus priority measures and other forms of investment such as marketing spending.
Allocation of
costs and
revenues
Under franchising the costs and revenues of bus services are ultimately allocated to the
LTA, although this does depend upon the nature of the contacts adopted. The LTA funds
services through contract payments to operators who collect fares and pay these back to
the LTA. Operators may also be incentivised by service quality payments or penalties.
Central government funding such as BSOG could also be re-distributed from operators to
LTAs. Under franchising there is a much stronger link between local government funds and
outcomes for the bus market.
Potential
efficiencies/
additional costs
Under franchising the LTA could rationalise the route network to remove duplication. The
harmonisation of fares, service quality, ticketing and other aspects of the service may
provide benefits by improving passenger perceptions of the bus service and certainty over
service levels but will tend to reduce service differentiation. An LTA could also undertake
more network based marketing which could help to promote bus travel demand. On the
other hand greater public sector involvement may increase the likelihood of collective
negotiation on employment terms leading to increasing wage costs. Lower rates of change
to the bus network could also result in a less efficient network, although this may also
improve levels of confidence in the bus market for long term planning. It is important to note
that the recent partnership agreement in South Yorkshire incorporates an innovative
coordinated approach to network planning, with cost efficiencies passed on to passengers
in the form of lower fares.

© 2016 KPMG LLP, a UK limited liability partnership and a member firm of the KPMG network of independent member firms affiliated with KPMG International
Cooperative (“KPMG International”), a Swiss entity. All rights reserved. 91
6 Developing the case to intervene in
the market
6.1 Introduction
In this section we review the factors that are likely to be important when considering intervening in
the local bus market and provide a discussion on their inclusion in a formal appraisal framework. The
review considers the issues described in the preceding sections, the QCS public interest criteria,28
the Regulatory Policy Committee (RPC) approach to assessing changes in regulation29
and the
Treasury Green Book five case model30
.
6.2 QCS Public interest criteria
The existing Quality Contract Scheme legislation, set out in the 2000 Act, requires that an LTA
proposing a Quality Contract Scheme must normally be satisfied that five ‘public interest’ criteria are
met. The criteria are as follows:
■ The proposed scheme will result in an increase in the use of bus services in the area to which the
proposed scheme relates.
■ The proposed scheme will bring benefits to persons using local services in the area to which the
proposed scheme relates, by improving the quality of those services.
■ The proposed scheme will contribute to the implementation of the local transport policies of
the LTA.
■ The proposed scheme will contribute to the implementation of those policies in a way which is
economic, efficient and effective.
■ Any adverse effects of the proposed scheme on operators will be proportionate to the
improvement in the well-being of persons living or working in the area to which the proposed
scheme relates.
The fifth criterion set out in the existing legislation requires that the LTA will need to satisfy itself that
the potential benefits arising from the scheme outweigh the potentially adverse impacts on
operators. To that end, the DfT directs local transport authorities to its guidance on transport scheme
appraisal.
The assessment of the Quality Contract Scheme Public Interest Criteria will involve a degree on
subjectivity and the reasonableness of methodology and assumptions used to demonstrate that the
criteria have been met will need to be tested to establish their robustness. At the time of writing, an
LTA seeking to establish a QCS should satisfy itself that the criteria are met and provide interested
parties with a fair opportunity to comment on the assessment. The LTA should then submit its
assessment to the QCS board who will assess whether the LTA’s judgement is reasonable. The
proposed Buses Bill may introduce new criteria and processes, but the existing legislation presents a
useful benchmark of the types of issues that LTAs must consider in order to make their case for
intervention in the bus market.
28 DfT (2009) Local Transport Act 2008 Quality contracts schemes: statutory guidance,
http://webarchive.nationalarchives.gov.uk/20111005181506/http:/assets.dft.gov.uk/publications/quality-contracts-schemes-
statutory-guidance/guidance.pdf
29 Regulatory Policy Committee (2014) Recommendations used when scrutinising impact assessments,
https://www.gov.uk/government/publications/how-the-regulatory-policy-committee-scrutinises-impact-assessments
30 HM Treasury (2014) The Green Book, https://www.gov.uk/government/publications/the-green-book-appraisal-and-evaluation-
in-central-governent

© 2016 KPMG LLP, a UK limited liability partnership and a member firm of the KPMG network of independent member firms affiliated with KPMG International
Cooperative (“KPMG International”), a Swiss entity. All rights reserved. 92
6.3 Establishing a case for regulatory change
The Regulatory Policy Committee31
provides external, independent scrutiny of new government
regulations and provides an opinion to Ministers on the quality of evidence included in the regulatory
Impact Assessments.
Based on their experience in reviewing IAs, the RPC recently identified seven recommendations for
those considering potential changes to market regulations, including:
■ Don’t presume regulation is the answer.
■ Take time and effort to consider all the options.
■ Make sure you have substantive evidence.
■ Produce reliable estimates of costs and benefits.
■ Assess non-monetary impacts thoroughly.
■ Explain and present results clearly.
■ Understand the real cost to business of regulation.
Their advice underscores the need to consider carefully the available options and provide substantive
evidence on the working of the current market and how identified market failures contributes to the
under-performance relative to policy objectives and expectations. The potential costs and benefits
arising from the change should be identified and reliably estimated, including consideration of
unintended consequences.
6.4 Department for Transport business case
The Department for Transport follows Treasury advice on evidence-based decision making and it has
developed an appraisal framework based on the Treasury’s five case model which considers whether
interventions:
■ Fit with wider public policy objectives (strategic case).
■ Demonstrate value for money (economic case).
■ Can be procured and are commercially viable (commercial case).
■ Are financially affordable (financial case).
■ Can be delivered (management case).
There is some overlap between the Public Interest Criteria and the Transport Business Case
framework including requirements to consider: the strategic fit of the market intervention against the
broader public policy objectives of the LTA; the expected value for money from the use of public
finances and resources; and the potential distributional impacts of the intervention on individuals and
businesses. There are however no specific requirements in the Public interest Criteria to consider the
affordability of the proposals, their commercial viability from a public procurement perspective and
their deliverability. We return to the importance of these considerations below where we consider
the suitability of the five case model to the appraisal of regulatory change in local bus markets.
6.4.1 Strategic case
The Strategic Case determines whether there is a problem and whether government intervention is
needed to correct it. It sets out the rationale for change, reviews the options available and
determines their fit with local or national policy objectives. The RPC provides clear guidance on what
government departments might do when considering the case for changes to government regulation.
Whilst the RPC is focussed on minimising costs to businesses (which may not be appropriate in the
31 RPC is an advisory non-departmental public body, sponsored by the Department for Business, Innovation & Skills

© 2016 KPMG LLP, a UK limited liability partnership and a member firm of the KPMG network of independent member firms affiliated with KPMG International
Cooperative (“KPMG International”), a Swiss entity. All rights reserved. 93
context of addressing market failures), this guidance remains useful for considering the strategic case
for the regulatory reform of the bus market.
Based on this guidance, and our assessment of the issues in the local bus market, Figure 25 below
provides a framework to consider the Strategic Case for regulatory reform of the local bus market. It
takes the decision maker through a series of questions intended to identify the problems that need to
be solved, the rationale for a government intervention, whether regulatory reform is the most
appropriate solution and whether it is a proportional response which is likely to provide net benefits.
Figure 25: Strategic Case decision map
Source: KPMG analysis.
The ‘decision map’ reflects the RPC’s advice not to ‘presume that regulation is the answer’ and
addresses three key questions asked by the RPC:
■ Has a market imperfection or regulatory failure been clearly identified that necessitates
government intervention?
■ Have non-regulatory alternatives been considered to correct the cause of the market
imperfection and, if not, has sufficient justification been provided to explain why this would not be
a viable option?
■ Has the ability of the regulatory intervention to correct the causes of market imperfection been
clearly demonstrated and any potential unintended consequences and/or behavioural impacts
taken into account?
We discuss the key issues associated with the questions asked in Figure 25 below.
Q1. Is the market meeting stakeholder
needs and objectives?
Q2. Is underperformance likely to be
caused by market imperfections or
misaligned objectives?
Q3. Could market imperfections or
misaligned objectives be satisfactorily
resolved by existing policy measures?
Q4. Would the benefits of changes to
the regulation of the local bus market
exceed the costs?
Stronger Strategic Case for
Regulatory Change
Where the bus market is working well
and meeting the needs of stakeholders,
the case for change is weak
Where poor performance is not related
to market imperfections – the case for
change may be weak
Existing policy measures may provide a
more appropriate solution
If costs are greater than benefits the
case for change is weak.
Weaker Strategic Case for
Regulatory Change
No
Yes
No
Yes
Yes
No
Yes
No

© 2016 KPMG LLP, a UK limited liability partnership and a member firm of the KPMG network of independent member firms affiliated with KPMG International
Cooperative (“KPMG International”), a Swiss entity. All rights reserved. 94
Q1: Is the bus market meeting stakeholder needs and objectives?
Table 16 shows a set of illustrative questions relating to the service attributes described in Section
5.2. In assessing bus services it will be important to track performance metrics over time and against
comparable services in other areas. It will also be important to consider passenger satisfaction levels
across a range of service attributes.
Table 16: Assessing bus service attributes – illustrative questions
Service attribute Assessment of performance
1. Fares (including concessionary travel) – the
fares paid by passengers and value for money
relative to the level of service provided and other
modes of transport.
■ Are bus fares generally affordable?
■ Are fares rising faster than inflation?
■ Do buses provide value for money to passengers
and are they competitive with other travel options to
existing passengers and potential users?
2. Smart and integrated ticketing – the availability
of multi-operator, multi-modal fares fulfilled on a
smartcard.
■ Are multi-operator tickets available where needed?
■ Are tickets ITSO compatible? Is there a premium for
multi-operator products relative to operator-specific
products?
■ Are ticketing structures simple to understand?
3. Network coverage and accessibility – timetable
quality including journey times, service frequency,
and network coverage.
■ Has the number of commercial or supported
services resulted in reduced accessibility and/or
been detrimental to social inclusion?
■ Has there been a reduction in service frequency?
■ Are end-to-end journey times competitive?
■ Is there a lack of accessibility to particular areas, or
at particular times of day?
4. Network integration – the coordination of the
bus network including its integration with other
modes, the level of service duplication and the ability
to make trips requiring an interchange. This attribute
also the level of information available to passengers
and the ability of the LTA to plan and monitor
services.
■ Are bus services integrated as a network and are
they integrated with other modes?
■ Do passengers understand how to use bus services
where there are different operators?
■ Are common timetables and route maps available?
■ Is RTPI/AVL available on services?
■ Is the information on the performance of the bus
network publicly available?
5. Network stability – the level of stability in the
route network, the frequency of service or timetable
changes and the level of consultation and influence
that passengers and local authorities have over
these changes.
■ Has there been a high turnover in routes or
timetables?
■ Are passengers being consulted over changes to
bus services?
6. Fleet quality – the age and quality of the bus
fleet, including the availability of specific features
such as Automated Vehicle Location (AVL)
equipment, CCTV, smart card readers, low floors,
Wi-Fi and other features.
■ Is the vehicle fleet high quality in terms of age,
efficiency, comfort, technology, accessibility, etc.
and do they meet the needs of the passenger
demographic?
■ Are there significant variations in the quality of local
vehicles?
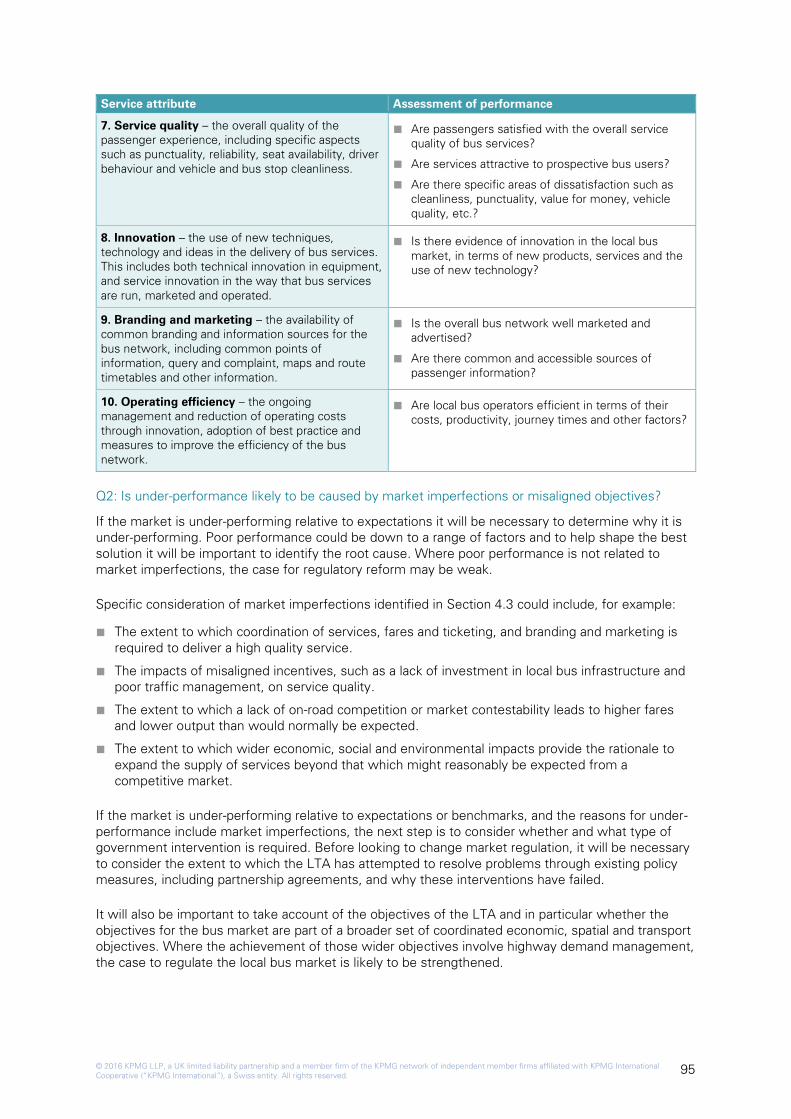
© 2016 KPMG LLP, a UK limited liability partnership and a member firm of the KPMG network of independent member firms affiliated with KPMG International
Cooperative (“KPMG International”), a Swiss entity. All rights reserved. 95
Service attribute Assessment of performance
7. Service quality – the overall quality of the
passenger experience, including specific aspects
such as punctuality, reliability, seat availability, driver
behaviour and vehicle and bus stop cleanliness.
■ Are passengers satisfied with the overall service
quality of bus services?
■ Are services attractive to prospective bus users?
■ Are there specific areas of dissatisfaction such as
cleanliness, punctuality, value for money, vehicle
quality, etc.?
8. Innovation – the use of new techniques,
technology and ideas in the delivery of bus services.
This includes both technical innovation in equipment,
and service innovation in the way that bus services
are run, marketed and operated.
■ Is there evidence of innovation in the local bus
market, in terms of new products, services and the
use of new technology?
9. Branding and marketing – the availability of
common branding and information sources for the
bus network, including common points of
information, query and complaint, maps and route
timetables and other information.
■ Is the overall bus network well marketed and
advertised?
■ Are there common and accessible sources of
passenger information?
10. Operating efficiency – the ongoing
management and reduction of operating costs
through innovation, adoption of best practice and
measures to improve the efficiency of the bus
network.
■ Are local bus operators efficient in terms of their
costs, productivity, journey times and other factors?
Q2: Is under-performance likely to be caused by market imperfections or misaligned objectives?
If the market is under-performing relative to expectations it will be necessary to determine why it is
under-performing. Poor performance could be down to a range of factors and to help shape the best
solution it will be important to identify the root cause. Where poor performance is not related to
market imperfections, the case for regulatory reform may be weak.
Specific consideration of market imperfections identified in Section 4.3 could include, for example:
■ The extent to which coordination of services, fares and ticketing, and branding and marketing is
required to deliver a high quality service.
■ The impacts of misaligned incentives, such as a lack of investment in local bus infrastructure and
poor traffic management, on service quality.
■ The extent to which a lack of on-road competition or market contestability leads to higher fares
and lower output than would normally be expected.
■ The extent to which wider economic, social and environmental impacts provide the rationale to
expand the supply of services beyond that which might reasonably be expected from a
competitive market.
If the market is under-performing relative to expectations or benchmarks, and the reasons for under-
performance include market imperfections, the next step is to consider whether and what type of
government intervention is required. Before looking to change market regulation, it will be necessary
to consider the extent to which the LTA has attempted to resolve problems through existing policy
measures, including partnership agreements, and why these interventions have failed.
It will also be important to take account of the objectives of the LTA and in particular whether the
objectives for the bus market are part of a broader set of coordinated economic, spatial and transport
objectives. Where the achievement of those wider objectives involve highway demand management,
the case to regulate the local bus market is likely to be strengthened.

© 2016 KPMG LLP, a UK limited liability partnership and a member firm of the KPMG network of independent member firms affiliated with KPMG International
Cooperative (“KPMG International”), a Swiss entity. All rights reserved. 96
Q3: Could market imperfections or misaligned objectives be resolved by existing policy measures?
Section 5 provides an overview of the policy measures available to LTAs and an assessment of
their ability to influence different attributes under the de-regulated model, partnerships and
franchising.
Under the de-regulated model, LTAs have a range of policy tools that can be used to influence supply
and demand for local bus services but little direct influence on the level and structure of fares,
integrated ticketing, the stability of the network, marketing and common information and the overall
integration of the bus network into economic, spatial and wider transport policy.
The partnership approach can strengthen the ability of the LTA to influence bus service attributes and
can be used to achieve a wider range of objectives by bringing LTAs and operators together to
develop the market. The strength of this approach can however be limited by the ability to develop
strong working relationships between parties.
Q4: Would the benefits of changes to the regulation of the local bus market exceed the costs?
The final question links into the development of the Economic Case which is discussed in more
detail below.
6.4.2 Economic Case
The Economic Case determines whether or not the preferred intervention provides value for money
for government expenditure and use of public resources. Following the Treasury’s appraisal
requirements, the Economic Case considers economic, social, environmental and distributional
impacts of the intervention, where the costs and benefits are established following the DfT’s
guidance on modelling and appraisal.
Understanding the impacts of alternative market models will require analysis of income and
expenditure for operators and the LTA, together with economic analysis of the benefits to users, non-
users and the wider community. The economic benefits associated with changes in attributes can
be assessed using a standard CBA modelling framework – although new research and analysis
may be required to establish evidence on some of the costs and benefits. The appraisal should
cover the transition of moving between models as well as on-going costs and benefits over the
appraisal period.
The economic analysis of alternative market models will potentially need to take account of:
■ The potential impacts of alternative market models on service attributes including fares, service
quality, fleet quality, network coordination, smart and integrated ticketing and network stability.
■ Interactions between service quality, operating costs and infrastructure costs.
■ The potential for operating efficiencies from service rationalisation and operating inefficiencies
from cross-subsidisation between services.
■ The potential impacts on incentives for innovation and cost efficiency.
■ The allocation of costs and revenues, and the associated risks, between operators and the LTA.
■ The impacts on employment, pension liabilities and industrial relations.
■ Franchise set-up costs and on-going administration costs (see below).
■ Network planning costs, revenue protection, branding and marketing costs.
■ The level of competition for franchise contracts and potential bid margins.
The manner in which these wider effects might vary across different market models is shown
in Table 17.

© 2016 KPMG LLP, a UK limited liability partnership and a member firm of the KPMG network of independent member firms affiliated with KPMG International
Cooperative (“KPMG International”), a Swiss entity. All rights reserved. 97
Table 17: Potential wider effects under different market models relative to the de-regulated model
Wider effects Partnerships Franchising
Changes to operator incentives/risks Greater incentives to work with LTA Incentivised to meet needs of LTA,
not necessarily passengers
(although the two can be aligned)
Changes to LTA incentives/risks No change LTA subject to greater revenue risk
under gross cost contracts
Greater information availability for
LTA
Slight improvements in information
availability
Much greater information available
Potential for integration between
bus network and land use/town
planning
No change Greater certainty over planning
Potential for cross-subsidy of
services
No change Trade-off between accessibility and
economic efficiency
Changes to level and nature of
competition
Uncertain Shift from competition in the market
to competition for the market
Reduced ability to change network
(as a result of policy objectives,
community pressure etc.)
Potential for greater stability Stable network
Greater control over use of
infrastructure
Some additional influence over use
of infrastructure
Complete control over use of
infrastructure
The importance of each of these factors on the Economic Case for change will vary from market to
market. The performance of the franchise will be influenced by the incentive mechanisms within the
contract as well as the level of external funding available for investment in infrastructure, services
and network management.
Recent analysis of capital and revenue expenditure on local bus services generates good economic
returns for each £1 spent32
. If those results are generally transferable across markets, the focus of
the appraisal should be on the availability of funding to target fares and overall service quality
improvements and the impacts of interventions on the allocative, productive and dynamic efficiencies
in the market. Key questions to ask include:
■ Will the intervention unlock new sources of funding?
■ Do surpluses exist in the market and can they be effectively redistributed?
■ Does the LTA have the ability to efficiently determine the right projects to invest in and the right
services to deliver?
■ Will the market be incentivised to make the best use of available resources, maximising output
from a given set of inputs?
■ Will the market arrangements be sufficiently flexibility, responsive and encourage innovation?
■ What additional costs are required to set up and administer an alternative market structure?
One of the challenges likely to face analysts and decision makers will be in understanding the level of
uncertainty across all aspects of the potential market intervention.
6.4.3 Commercial Case
The Commercial Case provides evidence on the commercial viability of the intervention and the
procurement strategy that will be used to engage the market. The specification of the market model
32 PTEG (2013) The Case for the Urban Bus - the economic and social benefits of investing in the urban bus.
http://www.pteg.net/resources/types/reports/case-urban-bus-economic-and-social-benefits-investing-urban-bus

© 2016 KPMG LLP, a UK limited liability partnership and a member firm of the KPMG network of independent member firms affiliated with KPMG International
Cooperative (“KPMG International”), a Swiss entity. All rights reserved. 98
and the nature of the contracts employed will be central to the intervention and will require careful
scrutiny. Key aspects of the contractual model include:
■ Variation in geographical scale with area and route based contracts providing opportunities for
smaller and larger operators to participate and compete.
■ Franchise length, with longer franchises providing stability and opportunities to invest, and shorter
franchises promoting competition and innovation.
■ Access to assets.
■ Restrictions on market entry or exclusivity to provide services without the threat of competition.
■ Proportional, accountable, consistent, transparent and targeted regulation, that is independent of
governmental control.
■ Commercial freedom, incentives and allocation of cost and revenue risk.
The specification of the contract will depend on the objectives for the market, the market
characteristics and the capability of the LTA.
For (statutory) quality partnerships, the authority allows entry to operators subject to certain quality
and sometimes pricing controls being met. This arrangement has benefits in contractualising
partnership agreements whilst maintaining commercial freedoms to the operator and allowing
competition.
Under franchising, area contracts provide operators with exclusive rights to provide services in a
particular area, potentially giving the operator greater freedom to plan and deliver services, and
develop and promote a brand. When let on a gross-cost basis the LTA bears the revenue risk and
when let on a net-cost basis the operator bears the revenue risk. The length of the contract, the
specification of vehicle quality standards and the procedures to manage residual value will influence
whether vehicles are owned and funded by operators or leasing companies. This in turn will
influence costs.
Route based contracts provide operators, and potentially small operators, with exclusive rights to
provide services on a specific route or collection of routes, where the LTA wishes to maintain control
over the service specification and be identified as the system integrator. As for area based contracts,
when they are let on a gross cost basis, the LTA takes the revenue risk and when they are let on a
net-cost basis the operator takes the risk.
The Commercial Case will need to establish that the nature of the contract is appropriate to
incentivise operators and the LTA to undertake activities that will grow the market, and that cost
(indexation) and revenue risks are allocated to those who are best placed to manage them. There will
likely be material risks in designing contracts that stimulate competitive bids for operators and that
the contract is sufficiently well designed to allow for variations if the contract is misspecified or
market conditions change.
6.4.4 Financial Case
The Financial Case considers the affordability of the intervention, how much it will cost and who will
fund it. This aspect is not considered under the Public Interest Criteria. It will potentially need
to examine:
■ Set-up costs to establish the contractual model, to plan the network, and let the contracts.
■ On-going revenue support, after accounting for potential changes to the allocation of BSOG and
concessionary travel reimbursement.
■ On-going costs associated with franchise letting, franchise monitoring and management, revenue
protection and marketing activities.
■ Approach to contract variation.

© 2016 KPMG LLP, a UK limited liability partnership and a member firm of the KPMG network of independent member firms affiliated with KPMG International
Cooperative (“KPMG International”), a Swiss entity. All rights reserved. 99
The Financial Case will potentially need to consider how the allocation of costs and revenues will
change under alternative models, and critically whether the LTA has sufficient funds to cover
expenditure and risk. Depending on the nature of the contract, the LTA may need to take on many of
the commercial risks currently borne by operators. This could mean that LTAs will need to manage
the commercial risks for all of their local market rather than just the commercial risk associated with
operating supported services.
One of the most important considerations in this regard is the attractiveness of contracts to potential
bidders, the intensity of competition for contracts, and the resulting bid margins. As bus franchising is
untested outside of London, there are considerable uncertainties surrounding any assumptions about
bid margins and much will depend on the specification of the contractual model. Additional
consideration will need to be given to the cost of potential legal challenges that some stakeholders
noted during the interviews.
Making an impact on the achievement of stakeholder objectives and providing a step-change to
service quality and market demand will likely require significant investment in infrastructure and
operations. The Financial Case will potentially need to identify where additional funding will come
from, considering: network cost efficiencies, increased farebox revenues, the potential capture of
operating profits, complementary revenue raising highway demand management policies, third party
contributions and general taxation. It will also be important to consider the profiling of cash flows
over time and the risks and contingencies needed.
6.4.5 Management Case
The Management Case will need to consider whether a proposal is deliverable, taking into account
project planning, governance structure, risk management, communications and stakeholder
management, benefits realisation and assurance.
Figure 26 shows an illustrative franchise letting process. Leaving aside important considerations on
potential legal challenges raised during stakeholder interviews, the run-up to franchise letting will
likely involve a period of intensive planning and preparation by the LTA. Uncertainty during that time
could lead to lower levels of investment and weaker incentives to maximise operating revenues and
minimise operating costs.
Figure 26: Illustrative franchise letting process
Instead of a single contract, services could be grouped and competitively let under a rolling
programme of sub-regional franchises, with the intensity of bidding influenced by the size, length,
and nature of the franchise contract. This in turn will influence key decisions on vehicle ownership
and leasing. The nature of the market model will likely evolve over time, adapting to market
conditions and taking account of lessons learnt.
Arguably the most difficult part of the process will be to manage the transition from the current
market model to an alternative model. This process is untested and may take time as operators may
appeal or make a legal challenge.
Preparatory period
Franchise letting
Franchise 1st cycle
Franchise re-letting
Franchise 2nd cycle
Services grouped into a number of sub-regional
and route-based franchises and competitively
let under a rolling programme
Franchises re-let with revisions
to accommodate lessons learnt
Sub-regional franchises let with
variations in size, length, exclusivity
and behavioural incentives

© 2016 KPMG LLP, a UK limited liability partnership and a member firm of the KPMG network of independent member firms affiliated with KPMG International
Cooperative (“KPMG International”), a Swiss entity. All rights reserved. 100
The delivery of an alternative market model will require strong project governance and a robust
management programme. The Management Case will need to assess whether the LTA has the
capability and resources to take greater control of the bus market and the potential risks and
opportunities involved. The Management Case will need to clearly identify roles and responsibilities in
managing risk, as well as how risks are identified, assessed, addressed and escalated through the
governance framework. The process will need to be closely monitored and evaluated to help deliver
the expected benefits and that lessons are captured to inform the further development of the
programme.
6.5 Summary and discussion
Proposals to intervene in the local bus market through the introduction of alternative market models
will need to be supported by a compelling case for change, potential covering all aspects of the
Treasury’s five case business model at the market level.
Once the Strategic Case for change has been set out, work will be required to establish the costs and
benefits associated with intervention, the nature of the commercial arrangements for procurement,
the level of funding required and the ability of authority to deliver change.
The Strategic Case will likely be stronger in areas in which market imperfections cause the market to
underperform relative to stakeholder objectives and/or where misaligned incentives constrain wider
economic and transport interventions.
The Economic Case for investing in local bus infrastructure and operations is likely to be good in
areas where there is the potential to grow demand over the longer term, achieving high load factors
and generating modal shift and road decongestion. These potential benefits however will need to be
set against the potential dis-benefits to operators. The inherent uncertainties around the estimation of
the costs and benefits some years ahead should not be ignored or understated.
The Commercial Case will depend on the ability of the LTA to design contracts with the right
incentives and an efficient procurement programme. Lack of commercial data and experienced
resources will constrain network planning and the design of good contracts in the short term but they
could be developed over the longer term. There are likely to be material risks associated with
contract specification and the potential need for contract variation or contract termination where
contracts are initially misspecified.
The Financial Case will depend on the ability to make efficiency savings, to capture operating profits
and increase passenger revenue in the longer term, both of which are uncertain. The market will only
be transformed by investing in infrastructure and services which may require additional funding. The
Financial Case will also need to assess the genuine costs associated with the transfer of risk from
operators to the public sector.
The Management Case is highly uncertain. Market reform is likely to involve material risk and
uncertainty, and will need to allow for potential legal challenge and transitional risks.
Changing the structure of the market and the way it is regulated will have wide ranging impacts
which are difficult to assess and quantify and which might only become apparent over the longer
term. Some of these impacts such as the potential to rationalise routes could be measured, others
such as the potential for increased competition could be assumed but are much more difficult to
predict as they depend upon the response of operators. Others such as the long term effects of
reducing commercial incentives in the bus market and increasing political influence over fares and
timetables are very hard to predict.

© 2016 KPMG LLP, a UK limited liability partnership and a member firm of the KPMG network of independent member firms affiliated with KPMG International
Cooperative (“KPMG International”), a Swiss entity. All rights reserved. 101
For this reason, the overall policy assessment is very important to assessing the case for change and
decision-makers should place appropriate weight on evidence given the wide range of uncertainties.
Only where these strategic policy tests are met should decision-makers consider the detailed costs
and benefits of the proposals – which will remain subject to considerable uncertainty.
Throughout the assessment, it is important to consider the attributes of the local bus market, its
structure, the objectives of local stakeholders and the existence of market imperfections. As
discussed throughout this report these factors will vary considerably between local areas, but they
may provide a useful framework for considering the effects of changes to the market model.

© 2016 KPMG LLP, a UK limited liability partnership and a member firm of the KPMG network of independent member firms affiliated with KPMG International
Cooperative (“KPMG International”), a Swiss entity. All rights reserved. 102
Appendix 1 Stakeholder interviews
A total of 25 organisations provided responses to the questions listed in Appendix 2 either as a
written response or as part of a structured interview. They included bus operators, local government,
and other organisations related to transport markets. The interviews were undertaken by KPMG on
behalf of the Department for Transport between March and June 2015.
The Department for Transport and KPMG are grateful to the respondents to this work and to the
organisations that they represent. It is important to note that the analysis reported here is qualitative
rather than quantitative in nature. It reflects the range of views expressed but strictly does not reflect
the views of any specific organisation or individual. It has not been endorsed or approved by any of
the respondents.
Table 18: Stakeholder interviews
Organisation type Organisation
Passenger
Transport
Executives (PTE)
Greater Manchester (Transport for Greater Manchester).
Merseyside (Merseytravel)
West Yorkshire (WYCA)
Tyne and Wear (Nexus)
Passenger Transport Executive Group
Local authorities Bristol City Council
Worcestershire County Council
Hampshire County Council
Cambridgeshire County Council
Devon County Council
Brighton & Hove City Council
Large operators FirstGroup
Stagecoach
Arriva
Go-Ahead
National Express
Other operators Tower Transit/Go Whippet
Tansdev
Rotala
Trent Barton
East Yorkshire Motor Services
Others Confederation of Passenger Transport
Association of Local Bus Company Managers
Association of Transport Coordinating Officers
ADEPT
Transport Focus
© 2016 KPMG LLP, a UK limited liability partnership and a member firm of the KPMG network of independent member firms affiliated with KPMG International
Cooperative (“KPMG International”), a Swiss entity. All rights reserved. 103
Appendix 2 Stakeholder questions
Introduction
As part of this project we consulted with 25 bus market stakeholders including local authorities,
PTEs, operators and other organisation with an interest in the organisation and performance of the
local bus market.
As part of this process we asked each stakeholder 17 questions designed to elicit their views on the
performance of the local market and the pros and cons of alternative regulatory models including
franchising. The interviews were separated into three parts:
■ Market analysis – Questions related to stakeholder objectives for the market, existing problems
and potential solutions, passenger needs and the best ways to increase bus patronage. This
section also included question on stakeholders’ desire for specific features such as ticketing
integration, coordination and competition.
■ Market models – Question related to the pros and cons associated with changes to the existing
de-regulated market structure and where/when such changes could be beneficial.
■ Impacts of regulation – Questions related to the impacts of a more regulated bus market overall
and on specific features of the market performance such as service quality, operating costs,
innovation and the costs and risks for the LTA.
In the next section we list the questions asked to each stakeholder.
It is important to note that the discussions covered three main market models: de-regulated,
partnership and franchising specifications. Within each model there are important variations which
govern the allocation of risk and the strength of behavioural incentives.
Stakeholder views
Each stakeholder was asked the following 17 questions.
Part 1: Market analysis
1. What are your objectives for the bus market?
2. What currently works well, and what doesn’t work well, and why?
3. What do passengers want that isn’t currently being delivered?
4. What is the best way to increase bus patronage? And what are your views on why areas outside
of London haven’t seem similar increases in patronage?
5. Is greater coordination of services between operators desirable and, if so, how can it be achieved?
6. Is greater integration in ticketing desirable and, if so, how can it be achieved?
7. Is greater on-road competition between operators desirable and, if so, how can it be achieved?
8. How can remote and marginal services be better provided?
9. What would drive greater investment in the bus market, both from operators and local authorities?
Part 2: Market models
10. What changes, if any, are required to the way the local bus services are planned, funded and
delivered?
11. What are the strengths/weaknesses of Quality Partnerships?
12. Where do Quality Partnerships work well and what factors are important to their success?

© 2016 KPMG LLP, a UK limited liability partnership and a member firm of the KPMG network of independent member firms affiliated with KPMG International
Cooperative (“KPMG International”), a Swiss entity. All rights reserved. 104
13. What are the strengths/weaknesses of Quality Contracts?
14. What factors are likely to be important for the success of Quality Contracts, and where might this
model work well?
Part 3: Impact of regulation
15. What impacts will Quality Contracts have on:
a) Fares and service quality
b) Operating performance
c) Operating cost efficiency
d) Product and service innovation
e) Local authority costs
16. What are the risks in the delivery of Quality Contracts?
17. Are there other operating models relevant to the deliver local bus services?

The information contained herein is of a general nature and is not intended to address the
circumstances of any particular individual or entity. Although we endeavour to provide
accurate and timely information, there can be no guarantee that such information is
accurate as of the date it is received or that it will continue to be accurate in the future. No
one should act on such information without appropriate professional advice after a thorough
examination of the particular situation.
© 2016 KPMG LLP, a UK limited liability partnership and a member firm of the KPMG
network of independent member firms affiliated with KPMG International Cooperative
(“KPMG International”), a Swiss entity. All rights reserved.
The KPMG name, logo and “cutting through complexity” are registered trademarks or
trademarks of KPMG International Cooperative (“KPMG International”).
Produced by Create Graphics/Document number: CRT055038A
www.kpmg.com/uk