application of box–wilson experimental design … · application of box–wilson experimental...
TRANSCRIPT

APPLICATION OF BOX–WILSON EXPERIMENTAL
DESIGN METHOD FOR THE SOLAR
PHOTOCATALYTIC DEGRADATION OF TEXTILE
DYESTUFF
by
Deniz AKTEN
October, 2007
İZMİR

APPLICATION OF BOX–WILSON EXPERIMENTAL DESIGN METHOD FOR THE
SOLAR PHOTOCATALYTIC DEGRADATION OF TEXTILE DYESTUFF
ABSTRACT
As an advanced oxidation treatment, Fe(III)/H2O2/Solar-UV process was applied to an azo
dye, Remazol Brilliant Blue R-A, used in textile dyestuffs in the Turkish textile industry by using
a solar photocatalytic reactor. A Box–Wilson experimental design method was used to determine
the effects of oxidant and catalyst dosages and flowrate in Fe(III)/H2O2/Solar-UV advanced
oxidation process. Degradation of color and organic matter concentration of the dye have been
evaluated. A strong dye solution (50 mg/L) was 100% decolorized after 8 hours of irradiation,
and maximum 84% reduction of the total organic carbon (TOC) was obtained. It has been found
that the degradation rates increased until optimum values of H2O2 and Fe(III) concentrations.
Keywords: Solar oxidation, Box-Wilson, Decolorization, Fe(III)/H2O2/Solar-UV.
BOX-WILSON DENEYSEL TASARIM YÖNTEMİNİN TEKSTİL BOYAR
MADDESİNİN SOLAR FOTOKATALİTİK ARITIMINA UYGULANMASI
ÖZ
Fe(III)/H2O2/Solar-UV prosesi, ileri oksidasyon yöntemi olarak, solar fotokatalitik reactor
kullanımı ile, Türk tekstil endüstrisinde kullanılan Remazol Brilliant Blue R-A azo boyasına
uygulanmıştır. Fe(III)/H2O2/Solar-UV ileri arıtma yöntemde oksidant ve katalizör dozlarının ve
debinin etkisinin saptanması için Box-Wilson deneysel tasarım yöntemi uygulanmıştır. Boyada
renk giderimi ve organic madde konsantrasyonundaki azalma değerlendirilmiştir. 50mg/L gibi
yüksek boya konsantrasyonunda 8 saatlik irradyasyon sonucu %100 renk giderimi ve maksimum
%84 toplam organic karbon (TOK) giderimi gözlenmiştir. H2O2 ve Fe(III) konsantrasyonlarının
optimum değerlerine kadar giderimin arttığı saptanmıştır.
Anahtar Sözcükler: Solar oksidasyon, Box-Wilson, Renk giderimi, Fe(III)/H2O2/Solar-UV.
1. Introduction
Dyestuffs are present in certain industrial wastewaters, in concentrations significant to impart
noticeable color to the effluent. Dyestuffs have a complex chemical structure which is hard to
degrade biologically. Several biodegradability studies on dyes have shown that dyes are not
likely to be biodegradable under aerobic conditions (Bali, 2004). Thus, ecosystems of streams
can be seriously affected. Consequently, dyes have to be removed in dye wastewater before
discharge.
In the past, effluents containing azo dyes have been treated by adsorption onto activated
carbon or by chemical coagulation (Legrini, Oliveros & Braun, 1993). Nevertheless, they are
non-destructive, since they just transfer organic compounds from water to another phase, thus
causing secondary pollution. Consequently, regeneration of the adsorbent materials and post-
treatment of solid-wastes, which are expensive operations, are needed. Therefore, advanced
oxidation is a potential alternative to decolorize and to reduce recalcitrant wastewater loads (Ç.
Çatalkaya & Şengül, 2006). Advanced oxidation processes (AOPs) are based on physicochemical
processes that are able to produce changes in the chemical structure of the pollutants and are
defined as processes involving the in situ generation and use of highly oxidising agents, mainly
hydroxyl radicals •OH (redox potential = 2.8 V) (Neyens & Baeyens, 2003). When generated,
these radicals react rapidly and usually indiscriminately with most organic compounds, either by
addition to a double bond or by abstraction of a hydrogen atom from aliphatic organic molecules.
The resulting organic radicals then react with oxygen to initiate a series of degradative oxidation
reactions that ultimately lead to mineralization products, such as CO2 and H2O. The main
reactions that occure during Fe(III)/H2O2/Solar-UV oxidationare as follows;
Fe3+
+ H2O2 →hv Fe
2+ + •OH + H
+ (Eq. 1)
RH + •OH → H2O + •R (Eq. 2)
→ further oxidation. (Eq. 3)
Although advanced oxidation processes (AOPs) have these advantages, one common problem
in all AOPs is the high operation costs. Minimization of the required irradiation time, the energy
consumption by optimization of the chemical types or chemical concentrations, and
pollutant/oxidant ratio are very important. For this aim, the Box–Wilson experimental design was
used in order to find optimum reaction conditions and to investigate the effects of important
process variables on color and total organic carbon removal performance in this work (Baycan,
2005).
2. Materials and Methods
2.1. Reagents
The azo dye, Remazol Brilliant Blue R-A is used in textile dyestuffs in the Turkish textile
industry. Azo dye was used without further purification. Aqueous solution of azo dye was
prepared with distilled water. Characteristics of the azo dye used in the study are listed in Table
1. Iron sulphate (Fe2(SO4)3·7H2O) used as source of Fe(III), was analytical grade and obtained
from Merck. Hydrogen peroxide (H2O2) solution (35% (w/w)) in stable form was provided from
Merck. An amount of 10g/L Fe(III) and 1g/L Remazol Brilliant Blue R-A stock solutions were
prepared for further dilution to obtain solutions of desired concentrations. Fe(III) stock solution
was stored at dark place to prevent oxidation of Fe(III). In order to prevent further oxidation of
organics, excess H2O2 should be removed. For this aim, MnO2 was added to collected aqueous
samples. Distilled water was used in cleaning and experimentation.
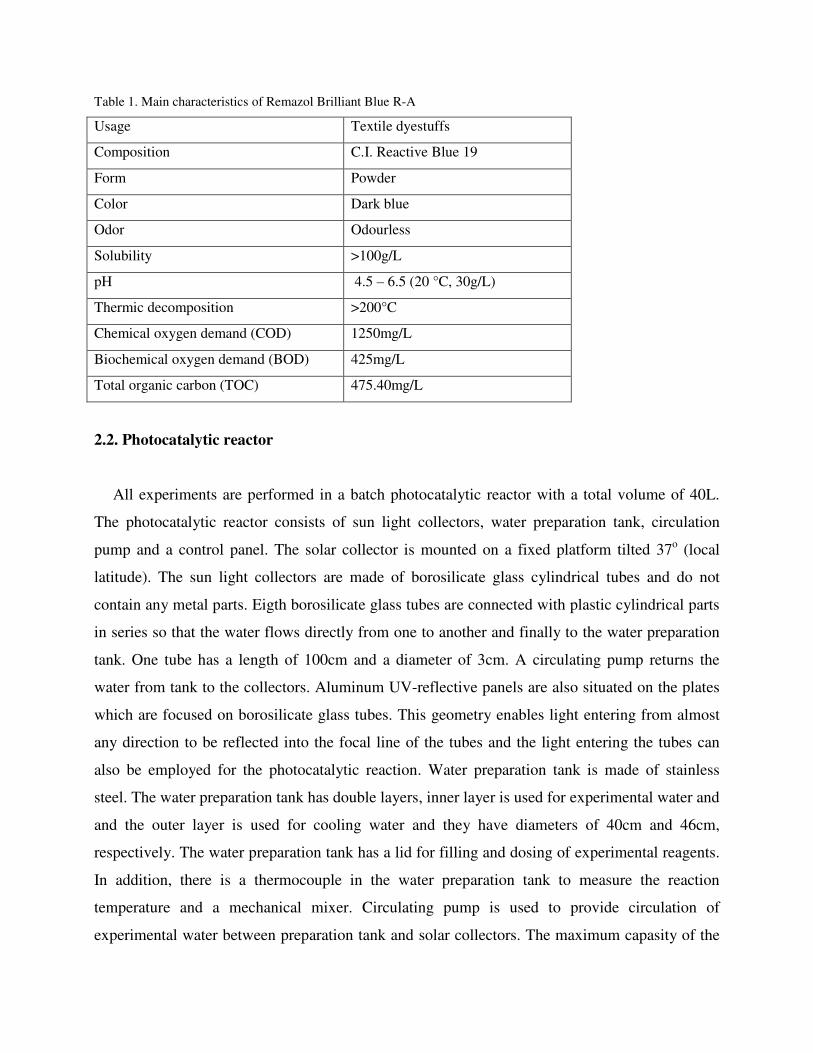
Table 1. Main characteristics of Remazol Brilliant Blue R-A
Usage Textile dyestuffs
Composition C.I. Reactive Blue 19
Form Powder
Color Dark blue
Odor Odourless
Solubility >100g/L
pH 4.5 – 6.5 (20 °C, 30g/L)
Thermic decomposition >200°C
Chemical oxygen demand (COD) 1250mg/L
Biochemical oxygen demand (BOD) 425mg/L
Total organic carbon (TOC) 475.40mg/L
2.2. Photocatalytic reactor
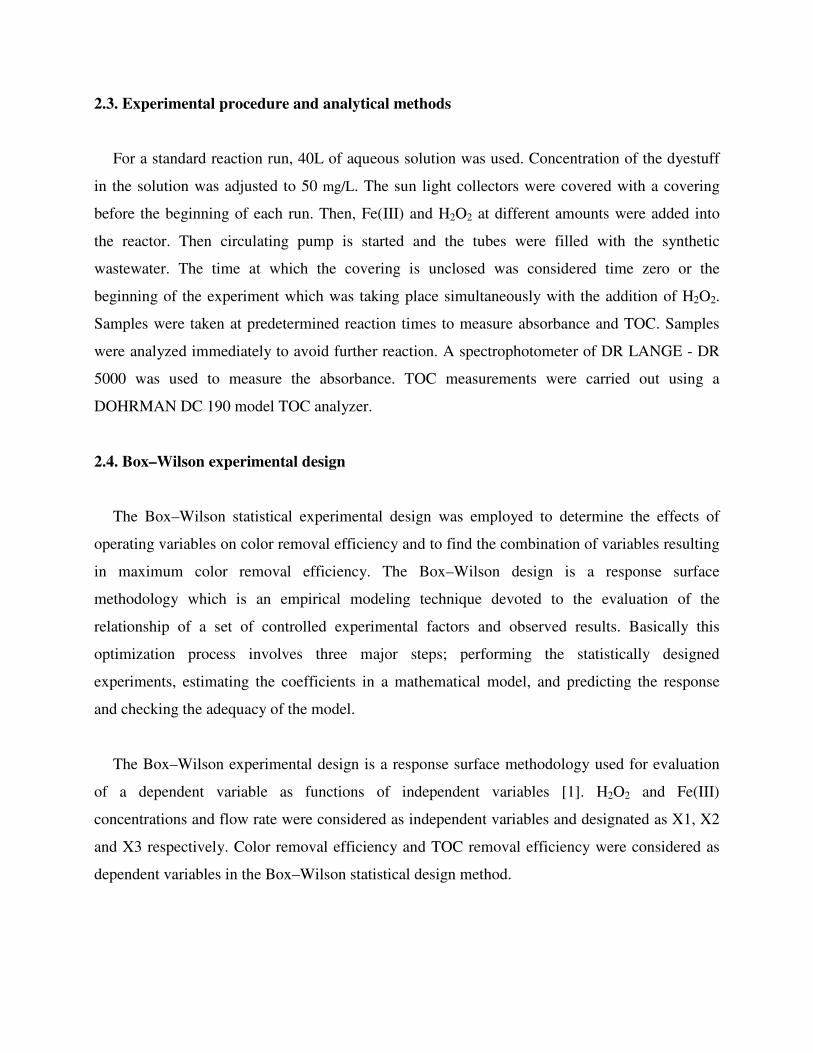
All experiments are performed in a batch photocatalytic reactor with a total volume of 40L.
The photocatalytic reactor consists of sun light collectors, water preparation tank, circulation
pump and a control panel. The solar collector is mounted on a fixed platform tilted 37o (local
latitude). The sun light collectors are made of borosilicate glass cylindrical tubes and do not
contain any metal parts. Eigth borosilicate glass tubes are connected with plastic cylindrical parts
in series so that the water flows directly from one to another and finally to the water preparation
tank. One tube has a length of 100cm and a diameter of 3cm. A circulating pump returns the
water from tank to the collectors. Aluminum UV-reflective panels are also situated on the plates
which are focused on borosilicate glass tubes. This geometry enables light entering from almost
any direction to be reflected into the focal line of the tubes and the light entering the tubes can
also be employed for the photocatalytic reaction. Water preparation tank is made of stainless
steel. The water preparation tank has double layers, inner layer is used for experimental water and
and the outer layer is used for cooling water and they have diameters of 40cm and 46cm,
respectively. The water preparation tank has a lid for filling and dosing of experimental reagents.
In addition, there is a thermocouple in the water preparation tank to measure the reaction
temperature and a mechanical mixer. Circulating pump is used to provide circulation of
experimental water between preparation tank and solar collectors. The maximum capasity of the

circulating pump is 500 L/h and also there is a flowmeter integrated with the circulation pump.
Whole system is controled by the control panel (Figure 1).
(a)
(b)
Figure 1. (a) Front view of the pilot scale solar
reactor (b) Back view of the pilot scale solar
reactor
2.3. Experimental procedure and analytical methods
For a standard reaction run, 40L of aqueous solution was used. Concentration of the dyestuff
in the solution was adjusted to 50 mg/L. The sun light collectors were covered with a covering
before the beginning of each run. Then, Fe(III) and H2O2 at different amounts were added into
the reactor. Then circulating pump is started and the tubes were filled with the synthetic
wastewater. The time at which the covering is unclosed was considered time zero or the
beginning of the experiment which was taking place simultaneously with the addition of H2O2.
Samples were taken at predetermined reaction times to measure absorbance and TOC. Samples
were analyzed immediately to avoid further reaction. A spectrophotometer of DR LANGE - DR
5000 was used to measure the absorbance. TOC measurements were carried out using a
DOHRMAN DC 190 model TOC analyzer.
2.4. Box–Wilson experimental design
The Box–Wilson statistical experimental design was employed to determine the effects of
operating variables on color removal efficiency and to find the combination of variables resulting
in maximum color removal efficiency. The Box–Wilson design is a response surface
methodology which is an empirical modeling technique devoted to the evaluation of the
relationship of a set of controlled experimental factors and observed results. Basically this
optimization process involves three major steps; performing the statistically designed
experiments, estimating the coefficients in a mathematical model, and predicting the response
and checking the adequacy of the model.
The Box–Wilson experimental design is a response surface methodology used for evaluation
of a dependent variable as functions of independent variables [1]. H2O2 and Fe(III)
concentrations and flow rate were considered as independent variables and designated as X1, X2
and X3 respectively. Color removal efficiency and TOC removal efficiency were considered as
dependent variables in the Box–Wilson statistical design method.
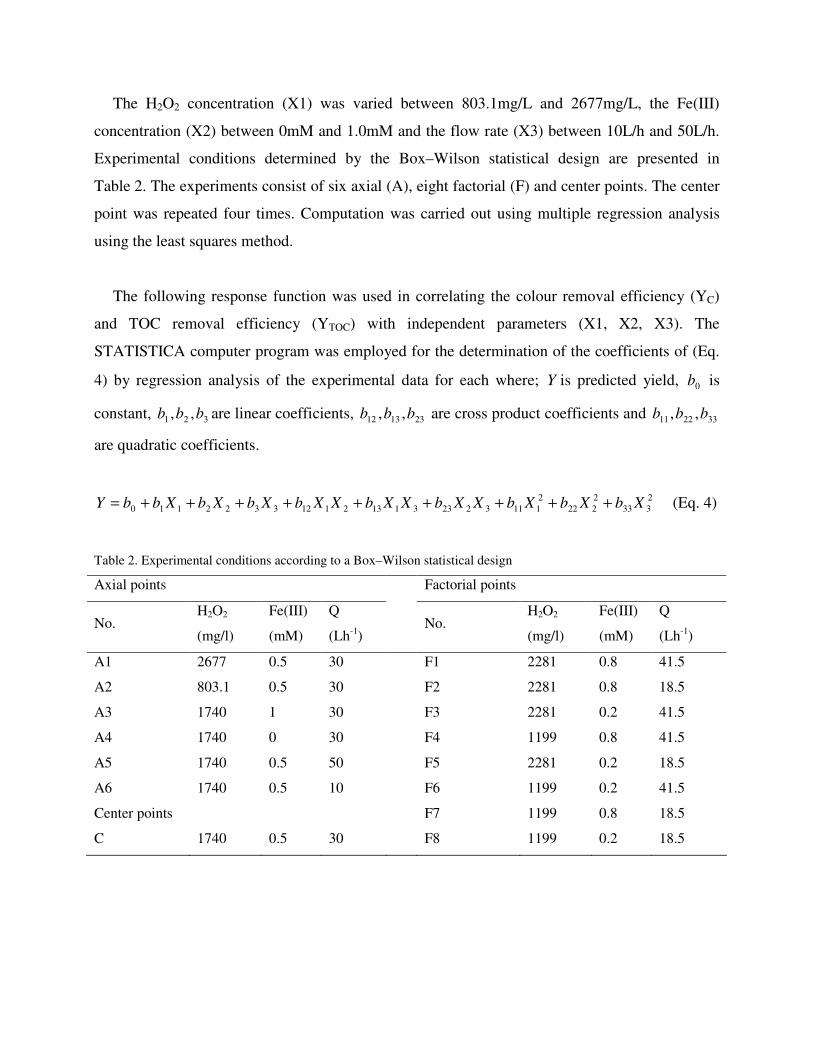
The H2O2 concentration (X1) was varied between 803.1mg/L and 2677mg/L, the Fe(III)
concentration (X2) between 0mM and 1.0mM and the flow rate (X3) between 10L/h and 50L/h.
Experimental conditions determined by the Box–Wilson statistical design are presented in
Table 2. The experiments consist of six axial (A), eight factorial (F) and center points. The center
point was repeated four times. Computation was carried out using multiple regression analysis
using the least squares method.
The following response function was used in correlating the colour removal efficiency (YC)
and TOC removal efficiency (YTOC) with independent parameters (X1, X2, X3). The
STATISTICA computer program was employed for the determination of the coefficients of (Eq.
4) by regression analysis of the experimental data for each where; Y is predicted yield, 0b is
constant, 321 ,, bbb are linear coefficients, 231312 ,, bbb are cross product coefficients and 332211 ,, bbb
are quadratic coefficients.
2
333
2
222
2
1113223311321123322110 XbXbXbXXbXXbXXbXbXbXbbY +++++++++= (Eq. 4)
Table 2. Experimental conditions according to a Box–Wilson statistical design
Axial points Factorial points
No. H2O2
(mg/l)
Fe(III)
(mM)
Q
(Lh-1
) No.
H2O2
(mg/l)
Fe(III)
(mM)
Q
(Lh-1
)
A1 2677 0.5 30 F1 2281 0.8 41.5
A2 803.1 0.5 30 F2 2281 0.8 18.5
A3 1740 1 30 F3 2281 0.2 41.5
A4 1740 0 30 F4 1199 0.8 41.5
A5 1740 0.5 50 F5 2281 0.2 18.5
A6 1740 0.5 10 F6 1199 0.2 41.5
Center points F7 1199 0.8 18.5
C 1740 0.5 30 F8 1199 0.2 18.5

3. Results and Discussion
The color and TOC removal efficiencies obtained from the experiments are summarised in
Table 3. Observed color and TOC removal efficiencies were compared with the predicted ones
obtained from the response functions. The observed color and TOC removal efficiencies varied
between 22 and 100%, 50 and 85% respectively.
Table 3.Observed and predicted color and TOC removal efficiencies
Color removal efficiencies (%) TOC removal efficiencies (%) No.
observed predicted observed predicted
A1 100 100
78 81
A2 80 79
71 72
A3 75 74
70 72
A4 22 27
50 53
A5 90 89
80 82
A6 100 100
78 81
F1 95 96
84 82
F2 100 97
82 81
F3 81 78
71 69
F4 75 76
79 78
F5 75 71
74 71
F6 45 46
67 65
F7 100 100
76 75
F8 66 63
65 64
C1 94 91
74 75
C2 90 91
74 75
C3 91 91
75 75
C4 90 91
76 75
Experimental results were used in the STATISTICA regression analysis program to determine
the coefficients of the response functions (Eq. 4). The calculated coefficients are listed in Table 4
and were used in calculating predicted values of colour and TOC removal efficiencies. The
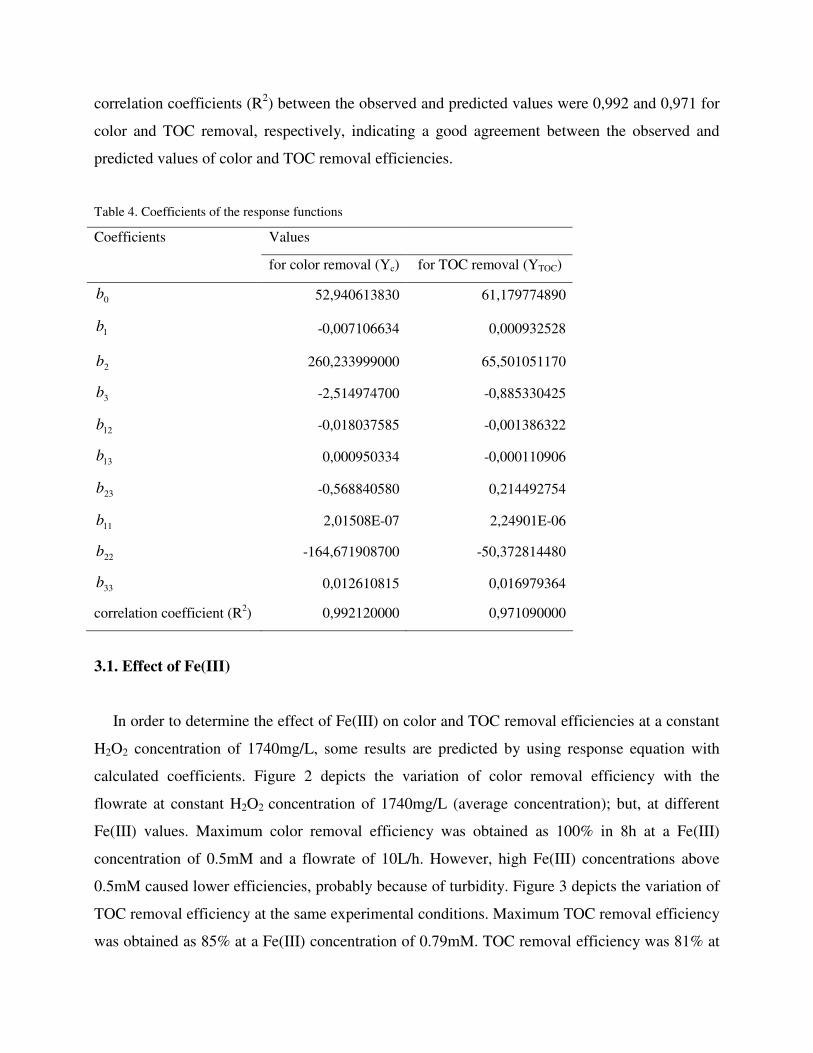
correlation coefficients (R2) between the observed and predicted values were 0,992 and 0,971 for
color and TOC removal, respectively, indicating a good agreement between the observed and
predicted values of color and TOC removal efficiencies.
Table 4. Coefficients of the response functions
Coefficients Values
for color removal (Yc) for TOC removal (YTOC)
0b 52,940613830 61,179774890
1b -0,007106634 0,000932528
2b 260,233999000 65,501051170
3b -2,514974700 -0,885330425
12b -0,018037585 -0,001386322
13b 0,000950334 -0,000110906
23b -0,568840580 0,214492754
11b 2,01508E-07 2,24901E-06
22b -164,671908700 -50,372814480
33b 0,012610815 0,016979364
correlation coefficient (R2) 0,992120000 0,971090000
3.1. Effect of Fe(III)
In order to determine the effect of Fe(III) on color and TOC removal efficiencies at a constant
H2O2 concentration of 1740mg/L, some results are predicted by using response equation with
calculated coefficients. Figure 2 depicts the variation of color removal efficiency with the
flowrate at constant H2O2 concentration of 1740mg/L (average concentration); but, at different
Fe(III) values. Maximum color removal efficiency was obtained as 100% in 8h at a Fe(III)
concentration of 0.5mM and a flowrate of 10L/h. However, high Fe(III) concentrations above
0.5mM caused lower efficiencies, probably because of turbidity. Figure 3 depicts the variation of
TOC removal efficiency at the same experimental conditions. Maximum TOC removal efficiency
was obtained as 85% at a Fe(III) concentration of 0.79mM. TOC removal efficiency was 81% at

a Fe(III) concentration of 0.5mM. There was no significant difference between TOC removal
efficiencies at Fe(III) concentration of 0.5mM and 0.79mM. As a result, for the mineralization of
Remazol Brilliant Blue R-A via Fe(III)/H2O2 process, optimum Fe(III) concentration was found
as 0.5mM.
H2O2=1740mg/L
0
20
40
60
80
100
10 15 20 25 30 35 40 45 50
Q (L/h)
Deco
lori
zati
on
(%
)
1.00mM 0.79mM 0.50mM 0.21mM 0mM
Figure 2. Variation of decolorization efficiency as a function of flowrate at different Fe(III)
concentrations (H2O2=1740mg/L)
H2O2=1740mg/L
0
20
40
60
80
100
10 15 20 25 30 35 40 45 50
Q (L/h)
TO
C r
em
oval
(%)
1.00mM 0.79mM 0.50mM 0.21mM 0mM
Figure 3. Variation of TOC removal efficiency as a function of flowrate at different Fe(III)
concentrations (H2O2=1740mg/L)
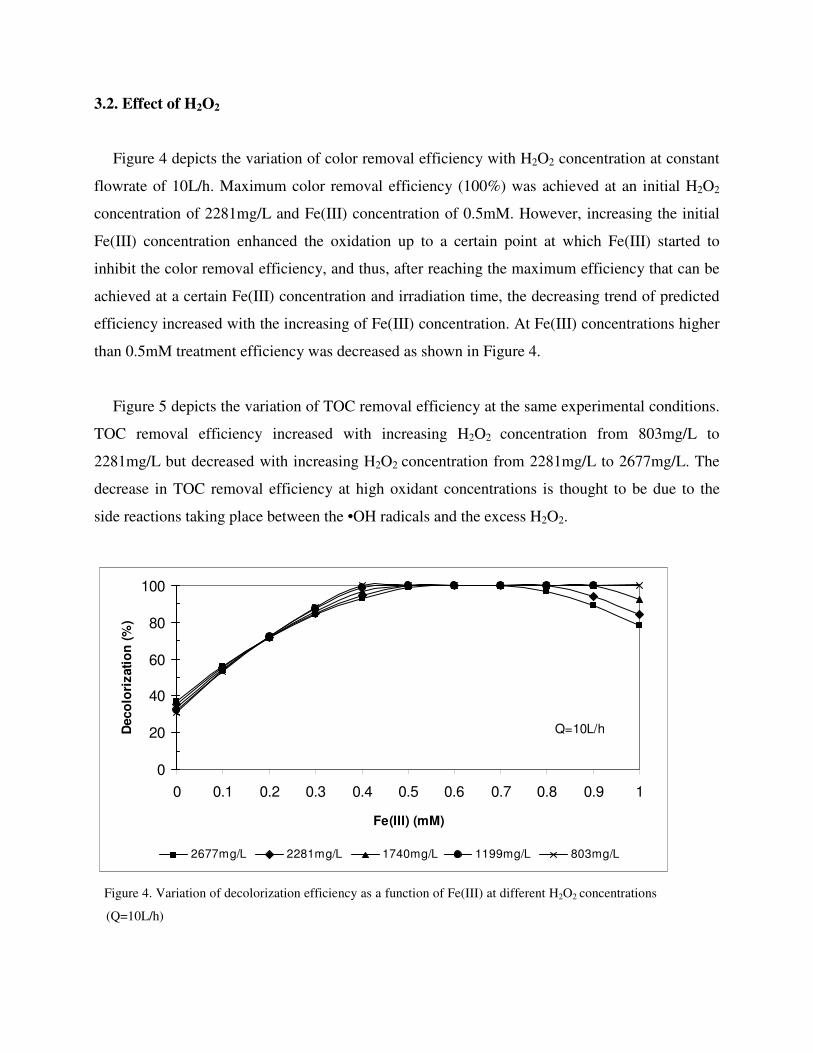
3.2. Effect of H2O2
Figure 4 depicts the variation of color removal efficiency with H2O2 concentration at constant
flowrate of 10L/h. Maximum color removal efficiency (100%) was achieved at an initial H2O2
concentration of 2281mg/L and Fe(III) concentration of 0.5mM. However, increasing the initial
Fe(III) concentration enhanced the oxidation up to a certain point at which Fe(III) started to
inhibit the color removal efficiency, and thus, after reaching the maximum efficiency that can be
achieved at a certain Fe(III) concentration and irradiation time, the decreasing trend of predicted
efficiency increased with the increasing of Fe(III) concentration. At Fe(III) concentrations higher
than 0.5mM treatment efficiency was decreased as shown in Figure 4.
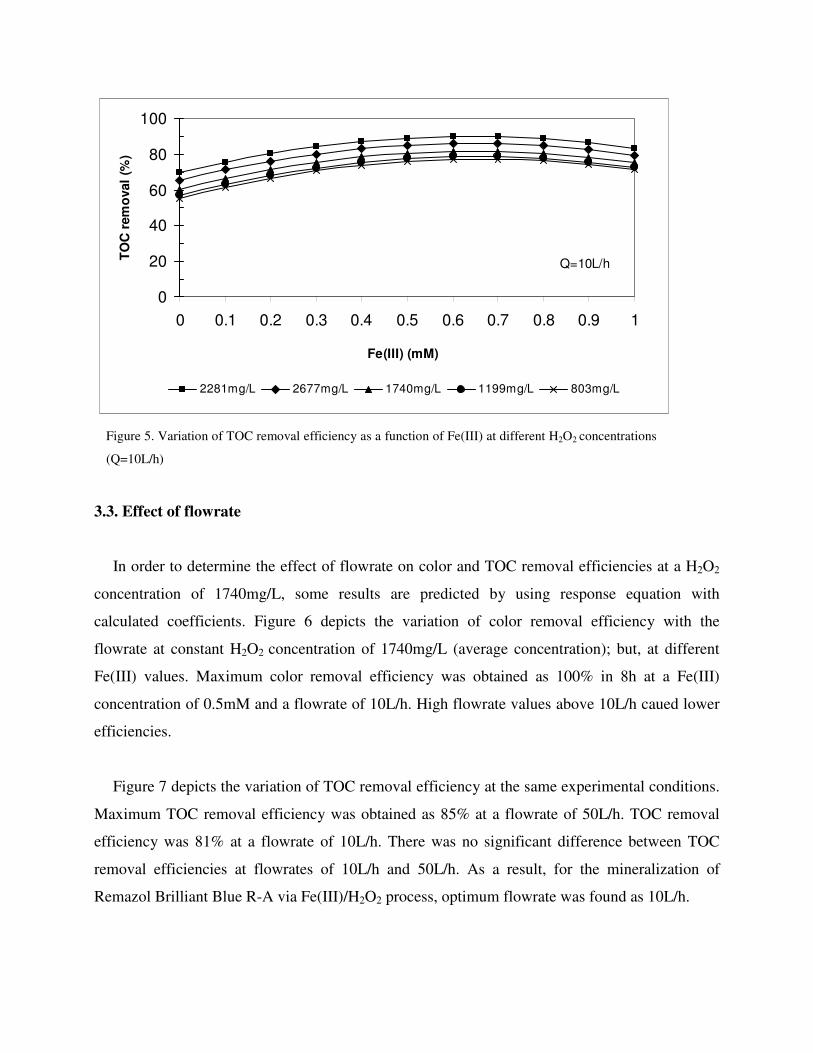
Figure 5 depicts the variation of TOC removal efficiency at the same experimental conditions.
TOC removal efficiency increased with increasing H2O2 concentration from 803mg/L to
2281mg/L but decreased with increasing H2O2 concentration from 2281mg/L to 2677mg/L. The
decrease in TOC removal efficiency at high oxidant concentrations is thought to be due to the
side reactions taking place between the •OH radicals and the excess H2O2.
Q=10L/h
0
20
40
60
80
100
0 0.1 0.2 0.3 0.4 0.5 0.6 0.7 0.8 0.9 1
Fe(III) (mM)
Deco
lori
zati
on
(%
)
2677mg/L 2281mg/L 1740mg/L 1199mg/L 803mg/L
Figure 4. Variation of decolorization efficiency as a function of Fe(III) at different H2O2 concentrations
(Q=10L/h)
Q=10L/h
0
20
40
60
80
100
0 0.1 0.2 0.3 0.4 0.5 0.6 0.7 0.8 0.9 1
Fe(III) (mM)
TO
C r
em
oval
(%)
2281mg/L 2677mg/L 1740mg/L 1199mg/L 803mg/L
Figure 5. Variation of TOC removal efficiency as a function of Fe(III) at different H2O2 concentrations
(Q=10L/h)
3.3. Effect of flowrate
In order to determine the effect of flowrate on color and TOC removal efficiencies at a H2O2
concentration of 1740mg/L, some results are predicted by using response equation with
calculated coefficients. Figure 6 depicts the variation of color removal efficiency with the
flowrate at constant H2O2 concentration of 1740mg/L (average concentration); but, at different
Fe(III) values. Maximum color removal efficiency was obtained as 100% in 8h at a Fe(III)
concentration of 0.5mM and a flowrate of 10L/h. High flowrate values above 10L/h caued lower
efficiencies.
Figure 7 depicts the variation of TOC removal efficiency at the same experimental conditions.
Maximum TOC removal efficiency was obtained as 85% at a flowrate of 50L/h. TOC removal
efficiency was 81% at a flowrate of 10L/h. There was no significant difference between TOC
removal efficiencies at flowrates of 10L/h and 50L/h. As a result, for the mineralization of
Remazol Brilliant Blue R-A via Fe(III)/H2O2 process, optimum flowrate was found as 10L/h.

Fe(III)=0.5mM
0
20
40
60
80
100
800 1200 1600 2000 2400 2800
H2O2 (mg/L)
Deco
lori
zati
on
(%
)
10L/h 20L/h 30L/h 40L/h 50L/h
Figure 6. Variation of decolorization efficiency as a function of H2O2 at different flowrates
(Fe(III)=0.5mM)
Fe(III)=0.5mM
0
20
40
60
80
100
800 1200 1600 2000 2400 2800
H2O2 (mg/L)
TO
C r
em
oval
(%)
10L/h 20L/h 30L/h 40L/h 50L/h
Figure 7. Variation of TOC removal efficiency as a function of H2O2 at different flowrates (Fe(III)=0.5mM)

4. Conclusions
Photocatalytic degradation of textile dyestuff Remazol Brilliant Blue R-A by the
Fe(III)/H2O2/Solar-UV process was investigated using Box–Wilson experimental design. The
most important factors affecting the performance of Fe(III)/H2O2/Solar-UV process are the
hydrogen peroxide and Fe(III) concentration. Box–Wilson statistical experimental design was
used to determine the effects of oxidant dosage and flowrate in an advanced oxidation process.
The objective functions were the color and TOC removal efficiencies.
Statistical analysis using response surface methodology appears to be a valuable tool for
studying the optimization of the process variables of the Fe(III)/H2O2/Solar-UV advanced
oxidation process for the decolorization and TOC removal of textile dyestuffs.
5. References
Bali U. (2004). Application of Box–Wilson experimental design method for the photodegradation
of textile dyestuff with UV/H2O2 process, Dyes and Pigments, 60, 187–195.
Baycan, N. (2005). Advanced oxidative treatment of chlorinated hydrocarbons. Dokuz Eylül
University, Graduate School of Natural and Applied Sciences, PhD. Thesis, Izmir.
Ç. Çatalkaya E., & Şengül F. (2006). Application of Box–Wilson experimental design method for
the photodegradation of bakery’s yeast industry with UV/H2O2 and UV/H2O2/Fe(II) process,
Journal of Hazardous Materials, 128, 201-207.
Çatalkaya E., & Kargı F. (2007). Color, TOC and AOX removals from pulp mill effluent by
advanced oxidation processes: A comparative study, Journal of Hazardous Materials, 139,
244-253.
Legrini, O., Oliveros, E., & Braun, A.M. (1993). Photochemical processes for water treatment.
Chemical Reviews, 93, 671-698.

Martin, C. A., Alfano, O. M., & Cassano, A. E. (2001). Water decolorization using UV radiation
and hydrogen peroxide: a kinetic study, Water Science and Technology , 44, 53-60.
McLoughlin, O.A., Ibáñez, P. F., Gernjak, W., Rodríguez, S. M., & Gill, L.W. (2004).
Photocatalytic disinfection of water using low cost compound parabolic collectors, Solar
Energy, 77, 625–633.
Neyens, E., & Baeyens, J. (2003). A review of classic fenton’s peroxidation as an advanced
oxidation technique, Journal of Hazardous Materials, B98, 33-50.
Oppelt, E. T. (1998). Handbook of advanced photochemical oxidation processes, U.S. EPA,
Retrieved September 16, 2007, from http://www.epa.gov/nrmrl/pubs/625r98004/
625r98004.pdf.
Prieto, O., Fermoso, J., Nuňez, Y., Del Vale, J.L., & Irusta, R. (2005). Decolouration of textile
dyes in wastewaters by photocatalysis with TiO2, Solar Energy, 79, 376–383.
Sano, T., Negishi, N. Takeuchi, K., & Matsuzawa, S. (2004). Degradation of toluene and
acetaldehyde with Pt-loaded TiO2 catalyst and parabolic trough concentrator, Solar Energy,
77, 543–552.