application of a rockfall simulation program in an alpine ... · application of a rockfall...
TRANSCRIPT

Disaster Mitigation of Debris Flows, Slope Failures and Landslides 199
Application of a Rockfall Simulation Program in an Alpine Valley in Slovenia
Matjaz Mikos,1) Urska Petje2) and Mihael Ribicic3)
1) Faculty of Civil and Geodetic Engineering, University of Ljubljana, Jamova 2, SI-1000 Ljubljana, Slovenia([email protected])2) Nivo Ltd., Lava 10, SI-3000 Celje, Slovenia ([email protected])3) Faculty of Natural Sciences and Engineering, University of Ljubljana, Askerceva 10, SI-1000 Ljubljana,Slovenia ([email protected])
Abstract
Two rockfalls in the Trenta valley in NW Slovenia (Upper Soca River) were analyzed using a com-mercially available computer program for rockfall simulation (Rockfall version 6.1, forest module RockTree).The program was calibrated in the Osojnik rockfall in two longitudinal profiles. The starting values of relevantmodel parameters were taken from the literature and different combinations were tried out. The computerruns were performed using different number of blocks (0.2–6.0 m). The model was successfully calibrated usingsilent witnesses (more than 20 rockfall blocks with 1–340 m3, having shadow angles 28◦–32◦). Rockfall run-outwas mostly determined by terrain configuration (roughness) and vegetation (surface) properties. Large blockshad high total kinetic energy and large bounce height but not larger run-out than small blocks. The forestcould effectively stop blocks smaller than 0.2 m, and had no effect on 6-m blocks. The calibrated model wasthen applied on the Berebica rockfall in two longitudinal profiles: with and without the rockfall gallery madeof reinforced concrete in 2001. The program performance was tested using silent witnesses (over 10 rockfallblocks with 1–220 m3, having shadow angle of 28◦–30.5◦). The simulation results (total kinetic energy, bounceheight) confirmed the correctness of the decision to build a 276-m long rockfall gallery that was questionedby some experts. The study confirmed that the calibrated 2-D simulation models of rockfalls may be usefulengineering tools when used carefully.
Keywords: rockfalls, computer models, model calibration, the European Alps, hazard assessment
Introduction
All over the Earth, the mountainous environment is subjected to many natural hazards. In the lastdecades, due to the rapid development in these areas, including the Alps and particularly the Slovenian Alpsas a part of the alpine arch, an intensification of the conflicts between natural processes and human usage ofnatural resources as well as human presence in this occasionally very harsh environment has been observed. InSlovenia (20,273 km2), in 2001 over 63 % were wooded areas. The high annual precipitation and terrain of lowpermeability produce a dense hydrographic network of running waters (26,989 km of stream channels, averagedensity of 1.33 km/km2, in some areas over 2 km/km2). On the other hand, a rather dense network of over20,000 km roads has been built. Some of them run through the Alps and are of vital importance for regionaltraffic in the area (Petje, 2005). For such roads, threatened by rockfalls, snow avalanches and torrential floods,a sound combination of preventive measures and technical countermeasures must be achieved.
As an example of an alpine valley with an important road connection under threat (Petje et al., 2005),we have chosen the Trenta Valley in the Triglav National Park in NW Slovenia. Through this idyllic alpinevalley of glacial origin a regional road connects Bovec (480 m asl) in the Soca River Valley (the MeditteraneanSea basin) with Kranjska gora (810 m asl) in the Upper Sava River Valley (the Black Sea basin), running acrossthe Vrsic Pass (1611 m asl). The Trenta Valley is largely threatened by earthquake-induced rockfalls and snowavalanches (Mikos and Fazarinc, 2000) and less by torrential floods.
Here we present how a commercially available two-dimensional rockfall computer program was cali-brated on one rockfall and then applied to another one, both being active in the Trenta Valley and threateningthe regional road through it. After a short description of the computer simulation program, a short descriptionof the two rockfalls will be introduced. Furthermore, the results of the model sensitivity analysis and the modelcalibration on the first rockfall using silent witnesses will be given. The calibrated model was then validatedon the second rockfall in order to show the effectiveness of a 276-m long rockfall gallery built of reinforcedconcrete in 2001 in order to protect a reach of the regional road. Finally, conclusions about the applicabilityof the computer simulation model as an engineering tool will be drawn.
pp. 199–211 c©2006 by Universal Academy Press, Inc. / Tokyo, Japan
200
Table 1. Main model parameters in the computer program Rockfall 6.1.
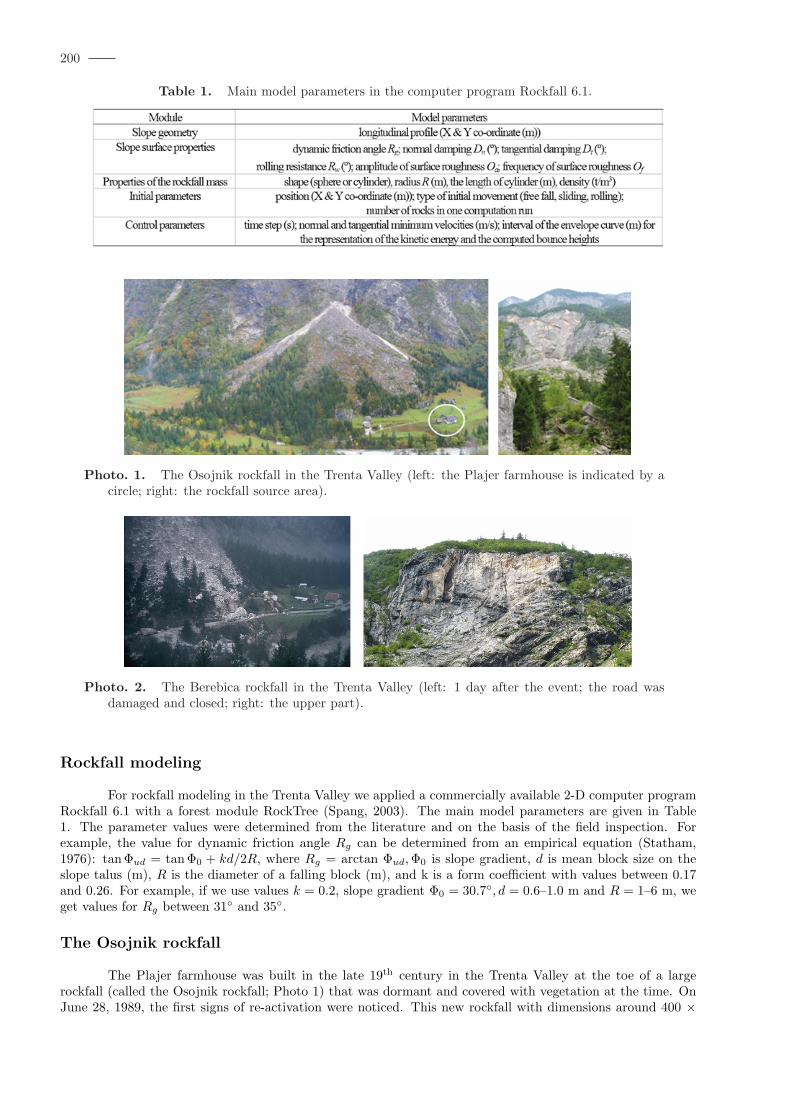
Photo. 1. The Osojnik rockfall in the Trenta Valley (left: the Plajer farmhouse is indicated by acircle; right: the rockfall source area).
Photo. 2. The Berebica rockfall in the Trenta Valley (left: 1 day after the event; the road wasdamaged and closed; right: the upper part).
Rockfall modeling
For rockfall modeling in the Trenta Valley we applied a commercially available 2-D computer programRockfall 6.1 with a forest module RockTree (Spang, 2003). The main model parameters are given in Table1. The parameter values were determined from the literature and on the basis of the field inspection. Forexample, the value for dynamic friction angle Rg can be determined from an empirical equation (Statham,1976): tanΦud = tan Φ0 + kd/2R, where Rg = arctan Φud,Φ0 is slope gradient, d is mean block size on theslope talus (m), R is the diameter of a falling block (m), and k is a form coefficient with values between 0.17and 0.26. For example, if we use values k = 0.2, slope gradient Φ0 = 30.7◦, d = 0.6–1.0 m and R = 1–6 m, weget values for Rg between 31◦ and 35◦.
The Osojnik rockfall
The Plajer farmhouse was built in the late 19th century in the Trenta Valley at the toe of a largerockfall (called the Osojnik rockfall; Photo 1) that was dormant and covered with vegetation at the time. OnJune 28, 1989, the first signs of re-activation were noticed. This new rockfall with dimensions around 400 ×

201
Photo. 3. The Berebica rockfall in the Trenta valley and the 276 m long gallery on the regionalroad Bovec-Vrsic pass (1611 m).
Photo. 4. The Osojnik rockfall in the Trenta Valley.
300 m was initiated within the old one. At the toe, its debris was around 20 m thick (Orozen Adamic, 1990).The final analysis confirmed that about 300,000 to 400,000 m3 of rock were released.
The rockfall was released as a wedge rockslide in a system of fractures along a fault zone that travelsin the NW to SE direction across the Osojnik slope. The main rupture surface developed on the slightlyundulating fracture, parallel to the slope and perpendicular to the fault. On the other rupture surfaces manyfractures developed transversal to perpendicular to the main rupture surface. The rock block that fell crushedinto smaller blocks. Single rock blocks were larger than 10 m3.
In the narrow alpine valleys with steep slopes, cut by glaciers, the so-called twin rockfalls (OrozenAdamic, 1990), which nearly face each other from two opposite valley slopes can be observed frequently. Thisis also the case in the Trenta valley, where on the opposite slope of the Plajer farmhouse and the Osojnikrockfall another rockfall developed, called the Berebica rockfall.

202
Fig. 1. The longitudinal profile “Osojnik desno”.
Photo. 5. Two boulders in the longitudinal profile “Osojnik desno” a day after their release in 1989.
The Berebica rockfall
The last major Berebica rockfall event was registered on December 19, 1993 (Pavsek, 1994; Photo 2).Above the Facer farmhouse large rock mass with dimensions of 30× 50× 5 m was released from the rock face,which then disintegrated when it hit the slope and spread over the slope talus. Single blocks were between 0.5to 100 m3; some of them stopped on the regional road Bovec-Vrsic pass (1611 m), and some of them reachedthe Soca riverbank. One of the blocks even bounced to the other riverbank. The majority of the mass of avolume of 7,500 m3 remained on the slope talus below the rock face (Photo 2). Rock blocks damaged the roadat a length of 150 m, and in a short distance it was fully covered with tree trunks and rockfall debris includinglarge boulders.
After the 1993 rockfall, three large rock blocks remained partially released in the rock face. Two ofthem released and fell in 1998. Hence, in the rock face only one large rock block with dimensions of 70×20×25 mstill remained to fall (Zorn, 2001). Because of the rockfall hazard, an alarm system was erected, and in 2001 a276-m long rockfall gallery was built of reinforced concrete (Photo 3).
Calibration of the rockfall model Rockfall 6.1
The computer model Rockfall 6.1 was calibrated in two longitudinal profiles of the Osojnik rockfall(Photo 4). The profile “Osojnik desno” (Fig. 1) was put in the middle of the talus, nearby of two large boulders(Photo 5).

203
Table 2. Low/high parameter values used in calibration of the model — using the Rockfall 6.1.
Table 3. Number of the released blocks traveling over given distance L (m), computed for highand low roughness Dn and Dt as defined in Table 2.
The longitudinal profile “Osojnik desno”Computations using Rockfall 6.1 in the computerized longitudinal profile “Osojnik desno” (Fig. 1)
were performed using combinations of model parameters: number of blocks (10, 500, 10000), block size R (0.4m, 0.8 m, 2.0 m, 6.0 m), fall height (930 ± 40 m), dynamic friction angle Rg (20◦, 31◦, 33◦), static frictionangle Rh (40◦), rolling resistance Rw (0.3), trees (yes, no), model parameter variation (0 %, 20 %). The lowand high values for surface roughness Oa and Of , and normal damping Dn and tangential damping Dt aregiven in Table 2.
The sensitivity analysis was performed to evaluate the influence of slope roughness (Oa and Of ) onrun-out distance (Table 3, Fig. 2). Furthermore, the sensitivity of the model on the forest presence with adifferent tree diameter was tested: trees with selected diameters were added to describe the field conditions(Tables 4 & 5).
Using field data on silent witnesses (such as shown on Photos 5 & 6) the computer model Rockfall 6.1was then calibrated using computations with block size 5 m ± 50 % and 8.0 m ± 40 %, and using the RockTreemodule to evaluate the influence of trees (trees d1 = 0.3 m (293 m to 490 m) and trees d2 = 0.15 m (522 m to533 m) damping coefficient wood/rock = 0.2); the model parameter variation was set to 2 %. The calibratedmodel yielded the model parameters given in Table 6. The modeled run-out distances are given in Table 7.
From the calibration of the model the following main conclusions can be drawn:
– The number of the released blocks influences the run-out distance; especially with high slope surfaceroughness one should be careful and use a rather large number of released blocks (compare results for10,000 versus 500 blocks as shown in Table 3) to cover also extreme cases if necessary — computer timeis no real restriction, even though with 10,000 blocks the program might abort and abruptly terminatethe simulation. This is even more true if a large model parameter variation (> 20 %) is set.
– Slope surface roughness has a major influence on the run-out. With higher roughness the run-outdistance increases (left hand part of Table 3) — it seems as if surface irregularities force the blocks tojump further as being on ski jumps (compare cases a) and c) with high roughness and cases b) and d)with low roughness in Fig. 2). The number of rebounds, bounce height, total kinetic energy and variation

204
Table 4. The influence of trees on runout distance: Dn and Dt are high — see Table 2; in thelongitudinal profile trees d1 = 0.15 m are placed within stationing L = 293 m–490 m and treesd2 = 0.10 m are placed within L = 522 m–533 m; block size R = 0.8 m; Rh = 40◦; the dampingcoefficient between wood and rock was set to 0.1.
Table 5. The influence of tree diameter and block size on runout distance: number or releasedblocks: 500; Rg = 31◦; Rh = 40◦; Dn and Dt are high — see Table 2; surface roughness is high;in the longitudinal profile trees d1 are 6 m high, 4 m apart and placed within L = 293 m–490 mand trees d2 are 4 m high, 2 m apart and placed within L = 522 m–533 m; damping coefficientwood/rock = 0.3 for larger trees and 0.2 for smaller trees, respectively.
Table 6. Calibrated values of the model parameters in the longitudinal profile “Osojnik desno” —using Rockfall 6.1 and Rg = 33◦, Rh = 40◦, Rw = 0.3.

205
Fig. 2. The comparison of kinetic energy (first row) and bounce heights (second row) for differentsurface roughness (other model parameters: R = 0.8 m, Rg = 31◦, Rh = 40◦). For cases a) andc) the surface roughness was high, for cases b) and d) it was low. For cases a) and b), Dn andDt were low, for cases c) and d) they were high.
Photo. 6. Silent witness in the longitudinal profile “Osojnik desno”.
of run-out increase when compared to slope surface with low roughness when practically all blocks stopat the same run-out (at the toe of the talus with L = 500 m as shown in Table 4).It is therefore essential that a rockfall model should be calibrated before used under similar field conditionselsewhere. It is not wise to use easily available commercial rockfall simulation programs and use modelparameter values suggested in the literature without taking into account any field data to calibrate themodel.
– The rock size influences primarily the total kinetic energy (i.e. first row in Fig. 2) and to a large extentalso the maximal bounce height (i.e. second row in Fig. 2), but not the maximal run-out, which is athigh slope surface roughness high for all rock sizes (Table 5).It is therefore practically obligatory to involve into simulating rockfalls an engineering geologist whoshould estimate block sizes in rockfalls under consideration using field evidences such as rock joints,microfracturing, bedding and average rock layer thickness. Any relict (released) blocks under activerockfalls may help as well.
– The program Rockfall 6.1 defines two rock shapes: sphere and cylinder. If planar slides are involved in arockfall under consideration, then many released blocks rather have the shape of a plate (discus) than asphere. If such a block rolls like a wheel it can out-run a spherical block, and if it slides, its run-out willbe small due to large friction angle. In such a case large model variability should be taken into account

206
Table 7. Modeled run-out distances for block size 5 m ± 50 % in the longitudinal profile “Osojnikdesno” using Rockfall 6.1.
Table 8. Calibrated values of model parameters in the longitudinal profile “Osojnik levo” — usingRockfall 6.1 and Rg = 33◦, Rh = 40◦, Rw = 0.3.
Table 9. Computed run-out distances for the longitudinal profile “Osojnik levo” for different cases(parameter variation v = 20 %; meadow was added in case #9 starting at stationing 483 m withDn = 0.28 and Dt = 0.40).
to deal with the case of wheel-like blocks. The block shape is not adequately covered in Rockfall 6.1 andalso many other mathematical rockfall models.
– The Rockfall 6.1 has a forest module called RockTree that allows for assessment of the influence of aforest stand on rockfall dynamics, especially the run-out. An open forest stand with trees of diametersof some 10 cm (up to 50 cm) being approximately 10 times their diameter apart from each other canonly stop blocks of comparable diameter. Larger trees with the diameter 0.5 m and 0.3 m (case #3 inTable 5) effectively stop nearly all the blocks of the size of 0.2 m which is not the case with smaller treeswith the diameter 0.3 m and 0.2 m (case #2 in Table 5). Blocks much larger than the trees are muchless effectively stopped as the trees are not that easily hit by the blocks (see Table 5 and results for blocksizes R = 0.2 m and R = 1 m). For very large blocks of size comparable to the spacing between trees,the efficiency of trees to reduce kinetic energy of blocks, if not to fully stop them, rises again (see Table

207
Photo. 7. The longitudinal profile “Osojnik left” on the Osojnik rockfall in the Trenta Valley.
5 and results for block sizes R = 2 m and R = 6 m). For more precise interpretation one may releasemore than 500 blocks for each computational case, as was the case in Table 7; the improvement is notvery dramatic when compared to the influence of the variability of other model parameters, especiallythe previously mentioned slope surface properties.
– The initial block velocity (when released) should have, according to results of Bozzolo (1987), an im-portant influence on the block run-out but this was not supported by the results obtained in this casestudy.
– For this specific field case study on the Osojnik rockfall both friction angles (Rg and Rh), which areimportant when sliding is the major mechanism, do not have large influence since the sliding does notprevail over bouncing and rolling.
– Large blocks and boulders as silent witnesses are a good sign of the rockfall run-out — often definedby the so-called shadow angle. Evans and Hungr (1993) defined the minimal shadow angle to be 27.5◦;Meissel (1998) gave values of only 26◦. Shadow angles determined for the Osojnik rockfall, using fielddata on released boulders, are > 28◦. Only for extremely large blocks (> 6 m) one may expect thatthese would reach the Soca riverbed (stationing L > 550 m in the longitudinal profile “Osojnik desno”)and in such case the shadow angle would be < 28◦.
The longitudinal profile “Osojnik levo”Because the sensitivity analysis of the model was already performed in the longitudinal profile “Osojnik
desno”, the model parameters for the profile “Osojnik levo” (Photo 7; Fig. 3) were determined (Table 8) usingexperiences from the profile “Osojnik desno”. The calibrated values of the model parameters in the longitudinalprofiles “Osojnik desno” (Table 6) and “Osojnik levo” (Table 8) are quite similar.
Next, the run-out was computed for selected blocks sizes using 5,000 released blocks for each compu-tational case (Table 9). Small blocks (Table 9, cases #5 & #6 with R = 0.2 m) had run-outs quite comparableto very large blocks (Table 9, cases #1 through #4 with R = 4.5 m).
Much larger influence on the computed run-out was detected for slope surface properties describingblock impacts — normal and tangential damping. The influence of the meadow in case #9 (Table 9) whencompared with other cases is an example of this: small blocks roll across the meadow without high kineticenergy losses when compared to large blocks that impact the meadow and lose kinetic energy. This exampleagain stresses the importance of the slope surface properties on rockfall dynamics where block size and blockshape are closely related to each other.
Validation of the rockfall model on the Berebica rockfall
Finally, the calibrated model Rockfall 6.1 was applied to the Berebica rockfall (Photo 8 & Fig. 4) usingthe adopted model parameters (Table 10).

208
Fig. 3. The longitudinal profile “Osojnik levo”.
Table 10. Calibrated values of model parameters for the “Berebica” rockfall — using Rockfall 6.1and Rg = 33◦, Rh = 40◦, Rw = 0.3, parameter variation = 20 %.
Table 11. Block size influence on rockfall run-out in the case of the Berebica rockfall (parametervariance = 50 %; initial velocity = 0 m/s) — using the Rockfall 6.1.
The run-out was computed for different block sizes (Table 11) for the case without and with the gallery,respectively. For the situation before the construction of the gallery the computed run-out corresponded tothe run-out of the blocks that reached the Soca riverbed during the 1998 rockfall, as witnessed by large blocks.Also the Berebica rockfall exhibits the minimum shadow angle of 28◦, comparable to the value obtained forthe Osojnik rockfall.
The computed total kinetic energy (in kJ) for block sizes 0.5 m ± 50 % and the slope situation beforethe gallery was constructed (Fig. 5) showed that the total kinetic energy of released blocks in the cross section

209
Fig. 4. The longitudinal profile “Berebica” (left: without the rockfall gallery; right: with the gallery).
Fig. 5. An envelope curve for the total kinetic energy and bounce heights in case of the Berebicarockfall before the gallery was constructed (case #1 in Table 11).

210
Photo. 8. The Berebica rockfall in the Trenta valley with two longitudinal profiles.
of the regional road (stationing 210 m in the longitudinal profile on Fig. 5) was of the order of 4000 kJ. Thisvalue is the upper limit where dynamic barriers can still be effectively used. Since much larger blocks than 0.5m may still be released from the rock face of the Berebica rockfall, the decision to plan and build a rockfallgallery made out of reinforced concrete was the appropriate technical solution on this important regional road.
Conclusions
Using a 2-D rockfall mathematical model (e.g. Rockfall 6.1), the first problem was the choice of theappropriate longitudinal profile. In the case of an active rockfall, we should use silent witnesses (releasedblocks, tree damage, damaged forest under-storey, block “imprints” in soils), otherwise we should evaluateseveral profiles. Even precise surveying cannot show all local irregularities. In Rockfall 6.1 these irregularitiesare described by two model parameters: the amplitude of the surface roughness Oa and the roughness frequencyOf . The model results are very much a function of these two model parameters.
Another problem is the choice of the release point of the rockfall. To be on the safe side, one shouldtake into computation the upper scar in the rock face. With active (fresh) rockfalls the color of the rock faceindicates the release points (surfaces) and the choice is easier.
Also the released mass of blocks should be varied and determined from local geotechnical and geologicalinspection of the rock face, if possible. Silent witnesses may help to some extent.
Different values of friction and rebound coefficients can be chosen along the longitudinal profile, buteven in doing so, not all variability in slope surface properties can be taken into account. After the free falland the first hit with the slope surface, large energy losses can be detected and frequently the falling massdisintegrates. If these energy losses are taken to be too high, the run-out distance is underestimated.
It is essential that a rockfall model should be calibrated before it will be used under similar fieldconditions elsewhere. It is not wise to use easily available commercial rockfall simulation programs and usemodel parameter values suggested in the literature without taking into account field data to calibrate themodel.
In the last decade or so, 3-D rockfall models have been developed and tested. The existing 3-Dmathematical models solve some of the problems mentioned above, however, they introduce new ones. Anyexisting 2-D rockfall model should be used in engineering practice with much care and with full understandingof the processes involved in a rockfall. We believe that model applications, such as the one described in thispaper, using different but real field data are essential for further development of rockfall models.

211
References
Bozzolo, D. (1987) Ein Mathematisches Modell zur Beschreibung der Dynamik von Steinschlag, DissertationETH Nr. 8490, Zurich, 89 p.
Evans, S.G. and Hungr, O. (1993) The assessment of rockfall hazard at the base of talus slopes. CanadianGeotechnical Journal 30, 620–636.
Meissel, G. (1998) Modellierung der Reichweite von Felssturzen. Fallbeispiele zur GIS-gestutzen Gefahren-beurteilung aus dem Bayerischen und Tiroler Alpenraum. Innsbrucker Geographische Studien 28, 249 p.
Mikos, M. and Fazarinc, R. (2000) Earthquake-induced erosion processes in two alpine valleys in Slovenia,INTERPRAEVENT 2000, Band 2, p.143–154.
Orozen Adamic, M. (1990) Podor v Trenti = Rockfall in the Trenta valley. Ujma 4, 18.Pavsek, M. (1994) Skalni podor v Trenti = Rockfall in the Trenta valley. Ujma 8, 24–29.Petje, U. (2005) Analiza nevarnosti padajocega kamenja na cestah v alpskem prostoru = Analysis of rockfall
hazard on roads in the alpine environment. Unpublished Master Thesis Nr. 184, University of Ljubljana,Faculty of Civil and Geodetic Engineering, 242 p.
Petje, U., Ribicic, M. and Mikos, M. (2005) Ocena nevarnosti padajocega kamenja za odsek regionalne ceste vdolini Trente = Hazard assessment due to falling stones on a reach of the regional road in the Trenta valley,Slovenia. Geologija 48(2), 341–354.
Spang, R.M. (2003) Rockfall 6.1. Rockfall Simulation Program, Manual.Statham, I. (1976) A scree slope rockfall model. Earth Surface Processes 1, 42– 63.Zorn, M. (2001) Gorski relief kot posledica skalnih podorov = Mountain terrain as a consequence of rockfalls,
Unpublished Diploma Thesis, University of Ljubljana, Faculty of Arts, Dept. of Geography.