application of a hybrid computational fluid dynamics and
TRANSCRIPT
Application of a Hybrid Computational Fluid Dynamics andPhysiologically Based Inhalation Model for Interspecies Dosimetry
Extrapolation of Acidic Vapors in the Upper Airways
Clay B. Frederick,*,1 Michele L. Bush,† Larry G. Lomax,* Kurt A. Black,* Lavorgie Finch,* Julia S. Kimbell,‡Kevin T. Morgan,‡ Ravi P. Subramaniam,‡ John B. Morris,§ and James S. Ultman†
*Toxicology Department, Rohm and Haas Company, Spring House, Pennsylvania 19477;†Physiological Transport Studies Laboratory,Department of Chemical Engineering, The Pennsylvania State University, University Park, Pennsylvania 16802-4400;
‡Chemical Industry Institute of Toxicology, Research Triangle Park, North Carolina 27709; and§Toxicology Program,School of Pharmacy, University of Connecticut, Storrs, Connecticut 06269-2092
Received February 11, 1998; accepted May 26, 1998
Application of a Hybrid Computational Fluid Dynamics andPhysiologically Based Inhalation Model for Interspecies Dosime-try Extrapolation of Acidic Vapors in the Upper Airways. Fred-erick, C. B., Bush, M. L., Lomax, L. G., Black, K. A., Finch, L.,Kimbell, J. S., Morgan, K. T., Subramaniam, R. P., Morris, J. B.,and Ultman, J. S. (1998). Toxicol. Appl. Pharmacol. 152,211–231.
This study provides a scientific basis for interspecies extrapola-tion of nasal olfactory irritants from rodents to humans. By usinga series of short-term in vivo studies, in vitro studies with nasalexplants, and computer modeling, regional nasal tissue dose esti-mates were made and comparisons of tissue doses between specieswere conducted. To make these comparisons, this study assumesthat human and rodent olfactory epithelium have similar suscep-tibility to the cytotoxic effects of organic acids based on similarhistological structure and common mode of action considerations.Interspecies differences in susceptibility to the toxic effects ofacidic vapors are therefore assumed to be driven primarily bydifferences in nasal tissue concentrations that result from regionaldifferences in nasal air flow patterns relative to the species-specificdistribution of olfactory epithelium in the nasal cavity. The acute,subchronic, and in vitro studies have demonstrated that the nasalolfactory epithelium is the most sensitive tissue to the effects ofinhalation exposure to organic acids and that the sustentacularcells are the most sensitive cell type of this epithelium. A hybridcomputational fluid dynamics (CFD) and physiologically basedpharmacokinetic (PBPK) dosimetry model was constructed toestimate the regional tissue dose of organic acids in the rodent andhuman nasal cavity. The CFD–PBPK model simulations indicatethat the olfactory epithelium of the human nasal cavity is exposedto two- to threefold lower tissue concentrations of a representativeinhaled organic acid vapor, acrylic acid, than the olfactory epi-thelium of the rodent nasal cavity when the exposure conditionsare the same. The magnitude of this difference varies somewhatwith the specific exposure scenario that is simulated. The in-creased olfactory tissue dose in rats relative to humans may be
attributed to the large rodent olfactory surface area (greater than50% of the nasal cavity) and its highly susceptible location (par-ticularly, a projection of olfactory epithelium extending anteriorlyin the dorsal meatus region). In contrast, human olfactory epithe-lium occupies a much smaller surface area (less than 5% of thenasal cavity), and it is in a much less accessible dorsal posteriorlocation. In addition, CFD simulations indicate that human olfac-tory epithelium is poorly ventilated relative to rodent olfactoryepithelium. These studies suggest that the human olfactory epi-thelium is protected from irritating acidic vapors significantlybetter than rat olfactory epithelium due to substantive differencesin nasal anatomy and nasal air flow. Furthermore, the generalstructure of the hybrid CFD–PBPK model used for this studyappears to be useful for target tissue dosimetry and interspeciesdose comparisons for a wide range of inhaled vapors. © 1998 Academic
Press
A variety of volatile compounds induce toxic effects in therodent nasal cavity following inhalation exposure. Interest-ingly, the distribution of histopathological lesions is oftenlocalized in specific regions or is limited to one epithelial type(reviewed in Morgan and Monticello, 1990; Meryet al.,1994).The regional distribution of toxic effects from inhaled vaporshas been correlated with the nasal air flow patterns, i.e., regionsof high air flow tend to exhibit a higher incidence and greaterseverity of toxic effects than regions of low air flow (Morganand Monticello, 1990; Kimbellet al.,1993, 1997; Meryet al.,1994). This pattern of localized toxicity emphasizes the impor-tance of local tissue dose for interspecies extrapolation and riskassessment. Furthermore, observation of toxic effects localizedin specific epithelial types (variable depending on the inhaledvapor) emphasizes the importance of chemical-specific differ-ences in mode of action and tissue susceptibility.
Typically, high vapor concentrations of irritating organicacids and esters preferentially induce cytotoxicity of the olfac-tory epithelium in the nasal cavity (e.g. Keenanet al., 1990;
1 To whom correspondence should be addressed. Fax: (215) 619-1621.E-mail: [email protected].
TOXICOLOGY AND APPLIED PHARMACOLOGY 152,211–231 (1998)ARTICLE NO. TO988492
211 0041-008X/98 $25.00Copyright © 1998 by Academic Press
All rights of reproduction in any form reserved.

Trela and Bogdanffy, 1991; Milleret al., 1981, 1985). Respi-ratory epithelium in the rodent nasal cavity is typically muchless sensitive to inhaled organic acids and esters and generallydoes not exhibit histopathological lesions, although high in-haled concentrations of strong acids have been demonstrated toinduce cytotoxicity in this region also (e.g., formic acid; Na-tional Toxicology Program, 1992). The biochemical basis forthe olfactory toxicity has not been fully explored, but thepathogenesis is apparently based on the high susceptibility of aparticular cell type, olfactory sustentacular cells, to acids andesters (e.g., Leeet al., 1992; Trelaet al., 1992).
There is a wide interspecies variability in nasal anatomy(Gross and Morgan, 1992), in the amount of olfactory epithe-lium relative to respiratory epithelium in the nasal cavity(DeSesso, 1993) and in the localization of the olfactory epi-thelium relative to the main nasal air streams (Morganet al.,1991; Hahnet al., 1993; Keyhaniet al., 1995). This providesa substantive problem for interspecies extrapolation and riskassessment. The regulatory significance of the problem is em-phasized by the frequent use of histopathology in the rodentnasal cavity to establish inhalation exposure limits for indus-trial workers and the public, e.g., many of the EnvironmentalProtection Agency’s (EPA) reference concentrations (RfCs)for vapors are based on rodent nasal histopathology.
This study evaluated the acute nasal toxicity of an organicacid, acrylic acid, that is primarily used to make a variety ofaqueous emulsion polymers. Additional histopathologicaldose–response data were collectedin vitro using explants ofnasal epithelium cultured with acrylic acid solutions. Theinvivo and in vitro histopathological dose–response data, parti-tioning information, and total nasal deposition data from addi-tional in vivo studies were correlated with the output of aninhalation dosimetry model. The dosimetry model incorporatedthe anatomy, air flow patterns, and flux of inhaled vapor intothe walls of a model of either the rat or human nasal cavityobtained as output from computational fluid dynamics (CFD)simulations. This port of entry was linked to a systemic com-partmental physiologically based pharmacokinetic (PBPK)model for each species. An important feature of this hybridCFD-PBPK dosimetry model was the capacity to estimatetarget tissue dose of inhaled vapors in specific regions of thenasal cavity for a wide range of exposure scenarios. These doseestimates facilitated quantitative comparisons of interspeciesdifferences in the deposition of the absorbed vapors in the nasalepithelium and systemic tissues. The specific design criteria forthe construction and evaluation of the CFD–PBPK model werebased on the production of a generally useful dosimetry modelthat would comprehensively describe the available experimen-tal data that relate to regional and whole-nose nasal tissue dose(e.g., decreasing fractional deposition of a vapor in the overallnasal cavity with increasing inhalation flow rate, changes inoverall nasal deposition of a vapor by modulating the rate ofmetabolism of the vapor in the nasal cavity, changes in the rateof nasal uptake of an inhaled vapor as a function of time in
extended exposure scenarios as the arterial blood concentrationincreases due to systemic loading of the vapor, etc.) (Fredericket al., 1994). Notably, the CFD–PBPK model incorporates aunique interface to link the data from CFD simulations of airflow in the upper respiratory tract (of potentially any species orany number of individuals) with a compartmental PBPK modelwith the capacity to describe systemic distribution, metabo-lism, and excretion as well as systemic target tissue dose. Thegeneral model structure appears to be useful for tissue doseestimates and interspecies extrapolation for a wide range ofinhaled vapors. To provide a basic dataset to evaluate theCFD-PBPK model structure, the model was initially used toevaluate the rodent nasal deposition of several poorly metab-olized vapors. To further explore the relationship of regionalnasal tissue dose and histopathology, the model was used toevaluate the olfactory tissue dose of an inhaled organic acid inboth rats and humans under the same simulated exposureconditions. The data from these studies provide a scientificbasis for tissue dose comparisons, interspecies extrapolation,and risk assessment.
MATERIALS AND METHODS
Chemicals. The glacial acrylic acid (CAS 70-10-7) used for these studieswas flocculent grade containing 200 ppm MEHQ (Rohm and Haas Co., DeerPark, TX) with a purity of 99.96 0.1% by gas chromatography.
Acute inhalation exposure of rats. Female F344/N rats (approximately 60to 75 days old upon arrival; weight range of 160 to 175 g 1 day prior toexposure) were obtained from Charles River Laboratories (Wilmington, MA).Food and filtered tap water were suppliedad libitum,except during inhalationexposure, when food and water were withheld. The animals were administereda single, whole-body inhalation exposure of 0 or 75 ppm acrylic acid vapor for3 or 6 h in a 240-liter exposure chamber. The exposure atmosphere wasgenerated by passing compressed air over the surface of acrylic acid liquidmaintained at approximately 40°C in a 250-ml glass jar. The vapor was dilutedwith conditioned laboratory air to the appropriate concentration (monitored bya Foxboro MIRAN 1A infrared gas analyzer that had been calibrated by gaschromatography of impinger samples) and entered the top of the exposurechamber. The animals were housed in individual cages during the exposureperiod.
Immediately following exposure, the animals were removed from the inha-lation apparatus, anesthetized with sodium pentobarbital, and then killed byexsanguination by cutting the abdominal aorta. The nasal cavity was infusedwith 10% neutral-buffered formalin via the pharyngeal duct, the head was thenimmersed and fixed in formalin, decalcified, and sectioned transversely atLevels I through IV (Young, 1981). The tissue sections were processed,microtomed at 4 to 6mm, stained with hematoxylin and eosin, and evaluatedfor histopathology. Lesions were characterized according to the scheme usedpreviously (Lomaxet al.,1994), and their locations were mapped according tothe scheme described by Meryet al. (1994). A composite regional map wasalso constructed for each group. The recording of lesions was designed toqualitatively assess the extent, nasal region affected, and type of histologiclesions within the nasal cavity.
In vitro incubation of nasal explants with acrylic acid. Nasal septa werecarefully collected from female F344/N rats (weight range of 150 to 225 g) andincubated for 2 h in DMEM/F12 media supplemented with antibiotics (peni-cillin, streptomycin, and nystatin), insulin, transferrin, selenium, hydrocorti-sone, and epidermal growth factor under an atmosphere of 95% O2 and 5%CO2 at 37°C. For treated tissues, 0.0 to 6.0 mM acrylic acid was added to the
212 FREDERICK ET AL.

medium prior to the addition of the tissues, and the treated medium wasadjusted to pH 7.3 with 1 N sodium hydroxide. After incubation, the tissueswere fixed with formalin, decalcified, imbedded in glycol methacrylate, mi-crotomed at 2 to 3mm, stained with hematoxylin and eosin, and evaluated forhistopathology.
Partition coefficients. Liquid:air partitioning of acrylic acid vapor wasevaluated as described by Gargaset al. (1989) for saline (unbuffered), phos-phate buffer, rat blood, and rat inguinal fat. Each solution was evaluated underthe following three conditions: unbuffered, at pH 2.0 with phosphate buffer,and at pH 7.4 with phosphate buffer. In addition, liquid:air partitioning withwater (unbuffered), DMEM/F12 tissue culture media, octanol, and olive oilwere evaluated. Liquid:air partitioning of acetic acid was evaluated similarlywith unbuffered saline and phosphate buffer at pH 2.0 and 7.4.
Simulations of nasal air flow and estimation of gas phase mass transport
coefficients with CFD. Simulations were conducted with CFD software(FIDAP from Fluent, Lebanon, NH) to evaluate regional air flow and gas phasemass transport coefficients for rats and humans. Steady-state simulations wereconducted using a three-dimensional computer model (“mesh”) of both theanterior rat nasal cavity (Kimbellet al.,1993, 1997; Godoet al.,1995) and thehuman nasal cavity (Subramaniamet al.,1998). Effectively, these simulationsestimated regional air-phase delivery of the vapor to the mucus lining the nasalairway. The simulations were conducted at inspiratory flow rates of 100, 300,and 500 ml/min (rat) and 11,400 and 18,900 ml/min (human). The CFDsimulations were restricted to steady inspiratory flow conditions, and onlylaminar flows were considered in modeling transport. The importance ofunsteady effects has been characterized as negligible by Subramaniamet al.(1998) and Keyhaniet al. (1995). Thermal convection effects have also beenignored based on the analysis by Keyhaniet al. (1995) that indicated that theywere negligible. The nasal walls have been assumed to be rigid and hairless,and dynamic changes in air flow due to the occlusive effects of nasal cyclinghave been ignored. Simulations were conducted with the computer model ofthe human nasal cavity with gas phase diffusivities of 0.05, 0.1, and 0.15cm2/s. These studies indicated that the flux of the vapor to the wall of the nasalcavity varies as a near-linear function of the gas phase diffusivity over thislimited diffusivity range. For many of the CFD simulations, a gas phasediffusivity of 0.15 cm2/s was used and the gas phase mass transport coefficientwas scaled proportionally for vapors with differing diffusivities (0.6 for acrylicacid). Experimental determinations of air phase diffusivity of a wide variety ofrepresentative organic vapors in the 30 to 150 MW range have ranged from 0.2to 0.07 cm2/s (Cussler, 1997). Interspecies dose comparisons for acrylic acidwere conducted with gas phase mass transport coefficients derived from CFDsimulations for the human nasal cavity that were conducted with a gas phasediffusivity of 0.1 cm2/s and with proportional scaling of the CFD data for therat nasal cavity. As discussed by Bushet al. (1998), deposition of vapors in therat nasal cavity is relatively insensitive to significant variation in the gas phasemass transport coefficients.
The inhalation flow rates used for the CFD exercises were chosen tosimulate ventilation characteristic of resting conditions to light physical activ-ity for each species (ICRP, 1975; Kimbellet al.,1993, 1997; Subramaniametal., 1998). The “C5 0 boundary conditions” (the assumption that the con-centration of the vapor in the nasal airway lining is always zero) used for eachmesh in these studies simulates a nasal epithelium with an infinitely largemucus:air partition coefficient and/or an infinitely fast rate of reaction of thevapor molecules upon collision with the mucus layer (i.e., the CFD simulationsallowed no “back pressure” or desorption to limit wall uptake). Effectively,this assumption decouples the tissue resistance from the gas phase resistance.With some modifications reported in the Appendix, the methods described byBushet al. (1998) were used to calculate the regional gas phase mass transportcoefficients for each flow rate. The finite element calculations used for the CFDsimulations of nasal air flow are subject to numerical errors in the massbalance. In the case of the CFD simulations of the human nasal cavity, themass balance error for the overall uptake was up to 8%. Assuming as a firstapproximation that the percentage error is uniformly distributed within the
nasal cavity, then the error in a given compartment is proportional to itsdiffusion surface.
Structure of physiologically based inhalation model.A whole-body com-partmental physiologically based inhalation model was constructed with ACSLfor Windows (Mitchell and Gauthier Associates, Concord, MA). This modelincluded a nasal cavity as a port of entry for inhaled acidic vapors that wasbased on a compartmental rat nasal model for nonmetabolized and poorlymetabolized vapors (Bushet al., 1998). A critical component of the nasalCFD–PBPK model that was necessary for interspecies extrapolation was amodular description of nasal air flow and the calculation of compartmental gasphase mass transfer coefficients in both the rodent nasal cavity (Kimbellet al.,1993, 1997) and human nasal cavity (Subramaniamet al., 1998) using datafrom CFD simulations (methods described above). The liquid phase of themodel of Bushet al. (1998) was modified to include the effect of bufferingcapacity on the ionization of the acid in the mucus, diffusion of both theionized form of the acid (presumably, primarily the salt, sodium acrylate) andthe nonionized species, liquid:air partition coefficients, tissue:blood partitioncoefficients (Black and Finch, 1995), and metabolism of acrylic acid (Blackand Finch, 1995). The Appendix describes methods used to incorporate theresults from the CFD simulations and lists the additional model parameters(and their derivation) used to modify the model of Bushet al.(1998) for acrylicacid. Cyclic flow simulations of breathing were conducted by alternatelyreversing air flow to simulate inhaling and exhaling. Exhalation was modeledby reversing the air flow from the CFD simulations of unidirectional flow ofinhaled air. More refined analyses in future models could easily incorporatechanges in air flow patterns and gas phase mass transfer between inhalationand exhalation.
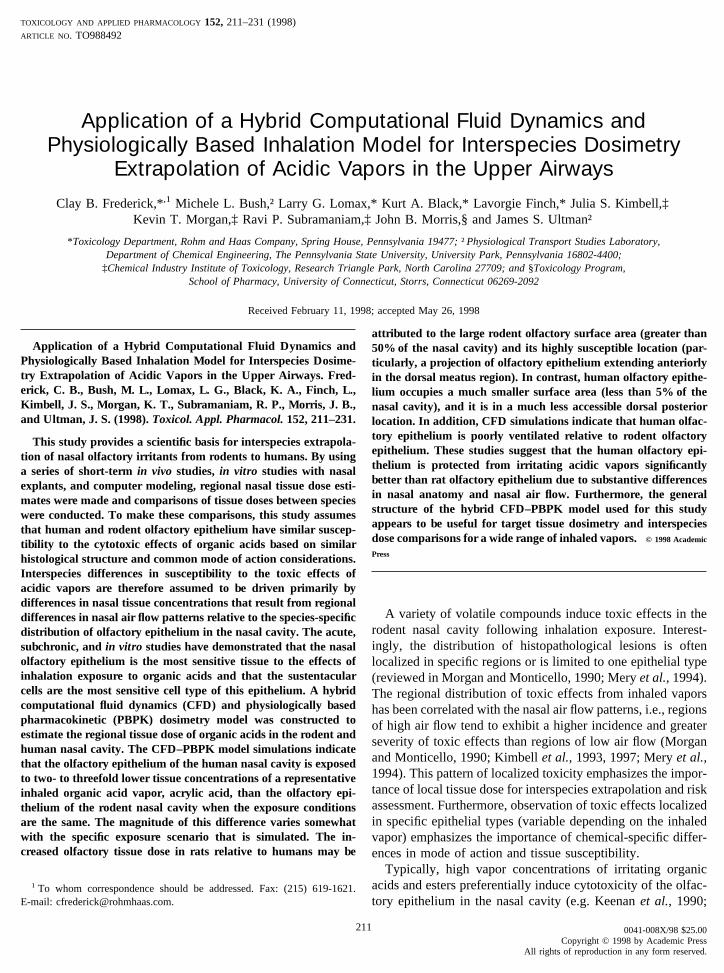
Conceptually, the model could be constructed with any number of compart-ments. For this study, the interspecies comparisons were conducted with arelatively simple anatomically based compartmental model (Figs. 1 and 2)consisting of all inhaled air flowing across the nasal vestibule, a dorsal medialairstream flowing over respiratory epithelium and then olfactory epithelium,and a second composite ventral and lateral air stream flowing over the remain-ing respiratory epithelium in the nasal cavity (divided into anterior and pos-terior compartments). All air from the nasal cavity then passes over a naso-pharynx compartment before entering a composite lower respiratory tractcompartment (which could be further subdivided into additional compartmentsfor regional dose estimates, if necessary). The large olfactory region of rodentswas divided into two compartments (Figs. 1 and 2), a small dorsal anteriorcompartment (13% of the olfactory epithelium and 7% of the total nasalsurface area) and a large compartment representing the remaining olfactoryepithelium on the septum and ethmoid turbinates (data from nasal CFD meshand Grosset al.,1982). The human nasal cavity (Figs. 1 and 2) does not havean anatomical equivalent for the rat ethmoid turbinates that are coveredprimarily with olfactory epithelium; consequently, the small human olfactoryepithelium was described by one compartment comprising approximately 4%of the total nasal surface area (Lang, 1989).
The diffusion path from the nasal lumen to the blood exchange region(liquid phase) of each compartment was divided into a 10- to 20-mm-thickmucus layer and underlying epithelial cell layers that were 15- to 20-mm thick(Fig. 2B; two cell layers for respiratory epithelium and four cell layers for thethicker olfactory epithelium). The thicknesses of the rat respiratory and olfac-tory epithelia were determined from photomicrographs of each tissue relativeto photomicrographs of a calibrated micrometer at the same magnification. Thethicknesses of the rat nasal epithelia are consistent with similar measurementsof human nasal epithelia (Lang, 1989), therefore the same epithelial structurewas used to model each species. This layered description of the epithelium wasbased upon the approach used by Morriset al. (1993) to approximate theconcentration gradient across nasal tissue from the mucus layer to the vascu-larized region under the basal lamina, which serves to remove nonmetabolizedvapors in the venous blood. In addition, the bodies of the olfactory sustentac-ular cells (the cells that are most sensitive to the toxic effects of organic acids)line the nasal lumen immediately under the mucus layer. Therefore, the apical
213HYBRID CFD-PBPK NASAL DOSIMETRY MODEL

epithelial layer simulated by the model in the olfactory region effectivelycorresponds to the target cell population for toxic effects.
RESULTS
Acute Inhalation Exposure of Rats to Acrylic Acid
The olfactory epithelium of the nasal cavity was identified asthe primary target tissue in rats inhaling 75 ppm acrylic acidvapor for either 3 or 6 h (Table 1). Control animals exhibitedno detectable lesions in the nasal cavity, nor were lesionspresent in the squamous epithelium of rats exposed to acrylicacid. Lesions were confined to the dorsal aspects of the nasalcavity, in particular the dorsal meatus, the dorsomedial aspectsof the nasoturbinate, and ethmoturbinate 3 (Fig. 3). The lesionswere small and most of the olfactory and respiratory epitheliumin the treated animals was normal histologically. However, theextent of the lesions increased as the exposure time was in-creased from 3 to 6 h.
Olfactory epithelial cell degeneration was accompanied bysustentacular cell necrosis (Fig. 4). These lesions were ob-served in all four sections of the nasal cavity at both 3 and 6 hof exposure, although the area of mucosa affected and theincidence of affected animals was greater in the anterior threesections. Limited regions of respiratory epithelial degenerationand desquamation were present in Section I in animals exposedfor 6 h (Table 1). Lesions of the respiratory epithelium werenot observed in Sections II and III. Section IV did not containrespiratory epithelium.
In Vitro Incubation of Nasal Explants with Acrylic Acid
Short-term organ culture of nasal explants with media con-taining acrylic acid resulted in histopathological lesions verysimilar to those observedin vivo (Fig. 5; Table 2). Since thetissue culture medium has a liquid:air partition coefficient foracrylic acid that is very similar to that of blood (Table 3) andthe acrylic acid epithelial tissue:blood partition coefficients areapproximately one (Black and Finch, 1995), it may be assumedthat the concentration of acrylic acid in the tissue explants isapproximately the same as the medium (note that metabolismof acrylic acid by epithelial tissues is not fast enough togenerate a significant concentration gradient; Black and Finch,1995). This would suggest that the steady-state tissue concen-tration of acrylic acid required to induce sustentacular cellcytotoxicity and subsequent loss of neuronal cells must be atleast 0.5 mM with actual loss of sustentacular and neuronalcells observedin vitro in the 3 to 6 mM concentration range.An acrylic acid concentration of 0.4 mM in the medium (andconsequently in the tissue) is a no-observed-adverse-effectlevel (NOAEL) in this assay. No cytotoxicity was observed inthe respiratory epithelium, suggesting that the acrylic acidconcentration required to induce cytotoxicity in respiratoryepithelium in this assay is in excess of 6 mM.
Partition Coefficients for Acrylic Acid
The partitioning of acrylic acid between air and liquidphases was evaluated with unbuffered, neutral, and acidicliquid phases (Table 3). The data indicate a strong preferencefor acrylic acid partitioning into the aqueous phase, regardlessof blood pH (i.e., acid dissociation contributes to the prefer-ence for the liquid phase, but it is not the determining factor),which is consistent with the highly polar structure of this smallorganic acid. The partition coefficients of all of the tissues,saline, and oil at neutral pH are similar to that of the tissueculture medium. Black and Finch (1995) evaluated a variety oftissues using a micropartitioning technique for ionizable com-pounds and found that acrylic acid had tissue:blood partitioncoefficients that were close to 1:1 for a wide variety of tissues.The similarity of tissue culture medium to blood indicates thatequilibrium partitioning of acrylic acid from the medium intocultured epithelial tissues should be close to 1:1. Similarly, the
FIG. 1. Rat and human nasal anatomy divided into compartments corre-sponding to the epithelium lining the lumen. The squamous epithelium liningthe vestibule of the human nasal cavity is primarily anterior to the nasal valve.The human nasal cavity lacks a region lined with olfactory tissue that iscomparable to the rat ethmoid turbinates. The figure of the human nasal cavitywas modified from Lang (1989) and the figure of the rat nasal cavity wasmodified from Milleret al. (1993). The arrows designate the air flow streamsdescribed by the CFD–PBPK, which are described in more detail by Kimbellet al. (1993, 1997) for the rat nasal cavity and by Keyhaniet al. (1995) andSubramaniamet al. (1998) for the human nasal cavity.
214 FREDERICK ET AL.
FIG. 2. (A) Diagram of the PBPK model constructed to comprehensively describe the regional nasal deposition, systemic absorption, distribution, andexcretion of acrylic acid and (B) to describe the local interaction of inhaled acrylic acid vapors with the nasal epithelium. The rodent model uses two olfactorycompartments to incorporate both the olfactory epithelium in the projection extending along the dorsal meatus and the ethmoid olfactory region. The humanmodel uses one olfactory compartment since the human nasal cavity lacks a counterpart for the rodent ethmoid olfactory region. The variable names in the aircompartment of B relate to the rate equations of the Appendix.
215HYBRID CFD-PBPK NASAL DOSIMETRY MODEL

partitioning between mucus and the underlying tissues is as-sumed to be close to unity.
Evaluation of Regional Nasal Air Flow and Gas Phase MassTransport Coefficients from CFD Simulations
CFD simulations conducted with computer models of the ratand human nasal cavities provided estimates of the volume ofair flowing through various regions of the rat and human nasalcavities at inhalation flow rates representative of resting to lightactivity physiological conditions (Tables 4 and 5; anatomicalregions are designated in Fig. 1). The data from these CFDsimulations confirmed previous studies (e.g. Swift and Proctor,1977; Hahnet al.,1993; and Keyhaniet al.,1995) by indicat-ing that a relatively small fraction of the inspired air ventilatesthe human olfactory epithelium relative to the rat olfactoryepithelium (in this study, approximately 7% in the humanrelative to approximately 15% in the rat). This difference isgreater in the posterior olfactory region of the human nasalcavity (olfactory air flowdecreasesto only approximately 3%of total nasal air flow as the dorsal medial air stream movesventrally into the medial region) relative to the posterior ol-factory region of rats (olfactory air flowincreasesto approx-imately 20% of total flow as medial air flow contributes to thedorsal medial stream in the posterior region). Other CFDstudies have graphically demonstrated this effect with contourmaps and “streamlines” of air flow in both the rat nasal cavity(Kimbell et al., 1993) and human nasal cavity (Hahnet al.,1993; Keyhaniet al., 1995; Subramaniamet al., 1998).
Generally, where data can be compared, the regional com-partmental gas phase mass transport coefficients for the rat
nasal cavity are one to two orders of magnitude higher thanthose of the human nasal cavity (Tables 4 and 5). This indicatesthat the rat nasal cavity is much more efficient than the humannasal cavity in “scrubbing” an organic vapor from inhaled air(i.e., equilibrating vapor with the nasal mucus layer as opposedto allowing it to reach the downstream tracheobronchial re-gion). Bushet al. (1998) noted that the mass transport coeffi-cients calculated for the rat nasal cavity were much higher thanwould be predicted from simple cylindrical geometry andattributed the difference to the interaction of air flow with thecomplex geometry of the rat nasal cavity. The observation thatthe regional mass transport coefficients in the human nasalcavity are closer to those predicted for a cylindrical geometrymay reflect less complex air flow patterns and a larger effectivelumen volume to mucus surface area ratio than the rat nasalcavity.
The available experimental evidence for the near-quantita-tive deposition of a variety of highly soluble vapors in thewhole rat nasal cavity is supportive of very high mass transportcoefficients for the rodent nasal cavity (e.g., 991% nasaluptake of inhaled hydrogen fluoride vapor; Morris and Smith,1982). Since the gas phase mass transport coefficients for therat nasal cavity are so high, the rat nasal dosimetry model ofMorris et al. (1993), which assumes full equilibration of in-haled vapors with the nasal epithelium (hence, no air phaseresistance to nasal deposition), appears to be an accurate ap-
FIG. 3. Composite distribution of nasal lesions of the group of ratsexposed once for 6 h to 75 ppmacrylic acid vapor. The templates are takenfrom Mery et al. (1994) and correspond to cross-sections taken at Sections 6(A), 9 (B), 23 (C), and 26 (D) from Fig. 1 of this reference. The lesions weremarked by symbols in the adjacent lumen of the nasal cavity: regions ofolfactory epithelial degeneration (solid line), regions of sustentacular cellnecrosis (3), and regions of respiratory epithelial degeneration and desqua-mation (E).
TABLE 1Incidence of Histological Lesions in the Nasal Cavity of Rats
Exposed to 75 ppm Acrylic Acid Vapor for 3 or 6 h
0 PPM 75 PPM
3 h 6 h 3 h 6 h
Section 1a
Olfactoryb 0/5 0/5 1/5 1/5Respiratoryc 0/5 0/5 0/5 2/5
Section 2Olfactory 0/5 0/5 3/5 2/5Respiratory 0/5 0/5 0/5 0/5
Section 3Olfactory 0/5 0/5 2/5 4/5Respiratory 0/5 0/5 0/5 0/5
Section 4Olfactory 0/5 0/5 0/5 4/5Respiratory NAd NA NA NA
a Section number of nasal cavity.b Olfactory epithelial degeneration and sustentacular cell necrosis.c Respiratory epithelial cell degeneration and desquamation.d Not applicable. No respiratory epithelium present.
216 FREDERICK ET AL.

proximation, and rat nasal uptake of vapors may be describedas limited by tissue phase resistance (i.e., limited by factorssuch as diffusion, metabolism, and blood perfusion in the tissuephase). Supporting this conclusion, Bushet al. (1998) haveused sensitivity analysis in a similar hybrid CFD–PBPK of thenasal deposition of nonmetabolized vapors in the rat nasalcavity to demonstrate that the rate of liquid phase diffusiondominates the extent of uptake in this species.
An important observation noted by Bushet al.(1998) for therat nasal cavity (and replicated in Table 4 of this study)between flow rate and regional mass transport coefficients wasalso observed in the CFD simulations for the human nasalcavity (Table 5). Generally, the mass transport coefficientincreaseswith increasing fluid velocity with simple geometries(flat plate, circular tube, etc.; discussed in Cussler, 1997, Ch.8). However, in several regions of both the rat and human nasal
FIG. 4. Olfactory epithelium from a control rat (A) and a rat exposed to 75 ppm AA for 6 h (B). This region of olfactory epithelium from the treated ratdemonstrates epithelial degeneration (vacuolation and disassociation) and necrosis of sustentacular cells.
217HYBRID CFD-PBPK NASAL DOSIMETRY MODEL

cavity (including the olfactory region), the mass transportcoefficientdecreaseswith increasing flow rate. This anoma-lous relationship was attributed by Bushet al. (1998) to thecomplex geometry of the air passages in the nasal cavity andthe possible detachment of the air boundary layer with increas-ing flow rate.
Sensitivity analysis of the model parameters in the rat CFD–
PBPK model from the base set of values listed in Tables 3through 6 and the Appendix gave results that were virtuallyidentical to those reported for the 16-compartment model ofBushet al. (1998). Notably, the model’s predictions of overallnasal uptake were very insensitive to variations in the com-partmental gas phase mass transport coefficients (varying thecoefficients in Table 4 by a factor of62 produced a change in
FIG. 5. Olfactory epithelium from the nasal septa of rats incubated either with control tissue culture media (A) or media containing 6 mM AA for 2 h (B).This region of olfactory epithelium from the treated septum demonstrates epithelial degeneration (vacuolation and disassociation) and necrosis of sustentacularcells that is very similar to that observed in the rat nasal cavity fromin vivo studies (Fig. 4).
218 FREDERICK ET AL.

nasal uptake of less than 1%). However, uptake was sensitiveto variation in liquid phase diffusivity (Appendix) and tovariation in the mucus:air partition coefficient (Table 3), andthe magnitude of this variation was very similar to that reportedby Bushet al. (1998). In contrast to the rat model, the humanCFD–PBPK model was sensitive to variation in air phaseparameters in addition to liquid phase parameters. For exam-ple, for a CFD–PBPK simulation of acrylic acid vapor uptakeat a unidirectional flow rate of 18.9 liter/min, the overall nasaldeposition was predicted to be 52% in the human nasal cavity.Varying the air phase mass transport coefficients by factors of22 and12 from the base case parameters of Table 5 resultedin overall nasal uptake values of 41 and 60%, respectively.Changes in nasal uptake produced by twofold variation inliquid phase diffusivity coefficients (all layers varied simulta-neously) and mucus:air partition coefficients were comparableto those changes produced by twofold variations in the gasphase mass transfer coefficients.
The current lack of CFD data for the posterior region of therat nasal cavity limits interspecies comparisons of the deposi-tion in the total nasal cavity somewhat, but the available datafor the anterior half of the rat nasal cavity demonstrates thateven the anterior half is more efficient in scrubbing organicvapors (approximately 97% at an inspiratory flow rate of 252ml/min; Kimbell et al., 1993) than the entire human nasalcavity including nasopharynx (approximately 88% at a flowrate of 18,900 ml/min as determined in this study). This com-parison is made with “C5 0 boundary conditions” in CFDsimulations that only evaluate the contact of the inhaled vaporwith the walls of the nasal cavity (i.e., all vapor that contactsthe mesh wall is instantly absorbed and no “back pressure” issimulated). On aregional basis in the nasal cavity, this inter-species difference in the deposition of inhaled vapors in theoverall nasal cavity is significant (see regional nasal dosecomparisons below) due to differences in the air flow patterns
and distribution of epithelia between the two species. In con-trast to the limitingtissue phase resistancein the rat nasalcavity, these data clearly indicate thatair phase resistancetothe deposition of inhaled vapors is a significant factor thatlimits uptake in the human nasal cavity, at least on a regionalbasis (see Cussler, 1997, for a discussion of the concept ofresistances in series relative to mass transfer across a gas–liquid interface; Appendix). In other words, a reasonably ac-curate nasal dosimetry model for humans must incorporate anair phase compartment to describe the regional air phase ratelimitations associated with the deposition of inhaled vapors,rather than assuming full equilibration of inhaled vapors as isappropriate for the rat nasal cavity.
Regional Tissue Dose Estimates from Physiologically BasedInhalation Modeling
A hybrid CFD-PBPK inhalation model (Figs. 1 and 2) wasprepared to evaluate the relationship between inhaled acrylicacid vapor concentration (air phase) and the tissue concentra-tion (liquid phase) in various regions of the nasal cavity. Themodel was designed to easily incorporate interspecies differ-ences in nasal anatomy and air flow patterns via CFD analysisof nasal air flow for each species and to facilitate databasedinterspecies extrapolation for risk assessment. An explicit ef-fort was made to derive the parameters used in the model eitherfrom experimental data or from physicochemical principles(Tables 3 through 6; Appendix) without “fitting” model pa-rameters.
For the rat nasal cavity, the model was used to simulate theair flow distribution from the CFD analysis described by Kim-bell et al. (1993). However, the distribution of air flow was
TABLE 3Partition Coefficients of Acrylic Acid
between Liquid Phases and Air
Liquid phase (pH) Liquid:air partition coefficient
Saline (unbuffered) 14506 360a
Saline (pH 2.0) 1780Saline (pH 7.4) 3210Rat blood (unbuffered) 55006 200Rat blood (pH 2.0) 61006 350Rat blood (pH 7.4) 43006 130Rat fat (unbuffered) 56306 1350Rat fat (pH 2.0) 21406 710Rat fat (pH 7.4) 84606 360Water (unbuffered) 2320Tissue culture mediab (pH 7.3) 7800Octanol 6280Olive oil 3530
a Mean 6 SD of triplicate replicates of triplicate analyses. Values listedwithout a SD are triplicate replicates of a single analysis.
b Tissue culture media used for explants of nasal epithelium (see Materialsand Methods).
TABLE 2Dose Response for Histopathological Effects in the Epithelium
of Rat Nasal Septa Incubated with Acrylic Acid In Vitro
Concentration of AAin medium (mM)
Histopathological findings in olfactoryepithelium
0 No visible lesions0.1 No visible lesions0.2 No visible lesions0.4 No visible lesions0.6 Cytoplasmic vacuolation and nuclear swelling
of sustentacular cells (2/4)a
1.0 Cytoplasmic vacuolation and nuclear swellingof sustentacular cells (4/4)
3.0 Sloughed sustentacular cells (4/4)6.0 Sloughed sustentacular cells, Sloughed
neuroepithelium (4/4)
a Number of explants with lesion/number of explants examined.
219HYBRID CFD-PBPK NASAL DOSIMETRY MODEL

divided into two air flow streams similar to the approach usedby Morris et al. (1993): a dorsal medial that corresponded tothe dorsal medial flow stream described by Kimbellet al.(1993), and the remaining four ventral and lateral streamsdescribed by Kimbellet al. (1993) were combined into oneflow stream (Figs. 1 and 2A). This approach was simpler thanthe more sophisticated air flow analysis of the rat nasal cavityconducted by Bushet al. (1998), because the available humandata for interspecies tissue dose comparisons were limited. Asnoted in Materials and Methods, the rat olfactory epitheliumwas divided into an anterior dorsal meatus projection (7% ofthe surface area of the nasal cavity) and a much larger posteriorethmoid region (44% of the surface area of the nasal cavity). Inthe in vivo inhalation studies that have been conducted, inha-lation of an irritating organic acid or ester has resulted in ananterior-to-posterior progression of lesions that parallels thedose–response curve (i.e., the most anterior dorsal–medial ol-factory epithelium exhibits the lesions observed at the lowestinhaled concentrations that induce a toxic effect). Conse-
quently, for interspecies extrapolation, comparisons of tissueconcentrations were based on the first epithelial layer of thisanterior compartment of olfactory epithelium lining the dorsalmeatus region of the rat nasal cavity. This is the olfactoryregion that is exposed to the highest vapor concentration andwould be the first region to demonstrate toxicity in a dose–response study. As noted above, this region also contains theapical cell bodies of the acid-sensitive sustentacular cells of theolfactory epithelium. Since the human nasal cavity only has asmall area covered with olfactory epithelium (approximately4% of the surface area of the nasal cavity; Lang, 1989) and noanatomical equivalent for the ethmoid turbinates, this regionwas described by one compartment, but with the same numberof cell layers as in the rat.
The output of the rat CFD–PBPK model was evaluated bycomparing the predicted fractional nasal uptake for acrylic acidwith the data from a unidirectional uptake study (Morris andFrederick, 1995. The predicted uptake from the model forunidirectional flow, 98%, compares favorably with the mea-
TABLE 4Results from CFD Simulations of the Deposition of Inhaled Acrylic Acid Vapor in a Model of the Rat Nasal Cavity
under “Concentration Equals Zero” Boundary Conditions
Parameter and compartmenta
Simulation flow rate (ml/min)
(100) (300) (500)
Regional flowb (also regional surface area in cm2 and lumen volume in cm3)Vestibule (0.44, 0.01) 1.0 1.0 1.0DM respiratory (0.2, 0.004) 0.12 0.15 0.18DM olfactory (0.42, 0.012) 0.14 0.15 0.17Ethmoid olfactory (6.33, 0.054) 0.17 0.19 0.21Anterior ventral respiratory (1.8, 0.09) 0.88 0.85 0.82Posterior ventral respiratory (4.5, 0.09) 0.83 0.81 0.79Nasopharynx (0.1, 0.001) 1.0 1.0 1.0
Regional gas phase mass transport coefficientsc
Vestibule (estimated value) 0.004 0.01 0.02DM respiratory 333.0 134.0 15.3DM olfactory 134.0 120.0 21.0Ethmoid olfactory (estimated value) 442.0 1480.0 2710.0Anterior ventral respiratory 578.0 639.0 1775.0Posterior ventral respiratory (estimated value) 3083.0 358.0 69.0
Nasopharynx (estimated value) 0.003 0.01 0.017
a The regional nasal compartments are defined by epithelial types with the surface areas and lumen volumes for each region derived either from the FIDAPmesh or by difference from Grosset al. (1982): Vestibule5 anterior region covered with squamous epithelium; DM respiratory5 anterior dorsal medialrespiratory epithelium; DM olfactory5 anterior projection of dorsal medial olfactory epithelium; Ethmoid olfactory5 remaining olfactory epithelium coveringethmoid turbinates and septum; Anterior ventral respiratory5 anterior region of remaining respiratory epithelium covering the septum and ventral and lateralwalls of the nasal cavity; Posterior ventral respiratory5 posterior region of remaining respiratory epithelium covering the septum and ventral and lateral wallsof the nasal cavity; Nasopharynx5 region posterior to the most posterior olfactory epithelium.
b Fraction of total air flow entering this region of the nasal cavity (dimensionless).c Gas phase mass transport coefficient (cm/s) calculated from CFD simulations at three flow rates. The simulations were conducted with a gas phase diffusivity
of 0.15 cm2/s and were scaled in the hybrid CFD–PBPK model by a factor of 0.6 for vapor with a gas phase diffusivity of 0.1 cm2/s. The rat “mesh” used forthe CFD simulations replicated the anterior half of the nasal cavity (anterior 16 mm and 18% of the total nasal surface area estimated by Grosset al., 1982),and the simulation did not include uptake in the vestibule, ethmoid turbinate region, posterior ventral respiratory region, and the nasopharynx (Kimbellet al.,1993, 1997). Estimates ofKgc for those regions were calculated based on an assumed fractional penetration of 0.999 for the vestibule and nasopharynx (essentiallyno uptake) and an assumed fractional penetration of 1.03 1024 for the ethmoid olfactory region and the posterior ventral respiratory region (based onrepresentative values from modeling of the anterior compartments).
220 FREDERICK ET AL.

sured value, 976 1%. To further assess the capabilities of themodel, the rates of ionization and metabolism were set to zeroand the appropriate mucus:air partition coefficients were sub-stituted to simulate the flow-dependent unidirectional uptake ofa wide variety of relatively poorly metabolized vapors (parti-tion coefficients and uptake data from Morriset al.,1993). Forthis exercise, the air phase and liquid phase diffusion coeffi-cients were not varied from the CFD/PBPK model’s base set ofparameters (Table 4; Appendix I). The CFD–PBPK modelreplicated the overall fractional nasal uptake of these vaporsvery well (Fig. 6) with performance very similar to the related16-compartment rat model for nonmetabolized vapors onwhich this model was based (Bushet al., 1998).
In addition, unidirectional simulations were conducted withthe acid model at a flow rate of 500 ml/min to estimate thesteady-state tissue concentration in the anterior olfactory epi-thelium lining the dorsal meatus of the rat nasal cavity over awide range of acrylic acid vapor concentrations (Fig. 7). Fromsimulations conducted at an inhaled acrylic acid concentrationof 75 ppm, the predictions of the CFD-PBPK model for theconcentration of acid in the dorsal medial olfactory epitheliumwere compared to the dose–response data from thein vitronasal explant study with acrylic acid. The model prediction of
10.7 mM acrylic acid concentration in the sustentacular celllayer of the olfactory epithelium in the dorsal meatus wascorrelated with the olfactory histopathology observedin vivo(Table 1; Fig. 4). Thein vivo histopathology is reasonablyconsistent with the cytotoxicity observed in thein vitro nasalexplant studies at 6 mM (Table 2; Fig. 5), which is within afactor of approximately two of the model prediction. Repeatingthe simulated exposure of a rat to 75 ppm acrylic acid underrepresentative cyclic breathing conditions (ventilation as de-scribed in Fig. 8) resulted in a somewhat lower predictedolfactory tissue concentration, 5.2 mM, which correlated moreclosely with the explant histopathology data.
Although cytotoxicity was observed in the rat ethmoid ol-factory region following the 75 ppm exposure, it was much lesssevere and extensive than that observed in the dorsal meatusregion. The unidirectional flow tissue dose prediction of themodel (3.0 mM in the ethmoid olfactory region) is consistentwith this observation given the transition in histopathologyobserved in the 1 to 3 mM dose rangein vitro (Table 2).Although there is inherent variability in comparing histopa-thology observedin vitro to that observedin vivo (based onmedium effects, differences in oxygenation, the highly local-ized pattern of the lesions observedin vivo, etc.), the acute
TABLE 5Results from CFD Simulations of the Deposition of Inhaled Acrylic Acid Vapor in a Model of the Human Nasal Cavity
under “Concentration Equals Zero” Boundary Conditions
Parameter and compartmenta
Simulation flow rate (ml/min)
11,400b 18,900b 18,900c
Regional flowd (also regional surface area in cm2 and lumen volume in cm3)Vestibule (32.4, 4.83) 1.0 1.0 1.0DM respiratory (10.1, 0.74) entering region5 0.079 0.084 0.084DM olfactory (13.2, 0.56) entering region5 0.060 0.069 0.069DM olfactory (13.2, 0.56) exiting region5 0.025 0.027 0.027Ethmoid olfactory NAe NA NAAnterior ventral respiratory (42.1, 3.50) 0.921 0.916 0.916Posterior ventral respiratory (72.3, 5.16) 0.940 0.931 0.931Nasopharynx (75.8, 18.32) 1.0 1.0 1.0
Regional gas phase mass transport coefficientsf
Vestibule 2.33 3.28 2.31DM respiratory 6.44 5.0 3.23DM olfactory 117.0 32.9 22.8Ethmoid olfactory NA NA NAAnterior ventral respiratory 3.78 6.25 2.64Posterior ventral respiratory 5.19 5.14 3.24Nasopharynx 2.14 2.61 1.59
a The regional nasal compartments are defined by epithelial types as described in Table 5. The surface areas and lumen volumes for each region are derivedfrom the FIDAP mesh. The human nasal cavity does not have an ethmoid olfactory region, consequently the human nasal computer model does not have thiscompartment.
b Simulation conducted with a gas phase diffusivity of 0.15 cm2/s.c Simulation conducted with a gas phase diffusivity of 0.1 cm2/s.d Fraction of total air flow entering each region of the nasal cavity (dimensionless). In the olfactory region, there was a significant loss of air flow between
the anterior and posterior faces of the region. This loss of air flow is accounted for in the posterior ventral respiratory region of the model.e NA, not applicable to this species.f Gas phase mass transport coefficient (cm/s).
221HYBRID CFD-PBPK NASAL DOSIMETRY MODEL

cytotoxic response of the sustentacular cells in both environ-ments suggests that this tissue–dose comparison may be usefulas a rough approximation for evaluating the predictions of theCFD–PBPK model. Given the “lumping” that is inherent inconstructing a compartmental dosimetry model and the fact
FIG. 6. Comparison of CFD–PBPK model predictions to the unidirectional rat nasal deposition data of Morriset al.(1993) for a variety of vapors at differingflow rates. The filled circles represent the predictions of the model based on the liquid:air partition coefficient of each vapor (Morriset al.,1993) and the listedair flow rate in ml/min. The liquid phase diffusion coefficients were not varied from the model base set of parameters (Appendix and Table 4), except that thevapor metabolism and ionization rates were set to zero. ace, acetone; xyl, xylene; iso, isoamyl alcohol; BRB, bromobenzene; AA, acrylic acid.
FIG. 7. The predicted relationships from the CFD–PBPK model betweenthe concentration of inhaled acrylic acid vapor and the tissue concentration ofacrylic acid and mucus pH in the most anterior dorsal region of the olfactorytissue in the nasal cavity of the rat (solid lines) and humans (dashed lines)under comparable steady-state unidirectional flow (twice the resting minutevolume for a 1-h simulation) for each species.
FIG. 8. Predicted concentrations from CFD–PBPK model simulations ofabsorbed acrylic acid vapor in the olfactory region of a rat and human undersimulated breathing conditions. The cyclic flow simulation was conducted fora reference resting rat and human exposed to 2 ppm acrylic acid for 3 min. Therespiration of an adult rat was simulated at a representative respiration rate of150 breaths/min (too fast to resolve individual breaths in this figure) and a tidalvolume of 1.7 ml/breath to give a minute volume of 250 ml/min (EPA, 1994).Similarly, an adult human was simulated with a respiration rate of 15 breaths/min and a tidal volume of 500 ml/breath (ICRP, 1975). The predicted con-centrations were for the mucus layer overlying the olfactory epithelium and theapical anterior layer of olfactory epithelium, which primarily consists ofacid-sensitive sustentacular cells.
222 FREDERICK ET AL.

that the model simulation did not include exposure-relatedchanges in breathing rate or physiology, it is not surprising thatthe unidirectional flow model predictions did not exactly cor-respond to the histopathology observed with the nasal epithe-lial explants in vitro. Notably, the model predictions in theabove comparisons were made without “fitting” parameters tothe datasets.
The dose–response curve for acrylic acid in olfactory tissuein the rat nasal cavity that was used for the nasal explant tissuedose comparison (Fig. 7) was also used for an interspeciestissue dose comparison. For this exercise, a dose response ofacrylic acid exposures was simulated for an adult resting malerat and an adult resting male human using the appropriateinspiratory flow rate (based on the minute volumes of eachspecies), nasal anatomy, and nasal air flow patterns from CFDsimulations. The resulting dose–response relationships of ol-factory tissue concentration relative to inhaled vapor concen-tration for each species were then compared (Fig. 7). In addi-tion, the change in mucus pH over the olfactory epithelium wasestimated as the buffer in the mucus was depleted to neutralizethe deposited acidic vapor. The output from these simulationsindicates that the olfactory epithelium in the dorsal meatusregion of the rat nasal cavity is exposed to two- to threefoldgreater concentrations of acid vapor than the human olfactoryepithelium under either unidirectional flow (Fig. 7) or cyclicflow (Fig. 8) conditions. The magnitude of this differencechanges somewhat based on the inhaled vapor concentration(e.g., threefold or greater at vapor concentrations less than 0.5ppm, and threefold decreasing to twofold over the 0.5 to 25ppm vapor concentration range for unidirectional flow; Fig. 7)and differences in the relative size and respiratory physiologyof the individuals that are simulated, but generally the olfactoryepithelium of humans is predicted to be exposed to signifi-cantly lower concentrations of inhaled acids than rat olfactoryepithelium. Additionally, the predicted pH of the mucus cov-ering the rat olfactory epithelium fell to slightly lower concen-trations than the predicted human mucus pH at occupationallyrelevant exposure concentrations (less than 10 ppm). The dropin mucus pH could be a factor contributing to the cytotoxicityobserved in the apical sustentacular cells, which lie immedi-ately under the mucus layer. Typically, the sustentacular cellshave been reported to be the cells that are most sensitive toacidic vapors (e.g., Milleret al., 1981).
To conduct an interspecies nasal tissue dose comparisonunder a realistic cyclic breathing exposure scenario, a simu-lated exposure was conducted at the American Conference ofGovernmental Hygienists (ACGIH) TLV value for acrylic acidof 2 ppm using the same base set of physiological parameters(Table 6). As described in Fig. 8, the rodent tissue concentra-tions tend to be significantly higher than human tissue concen-trations. An exception is the ventral posterior region of thehuman nasal cavity that is lined with respiratory epithelium.Comparison of the tissue dose values with the histopathologyobserved in thein vitro nasal explant experiments (Table 2)
suggests that no toxicity would be predicted in the sensitivehuman olfactory tissue at this exposure concentration (support-ive of the ACGIH recommendation). The highest tissue con-centrations (0.66 mM) are predicted to occur in the respiratoryepithelium lining the anterior region of the dorsal meatus(respiratory “patch” in Fig. 1), however, no toxicity was ob-served in respiratory epithelium in the explant studies withacrylic acid concentrations as high as 6 mM.
DISCUSSION
These experiments describe the acute effects of a represen-tative organic acid on the rodent nasal cavity. Interspeciesextrapolation of these results to humans was then conductedusing a hybrid CFD–PBPK computer model of the rat andhuman nasal cavity. The histopathological results of this acutestudy are consistent with the histopathological observationsfrom subchronic and chronic inhalation studies on a widevariety of organic acids and esters (e.g., Keenanet al., 1990;Trela and Bogdanffy, 1991; Milleret al., 1981, 1985; Rein-inghaus et al., 1991). Olfactory epithelium in the anteriorregion of the nasal cavity is preferentially targeted, althoughrespiratory epithelium is affected at high acid or ester concen-trations or with particularly strong acids. In the rat, a narrowstrip of olfactory epithelium protrudes anteriorly along thedorsal surface of the nasal cavity in the region described as thedorsal meatus. Immediately anterior to the sensitive olfactoryepithelium is a very small patch of respiratory tissue that isonly a few millimeters wide. This dorsal meatus region re-ceives 12 to 21% of the inhaled air (Kimbellet al., 1993 andthis study), and rodent inhalation studies with acids and esterstypically result in histopathological damage to this poorlyprotected olfactory epithelium. Increasing concentrations andlonger durations of vapor exposure typically result in a broaderposterior distribution of olfactory lesions into the ethmoidturbinates in the posterior region of the nasal cavity. The tissuedose distribution associated with this histopathological obser-vation is reproduced in the current inhalation model. At highconcentrations of inhaled vapor, the mucus layer in the anteriorpart of the nose becomes saturated with vapor. This decreasesthe driving force for deposition in the anterior portion of thenose, thereby allowing more vapor to reach the posterior re-gions of the nasal cavity. In this context, a “high” vaporconcentration is dependent on the combination of gas phaseand liquid phase characteristics of the vapor that result in asignificant accumulation of the vapor in the mucus, which caninhibit further deposition of the vapor.
The use of histopathology from short-term organ culturestudies to estimate tissue concentrationin vivo is only possiblewith compounds that induce readily observable cytotoxicityrelatively quickly. In this case, the sensitive sustentacular cellsprovide support for the olfactory neurons, and the histologicalchanges in the structure of the epithelium that are associatedwith cytotoxicity are rapidly apparent. Although thesein vitro
223HYBRID CFD-PBPK NASAL DOSIMETRY MODEL

and in vivo histopathology comparisons may be useful forsemiquantitative tissue dose estimates, there are intrinsic dif-ferences in the response of tissues culturedin vitro relative tothose exposedin vivo that may limit the accuracy of thismethod.
The histological structure of olfactory epithelium varies littlebetween mammalian species (e.g., Nakashimaet al., 1984,1991; Uraih and Maronpot, 1990; Talamoet al., 1995). Fur-thermore, the mode of action for cytotoxicity of inhaled shortchain organic acid vapors, mitochondrial toxicity, is assumedto be fundamentally the same across species (e.g., Sherrat,1985; Brass, 1994; Custodioet al., 1998). These factors sug-gest that the susceptibility of the tissue to inhaled irritants alsovaries relatively little between mammalian species. If this is thecase, the dominant factor influencing interspecies differencesin susceptibility to inhaled irritants is olfactory tissue dose.However, the potency of inhaled irritants as olfactory cytotoxi-cants clearly varies. Strong acids (e.g., formic acid) damagerespiratory and olfactory epithelium whereas weaker acids(e.g., acrylic acid) primarily damage the olfactory epithelium.
Risk assessments for these vapors may incorporate an estimateof potency from the NOAEL of a rodent inhalation study andmodel-derived interspecies tissue dose comparisons (using theappropriate compound-specific parameters) to assist in estab-lishing appropriate human exposure limits.
The available data linking a dosimeter with the cytotoxicityinduced by short chain organic acids such as acrylic acidsuggests that tissue concentration of the acid (in its primarilyionized form) is the most appropriate dose measure for inter-species extrapolation and risk assessment. Notably, the nasalepithelial explant studies in this study were conducted with theneutralized acid in the tissue culture medium, which equili-brated with the explants with a partition coefficient of approx-imately one. The most direct interpretation of this data is thatthe observed olfactory cytotoxicity was correlated with theconcentration of the neutralized acid in the medium and byimplication in the tissue. Similarly, the recent studies indicat-ing that neutralized acrylic acid induces the glutathione-inde-pendent mitochondrial permeability transition with isolated ratliver mitochondriain vitro (Custodioet al.,1998) suggest that
TABLE 6Anatomical, Physiological, and Metabolic Parameters for the Rat and Human Nasal PBPK Models
Parameter Value Source
Rat (adult male F344 under chronic exposure conditions)Minute volumea (ml/min) 250 (EPA, 1994)Body weight (g) 380 (EPA, 1994)Lung volumeb 0.004 (Delpet al., 1991)Liver volume 0.035 (Delpet al., 1991)Muscle and fat volume 0.40 (Delpet al., 1991)Other tissues 0.41 (Delpet al., 1991)Venous blood volume 0.06 (Delpet al., 1991)Arterial blood volume 0.03 (Delpet al., 1991)Blood flow to liverc 0.173 (Delpet al., 1991)Blood flow to muscle and fat 0.35 (Delpet al., 1991)Blood flow to other perfused tissues 0.466 (Delpet al., 1991)Blood flow to nasal cavity 0.01 (Stottet al., 1986)Blood flow to nasopharynx 0.001 Estimate
Human (adult male under chronic exposure conditions)Minute volume (ml/min) 7500 (ICRP, 1975)Body weight (g) 70000 (ICRP, 1975)Lung volume 0.014 (ICRP, 1975)Liver volume 0.026 (ICRP, 1975)Muscle and fat volume 0.60 (ICRP, 1975)Other tissues 0.20 (ICRP, 1975)Venous blood volume 0.046 (ICRP, 1975)Arterial blood volume 0.014 (ICRP, 1975)Blood flow to liver 0.25 (Williams and Leggett, 1989)Blood flow to muscle and fat 0.22 (Williams and Leggett, 1989)Blood flow to other perfused tissues 0.519 (Williams and Leggett, 1989)Blood flow to nasal cavity 0.01 EstimateBlood flow to nasopharynx 0.001 Estimate
a Unidirectional flow simulations with the nasal dosimetry model were conducted at twice the minute volume as an approximation of the plateau peakinspiratory flow rate. Minute volumes for each species are for resting ventilation.
b Tissue volumes are expressed as a fraction of body weight.c Blood flow is expressed as a fraction of cardiac output. Cardiac output is 14,000 ml/h allometrically scaled to body weight in kg to the 0.74 power.
224 FREDERICK ET AL.

the steady-state concentration of the neutralized acid in themitochondrial environment is the appropriate dosimeter.
An explicit advantage of the CFD–PBPK dosimetry model isthat it facilitates description of the dynamic relationship be-tween tissue concentration and metabolism (and/or tissue re-activity) with the concentration of the vapor in the air stream.Cyclic air flow (inhalation and exhalation) can also be modeled(e.g., Fig. 8) to evaluate factors such as desorption from mucusduring exhalation (Gerde and Dahl, 1991) and to provide anestimate of net uptake under simulated breathing conditions.Comparison of cyclic flow modeling exercises to unidirectionalflow exercises at the same concentration of acrylic acid vaporsuggest a lower steady-state concentration of the vapor in thenasal epithelium under cyclic flow conditions. This is presum-ably due to the partial clearing of the vapor from the epitheliumby diffusion into the blood and by desorption during exhala-tion. Inclusion of a “body” in the CFD–PBPK model (e.g., adescription of systemic circulation, distribution to peripheralcompartments, and metabolism) provides dynamically chang-ing boundary conditions for the nasal cavity during simulationsas the arterial blood concentration changes as a function ofexposure time.
A technical aspect of the description of mass transport of thevapor at the air:mucus interface in the CFD–PBPK model bearssome elaboration. As described more fully in the Appendix, theterm “mass transport coefficient” has multiple definitions de-pending on the context in which it is used. A unique aspect ofthe CFD–PBPK model used for this study is the definition of a“compartmental mass transport coefficient” (Appendix). Thedefinition and use of this value is consistent with principlesdescribed in a recent text on this subject (Cussler, 1997), andthis term has distinct theoretical and practical advantages forlinking CFD data with compartmental PBPK models. Specif-ically, it facilitates the translation of CFD data into a formcommonly used in pharmacokinetics (a compartmental clear-ance value), and it allows the straightforward use of well-mixed compartment descriptions for both the air phase andliquid phase compartments. An alternative definition for themass transport coefficient (a “distributed mass transport coef-ficient” based on local concentration differences linked to localmass transport coefficients) is commonly associated with CFDsimulations, but its direct use in a compartmental PBPK modelis problematic based on theoretical and practical differences inthe definition and use of an “average concentration” in the airphase of a CFD study relative to the well-mixed compartmentalassumptions that are commonly used for the liquid phase ofPBPK models. This inconsistency is not readily apparent invarious formulations of rodent CFD–PBPK models. This isbecause the most readily available experimental data, frac-tional deposition of inhaled vapors in the overall the rat nasalcavity, are relatively insensitive to significant variation in therodent gas phase mass transport coefficients (Bushet al.,1998). In fact, as an approximation, Bushet al. (1998) wereable to successfully use distributed mass transfer coefficients
with concentrations calculated for well-mixed air compart-ments to describe whole-nose deposition of a variety of vaporsin the rat nasal cavity. However, the calculated deposition ofinhaled vapors in the human nasal cavity is much more sensi-tive than the rat to variation in the value of the gas phase masstransport coefficients. Therefore, a more accurate mathematicaldescription of the compartmental vapor phase concentrationgradient with the accompanying assumptions used for thedefinition and calculation of the corresponding mass transportcoefficient was required. An expedient test of the accuracy ofthe concentration/mass transport coefficient descriptions is thereplication of the CFD simulation uptake results (whole nose)with the hybrid CFD–PBPK model. To do this, a very fast rateof vapor decomposition in the mucus and/or a very highmucus:air partition coefficient may be defined in the CFD–PBPK model to simulate the “C5 0” boundary conditionsused in the CFD simulations. Under these conditions, thehybrid CFD–PBPK described in this study exactly replicatedthe CFD simulation results. Therefore, the use of compartmen-tal mass transport coefficients and well-mixed air compart-ments in the CFD–PBPK model appears to be sufficientlyaccurate in both species to be useful for interspecies extrapo-lation.
Satisfactory performance of the model relative to relevantexperimental data, as well as design criteria that we havepreviously listed (Fredericket al., 1994), suggests that theCFD–PBPK model structure is robust relative to a variety ofbiological endpoints. In addition, satisfactory performance inthe prediction of whole nose uptake of a wide range of poorlymetabolized vapors suggests that the basic model structure mayhave wide applicability. Furthermore, coupling of the nasaldosimetry model with a compartmental PBPK model of thebody allows facile dosimetry for all three classes of inhaledvapors that are currently described in the RfC guidelines of theEPA (Environmental Protection Agency, 1994). The CFD–PBPK model may be extended to include a more extensivedescription of the conducting airways, to model other speciesby incorporating additional CFD analyses, and to incorporateinterindividual variability in nasal anatomy and air flow pat-terns.
In summary, a useful CFD–PBPK inhalation model has beenprepared for interspecies extrapolation of tissue dose in theolfactory region of the nasal cavity. The model output isconsistent with whole-nose fractional deposition data foracrylic acid and a wide range of poorly metabolized vapors inrodents. In addition, the model predicts olfactory tissue con-centrations for acrylic acid that correlate with acute histopatho-logical lesions observedin vivo and with those observedinvitro with nasal explants. The model was used to evaluate anacrylic acid vapor exposure concentration that is used as anoccupational exposure limit, and the results of the exercisewere supportive of the professional judgment used to establishthe exposure limit. Generally, the model predicts that undersimilar exposure conditions (e.g., equal external vapor concen-
225HYBRID CFD-PBPK NASAL DOSIMETRY MODEL

tration and equivalent physical activity conditions) human ol-factory epithelium is exposed to lower concentrations of in-haled organic acid vapors than rodent olfactory epithelium.
APPENDIX
The general CFD–PBPK model structure is based upon anelaboration of a nasal model proposed by Morriset al. (1993)to include systemic compartments with a description of perfu-sion in each tissue (Fredericket al.,1992, 1994). However, themost unique aspect of the current model is its dynamic descrip-tion of vapor equilibration at the air:mucus interface as de-scribed in more detail in a companion manuscript on the nasaldeposition of poorly metabolized vapors (Bushet al., 1998).Notably, the hybrid CFD–PBPK model incorporates a uniquecompartmental description of both the air phases and underly-ing tissue phases in the nasal cavity as well as the data fromCFD simulations of air flow in the nasal cavity of rats andhumans (Kimbellet al., 1993, 1997; Subramaniam, 1998).Although the tissue phase of the model may be easily tailoredto describe the nasal deposition of a wide variety of inhaledvapors as described in Fig. 6 (e.g., by incorporating eachvapor’s unique tissue:air and tissue:blood partition coefficients,tissue-phase metabolism, diffusivity, and reactivity), the pri-mary focus of this study is the development of a model tailoredto simulate the ionization and metabolism of inhaled organicacids.
Description of Gas Phase Mass Transport
Although descriptions of mass transport of vapors across anair:liquid interface date back over 70 years, the description ofmass transport of an inhaled vapor across the air:mucus inter-face used for this study relies heavily upon the methods ofestimation described by Lymanet al. (1990). The generaltheory associated with interfacial mass transport has beenextensively discussed and applied by Cussler (1997). Thisapproach follows the two-film concept for estimating the fluxof volatiles across an air:liquid interface.
N 5 Kg ~Cg 2 C1/P! , (1)
where
N 5 flux (mmol/[cm2 3 h])Kg 5 overall mass transfer coefficient (cm/h)Cg 5 concentration in gas phase (mmol/cm3)P 5 the liquid:air partition coefficient (dimensionless) andCl 5 concentration in liquid phase (mmol/cm3).
Cussler (1997) notes that this commonly used equation isbasically derived from empirical arguments like those used toderive Fick’s law and that the equation conceals a variety ofapproximations and ambiguities. The most critical problem
contributing to this ambiguity is the lack of adequate defini-tions for the concentrations that determine the concentrationgradient. Is it a “local mass transport coefficient” based on“local concentration” differences, or is it an “average masstransport coefficient” based on a difference in “average con-centrations” in two compartments or phases? If “average con-centrations” are used, how is the “average” defined for eachphase? These questions are addressed below for the specificcase of the CFD–PBPK model, but it is important to note thata different approach may be more appropriate in other con-texts.
The overall mass transport coefficient from the air phase,Kg,into the liquid phase in Equation 1 may be further defined by:
1/Kg 5 1/kg 1 1/~Pk1! , (2)
where
kg 5 gas phase mass transfer coefficient (cm/s) andkl 5 liquid phase mass transfer coefficient (cm/s).
Cussler (1997) notes that the gas phase mass transfer coef-ficient (kg, a component ofKg in Equation 2 above) hasmultiple definitions with correspondingly different units, andhe lists four different commonly used definitions. Clearly, theuse of the term “mass transport coefficient” without adequatecontextual definition contributes to confusion. The followingtext will derive and define the “compartmental mass transportcoefficient” used in this study (i.e., an “average mass transfercoefficient” based on a difference in “average compartmentalconcentrations”). The use of this form of mass transport coef-ficient was required by the common use of “well-mixed com-partments” in the compartmental modeling of PBPK models,and the need to appropriately express the results of the CFDsimulations so that the “average air compartment concentra-tion” derived from the CFD exercise would be defined in thesame way as the “average tissue compartment concentration”in the PBPK model. If these “average concentrations” are notcommonly defined, an error of variable magnitude that isdependent on airway geometry and the extent of fractionaluptake of the vapor will be introduced into the CFD–PBPKmodel.
By multiplying both sides of Equation 1 by the surface areaof the air:liquid interface for a defined compartment, the netmass transport across the interface can be expressed as
QScN 5 ScKg~Cg 2 C1/P! , (3)
where
Qv 5 net rate of mass transport across an air:liquid interface(mmol/h) and
226 FREDERICK ET AL.

Sc 5 surface area of the compartmental air:liquid interface(cm2).
The air phase mass transport coefficient,kg, can be estimatedby CFD simulations at several representative inhalation flowrates for the differing nasal lumen geometries of various spe-cies using defined boundary conditions for the nasal cavity(e.g., by defining a very large value forP to effectively estab-lish a “Cl 5 0” boundary condition for the simulation such thatkg ' Kg in Equation 2).
For gas phase compartments in the nasal cavity (Fig. 2B), acompartmentalkg, designatedkgc, can be calculated from theCFD simulation results by the following method. Assumingthat the compartment is well mixed (i.e., the concentration ofthe vapor in the gas phase that exits the compartment is theuniform equilibrated concentration in the compartment, i.e.,Cg
5 Cout), the steady-state mass balance for vapor phase depo-sition in a compartment in the nasal cavity may be expressed as
OCinQin 5 OCoutQout 1 ScKgc ~Cout 2 C1/P! , (4)
where
Qin 5 flow rate of air entering the nasal compartment (cm3/h)Qout 5 flow rate of air exiting the nasal compartment (cm3/h)Cin 5 concentration of vapor in the air entering the nasal
compartment (mmol/cm3)Cout 5 concentration of vapor in air exiting the nasal compart-
ment (mmol/cm3); this concentration is assumed to bewell equilibrated with the steady-state processes of thenasal cavity (including nasal epithelial uptake) and isassumed to be the uniform concentration in the com-partment based on the well-mixed compartment model
Cl 5 concentration in liquid phase (mmol/cm3)Sc 5 epithelial surface area of the nasal compartment (cm2)
andKgc 5 compartmental mass transfer coefficient (cm/h).
By conducting CFD simulations with a “Cl 5 0” boundarycondition for the compartment (effectively assuming thatP isvery large and thereforeKgc > kgc according to the relationshipthat definesKg) and assuming negligible change in air flowacross the compartment (i.e.,Qin 5 Qout 5 Q), the equationsimplifies to
CinQ 5 CoutQ 1 ScKgcCout 5 CoutQ 1 SckgcCout (5)
This allows calculation of a compartmentalkgc from the datafor the compartmental clearance of the vapor from the gasphase by recognizing thatCg 5 Cout for a well-mixed com-partment;
Cout/Cin 5Q
Q 1 ~Sckgc!, (6)
whereCout/Cin 5 the fractional penetration (Fpet) or the dimen-sionless fraction of the vapor that penetrates through a nasalcompartment and enters the next compartment. Note that ifeitherkgc or Sc is very large, the denominator becomes large,and the right-hand side of the equation approaches zero frac-tional penetration.
Solving forkgc after substitutingFpet for Cout/Cin results in:
kgc 5Q~1 2 Fpet!
FpetSc. (7)
Data from CFD simulations at various flow rates for eachspecies can be used to calculatekgc, since the regionalQ, Sc,andFpet can be evaluated for any defined compartment of thenasal mesh as long as a “Cl 5 0” boundary condition is used.
Although this derivation utilizes common mass transport andfluid dynamics terminology, the underlying theory is verysimilar to common pharmacokinetic principles that use thehepatic extraction ratio to calculate hepatic clearance (e.g.,Gibaldi, 1991; Shargel and Yu, 1993), andKgc may be con-sidered to be analogous to a tissue clearance term used incompartmental pharmacokinetic studies.
An overall mass transfer coefficient from the gas phase,Kgc,can now be estimated that combines a compartmental mucusphase mass transport coefficientkmc (analogous to the liquidphase mass transport coefficientkl in the definition ofKg) withthe gas phase mass transport coefficientkgc that was calculatedabove from CFD simulations that used aC 5 0 boundarycondition (c.f. Hannaet al.,1989; Lymanet al.,1990; Cussler,1997) as follows:
1/Kgc 5 1/kgc 1 1/~Pkmc! , (8)
where
Kgc 5 overall compartmental mass transport coefficient fromthe air phase (cm/s)
kgc 5 compartmental gas phase mass transfer coefficient(cm/s)
kmc 5 compartmental mucus phase mass transfer coefficient(cm/s) and
P 5 the liquid:air partition coefficient (dimensionless).
The mucus phase mass transport coefficient,kmc, was for-mulated as described by Bushet al. (1998) to describe trans-port to the midpoint of the mucus layer:
kmc 5 Dmuc/~lmuc/2! , (9)
227HYBRID CFD-PBPK NASAL DOSIMETRY MODEL

where
Dmuc 5 diffusivity of the compound (primarily the ionizedacid) in the mucus phase (cm2/h) and
lmuc 5 thickness of the mucus phase diffusion layer (cm).
Applying these principles to the regional nasal uptake of thevapor of an organic acid, the following rate equations may beconstructed.
Air phase.
VairdCair/dt 5 Q~Cair2in 2 Cair! 2 Kgc Sc~Cair
2 @X@nonionized#Cmuc/Pmuc:air#! , (10)
where
Cair
5 concentration of the nonionized vapor exitingthe air compartment under standard well-mixedcompartment assumptions (i.e.Cair 5 Cair2out)(mmol/cm3)
Cair2in 5 concentration of the nonionized vapor enteringthe air compartment (mmol/cm3)
Cmuc 5 total concentration of vapor in both the ionizedand nonionized forms in the mucus layer(mmol/cm3)
X[nonionized]5 fraction of vapor present in nonionized form(dimensionless)
Pmuc:air 5 mucus:air partition coefficient of the nonion-ized acid (dimensionless) and
Vair 5 volume of air compartment (cm3).
In some cases, the CFD simulations may indicate “leakage”of air streams between adjacent air phase compartments in thenasal cavity. In those cases, the vapor is modeled as being fullyequilibrated in the upstream compartment of the CFD–PBPKmodel prior to transferring a fraction of the air stream to theadjacent compartment.
Mucus phase. As discussed in Appendix B of Bushet al.(1998), carboxylic acids are predominately ionized in viabletissues, which must maintain a pH near neutrality, and theeffective diffusion rate is approximately that of the ion. Thefollowing description of the fate of absorbed vapors differsfrom that described by Bushet al. (1998) by estimating thefraction of nonionized acid in the mucus layer that is availablefor desorption as a function of the concentration of mucusbuffer. Assuming approximately equal diffusion coefficients inthe mucus and epithelium,
VmucdCmuc/dt 5 KgcSc ~Cair 2 ~X@nonionized#Cmuc/Pmuc:air!!
2 Dmuc/lmuc2epiSc~@~1 2 X@nonionized#/Pmuc:air!Cmuc# 2 Cepi1! ,
(11)
where
Cepi1 5 total concentration of vapor in the epithelial layerunderlying the mucus (mmol/cm3)
Pepi:muc 5 epithelial:mucus partition coefficient (dimension-less) and
lmuc-epi 5 length of the diffusion path from the midpoint ofmucus layer to the midpoint of the underlying ep-ithelial layer (cm).
Ionized acids are not volatile, therefore the concentration ofan acidic vapor that is available for desorption back into the aircompartment is limited to the concentration of nonionized acidin the mucus. The concentration of nonionized acid is depen-dent on the pKa of the acid and the mucus pH. Changes in theambient mucus pH are limited by the mucus buffer which hasa finite buffering capacity (Holma, 1985). Equations 12A to12D estimate the fraction of nonionized acid in the mucuslayer, mucus pH, and the depletable mucus buffer capacity, asa function of the concentration of the vapor in the mucus. Adecrease in mucus pH of approximately two units from theambient pH is assumed to present a cytotoxic environment forthe underlying epithelial cells (a nonlimiting assumption).
X@nonionized# 5 1/~1 1 10~pH2pKa!! (12A)
pH 5 ~pHi 2 pHdep! 1 ~1.02 Bd! pHdep (12B)
Bd 5 ~CBi 2 CBmuc!/CBi (12C)
VmucdCBmuc/dt 5 Vmuc~Kmuc2syn 2 Kmuc2toCBmuc
2 KbCBmucCmuc! , (12D)
where
pH 5 mucus pHpKa 5 acid dissociation constant for an acidic vaporpHi 5 initial or ambient mucus pH
pHdep 5 estimated maximum number of mucus pH unitsthat can be depleted without significant epithelialcytotoxicity
CBi 5 initial concentration of depletable mucus bufferconsistent with cellular viability (mmol/cm3).
CBmuc 5 concentration of depletable mucus buffer within arange consistent with cellular viability (mmol/cm3).
Bd 5 fraction of the depletable mucus buffer capacitythat has been depleted
Vmuc 5 volume of mucus underlying an air compartment(cm3)
Kmuc2syn 5 zero-order rate of buffer synthesis (mmol/ml/h21)Kmuc2to 5 ambient rate of buffer turnover (per h) and
Kb 5 estimated second-order rate of reaction of anacidic vapor with mucus buffer (ml/h/mmol21).
228 FREDERICK ET AL.

Epithelial phases. The description of diffusion of the va-por in the epithelial phases differs from that described by Bushet al. (1998) by incorporating epithelial metabolism and for-mally describing the migrating species as the ionized acid. ForFick’s Law diffusion between adjacent tissue compartmentswith a partition coefficient approximately equal to unity be-tween compartments results in:
Vi dCi /dt 5 Depi/l i–i21Sc~Ci–i21 2 Ci! 2 Depi/l i–i11Sc
~Ci 2 Ci–i11! 2 ViKmetCi , (13)
where
Vi 5 volume of the ith tissue compartment(cm3)
Ci, Ci–i21, Ci–i11 5 vapor concentrations in theith tissuecompartment and the compartmentsabove and below it (mmol/cm3)
Depi 5 diffusivity of the compound in the epithe-lial phase (cm2/h)
li–i21, li–i11 5 lengths of the diffusion paths betweenmidpoints of epithelial layers (cm) and
Kmet 5 first order rate of metabolism (h21).
Blood exchange region.Assuming approximately equaldiffusion coefficients in the epithelial layer adjacent to theblood exchange region and in the blood exchange region and apartition coefficient between these regions of approximatelyone,
VeqdCex/dt 5 Depi/l epi2exSc~Cepi 2 Cex! 1 Qblood~Cart 2 Cex! ,
(14)
where
Vex 5 volume of tissue compartment in blood exchangeregion (cm3)
Cepi 5 concentration in the tissue compartment above theblood exchange region (mmol/cm3)
Cex 5 concentration in the blood exchange region (mmol/cm3)
Cart 5 concentration in the arterial blood entering the bloodexchange region (mmol/cm3) and
lepi2ex5 length of the diffusion path from midpoint of epithe-lial layer adjacent to the blood exchange region to themidpoint of the blood exchange region (cm).
The species-specific parameters used in the model are listedin Table 6 for rats and humans along with the source ofinformation for each parameter. Standard PBPK methods areused for scaling cardiac output to body weight, equilibration ofblood with tissues, etc. (e.g., Fredericket al., 1993). In addi-
tion, compound- and organ-specific common parameters forboth models are listed below with their source.
Diffusivity of acrylic acid (ionized and nonionized) in mu-cus (Dmuc) and epithelium (Dolf or Dres) was defined as 0.01cm2/h as an adjustable parameter from a plausible range of0.005 to 0.02 cm2/h based on the following considerations. Alower limit value of 0.005 cm2/h was calculated for the diffu-sion coefficient of acrylic acid in water (Bushet al., 1998)corrected for the increased bulk viscosity of mucus and tissuerelative to water. A value of approximately 0.015 cm2/h wasmeasured experimentally for similar sized charged ions andneutral molecules by Kushmerick and Podolsky (1969) inmuscle fibers. Generally, experimentally determined diffusioncoefficients of similarly sized molecules in tissue are approx-imately 0.3 to 0.5 the values determined in water (Kushmerickand Podolsky, 1969; Georgeet al.,1996). The experimentallydetermined diffusion coefficient of the closely related com-pound, propionic acid, in water is 0.038 cm2/h (Cussler, 1997,p. 112), therefore the predicted value in tissue would be in the0.01 to 0.02 cm2/h range. Final selection of 0.01 from theplausible range was based on fitting the predictions of themodel for whole-nose uptake to the unidirectional uptake datefor a slowly metabolized vapor with approximately the samemolecular weight as acrylic acid (acetone at a flow rate of 100ml/min; Fig. 6). Interestingly, this value gave a good fit to themodel predictions to the whole-nose uptake of a wide varietyof slowly metabolized vapors that span a wide molecularweight range (Fig. 6). As noted by Bushet al. (1998) thehybrid CFD–PBPK model predictions of overall uptake ofinhaled vapors in the rat nasal cavity are sensitive to variationsin the value ofDmuc.
Diffusivity of acrylic acid in squamous epithelium of thenasal vestibule equals 0.001 cm2/h based upon estimates of thediffusivity of small organic molecules across dermal tissue(Environmental Protection Agency, 1992).
Thickness of mucus layer is 10mm in all regions (Morganetal., 1984 and personal communication), except that the mucuscovering the human olfactory epithelium is 20-mm thick (Lang,1989, p. 119).
Based upon photomicrographs of rat nasal tissues and amicrometer, the approximate thicknesses of the epithelial lay-ers are as follows: respiratory and squamous epithelia5 25mm, the blood exchange regions under the respiratory andsquamous epithelia5 75 mm, the olfactory epithelium5 80mm, and the blood exchange region under the olfactory epi-thelium 5 50 mm.
Partition coefficients for acrylic acid between compartmentswere as follows:
Lung:blood5 1.4 (Black and Finch, 1995)Liver:blood 5 1.7 (Black and Finch, 1995)
Muscle/Fat:blood5 1.2 (Black and Finch, 1995)Other perfused:
blood 5 1.4 (Black and Finch, 1995)
229HYBRID CFD-PBPK NASAL DOSIMETRY MODEL

Nasalepithelium:blood5 1.4 (Assumed to be similar to lung:blood)
Blood:air 5 6100 (Table 3 [pH 2.0 to suppress ion-ization])
Mucus:air5 1780 (Table 3 [similar to saline at pH2.0 to suppress ionization of the weakacid])
Nasalepithelium:mucus5 1.0 (Based on micropartitioning stud-
ies of Black and Finch [1995]; as-sumed to primarily reflect partitioningof the ionized acid)
Ambient mucus pH5 6.6 (Bodenet al.,1983) with a buffercapacity such that 6mmol of acid will deplete 1 ml of mucus1 pH unit (Holma, 1985). A mucus pH of less than 4.6 isassumed to cause epithelial cytotoxicity. Rate of mucus secre-tion 5 0.21 ml/h/cm2 (Hatch, 1992). pKa of acrylic acid54.25. Estimated second order rate of reaction of an acidic vaporwith mucus buffer5 300 ml/h/mmol.
Pseudo first-order rate of metabolism of acrylic acid inliver 5 4.2 h21 and all other tissues5 0.7 h21 (Black andFinch, 1995).
ACKNOWLEDGMENTS
Technical support for these studies by Mr. John Udinsky is gratefullyacknowledged. Dr. Melvin Andersen (ICF Kaiser) provided thoughtful com-parisons between the nasal deposition of vapors from inhaled air and thepharmacokinetic clearance of compounds from the systemic circulation bytissues. Dr. Peter W. Scherer and his students (University of Pennsylvania)provided valuable technical insight in modeling air flow in the human nasalcavity. These studies were supported by the Basic Acrylic Monomer Manu-facturers and Rohm and Haas Company.
REFERENCES
Black, K. A., and Finch, L. (1995). Acrylic acid oxidation and tissue-to-bloodpartition coefficients in rat tissues.Toxicol. Lett.78, 73–78.
Bodem, C. R., Lampton, L. M., Miller, P., Tarka, E. F., and Everett, E. D.(1983). Endobronchial pH.Am. Rev. Respir. Dis.127,39–41.
Brass, E. P. (1994). Overview of coenzyme A metabolism and its role incellular toxicity.Chem.–Biol. Interact.90, 203–214.
Bush, M. L., Frederick, C. B., Kimbell, J. S., and Ultman, J. S. (1998). ACFD–PBPK hybrid model for simulating gas and vapor uptake in the ratnose.Toxicol. Appl. Pharmacol.150,133–145.
Cussler, E. L. (1997).Diffusion: Mass Transfer in Fluid Systems,2nd ed., pp.101–244. Cambridge University Press, Cambridge.
Custodio, J. B. A., Palmeira, C. M., Moreno, A. J., and Wallace, K. B. (1998).Acrylic acid induces the glutathione-independent mitochondrial permeabil-ity transition in vitro.Toxicol. Sci.43, 19–27.
Delp, M. D., Manning, R. O., Bruckner, J. V., and Armstrong, R. B. (1991).Distribution of cardiac output during diurnal changes of activity in rats.Am. J. Physiol.261,H1487–H1493.
DeSesso, J. M. (1993). The relevance to humans of animal models for inha-lation studies of cancer in the nose and upper airways.Quality Assurance:Good Practice, Regulation, and Law2, 213–231.
Dorato, M. A., Carlson, K. H., and Copple, D. L. (1983). Pulmonary mechan-ics in conscious Fischer 344 rats: Multiple evaluations using nonsurgicaltechniques.Toxicol. Appl. Pharmacol.68, 344–353.
Environmental Protection Agency (1992).Dermal Exposure Assessment: Prin-ciples and Applications,pp. 4.10, 5.34. EPA/600/8-91/011B, Office ofResearch and Development, Washington, D.C.
Environmental Protection Agency (1994).Methods for Derivation of Inhala-tion Reference Concentrations and Application of Inhalation Dosimetry,pp.4.28–4.29. EPA/600/8-90/066F, Office of Research and Development,Washington, D.C.
Frederick, C. B., Morris, J. B., Kimbell, J. S., Morgan, K. T., and Scherer, P. T.(1994). Comparison of four biologically based dosimetry models for thedeposition of rapidly metabolized vapors in the rodent nasal cavity.Inhal.Toxicol.6(Suppl.), 135–157.
Frederick, C. B., Potter, D. W., Chang-Mateu, M. I., and Andersen, M. E.(1992). A physiologically based pharmacokinetic and pharmacodynamicmodel to describe oral dosing of rats with ethyl acrylate and its implicationsfor risk assessment.Toxicol. Appl. Pharmacol.114,246–260.
Gargas, M. L., Burgess, R. J., Voisard, D. E., Cason, G. H., and Andersen,M. E. (1989). Partition coefficients of low molecular weight volatilechemicals in various liquids and tissues.Toxicol. Appl. Pharmacol.98,87–99.
Gerde, P., and Dahl, A. R. (1991). A model for the uptake of inhaled vaporsin the nose of the dog during cyclic breathing.Toxicol. Appl. Pharmacol.109,276–288.
George, S. C., Babb, A. L., Deffebach, M. E., and Hlastala, M. P. (1996).Diffusion of nonelectrolytes in the canine trachea: Effect of tight junction.J. Appl. Physiol.80, 1687–1695.
Godo, M. N., Morgan, K. T., Richardson, R. B., and Kimbell, J. S. (1995).Reconstruction of complex passageways for simulations of transport phe-nomena: Development of graphical user interface for biological applica-tions.Comp. Meth. Prog. Biomed.47, 97–112.
Gross, E. A., and Morgan, K. T. (1992). Architecture of nasal passages andlarynx. In Comprehensive Treatise on Pulmonary Toxicology.Volume I.Comparative Biology of the Normal Lung(R. A. Parent, Ed.), pp. 7–25.CRC Press, Boca Raton, FL.
Gross, E. A., Swenberg, J. A., Fields, S., and Popp, J. A. (1982). Comparativemorphometry of the nasal cavity in rats and mice.J. Anat.135,83–88.
Hahn, I., Scherer, P. W., and Mozell, M. M. (1993). Velocity profiles measuredfor air flow through a large-scale model of the human nasal cavity.J. Appl.Physiol.75, 2273–2287.
Hanna, L. M., Frank, R., and Scherer, P. W. (1989). Absorption of solublegases and vapors in the respiratory system. InRespiratory Physiology(H. K.Chang and M. Paiva, Eds.), pp. 277–316. Marcel-Dekker, New York.
Hatch, G. E. (1992). Comparative biochemistry of airway lining fluid. InComparative Biology of the Normal Lung(R. A. Parent, Ed.), pp. 617–632.CRC Press, Boca Raton, FL.
Holma, B. (1985). Influence of buffer capacity and pH-dependent rheologicalproperties of respiratory mucus on health effects due to acidic pollution.Sci.Total Environ.41, 101–123.
International Commission of Radiological Protection (ICRP) (1975). No. 23:Report of the Task Group on Reference Man,pp. 235–237, 346. PergamonPress, New York.
Keenan, C. M., Kelly, D. P., and Bogdanffy, M. S. (1990). Degeneration andrecovery of rat olfactory epithelium following inhalation of dibasic esters.Fundam. Appl. Toxicol.15, 381–393.
Keyhani, K., Scherer, P. W., and Mozell, M. M. (1995). Numerical simulationof airflow in the human nasal cavity.J. Biomed. Engr.117,429–442.
Kimbell, J. S., Gross, E. A., Joyner, D. R., Godo, M. N., and Morgan, K. T.(1993). Application of computational fluid dynamics to regional dosimetry
230 FREDERICK ET AL.

of inhaled chemicals in the upper respiratory tract of the rat.Toxicol. Appl.Pharmacol.121,253–263.
Kimbell, J. S., Gross, E. A., Richardson, R. B., Conolly, R. B., and Morgan,K. T. (1997). Correlation of regional formaldehyde flux predictions with thedistribution of formaldehyde-induced squamous metaplasia in F344 rat nasalpassages.Mutat. Res.380,143–154.
Kushmerick, M. J., and Podolsky, R. J. (1969). Ionic mobility in muscle cells.Science (Washington, D.C.)166,1297–1298.
Lang, J. (1989).Clinical Anatomy of the Nose, Nasal Cavity, and ParanasalSinuses.pp. 42–45, 112–119. Thieme, Stuttgart.
Lee, K.-P., Valentine, R., and Bogdanffy, M. S. (1992). Nasal lesion devel-opment and reversibility in rats exposed to aerosols of dibasic esters.Toxicol. Pathol.20, 376–393.
Lomax, L. G., Brown, D. W., and Frederick, C. B. (1994). Regional histopa-thology of the mouse nasal cavity following two weeks of exposure toacrylic acid for either 6 or 22 hours per day.Inhal. Toxicol. 6(Suppl.),445–449.
Lyman, W. J., Reehl, W. F., and Rosenblatt, D. H. (1990).Handbook ofChemical Property Estimation Methods: Environmental Behavior of Or-ganic Compounds.pp. 15.9–15.32. American Chemical Society, Washing-ton, D.C.
Mery, S., Gross, E. A., Joyner, D. R., Godo, M., and Morgan, K. T. (1994).Nasal diagrams: A tool for recording the distribution of nasal lesions in ratsand mice.Toxicol. Pathol.22, 353–372.
Miller, F. J., Overton, J. H., Kimbell, J. S., and Russell, M. L. (1993). Regionalrespiratory tract absorption of inhaled reactive gases. InToxicology of theLung,2nd. ed. (D. E. Gardner, J. D. Crapo, and R. O. McClellan, Eds.), pp.485–525. Raven Press, New York.
Miller, R. R., Ayres, J. A., Jersey, G. C., and McKenna, M. J. (1981).Inhalation toxicity of acrylic acid.Fundam. Appl. Toxicol.1, 271–277.
Miller, R. R., Letts, R. L., Potts, W. J., and McKenna, M. J. (1980). Improvedmethodology for generating controlled test atmospheres.Am. Ind. Hyg.Assoc. J.41, 271–277.
Miller, R. R., Young, J. T., Kociba, R. J., Keyes, D. G., Bodner, K. M.,Calhoun, L.L., and Ayres, J. A. (1985). Chronic toxicity and oncogenicitybioassay of inhaled ethyl acrylate in Fischer 344 rats and B6C3F1 mice.Drug Chem. Toxicol.8, 1–42.
Morgan, K. T., Jiang, X.-Z., Patterson, D. L., and Gross, E. A. (1984). Thenasal mucociliary apparatus.Am. Rev. Respir. Dis.130,275–281.
Morgan, K. T., Kimbell, J. S., Monticello, T. M., Patra, A. L., and Fleishman,A. (1991). Studies of inspiratory airflow patterns in the nasal passages of theF344 rat and rhesus monkey using nasal molds: Relevance to formaldehydetoxicity. Toxicol. Appl. Pharmacol.110,223–240.
Morgan, K. T., and Monticello, T. M. (1990). Airflow, gas deposition, andlesion distribution in the nasal passages.Environ. Health Perspect.85,209–218.
Morris, J. B. (1991). Deposition of acetone vapor in the upper respiratory tractof the B6C3F1 mouse.Toxicol. Lett.56, 187–196.
Morris, J. B., and Frederick, C. B. (1994). Upper respiratory tract uptake ofacrylate ester and acid vapors.Inhal. Toxicol.7, 557–574.
Morris, J. B., Hassett, D. N., and Blanchard, K. T. (1993). A physiologicallybased pharmacokinetic model for nasal uptake and metabolism of nonreac-tive vapors.Toxicol. Appl. Pharmacol.123,120–129.
Morris, J. B., and Smith, F. A. (1982). Regional deposition and absorption ofinhaled hydrogen fluoride in the rat.Toxicol. Appl. Pharmacol.62, 81–89.
Nakashima, T., Kimmelman, C. P., and Snow, J. B. (1984). Structure of humanfetal and adult olfactory neuroepithelium.Arch. Otolaryngol.110,641–646.
Nakashima, T., Tanaka, M., Inamitsu, M., and Uemura, T. (1991). Immuno-histopathology of variations of human olfactory mucosa.Eur. Arch. Oto-Rhino-Laryngol.248,370–375.
National Toxicology Program (1992). NTP technical report on toxicity studiesof formic acid administered by inhalation for F344/N rats and B6C3F1 mice.NIH Publication 92-3342.
Reininghaus, W., Koestner, A., and Klimisch, H.-K. (1991). Chronic toxicityand oncogenicity bioassay of inhaled methyl acrylate andn-butyl acrylate inSprague–Dawley rats.Food Chem. Toxicol.29, 329–339.
Sherrat, H. S. A. (1985). Acyl-CoA esters of xenobiotic carboxylic acids asbiochemically active intermediates.Biochem. Soc. Trans.13, 856–858.
Stott, W. T., Ramsey, J. C., and McKenna, M. J. (1986). Absorption ofchemical vapors by the upper respiratory tract of rats. InToxicology of theNasal Passages(C. S. Barrow, Ed.), pp. 191–210. Hemisphere, Washington,D.C.
Subramaniam, R., Richardson, R. B., Morgan, K. T., Kepler, G., Kimbell, J. S.,and Guilmette, R. A. (1998). Computational fluid dynamics simulations ofinspiratory airflow in the human nose and nasopharynx.Inhal. Toxicol.10,91–120.
Swift, D. L., and Proctor, D. F. (1977). Access of air to the respiratory tract.In Respiratory Defense Mechanisms(J. D. Brain, D. F. Proctor, and L. M.Reid, Eds.), pp. 63–93. Marcel Dekker, New York.
Talamo, B. R., Feng, W.-H., and Stockmayer, M. (1995). Human olfactoryepithelium: Normal patterns and types of lesions found in the generalpopulation.Inhal. Toxicol.6(Suppl.), 249–275.
Trela, B. A., and Bogdanffy, M. S. (1991). Cytotoxicity of dibasic esters(DBE) metabolites in rat nasal explants.Toxicol. Appl. Pharmacol.110,259–267.
Trela, B. A., Frame, S. R., and Bogdanffy, M. S. (1992). A microscopic andultrastructural evaluation of dibasic esters (DBE) toxicity in rat nasal ex-plants.Exp. Mol. Pathol.56, 208–218.
Uraih, L. C., and Maronpot, R. R. (1990). Normal histology of the nasal cavity andapplication of special techniques.Environ. Health Perspect.85, 187–208.
Williams, L. R., and Leggett, R. W. (1989). Reference values for resting bloodflow to organs of man.Clin. Phys. Meas.10, 187–217.
231HYBRID CFD-PBPK NASAL DOSIMETRY MODEL