develop drag estimation on hybrid …umpir.ump.edu.my/279/1/redzuan_bin_ahmad.pdfvi abstract develop...
TRANSCRIPT

DEVELOP DRAG ESTIMATION ON HYBRID ELECTRIC VEHICLE (HEV) MODEL USING COMPUTATIONAL FLUID DYNAMICS (CFD)
REDZUAN BIN AHMAD
A report submitted in partial fulfillment of the requirement for the award of
Bachelor of Mechanical Engineering with Automotive Engineering
Faculty of Mechanical Engineering Universiti Malaysia Pahang
NOVEMBER 2008

v
ACKNOWLEDGEMENTS
I would like express my gratefulness to my supervisor, Mr Devarajan A/L
Ramasamy for his guidance and help during the whole course of completing my final
year project. All his advices and ideas have eventually contributed to the success of this
project.
I would like also to acknowledge with much of appreciation to my friends that
also supervised by Mr. Devarajan, where is Johari Bin Ismail , Mohd Syazrin Bin
Sopnan, Mohd Azrul Bin Mohd Othman , and Shasendran that whose have helped and
give co-operation throughout the project and also Instructor Engineer, Mr Mohd Fazli B.
Ismail. Then not forgotten to my friend, Hafnizar Bin Muhamad Shaharuddin for
allowing me using his car to perform my test experiment.
Last but not least, I would also like to wish my gratitude to all my course mates
and other friends for their encouragement, helps, and motivation that inspired me to do
well my bachelor degree’s final year project. Thank also to all lecturers, technician, and
panels presentation that direct and indirectly contributed in completing and improving
my quality of project.
vi
ABSTRACT
Develop of drag estimation by using Computational Fluid Dynamics (CFD) on
Hybrid Electric Vehicle (HEV) model was carried out on this project. The HEV model
here means the Proton Iswara Hatchback body developed by researcher of Automotive
Focus Group, Universiti Malaysia Pahang. To develop this HEV model, one of factor
needs to consider and studied for giving better efficiency on the road is aerodynamics
drag. Therefore, simulation of CFD and FEM have been the key features to
aerodynamics drag studies in this project for the HEV model specifically is Proton
Iswara Hatcback body. The objectives of this project are to estimate the drag of Proton
Iswara Hatcback body at ranging speed between 40km/h to 110 km/h that designed by
Computational Aided Design (CAD). The terminology to getting the drag estimation is
by using input of CFD then export to FEM analysis to find the value of aerodynamics
drag in terms of drag forces and drag coefficient. Besides that, CFD simulation results
such as contour and trajectories plot also used to analyze the characteristics of
streamlines flow or boundary layer that occurs on the body of this HEV model especially
for the forebody, upperbody and rearbody. To achieve these objectives and
rationalization made of project, aerodynamics studies, and study of CAD, CFD, and
FEA engineering’s software needed to optimize the development of aerodynamic design
on HEV model and to estimate the drag using CFD and FEA software as an alternative
after experimental process. In this project also, a simple experiment was done to validate
the CFD simulation analysis. The experiment known as Pressure Experiment that gives
valuable results to compare with the simulation results as a validation process to this
project.

vii
ABSTRAK
Menentukan aggaran daya rintangan udara terhadap Kenderaan Hibrid Elektrik
(HEV) model menggunakan ‘Computational Fluid Dynamics’ (CFD) menjadi
keutamaan dalam projek ini. Kenderaan Hibrid Elektrik model tersebut ialah Proton
Iswara Hatchback yang telah di bangunkan oleh sekumpulan penyelidik automotif
dikenali sebagai ‘Automotive Focus Group’ di Universiti Malaysia Pahang. Salah satu
faktor yang dipertimbangkan dalam penyelidikan untuk melihat kecekapan HEV model
tersebut ialah dari segi daya rintangan aerodinamik. Oleh itu, simulasi menggunakan
CFD dan ‘Finite Element Model’ (FEM) menjadi kunci utama untuk menyelidik dan
menganalisa daya rintangan aerodinamik terhadap HEV model dalam projek ini dan
secara spesifiknya Proton Iswara Hatchback. Objektif melaksanakan projek ini ialah
mendapatkkan nilai daya rintangan udara HEV model pada julat kelajuan, 40km/h
hingga 110km/h pada setiap 10km/h. Terminologi mendapatkan nilai daya rintangan
udara tersebut ialah menggunakan input daripada CFD seterusnya dihantar kepada FEM
untuk dianalisis dan mendapatkan nilai dalam bentuk daya dan kualiti daya rintangan
udara. Selain daripada itu, ciri-ciri aerodinamik yang berlaku di bahagian depan, atas
dan belakang kenderaan tersebut di analisa menggunakan keratan dan garis aliran plot
yang terdapat di dalam perisian CFD. Bagi mencapai objektif projek ini, perisian
kejuruteraan seperti CFD, CAD dan FEA perlu di optimumkan untuk mendapatkan
anggaran nilai daya dan kualiti daya rintangan udara seterusnya menjadikan CFD dan
FEM sebagai alternatif lain selepas proses eksperimen. Dalam projek ini juga, satu
eksperimen mudah telah dijalankan untuk mengesahkan keputusan proses simulasi.
Eksperimen tersebut dikenali sebagai ‘Eksperimen Tekanan’ yang memberikan
keputusan sangat berguna selepas dibandingkan dengan keputusan simulasi sebagai
proses pengesahan terhadap projek ini.

viii
TABLE OF CONTENTS
CHAPTER TITLE PAGE
TITLE PAGE i
SUPERVISOR DECLARATION ii
DECLARATION iii
DEDICATION iv
ACKNOWLEDGEMENT v
ABSTRACT vi
ABSTRAK vii
TABLE OF CONTENTS viii
LIST OF TABLES xii
LIST OF GRPAHS xiii
LIST OF FIGURES xiv
LIST OF APPENDICES xvi
LIST OF SYMBOLS xvii
LIST OF ABBREVIATION xviii
1 INTRODUCTION 1
1.1 Project Background 1
1.2 Problem Statement 2
1.3 Objectives 2
1.4 Project Scopes 2

ix
2 LITERATURE REVIEW 3
2.1 Theory of Aerodynamics 3
2.1.1 Bernoulli’s Equation 3
2.1.2 Pressure, Lift and Drag Coefficient 4
2.1.2.1 Pressure Coefficient 5
2.1.2.2 Drag Coefficient 6
2.1.2.3 Lift Coefficient 7
2.1.3 Boundary Layer 7
2.1.4 Separation Flow 8
2.1.5 Shape Dependence 9
2.2 Road Vehicles Aerodynamics 10
2.2.1 History of Road Vehicles 11
2.2.2 Relative of Aerodynamics on
Passenger Car 15
2.2.3 Detailed Surface Flow on
Car’s Body 18
2.2.4 Pressure Distribution for Car’s Body 19
2.3 Introduction of Computational Fluid
Dynamics (CFD) 21
2.3.1 CFD as a Tool for Aerodynamics
Simulation 21
2.3.2 Equation Solved by CFD 22
2.3.3 Basic Steps of CFD Computation 23
2.3.4 Surface Mesh Generation in CFD 24
2.3.4.1 Refinement of Thin Areas 24
3 METHODOLOGY 26
3.1 Introduction 26
3.2 Methodology of Flow Chart 26

x
3.3 Data Collecting 28
3.3.1 CAD Modeling 28
3.4 CFD Analysis 29
3.4.1 Refinement 30
3.5 FEM Analysis 30
3.6 Frontal Area Measuring 31
3.7 Simulation Analysis Validation 32
4 RESULT AND DISCUSSION 37
4.1 Data Collections 37
4.1.1 Reference Point of Flow Analysis 37
4.1.2 Data of Various Velocities and
Drag Forces 38
4.1.3 Value of Projected Area 39
4.2 Data Analysis 40
4.2.1 Calculation of Drag Coefficient 40
4.2.2.1 Sample Calculation for
Drag Coefficient 40
4.2.2 Data of Drag Coeffiecient for
Various of Velocity 41
4.2.3 Calculation for Percentages of CD Rises 43
4.2.3.1 Sample Calculation for
Percentages of CD Rises 43
4.2.4 Countour Plot of Velocity and Pressure 45
4.2.5 Trajectories Velocity Flow Analysis 48
4.3 Validation of Simulation Analysis 50
4.3.1 The Results of Experiment for the
Validation of Simulation Analysis 50
4.3.2 Location of Selected Point 51

xi
4.3.3 Pressure Reading of Experiment
and Simulation 52
4.3.4 Discussion of Graph Validation
of Pressure 53
5 CONCLUSION AND RECOMMENDATION 55
5.1 Conclusion 55
5.2 Further Study Recommendation 56
REFERENCES 57
APPENDICES 59-66

xii
LIST OF TABLES
TABLE TITLE PAGE
2.1 Typical Values of Pressure Coefficient, Cp 6
3.1 Table of experiment tools and the function 35
4.1 Table of various velocities and drag forces 38
4.2 Table of various velocities and drag coefficients 41
4.3 Table of various velocities and percentages of
CD rise by velocity 43
4.4 Table of experiment details 50
4.5 Table of Pressure Reading of Experiment and
Simulation and the differences for 40km/h 52
4.6 Table of Pressure Reading of Experiment
and Simulation and the difference for 50km/h 52

xiii
LIST OF GRAPHS
FIGURE TITLE PAGE
4.1 Graph drag forces, D against velocity, V 39
4.2 Graph of Drag Coefficient, CD against Velocity, V 42
4.3 Graph of CD Rises Percentages against Velocity, V 44
4.4 Graph of Pressure Reading of Experiment and
Simulation against Various Point Location s for
speed 40km/h 53
4.5 Graph of Pressure Reading of Experiment and
Simulation against Various Point Locations for
speed 50km/h 54

xiv
LIST OF FIGURES
FIGURE TITLE PAGE
2.1 Drag and lift force due to pressure from
velocity distribution 4
2.2 Pressure distributions on the surface of
an automobile 7
2.3 Variation of boundary layer thickness along
flat plate 8
2.4 Schematic of velocity profile around a rear end 8
2.5 The relationship frontal area on vehicle body
against the normal flow of velocity 10
2.6 The influence of drag coefficients on velocity and
spent power on road 11
2.7 The concept of car is influenced by many requirements
of very difference nature 12
2.8 The early attempts to apply aerodynamic to road
vehicle consisted of the direct transfer of shapes
originating from aeronautical and marine practice 13
2.9 Klemperer recognized the flow over body revolution 14
2.10 The drag history of cars using a logarithmic scale for
drag emphasizes how difficult it is achieve very low
drag values 15
2.11 Breakdown of drag according to the
locations of generation 16
2.12 Ahmed body view (a) 25o rear slant; (b) 35o rear slant 17

xv
2.13 Development of the flow for the
(a) 25o and (b) 35 o slant angle 17
2.14 The relative velocity of air and pressure condition
over the upper profile of a moving car 18
2.15 Flow around a car, and major of locations of
flow separation 19
2.16 Pressure Coefficient Distribution over an
automobile shape 20
2.17 The 3D-hybrid grid 23
2.18 Flow analysis after a design study (pathlines) 23
2.19 Fluid cell refinements due to the Cell Mating rule 25
3.1 Flowchart of the Overall Methodology 27
3.2 The dimension of Proton Iswara Hatchback 28
3.3 CAD model of Proton Iswara Hatchback’s
body in dimetric view 29
3.4 Boundary condition of CFD analysis 29
3.5 All constraint of FEM analysis
as in a Wind Tunnel 31
3.6 The frontal area projected of CAD model 32
3.7 Figure of the experiment tools setup 33
3.8 Diagram of pressure experiment setup tools 34
4.1 Figure of table of velocity plot from the
center body for various velocities 45
4.2 Figure of table of pressure plot from the
center body for various velocities 46
4.3 The isometric view of trajectories velocity
flow of 40 km/h 48
4.4 The location point of high and lower
pressure distribution 51

xvi
LIST OF APPENDICES
APPENDIX TITLE PAGE
A Project Gantt Chart 59
B Analysis Plot of Computational
Fluid Dynamics (CFD) 61-66

xvii
LIST OF SYMBOLS
D Drag Force
Df Friction Drag Force
L Lift Force
CD Drag Coefficient
Cp Pressure Coefficient
CL Lift Coefficient
ρ Air Density
A Frontal Area
b Length Normal to The Flow
h Height of the Body
v Speed of the Body
v Local Velocity
p Local Pressure
Si Mass-Distributed External Force per Unit Mass
E Total Energy per Unit Mass
QH Heat Source per Unit Volume
ik Viscous Shear Stress Tensor
qi Diffusive Heat Flux

xviii
LIST OF ABBREVIATION
HEV Hybrid Electric Vehicle
CFD Computational Fluid Dynamic
FEM Finite Element Model
CAD Computational Aided Design
CAE Computational Aided Engineering
RANS Reynolds-Averaged Navier-Stokes Equation
DNS Direct Numerical Simulation
3D Three Dimensional

1
CHAPTER 1
INTRODUCTION
1.1 Project Background
The importance of aerodynamics to a Hybrid Electric Vehicle (HEV) model
needs a development of drag estimation to know how much the car performance on the
road against air resistance beside to improve the stability, reducing noise and fuel
consumption. In view of the fact that many of car makers like Toyota, Honda and Audi
formulate a research and continue develop the HEV model focused on higher propulsion
efficiency orderly integrate the energy saving by reduce the rolling resistance of wheel
and reduce the drag by aerodynamically losses. At University Malaysia Pahang (UMP),
Automotive Focus Group also was developed HEV model to achieve the aim of HEV’s
control strategy in term of efficiency. Proton Iswara Hatchback body was used by the
group to modify the conventional power train to the hybrid power train. As an increasing
of drag, the more power of car to do work than reducing the power train efficiency.
Therefore, the body of passenger car (Proton Iswara Hatchback) needs to study in term
of aerodynamics losses. In aerodynamic field there have two major studies need to be
concerned where is study the airflow on the body and estimation of drag. To understand
the aerodynamics on the HEV model, flow visualization is the best technique as usual
does by wind tunnel. But, in this project Computational Fluid Dynamics (CFD) analysis
will be used as the technology of computer simulation to estimate the drag of HEV
model after conventional technique due to economical factor.
1.2 Problem Statement

2
In Universiti Malaysia Pahang, one group of automotive researcher known as
Automotive Focus Group were studied the design and development on Proton Iswara
Hatchback body as a hybrid electric car. Therefore, the main concerns in aerodynamics
fields were focused to study to know the efficiency and performance of that HEV model.
The aerodynamics fields consideration in that researches’ is drag reduction which is be
the most important factor of HEV model design.
Drag will cause many problems on the performance of HEV model like
instability, noise and fuel consumption. Thus, in this project the CAD model of Proton
Iswara’s body was developed to analyze aerodynamics especially on the drag estimation.
In addition, using CFD and FEM analysis as a possible procedure were develop the drag
estimation and aerodynamics studies on the body due to no wind tunnel in UMP.
1.3 Objectives
1. To estimate the drag of HEV model (Proton Iswara’s body)
2. Develop the drag estimation from Computational Fluid Dynamics (CFD) and
Finite Element Model (FEM) analysis
1.4 Project Scopes
1. Study of aerodynamics on road vehicle
2. Study of Computer Aided Design (CAD) engineering software
3. Analyze the project with CFD and Finite Element Model (FEM) for various
car speeds
4. Optimize the software engineering as a tool to develop aerodynamics design
on passenger car.
3
CHAPTER 2
LITERATURE REVIEW
2.1 Theory of Aerodynamics
At this section, the fundamental of fluids mechanics and basics of aerodynamics
were discussed to gain understanding in doing analysis of the project. The basics
equation and terms in aerodynamics field or fundamental of fluid mechanics such as
Bernoulli’s Equation, pressure, lift and drag coefficient, boundary layer, separation flow,
and shape dependence were studied.
2.1.1 Bernoulli’s Equation
Aerodynamics play main role to defined road vehicle’s characteristic like
handling, noise, performance and fuel economy [1]. The improvement on the
characteristic related through the drag force which is ruled by Bernoulli Equation.
Basic assumptions of Bernoulli’s Equation for an air flows are;
1. Viscous effects are assumed negligible
2. The flow is assumed to be steady
3. The flow is assumed to be incompressible
4. The equation is applicable along streamline
p + v2 = constant (2.1)
4
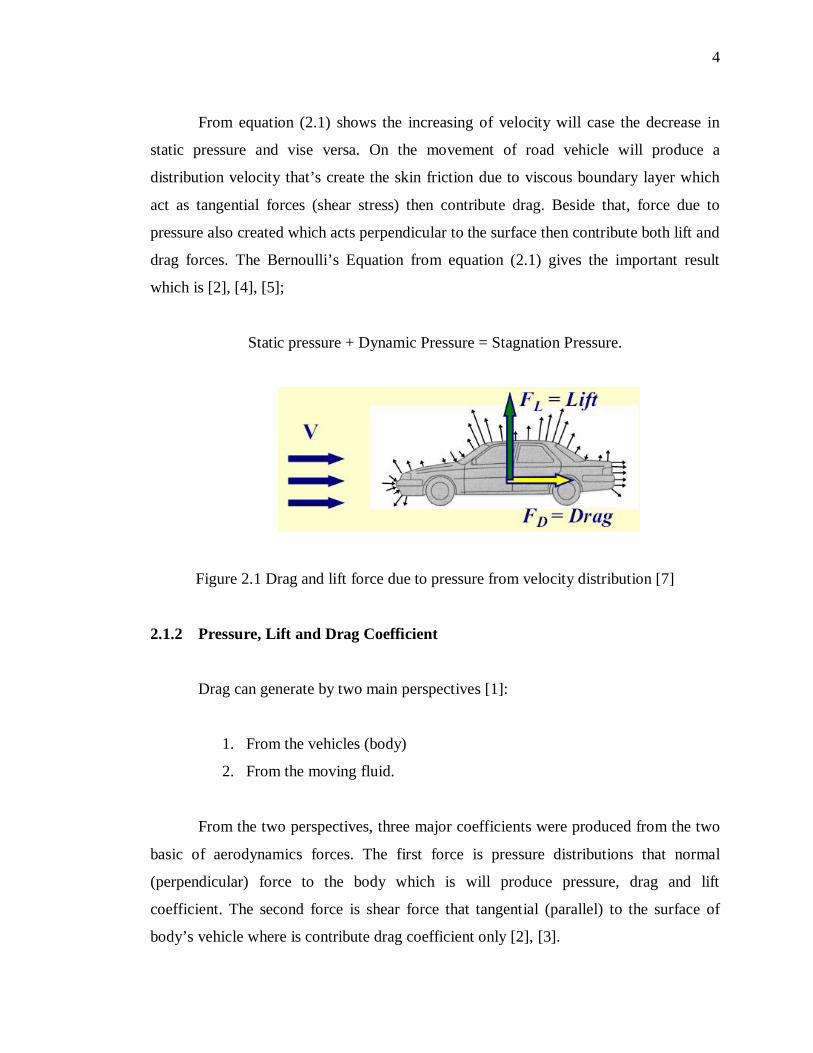
From equation (2.1) shows the increasing of velocity will case the decrease in
static pressure and vise versa. On the movement of road vehicle will produce a
distribution velocity that’s create the skin friction due to viscous boundary layer which
act as tangential forces (shear stress) then contribute drag. Beside that, force due to
pressure also created which acts perpendicular to the surface then contribute both lift and
drag forces. The Bernoulli’s Equation from equation (2.1) gives the important result
which is [2], [4], [5];
Static pressure + Dynamic Pressure = Stagnation Pressure.
Figure 2.1 Drag and lift force due to pressure from velocity distribution [7]
2.1.2 Pressure, Lift and Drag Coefficient
Drag can generate by two main perspectives [1]:
1. From the vehicles (body)
2. From the moving fluid.
From the two perspectives, three major coefficients were produced from the two
basic of aerodynamics forces. The first force is pressure distributions that normal
(perpendicular) force to the body which is will produce pressure, drag and lift
coefficient. The second force is shear force that tangential (parallel) to the surface of
body’s vehicle where is contribute drag coefficient only [2], [3].

5
2.1.2.1 Pressure Coefficient
The equation for coefficient of pressure (Cp) due to dynamic pressure can derive
as [3],[4] ;
(2.2)
The equation of dynamic pressure defined as [3],[4];
(2.3)
In term of local velocity, the pressure coefficient (only valid for incompressible flow)
can derive as [3],[4];
(2.4)
The form of equation (2.4) is from the relation equation (2.2) and equation (2.5)
as shown below [2],[3],[4];
(2.5)
From the equation (2.4) where the local velocity on velocity is zero, the pressure
coefficient is equal to 1.0 and when v=v , the pressure coefficient will be zero. While
from equation (2.2) where p=p , Cp was become zero also. Pressure coefficient would
become negative, since the local velocity is larger than the free stream velocity, v .
Therefore, some typical value of pressure coefficient can summarize on table as shown
in Table 2.1 below.
2
21
ρv
ppCp
2
2 vpptot
2
2
1
vvCp
)(21 22 vvpp
6
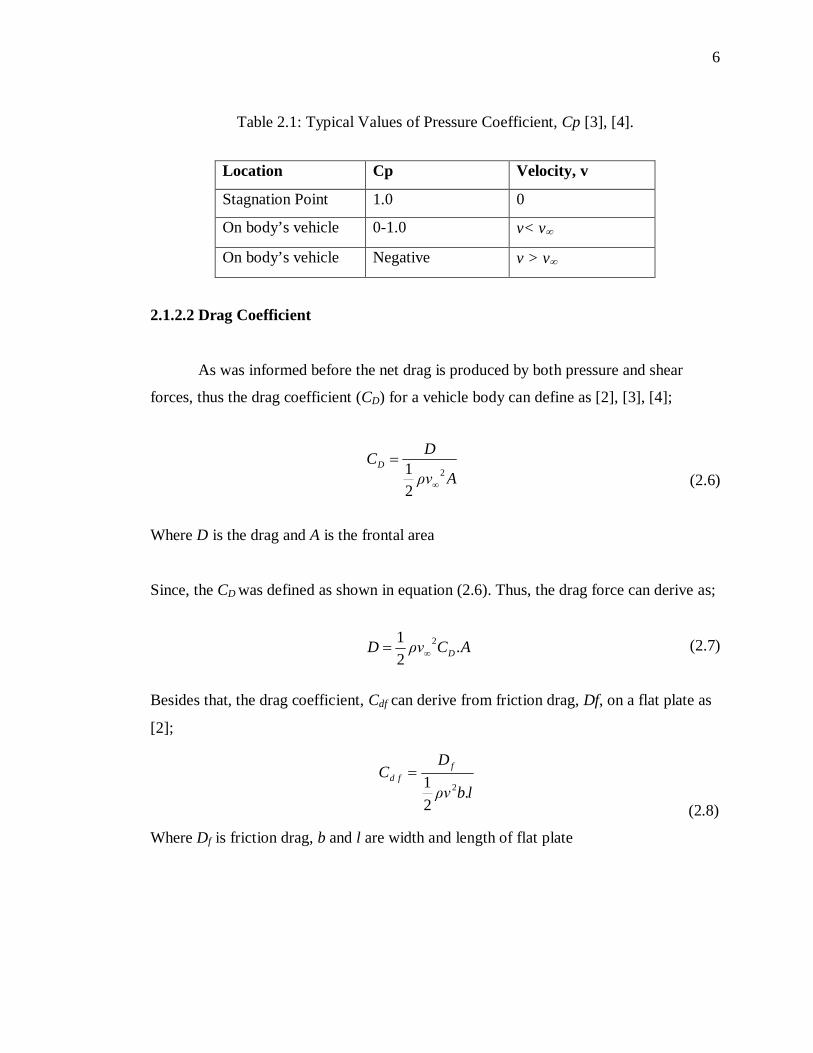
Table 2.1: Typical Values of Pressure Coefficient, Cp [3], [4].
2.1.2.2 Drag Coefficient
As was informed before the net drag is produced by both pressure and shear
forces, thus the drag coefficient (CD) for a vehicle body can define as [2], [3], [4];
(2.6)
Where D is the drag and A is the frontal area
Since, the CD was defined as shown in equation (2.6). Thus, the drag force can derive as;
(2.7)
Besides that, the drag coefficient, Cdf can derive from friction drag, Df, on a flat plate as
[2];
(2.8)
Where Df is friction drag, b and l are width and length of flat plate
Location Cp Velocity, v
Stagnation Point 1.0 0
On body’s vehicle 0-1.0 v< v
On body’s vehicle Negative v > v
Aρv
DCD2
21
lbρv
DC f
fd
.21 2
ACρvD D .21 2

7
2.1.2.3 Lift Coefficient
The lift force can be determined if the distribution of dynamic pressure and shear
force on the entire body are known. Therefore the lift coefficient (CL) can indicate as [3],
[4];
(2.9)
Where L is lift force and A is the frontal area
Pressure and shear stress distribution is difficult to obtain along a surface for non
geometry body either experimentally or theoretically but these to value can be obtained
by Computational Fluid Dynamics (CFD) [1], [2].
Figure 2.2 Pressure distributions on the surface of an automobile [2]
2.1.3 Boundary Layer
Boundary layer study in aerodynamics can be describe on a flat plate where is
develop with two types flow which is laminar and turbulent flow. Due to fluid viscosity,
a thin layer will exist when the velocity parallel to the static flat plate and then gradually
Aρv
LCL2
21

8
increase the outer velocity. The thickness of boundary layer also increases with the
distance along the flat plate’s surface [2], [3], [4].
Normally, the boundary layer is start from laminar flow and develops into
turbulent flow. These two types of flow can determined with change of Reynolds
number. Between the laminar and turbulent, form of transition region start occur when
the change on laminar flow into turbulent flow [2], [3], [4]. The variation of boundary
layer thickness can be seen in Figure 2.3;
Figure 2.3 Variation of boundary layer thickness along flat plate [3]
2.1.4 Separation Flow
Separation flow can define as the fluid flow against the increasing pressure as far
as it can; at point the boundary layer separates from the surface where the fluid within
the boundary layer does not have such an energy supply [2].
Figure 2.4 Schematic of velocity profile around a rear end [6]

9
In automobile shape, the rear end of vehicle becomes increasingly lower as the
flow moves downstream then the extended airflow was formed there. Thus, it causes the
downstream pressure increase while creates reverse force acting alongside the main flow
and generates the reverse flow at downstream at point C as showed in Figure 2.4.
At Point A, no reverse occur because the momentum of the boundary layer is
widespread over the pressure gradient. Between the Point A and Point C, the momentum
of boundary layer and pressure gradient are balanced as stated at separation on Point B.
The reverse force acting on separation point C is due to the viscosity of air (losses of
momentum as it moves downstream) [6].
2.1.5 Shape Dependence
As discussed before the drag was depend on the shape of vehicle [1]. The Drag
coefficient from equation (2.6) and equation (2.8) shown clearly the frontal area is give
effect on the drag and lift coefficient means that increasing of frontal area or more blunt
of body shaped will increase the both coefficient orderly increase the drag.
For the case, 0<Cd <1 and v< v , the drag, D=½ v2Cd.A that was defined
from equation (2.7) [2]. Thus from the definition we can conclude that area of frontal
area projected of composite body as [2], [8];
A=b.h (2.10)
Where b is the length normal to the flow, and h is the height of the body