appendix l – sound study - south dakota
TRANSCRIPT

APPENDIX L – SOUND STUDY
SOUND LEVEL ASSESSMENT REPORT
Sweetland Wind Project Hand County, South Dakota
4865 Sterling Drive, Suite 200 Boulder, CO 80301
3 Mill & Main Place, Suite 250 Maynard, MA 01754
March 5, 2019
§OUN[D) UEVEL A§§[E§§MENl ~[E fPO~l
§weet~arr-nd W~rr-nd Project Harr-nd ColUlrr-nfy, §olUl1th Dalkora
Prepared for:
Scout Clean Energy
Prepared by:
Epsilon Associate~ Inc.

TABLE OF CONTENTS
1.0 EXECUTIVE SUMMARY 1-1
2.0 INTRODUCTION 2-1
3.0 SOUND TERMINOLOGY 3-1
4.0 NOISE REGULATIONS 4-14.1 Federal Regulations 4-1 4.2 South Dakota State Regulations 4-1 4.3 Hand County Regulations 4-1
5.0 FUTURE CONDITIONS 5-15.1 Equipment and Operating Conditions 5-1 5.2 Modeling Methodology 5-2 5.3 Sound Level Results 5-4
6.0 CONSTRUCTION NOISE 6-1
7.0 EVALUATION OF SOUND LEVELS 7-17.1 Modeled Sound Levels 7-17.2 Evaluation 7-1
8.0 CONCLUSIONS 8-1
LIST OF APPENDICES
Appendix A Wind Turbine CoordinatesAppendix B Predicted Sound Levels at Occupied Residences
LIST OF FIGURES
Figure 2-1 Aerial Locus 2-2
Figure 3-1 Common Indoor and Outdoor Sound Levels 3-3
Figure 5-1 Sound Level Modeling Locations 5-5 Figure 5-2 Leq Sound Level Modeling Results 5-6
7r AlBUE Q[F CONlENl§
1.0 IEXIECUllVIE SUMMAIR.Y
2.0 INllR.ODUCTION
3.0 SOUND llEIRMINOlOGY
4.0 NOISIE IR.IEGUlAllONS
5.0 fUlUIR.IE CONIDmONS
6.0 CONSllR.UCT!ON NOISIE
7.0 IEVAlUAllON Of SOUND llEVIElS
8.0 CONClUSIONS
U§T Of AIPIPIENID!CIE§
U§T Of f!GUIR.IE§
5372 Sweet/andSoundReport_ Layout7 90206.docx i
1-1
2-1
3-1
5-1
6-1
7-1
8-1
Table of Contents Epsilon Associates, Inc.
LIST OF TABLES
Table 5-1 Modeled Substation Transformer Sound Power Levels 5-2
Table 6-1 Sound Levels for Construction Noise Sources 6-1
U§l Of lAIBlllE§
5372 Sweet/andSoundReport_ Layout7 90206.docx ii Table of Contents Epsilon Associates, Inc.

1.0 EXECUTIVE SUMMARY
The Sweetland Wind Farm, LLC (the Project) is a proposed wind power electric generation facility expected to consist of up to 71 wind turbines in Hand County, South Dakota. The Project is being developed by Scout Clean Energy, LLC (SCE). Epsilon Associates, Inc. (Epsilon) has been retained by SCE to conduct a sound level modeling study for the Project. This report presents results of the study.
A sound level modeling analysis was conservatively conducted for 86 turbines, including 71 proposed wind turbine locations and 15 alternate locations and a collector substation. All wind turbines for this Project are proposed to be General Electric (GE) 2.82-127 units.1 The purpose of this assessment is to predict worst-case sound levels generated by the facility in Hand County when the wind turbines are operational and to compare the modeling results to applicable limits. Sound levels from the Project are limited by agreement to 50 dBA at participating occupied residences and 45 dBA at non-participating occupied residences in Hand County.
Using the Project specific data provided by SCE, the Leq sound levels modeled at participating occupied receptors are at or below 50 dBA and sound levels modeled at non-participating occupied receptors are at or below 43 dBA. Therefore, the Project meets the requirements with respect to sound in the Hand County Development Agreement dated December 4, 2018 (Development Agreement).
1 Two of which will be GE 2.82-127 Low Noise Trailing Edge (LNTE) units.
1.0l IEXIECUl!VIE §UMMAIRY
5372 Sweet/andSoundReport_ Layout7 90206.docx 1-1 Executive Summary Epsilon Associates, Inc.

2.0 INTRODUCTION
The Project is located in Hand County, South Dakota, consisting of 71 GE wind turbines and a collector substation.2 A total of 15 alternate wind turbine locations are also proposed for the Project. The wind turbines will be GE 2.82-127 units with a rotor diameter of 127 meters.3
A total of 64 primary and 9 alternate wind turbines are proposed to have a hub height of 114 meters and a total of 7 primary and 6 alternate wind turbines are proposed to have a hub height of 89 meters. Figure 2-1 shows the locations of the 71 proposed and 15 alternate wind turbines, the substation, and the Project boundary over aerial imagery in Hand County.
A detailed discussion of sound from wind turbines is presented in a white paper prepared by the Renewable Energy Research Laboratory.4 A few points are repeated herein. Wind turbine noise can originate from two different sources; mechanical sound from the interaction of turbine components and aerodynamic sound produced by the flow of air over the rotor blades. Prior to the 1990’s, both sources were significant contributors to wind turbine noise. However, recent advances in wind turbine design have greatly reduced the contribution of mechanical noise. Aerodynamic noise has also been reduced in modern wind turbines due to slower rotational speeds and changes in materials of construction. Aerodynamic noise, in general, is broadband (has contributions from a wide range of frequencies). It originates from encounters of the wind turbine blades with localized airflow inhomogeneities and wakes from other turbine blades and from airflow across the surface of the blades, particularly the front and trailing edges. Aerodynamic sound generally increases with increasing wind speed up to a certain point, then typically remains constant, even with higher wind speeds. However, sound levels in general also increase with increasing wind speed with or without the presence of wind turbines.
This report presents the results of a sound level modeling analysis for the Project. The wind turbines were modeled with the Cadna/A software package using sound data from GE technical documents.
2 The Project will also have a switchyard. The switchyard is not expected to have any significant sources of sound.
3 Two of which will be GE 2.82-127 Low Noise Trailing Edge (LNTE) units. 4 Renewable Energy Research Laboratory, Department of Mechanical and Industrial Engineering, University
of Massachusetts at Amherst, Wind Turbine Acoustic Noise, June 2002, amended January 2006.
2.0l !Nl!RODUCT!ON
5372 SweetlandSoundReport_ Layout7 90206.docx 2-1 Introduction Epsilon Associates, Inc.

Figure 2-1Aerial Locus Map
Sweetland Wind Hand County, South Dakota
G:\Projects2\SD\5372\MXD\Sound\2-1_Aerial_Locus_20190304.mxd
LEGEND
Basemap: Bing Imagery, Microsoft Corporation°0 3,000 6,000
Feet1 inch = 5,500 feetScale 1:66,000
Data Source: Office of Geographic Information (MassGIS), Commonwealth of Massachusetts, Information Technology Division
Proposed Wind Turbine
Project Boundary
Substation

3.0 SOUND TERMINOLOGY
There are several ways in which sound (noise) levels are measured and quantified. All of them use the logarithmic decibel (dB) scale. The following information defines the sound level measurement terminology used in this analysis.
The decibel scale is logarithmic to accommodate the wide range of sound intensities found in the environment. A property of the decibel scale is that the sound pressure levels of two or more separate sounds are not directly additive. For example, if a sound of 50 dB is added to another sound of 50 dB, the total is only a 3-decibel increase (53 dB), which is equal to doubling in sound energy but not equal to a doubling in decibel quantity (100 dB). Thus, every 3-dB change in sound level represents a doubling or halving of sound energy. Relative to this characteristic, a change in sound levels of less than 3 dB is imperceptible to the human ear.
Another mathematical property of decibels is that if one source of noise is at least 10 dB louder than another source, then the total sound level is simply the sound level of the higher-level source. For example, a sound source at 60 dB plus another sound source at 47 dB is equal to 60 dB.
A sound level meter (SLM) that is used to measure sound is a standardized instrument.5 It contains “weighting networks” (e.g., A-, C-, Z-weightings) to adjust the frequency response of the instrument. Frequencies, reported in Hertz (Hz), are detailed characterizations of sounds, often addressed in musical terms as “pitch” or “tone”. The most commonly used weighting network is the A-weighting because it most closely approximates how the human ear responds to sound at various frequencies. The A-weighting network is the accepted scale used for community sound level measurements; therefore, sounds are frequently reported as detected with a sound level meter using this weighting. A-weighted sound levels emphasize middle frequency sounds (i.e., middle pitched – around 1,000 Hz), and de-emphasize low and high frequency sounds. These sound levels are reported in decibels designated as “dBA”. Sound pressure levels for some common indoor and outdoor environments are shown in Figure 3-1.
Because the sounds in the environment vary with time, many different sound metrics may be used to quantify them. There are two typical methods used for describing variable sounds. These are exceedance levels and equivalent levels, both of which are derived from a large number of moment-to-moment A-weighted sound pressure level measurements. Exceedance levels are values from the cumulative amplitude distribution of all of the sound levels observed during a measurement period. Exceedance levels are designated Ln, where “n” is a value (typically an integer between 1 and 99) in terms of percentage. Equivalent levels are
5 , ANSI S1.4-1983 (R2006), published by the Standards Secretariat of the Acoustical Society of America, Melville, NY.
3.0l §OUND llEIIW!NOlOGY
American National Standard Specification for Sound Level Meters
5372 Sweet/andSoundReport_ Layout7 90206.docx 3-1 Sound Terminology Epsilon Associates, Inc.
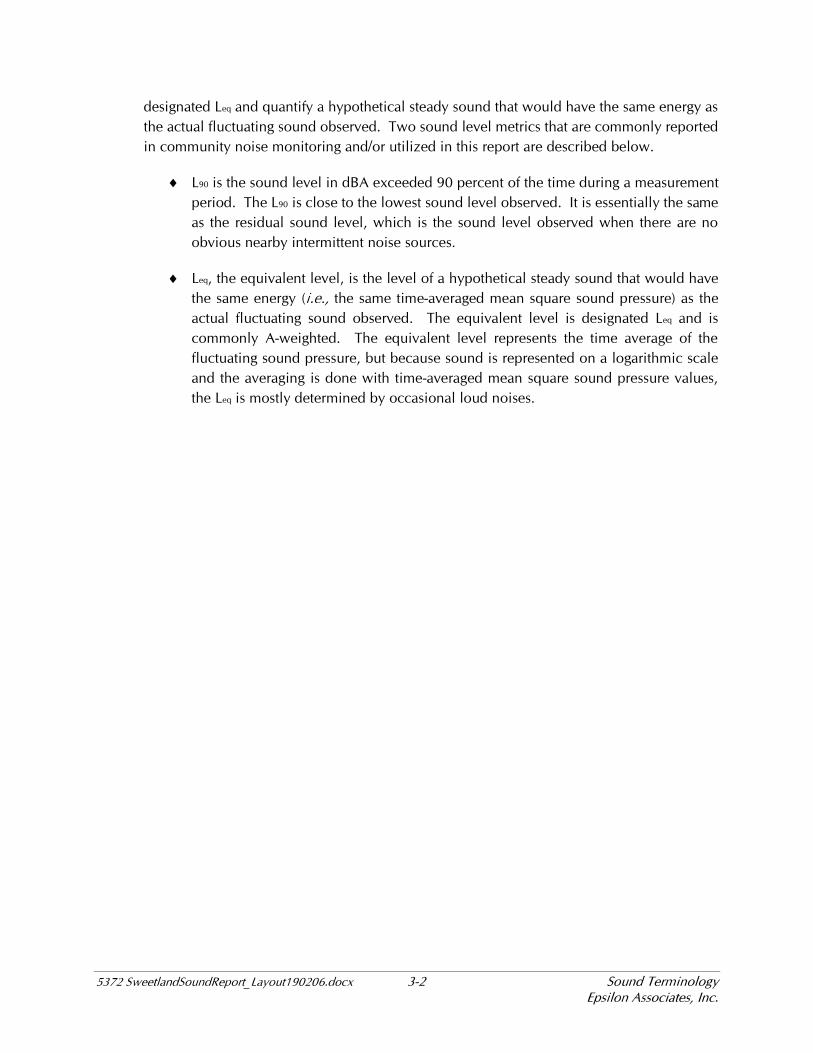
designated Leq and quantify a hypothetical steady sound that would have the same energy as the actual fluctuating sound observed. Two sound level metrics that are commonly reported in community noise monitoring and/or utilized in this report are described below.
L90 is the sound level in dBA exceeded 90 percent of the time during a measurement period. The L90 is close to the lowest sound level observed. It is essentially the same as the residual sound level, which is the sound level observed when there are no obvious nearby intermittent noise sources.
Leq, the equivalent level, is the level of a hypothetical steady sound that would have the same energy ( the same time-averaged mean square sound pressure) as the actual fluctuating sound observed. The equivalent level is designated Leq and is commonly A-weighted. The equivalent level represents the time average of the fluctuating sound pressure, but because sound is represented on a logarithmic scale and the averaging is done with time-averaged mean square sound pressure values, the Leq is mostly determined by occasional loud noises.
♦
♦
i.e.,
5372 Sweet/andSoundReport_ Layout7 90206.docx 3-2 Sound Terminology Epsilon Associates, Inc.

120
110
100
90
80
70
60
50
40
30
20
10
0
Figure 3-1Common Sound Levels in the Environment
References:
1. Harris, Cyril, "Handbook of Noise Acoustical Measurements and
Noise Control", p 1-10., 1998
2. "Controlling Noise", USAF, AFMC, AFDTC, Elgin AFB, Fact Sheet, August 1996
3. California Dept. of Trans., "Technical Noise Supplement", Oct, 1998
COMMON INDOOR SOUNDS COMMON OUTDOOR SOUNDSSound Pressure
Level, dBA
Jet takeoff at 300 feet
Jet flyover at 1,000 feet
Gas lawnmower at 3 feet
Heavy truck at 50 feet
Noisy urban daytime
Gas lawnmower at 100 feet
Auto (60 mph) at 100 feet
Heavy traffic at 300 feet
Quiet urban daytime
Quiet urban nighttime
Quiet suburban nighttime
North rim of Grand CanyonQuiet rural nighttime
Rock band
Inside subway train (NYC)
Food blender at 3 feet
Garbage disposal at 3 feet
Shouting at 3 feet
Vacuum cleaner at 10 feet
Normal speech at 3 feet
Quiet speech at 3 feetDishwasher next room
Soft whisper at 3 feet
Library
Bedroom at night
Broadcast and recording studio
Threshold of hearing

4.0 NOISE REGULATIONS
4.1 Federal Regulations
There are no federal noise regulations applicable to this Project.
4.2 South Dakota State Regulations
There are no state noise regulations applicable to this Project.
4.3 Hand County Regulations
Hand County currently has no zoning ordinance containing language regulating sound levels from wind energy projects. However, Hand County has a Development Agreement with Scout Clean Energy for this Project. The proposed Sweetland Wind Project is therefore subject to the following sound level requirements per the agreement:
Participating receptors (occupied residences) have been evaluated in this analysis against the 50 dBA limit and non-participating receptors have been evaluated against the 45 dBA limit.
~.Ol NO!§IE ~IEGUlAl!ON§
Developer agrees to site Project wind turbines such that sound levels resulting from Project wind turbines will not exceed 50 dBA at the currently occupied residences of participating landowners and 45 dBA at the currently occupied residences of non-participating landowners, unless waived in writing by the owner of the occupied residence.
5372 Sweet/andSoundReport_ Layout7 90206.docx 4-1 Noise Regulations Epsilon Associates, Inc.

5.0 FUTURE CONDITIONS
5.1 Equipment and Operating Conditions
The sound level analysis conservatively includes 86 wind turbines, although only up to 71turbines will be constructed (15 locations are alternate locations). Global coordinates for the 86 wind turbines are provided in Appendix A. All wind turbines are GE 2.82-127 units with a rotor diameter of 127 meters. A total of 64 primary and 9 alternate wind turbines are proposed to have a hub height of 114 meters and a total of 7 primary and 6 alternate wind turbines are proposed to have a hub height of 89 meters. The hub height of each wind turbine in the layout is included in Appendix A. A technical report from GE6 was provided by SCEwhich documented the expected sound power levels associated with the GE 2.82-127 wind turbine. According to this technical document, which included broadband and octave-band A-weighted sound power levels for various wind speeds, the maximum sound power level for the GE 2.82-127 of 110.0 dBA occurs at hub height wind speeds of 10 m/s (and above). These sound power levels are defined as “calculated apparent” by the turbine manufacturer and therefore do not include any uncertainty factor.
In order to meet the limits in the Development Agreement, select wind turbines will be required to have Low Noise Trailing Edge (LNTE) blades which produce lower sound levels compared to the standard blade counterparts. A technical report from GE7 was provided by SCE which documented the expected sound power levels associated with the GE 2.82-127 LNTE wind turbine. According to this technical document, which included broadband and octave-band A-weighted sound power levels for various wind speeds, the maximum sound power level for the GE 2.82-127 LNTE of 108.5 dBA occurs at hub height wind speeds of 10 m/s (and above). These sound power levels are also defined as “calculated apparent” by the wind turbine manufacturer and therefore do not include any uncertainty factor. Two wind turbines are required to be LNTE units and these wind turbines are identified in Appendix A.
In addition to the wind turbines, there will be a collector substation associated with the Project. The substation is proposed to be located southeast of wind turbine #48 as shown in Figure 5-1. Two 110 megavolt-ampere (MVA) transformers are proposed for the substation. Epsilon has estimated octave-band sound power levels using the MVA rating provided by SCE and techniques in the Electric Power Plant Environmental Noise Guide (Edison Electric Institute), Table 4.5 Sound Power Levels of Transformers. Table 5-1 below summarizes the sound power level data used in the modeling per transformer.
6 General Electric Company, Technical Documentation Wind Turbine Generator Systems 2.x-127 – 60 Hz Product Acoustic Specifications, 2018.
7 General Electric Company, Technical Documentation Wind Turbine Generator Systems 2.x-127 with LNTE – 60 Hz Product Acoustic Specifications, 2018.
5.0l fUlUIRIE CONDn!ON§
5372 Sweet/andSoundReport_ Layout7 90206.docx 5-1 Future Conditions Epsilon Associates, Inc.
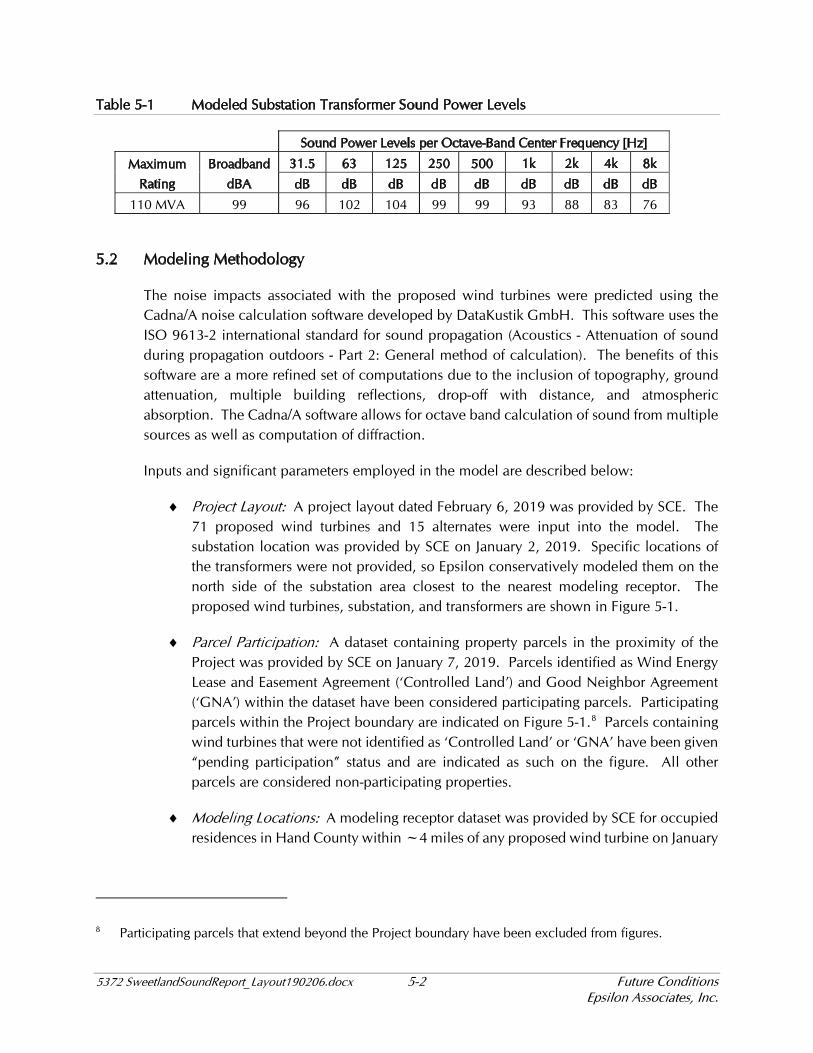
Table 5-1 Modeled Substation Transformer Sound Power Levels
Sound Power Levels per Octave-Band Center Frequency [Hz]
Maximum Rating
BroadbanddBA
31.5 63 125 250 500 1k 2k 4k 8k
dB dB dB dB dB dB dB dB dB
110 MVA 99 96 102 104 99 99 93 88 83 76
5.2 Modeling Methodology
The noise impacts associated with the proposed wind turbines were predicted using the Cadna/A noise calculation software developed by DataKustik GmbH. This software uses the ISO 9613-2 international standard for sound propagation (Acoustics - Attenuation of sound during propagation outdoors - Part 2: General method of calculation). The benefits of this software are a more refined set of computations due to the inclusion of topography, ground attenuation, multiple building reflections, drop-off with distance, and atmospheric absorption. The Cadna/A software allows for octave band calculation of sound from multiple sources as well as computation of diffraction.
Inputs and significant parameters employed in the model are described below:
A project layout dated February 6, 2019 was provided by SCE. The 71 proposed wind turbines and 15 alternates were input into the model. The substation location was provided by SCE on January 2, 2019. Specific locations of the transformers were not provided, so Epsilon conservatively modeled them on the north side of the substation area closest to the nearest modeling receptor. The proposed wind turbines, substation, and transformers are shown in Figure 5-1.
A dataset containing property parcels in the proximity of the Project was provided by SCE on January 7, 2019. Parcels identified as Wind Energy Lease and Easement Agreement (‘Controlled Land’) and Good Neighbor Agreement (‘GNA’) within the dataset have been considered participating parcels. Participating parcels within the Project boundary are indicated on Figure 5-1.8 Parcels containing wind turbines that were not identified as ‘Controlled Land’ or ‘GNA’ have been given “pending participation” status and are indicated as such on the figure. All other parcels are considered non-participating properties.
A modeling receptor dataset was provided by SCE for occupied residences in Hand County within ~4 miles of any proposed wind turbine on January
8 Participating parcels that extend beyond the Project boundary have been excluded from figures.
Mooe!ed §1L11bs1tatio1"1 lramsformer §m.md !Power levels
$1(J)11.m1d IP'l(J)wier 11..ievieis pie!' Odavie-lllla11111dl Cie1111tiel' IFreqi.1ie1111cy [Hz]
M:aixnmi.lm llllroatdlballl1ld 31.5 63 125
1Ratti1111g dlllllA dllll dlllll dllll
♦ Project Layout:
♦ Parcel Participation:
♦ Modeling Locations:
5372 Sweet/andSoundReport_ Layout7 90206.docx 5-2
251()) 5())()) 1 lk
dllll dlllll dllll
2k dlllll
4k 81k
dlllll dllll
Future Conditions Epsilon Associates, Inc.

2, 2019. A total of 41 receptors from this dataset were input into the Cadna/A model.9
These were all modeled as discrete points at a height of 1.5 meters above ground level to mimic the ears of a typical standing person. These locations are shown in Figure 5-1. Participation status for each of the 41 modeling receptors was assigned based on the parcel data previously described. The receptors are indicated as either participating, pending participation, or non-participating on Figure 5-1.
Elevation contours for the modeling domain were directly imported into Cadna/A which allowed for consideration of terrain shielding where appropriate. The terrain height contour elevations for the modeling domain were generated from elevation information derived from the National Elevation Dataset (NED) developed by the U.S. Geological Survey.
Octave-band sound power levels for the GE 2.82-127 and GE 2.82-127 LNTE wind turbines from the provided technical reports were input to the model. These sound levels represent “worst-case” operational sound level emissions. The substation transformer sound power levels as presented in Table 5-1 were input to the model.
Typically, uncertainty factors provided by manufacturers for wind turbine sound power levels are 2 decibels or less. For this analysis an uncertainty factor of 2.0 dBA was assumed and added to the sound power level for the modeled wind turbines.
Spectral ground absorption was calculated using a G-factor of 0.5 which corresponds to “mixed ground” consisting of both hard and porous ground cover.
The highest wind turbine sound power level for each wind turbine type including uncertainty was input into Cadna/A to model wind turbine generated sound pressure levels during conditions when worst-case sound power levels are expected. Sound pressure levels due to operation of all 86 wind turbines and the substation transformers were conservatively modeled at 41 receptors in Hand County. In addition to modeling at discrete points, sound levels were also modeled throughout a large grid of receptor points, each spaced 20 meters apart to allow for the generation of sound level isolines.
9 The original dataset contained 42 receptors; however, it was later determined that one of the receptors was not an occupied residence, as confirmed by the Hand County Tax Assessor on February 1, 2019. This receptor was excluded from the model.
♦ Terrain Elevation:
♦ Source Sound Levels:
♦ Uncertainty factor:
♦ Ground Attenuation:
5372 Sweet/andSoundReport_ Layout7 90206.docx 5-3 Future Conditions Epsilon Associates, Inc.

Several modeling assumptions inherent in the ISO 9613-2 calculation methodology, or selected as conditional inputs by Epsilon, were implemented in the Cadna/A model to ensure conservative results (i.e., higher sound levels), and are described below:
All modeled sources were assumed to be operating simultaneously and at the design wind speed corresponding to the greatest sound level impacts.
As per ISO 9613-2, the model assumed favorable conditions for sound propagation, corresponding to a moderate, well-developed ground-based temperature inversion, as might occur on a calm, clear night or equivalently downwind propagation.
Meteorological conditions assumed in the model (temperature=10 & relative humidity=70%) were selected to minimize atmospheric attenuation in the 500 Hz and 1 kHz octave bands where the human ear is most sensitive.
No additional attenuation due to tree shielding, air turbulence, or wind shadow effects was considered in the model.
5.3 Sound Level Results
Table B-1 in Appendix B shows the predicted “Project-Only” broadband (dBA) Leq sound levels under conditions specified in the previous section for the 41 receptors in Hand County. A brief description of each receptor is provided in the table for identification. The sound levels range from 35 to 50 dBA at participating receptors and from 27 to 43 dBA at non-participating receptors.
In addition to the 41 receptor points, Leq sound level isolines generated from the modeling grid are presented in Figure 5-2. Wind turbines with LNTE blades are identified in the figure.
♦
♦
♦
♦
5372 Sweet/andSoundReport_ Layout7 90206.docx 5-4
oc
Future Conditions Epsilon Associates, Inc.

Figure 5-1Sound Level Modeling Locations
Sweetland Wind Hand County, South Dakota
G:\Projects2\SD\5372\MXD\Sound\5-1_Sound_Level_Modeling_Locations_20190304.mxd
LEGEND
Basemap: Bing Imagery, Microsoft Corporation°0 2,600 5,200
Feet1 inch = 5,500 feetScale 1:66,000
Data Source: Office of Geographic Information (MassGIS), Commonwealth of Massachusetts, Information Technology Division
Proposed Wind Turbine
"" Non-Participating Receptor
"" Participating Receptor
"" Pending Participating Receptor
#0 Transformer (Assumed)Project BoundarySubstationPending Participation ParcelsParticipating Parcels

Figure 5-2L Sound Level Modeling Results
Sweetland Wind Hand County, South Dakota
G:\Projects2\SD\5372\MXD\Sound\5-2_Sound_Level_Modeling_Results_20190304.mxd
LEGEND
Basemap: Bing Imagery, Microsoft Corporation°0 2,500 5,000
Feet1 inch = 5,000 feetScale 1:60,000
Data Source: Office of Geographic Information (MassGIS), Commonwealth of Massachusetts, Information Technology Division
GE 2.82-127 Wind TurbineGE 2.82-127 LNTE Wind Turbine
"" Non-Participating Receptor
"" Participating Receptor
"" Pending Participating Receptor
#0 Transformer (Assumed)Project BoundarySubstationPending Participation ParcelsParticipating Parcels
Leq Sound Level Modeling Results (dBA)
eq
35 45 5540 50
6.0 CONSTRUCTION NOISE
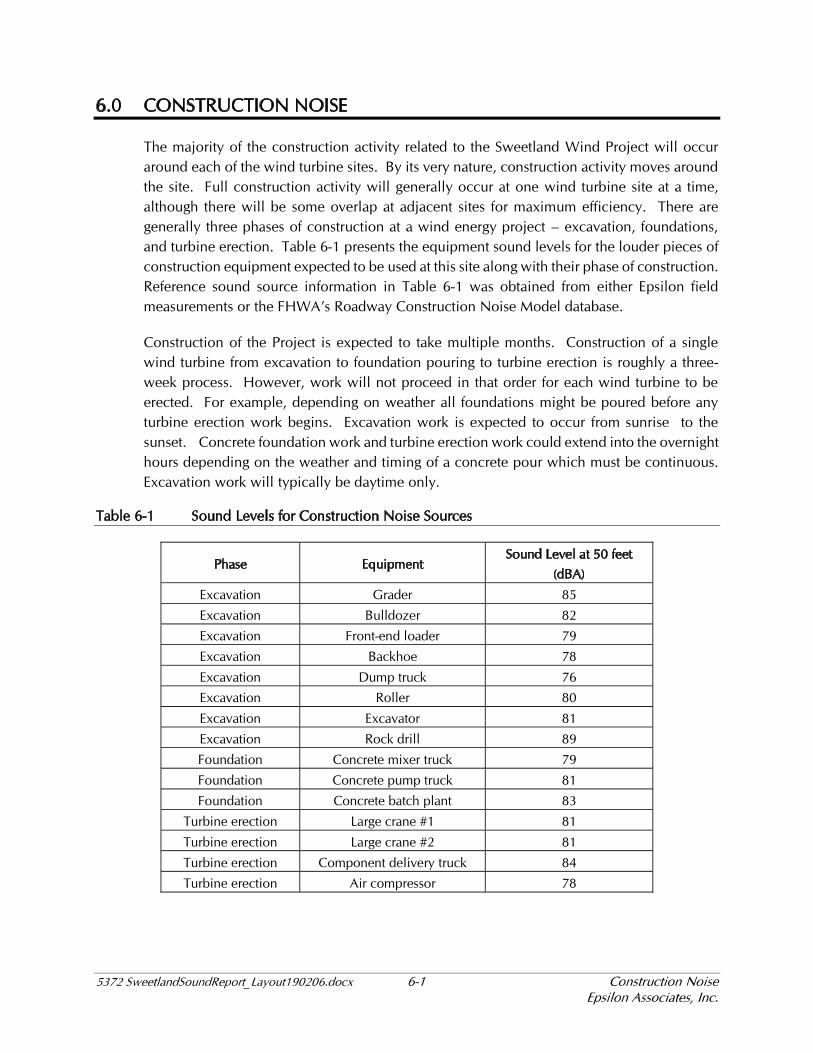
The majority of the construction activity related to the Sweetland Wind Project will occur around each of the wind turbine sites. By its very nature, construction activity moves around the site. Full construction activity will generally occur at one wind turbine site at a time, although there will be some overlap at adjacent sites for maximum efficiency. There are generally three phases of construction at a wind energy project – excavation, foundations, and turbine erection. Table 6-1 presents the equipment sound levels for the louder pieces of construction equipment expected to be used at this site along with their phase of construction. Reference sound source information in Table 6-1 was obtained from either Epsilon field measurements or the FHWA’s Roadway Construction Noise Model database.
Construction of the Project is expected to take multiple months. Construction of a single wind turbine from excavation to foundation pouring to turbine erection is roughly a three-week process. However, work will not proceed in that order for each wind turbine to be erected. For example, depending on weather all foundations might be poured before any turbine erection work begins. Excavation work is expected to occur from sunrise to the sunset. Concrete foundation work and turbine erection work could extend into the overnight hours depending on the weather and timing of a concrete pour which must be continuous. Excavation work will typically be daytime only.
Table 6-1 Sound Levels for Construction Noise Sources
Phase Equipment Sound Level at 50 feet
(dBA)
Excavation Grader 85
Excavation Bulldozer 82
Excavation Front-end loader 79
Excavation Backhoe 78
Excavation Dump truck 76
Excavation Roller 80
Excavation Excavator 81
Excavation Rock drill 89
Foundation Concrete mixer truck 79
Foundation Concrete pump truck 81
Foundation Concrete batch plant 83
Turbine erection Large crane #1 81
Turbine erection Large crane #2 81
Turbine erection Component delivery truck 84
Turbine erection Air compressor 78
6.0l CON§l!RUCT!ON NO!§IE
§ou111d levels for Co11strnctiollll Noise §mmces
!Phaise 1Eq1U1opme1111t
5372 Sweet/andSoundReport_ Layout7 90206.docx 6-1
§l(J)1UJ111d 11..evel at 51()) feet (d!BA)
Construction Noise Epsilon Associates, Inc.

7.0 EVALUATION OF SOUND LEVELS
7.1 Modeled Sound Levels
All modeled sound levels, as output from Cadna/A and presented in Appendix B, are A-weighted equivalent sound levels (Leq, dBA). These levels may be used in evaluating measured sound pressure levels over typical averaging durations, (i.e., ten (10) minutes or one (1) hour).
7.2 Evaluation
The Project is subject to the requirements contained in the Development Agreement. The sound level limits in this agreement are 50 dBA at participating occupied residences and 45 dBA at non-participating occupied residences. The predicted worst-case Leq sound levels from the Sweetland Wind Project are at or below the 50 dBA limit at all modeled participating receptors and below the 45 dBA limit at all modeled non-participating receptors.
A review of Table B-1 in Appendix B shows the highest Leq sound level for a non-participating receptor to be 43 dBA. Therefore, the Project meets the requirements with respect to sound in the Developer Agreement.
7.0l IEVAlUAl!ON Of §OUND llEVIEl§
5372 Sweet/andSoundReport_ Layout7 90206.docx 7-1 Evaluation of Sound Levels Epsilon Associates, Inc.

8.0 CONCLUSIONS
A comprehensive sound level analysis was conducted for the proposed Sweetland Wind Project within Hand County, South Dakota. A total of 71 wind turbines are proposed to be built for this Project. Sound levels resulting from the operation of 71 wind turbines and 15 alternates were calculated at 41 receptor points (occupied residences), and isolines were generated from a grid encompassing the area surrounding the wind turbines using the proposed layout. The Leq sound levels modeled at participating occupied receptors were at or below 50 dBA and sound levels modeled at non-participating occupied receptors were at or below 43 dBA. All Leq sound levels meet the respective limits of 50 dBA and 45 dBA. Therefore, the Project meets the requirements with respect to sound in the Development Agreement.
8.0l CONClUS!ONS
5372 Sweet/andSoundReport_ Layout7 90206.docx 8-1 Conclusions Epsilon Associates, Inc.

Appendix AWind Turbine Coordinates

Table A-1: Wind Turbine Coordinates (Layout 190206)
X (Easting) Y (Northing)1A GE 2.82-127 89 511012.21 4921687.082 GE 2.82-127 114 511453.33 4921859.463 GE 2.82-127 114 511870.19 4922038.854 GE 2.82-127 114 512321.24 4922032.655 GE 2.82-127 114 512774.51 4922174.476 GE 2.82-127 114 513244.56 4922123.897 GE 2.82-127 114 513710.73 4922151.638 GE 2.82-127 114 514128.93 4922358.669 GE 2.82-127 114 514543.93 4922430.56
10 GE 2.82-127 114 515045.88 4922458.4811 GE 2.82-127 114 510193.66 4919873.20
12A GE 2.82-127 89 510620.94 4920044.2713 GE 2.82-127 114 511176.44 4920385.9814 GE 2.82-127 114 511733.46 4920510.9315 GE 2.82-127 114 512198.31 4920625.6416 GE 2.82-127 114 512699.15 4920693.9117 GE 2.82-127 114 513119.71 4920762.3018 GE 2.82-127 114 513540.47 4920848.1019 GE 2.82-127 114 513970.65 4920934.8820 GE 2.82-127 114 514387.31 4921145.5021 GE 2.82-127 114 514905.57 4921284.7322 GE 2.82-127 114 515470.08 4921288.6123 GE 2.82-127 114 509603.78 4918211.7824 GE 2.82-127 114 510183.19 4918322.6625 GE 2.82-127 114 510600.13 4918502.7227 GE 2.82-127 114 511405.11 4918917.0628 GE 2.82-127 114 511804.96 4919001.7529 GE 2.82-127 114 512229.95 4919082.9530 GE 2.82-127 114 512672.33 4919240.3631 GE 2.82-127 114 513058.38 4919293.0632 GE 2.82-127 114 513537.27 4919326.9033 GE 2.82-127 114 513931.55 4919533.2234 GE 2.82-127 114 514321.46 4919691.2435 GE 2.82-127 114 514711.34 4919849.2936 GE 2.82-127 114 515101.21 4920007.2537 GE 2.82-127 114 510243.63 4916605.5338 GE 2.82-127 114 510579.50 4916943.2939 GE 2.82-127 89 511017.08 4917250.3640 GE 2.82-127 114 511418.75 4917354.6941 GE 2.82-127 114 511845.57 4917412.6642 GE 2.82-127 LNTE 89 512265.78 4917475.4243 GE 2.82-127 LNTE 114 512815.20 4918054.2744 GE 2.82-127 114 513429.64 4917481.6445 GE 2.82-127 89 513853.67 4917471.4646 GE 2.82-127 89 514702.38 4918039.8247 GE 2.82-127 114 515021.66 4918255.1348 GE 2.82-127 89 515255.92 4918559.9449 GE 2.82-127 114 515168.17 4916854.45
Wind Turbine IDCoordinates NAD83 UTM Zone 14N
(meters)Wind Turbine TypeHub
Height (m)
Page 1 of 2
HIUlb Coordimntes NAD83 IUlM Zone 141-N
Won11d l1U1rbi111e m WoD11d l1U11·biD11e lype Height (m) (meters)
X (1EastiD11W Y (Northi111w

Table A-1: Wind Turbine Coordinates (Layout 190206)
X (Easting) Y (Northing)
Wind Turbine IDCoordinates NAD83 UTM Zone 14N
(meters)Wind Turbine TypeHub
Height (m)
50 GE 2.82-127 114 515469.25 4917120.1751 GE 2.82-127 114 515962.07 4917348.5352 GE 2.82-127 114 516365.98 4917651.2553 GE 2.82-127 114 516911.45 4917557.3454 GE 2.82-127 114 517426.35 4917351.1155 GE 2.82-127 114 517943.89 4917497.1056 GE 2.82-127 114 511042.17 4914893.7157 GE 2.82-127 114 511469.67 4914971.9758 GE 2.82-127 114 511894.42 4915162.7959 GE 2.82-127 114 512305.67 4915277.9560 GE 2.82-127 114 512803.14 4915317.0261 GE 2.82-127 114 513621.17 4914858.5662 GE 2.82-127 114 513970.70 4915157.3564 GE 2.82-127 114 515484.40 4915543.4765 GE 2.82-127 89 515930.55 4915748.62
66A GE 2.82-127 89 516423.31 4916038.9467 GE 2.82-127 114 516827.22 4916161.8768 GE 2.82-127 114 517706.12 4915026.4369 GE 2.82-127 114 516494.56 4914281.4070 GE 2.82-127 114 517021.22 4914069.27
71A GE 2.82-127 114 517443.63 4914133.4572 GE 2.82-127 114 517815.36 4914019.5173 GE 2.82-127 114 517461.35 4911864.4574 GE 2.82-127 89 517789.29 4912125.25
76A GE 2.82-127 114 517721.01 4910983.2977A GE 2.82-127 114 518892.06 4912070.4577P GE 2.82-127 114 518901.20 4910709.1778P GE 2.82-127 114 519264.70 4910797.2479P GE 2.82-127 114 519563.99 4910955.4980A GE 2.82-127 89 519848.54 4911253.4381A GE 2.82-127 114 511384.00 4916015.7482A GE 2.82-127 89 512244.18 4916438.2684A GE 2.82-127 114 515973.83 4913442.1285A GE 2.82-127 114 516278.60 4913679.9586A GE 2.82-127 114 515116.95 4912318.9287A GE 2.82-127 89 515575.65 4912534.4988A GE 2.82-127 114 517882.92 4912011.9689A GE 2.82-127 114 520332.80 4911161.95
Page 2 of 2
HIUlb Coordimntes NAD83 IUlM Zone 141-N
Won11d l1U1rbi111e m WoD11d l1U11·biD11e lype Height (m) (meters)
X (1EastiD11W Y (Northi111w

Appendix BPredicted Sound Levels at Occupied Residences
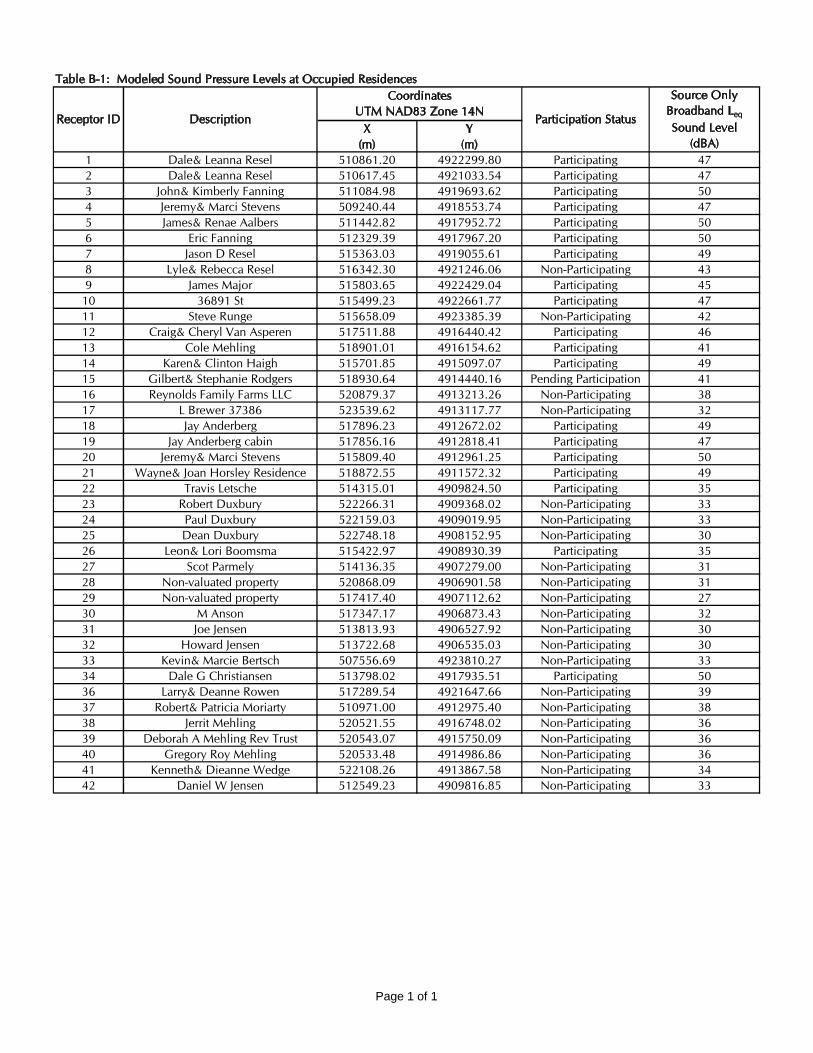
Table B-1: Modeled Sound Pressure Levels at Occupied Residences
X(m)
Y(m)
1 Dale& Leanna Resel 510861.20 4922299.80 Participating 472 Dale& Leanna Resel 510617.45 4921033.54 Participating 473 John& Kimberly Fanning 511084.98 4919693.62 Participating 504 Jeremy& Marci Stevens 509240.44 4918553.74 Participating 475 James& Renae Aalbers 511442.82 4917952.72 Participating 506 Eric Fanning 512329.39 4917967.20 Participating 507 Jason D Resel 515363.03 4919055.61 Participating 498 Lyle& Rebecca Resel 516342.30 4921246.06 Non-Participating 439 James Major 515803.65 4922429.04 Participating 45
10 36891 St 515499.23 4922661.77 Participating 4711 Steve Runge 515658.09 4923385.39 Non-Participating 4212 Craig& Cheryl Van Asperen 517511.88 4916440.42 Participating 4613 Cole Mehling 518901.01 4916154.62 Participating 4114 Karen& Clinton Haigh 515701.85 4915097.07 Participating 4915 Gilbert& Stephanie Rodgers 518930.64 4914440.16 Pending Participation 4116 Reynolds Family Farms LLC 520879.37 4913213.26 Non-Participating 3817 L Brewer 37386 523539.62 4913117.77 Non-Participating 3218 Jay Anderberg 517896.23 4912672.02 Participating 4919 Jay Anderberg cabin 517856.16 4912818.41 Participating 4720 Jeremy& Marci Stevens 515809.40 4912961.25 Participating 5021 Wayne& Joan Horsley Residence 518872.55 4911572.32 Participating 4922 Travis Letsche 514315.01 4909824.50 Participating 3523 Robert Duxbury 522266.31 4909368.02 Non-Participating 3324 Paul Duxbury 522159.03 4909019.95 Non-Participating 3325 Dean Duxbury 522748.18 4908152.95 Non-Participating 3026 Leon& Lori Boomsma 515422.97 4908930.39 Participating 3527 Scot Parmely 514136.35 4907279.00 Non-Participating 3128 Non-valuated property 520868.09 4906901.58 Non-Participating 3129 Non-valuated property 517417.40 4907112.62 Non-Participating 2730 M Anson 517347.17 4906873.43 Non-Participating 3231 Joe Jensen 513813.93 4906527.92 Non-Participating 3032 Howard Jensen 513722.68 4906535.03 Non-Participating 3033 Kevin& Marcie Bertsch 507556.69 4923810.27 Non-Participating 3334 Dale G Christiansen 513798.02 4917935.51 Participating 5036 Larry& Deanne Rowen 517289.54 4921647.66 Non-Participating 3937 Robert& Patricia Moriarty 510971.00 4912975.40 Non-Participating 3838 Jerrit Mehling 520521.55 4916748.02 Non-Participating 3639 Deborah A Mehling Rev Trust 520543.07 4915750.09 Non-Participating 3640 Gregory Roy Mehling 520533.48 4914986.86 Non-Participating 3641 Kenneth& Dieanne Wedge 522108.26 4913867.58 Non-Participating 3442 Daniel W Jensen 512549.23 4909816.85 Non-Participating 33
Receptor ID
CoordinatesUTM NAD83 Zone 14N
Participation Status
Source Only Broadband Leq
Sound Level(dBA)
Description
Page 1 of 1
lal>ie ~-1: Modeled Sound Pressure Levels at Occupied Residences
Coordi111ates Source Only
Receptor m !Description 11.JlM NAID83 Zone UN
Participation Status ~roadl>and Leq
X y Sound Level (m) (m) (d~A)