appendix 4: sound survey and analysis report
TRANSCRIPT
Appendix 4:
Sound Survey and Analysis Report

Sound Survey and
Analysis Report PROPOSED WIND ENERGY FACILITY BREWSTER, MASSACHUSETTS PREPARED FOR Cape & Vineyard Electric Cooperative, Inc. P.O. Box 427 Barnstable, Massachusetts 02630 PREPARED BY ESS Group, Inc. 888 Worcester Street, Suite 240 Wellesley, Massachusetts 02482 Project No. W279-000.3 August 2010
¶
ESS Group, Inc. © 2010 – This document or any part may not be reproduced or transmitted in any form or by any means, electronic, or mechanical, including photocopying, microfilming, and recording without the express written consent of ESS Group, Inc. All rights reserved.
SOUND SURVEY AND ANALYSIS REPORT PROPOSED WIND ENERGY FACILITY
IN THE TOWN OF BREWSTER, MASSACHUSETTS CAPE & VINEYARD ELECTRIC COOPERATIVE, INC.
Prepared For:
Cape & Vineyard Electric Cooperative, Inc. P.O. Box 427
Barnstable, Massachusetts 02630
Prepared By:
ESS Group, Inc. 888 Worcester Street, Suite 240 Wellesley, Massachusetts 02482
ESS Project No. W279-000.3
August 2010

¶
Copyright © ESS Group, Inc., 2010 j:\w279-000-weston-sampson-cvec-brewster\noise\report\noise-report-cvec-brewster-2010-0922-rev3.doc
TABLE OF CONTENTS SECTION PAGE EXECUTIVE SUMMARY
1.0 INTRODUCTION......................................................................................................................... 1 1.1 Concepts of Environmental Sound................................................................................... 1 1.2 Applicable Noise Standards and Regulations..................................................................... 2
2.0 EXISTING ENVIRONMENT.......................................................................................................... 3 2.1 Field Methodology ......................................................................................................... 3 2.2 Measurement Locations.................................................................................................. 3 2.3 Measurement Results: Long-term Site ............................................................................. 4 2.4 Effects of Wind Speed on Ambient Sound Levels .............................................................. 5 2.5 Measurement Results: Short-term Sites ........................................................................... 6
3.0 MODELING METHODOLOGY AND ASSUMPTIONS ......................................................................... 7 3.1 Noise Prediction Model ................................................................................................... 7 3.2 Input to the Noise Prediction Model................................................................................. 8
4.0 OPERATIONAL NOISE FROM THE WIND ENERGY FACILITY .......................................................... 8
5.0 NOISE IMPACT ASSESSMENT ..................................................................................................... 9
6.0 CONCLUSIONS........................................................................................................................ 11 TABLES Table 1 Examples of Common Indoor and Outdoor Sound Pressure Levels Table 2 Summary of Short-term Ambient Sound Measurements: Daytime Table 3 Summary of Short-term Ambient Sound Measurements: Nighttime Table 4 Calculated Project Sound Levels and Ambient Sound Levels at High Wind Speeds at
Community Locations Table 5 Calculated Project Sound Levels and Ambient Sound Levels at Low Wind Speeds at
Community Locations Table 6 Calculated Project Sound Levels and Ambient Sound Levels at High Wind Speeds Along
the Property Line Table 7 Calculated Project Sound Levels and Ambient Sound Levels at Low Wind Speeds Along
the Property Line Table 8 Calculated Project Ldn at Sustained High Wind Speeds and Ambient Ldn at the Property
Line Table 9 Calculated Project Ldn at Sustained Low Wind Speeds and Ambient Ldn at the Property
Line FIGURES Figure 1 Example of Time Varying Sound Levels and Descriptive Noise Metrics Figure 2 Locations of Ambient Sound Measurement Sites and Prediction Sites Figure 3 Measured Hourly Ambient Sound Levels at the Long-term Site Figure 4 Measured Hourly L90 and Hourly Wind Speed at 10 meters Vs Time

¶
TABLE OF CONTENTS (Continued) SECTION PAGE
Copyright © ESS Group, Inc., 2010 j:\w279-000-weston-sampson-cvec-brewster\noise\report\noise-report-cvec-brewster-2010-0922-rev3.doc
Figure 5 Measured Hourly L90 as a Function of Wind Speed at 10 meters with Linear Regression Curve Figure 6 Projected Increase in Ambient (L90) Sound Levels at the Short-term Measurement Sites
(ST1 to ST5) and at Four Locations along the Property Line (PL1 to PL4) Figure 7 Predicted Sound Pressure Level (dBA) at High Wind Speeds Figure 8 Predicted Sound Pressure Levels (dBA) at Low Wind Speeds
¶
Copyright © ESS Group, Inc., 2010 j:\w279-000-weston-sampson-cvec-brewster\noise\report\noise-report-cvec-brewster-2010-0922-rev3.doc
EXECUTIVE SUMMARY
Predicted noise levels from full operation of the proposed wind energy facility were evaluated with respect to applicable state and local noise regulations for both high wind speed conditions and low wind speed conditions. Operational noise was assessed at the property line of the proposed facility and at the closest noise-sensitive land use in the surrounding community. Based on the results of this noise assessment, ambient sound levels (expressed in terms of the hourly L90) at community locations are expected to increase by 0 to 2 decibels under high wind speed conditions and by 1 to 4 decibels under low wind speed conditions. Along the property line of the proposed facility, ambient sound levels are expected to increase by 0 to 3 decibels under high wind speed conditions and by 1 to 5 decibels under low wind speed conditions. These results demonstrate compliance with the applicable noise regulations.
Assumptions used in the analysis result in a conservative estimate of the projected increase in ambient sound levels. The projected sound levels due to operation of the wind turbines exclude the effects of excess attenuation due to propagation over acoustically “soft” ground and the excess attenuation due to ground vegetation. Also, the sound propagation algorithms within the noise prediction model assume an omni-directional downwind condition. That is, although it is physically impossible, the noise prediction model assumes that every point for which a sound level is computed is downwind of a turbine. These first two assumptions yield projections of wind turbine noise levels are conservatively “high.” Finally, the projected noise levels due to the wind turbines were compared to conservatively “low” values of the ambient sound level. In some cases, ambient sound levels were obtained during periods of time for which observed wind speeds were below the cut-in wind speed of the wind turbine. Since increases in wind speeds generally produce increases in ambient sound levels, ambient sound levels at some of the community locations are expected to be higher at the cut-in wind speed than what was measured. So although the wind turbines would not be operating at speeds below the cut-in wind speed (and so would not produce any sound), another level of conservatism was added to the noise assessment by comparing operational noise levels from the turbines to these conservatively “low” values of the ambient sound level.

¶
Copyright © ESS Group, Inc., 2010 j:\w279-000-weston-sampson-cvec-brewster\noise\report\noise-report-cvec-brewster-2010-0922-rev3.doc
1.0 INTRODUCTION
ESS Group Inc. (ESS) has prepared this Noise Study Report for the proposed Brewster Wind Turbine Project (Project) for the Cape & Vineyard Electric Cooperative (CVEC). The report provides background information on concepts related to environmental sound, including descriptions of the noise metrics used throughout the report, the applicable noise standards and regulations, the results of the ambient sound measurement program, predicted noise levels from full load operation of the wind energy facility, and an assessment of the potential noise impacts of the Project.
1.1 Concepts of Environmental Sound
Sounds are generated by a variety of sources i.e. – a musical instrument, a voice speaking, or an airplane that passes overhead. Energy is required to produce sound and this sound energy is transmitted through the air in the form of sound waves – tiny, quick oscillations of pressure just above and just below atmospheric pressure. These oscillations, or sound pressures, impinge on the ear, creating the sound we hear. The range of sound pressures that can be detected by a person with normal hearing is very wide, ranging from about 20 micro-pascals (µPa) for very faint sounds at the threshold of hearing to nearly 10 million µPa for extremely loud sounds, such as a jet during take-off at a distance of 300 feet. Because the range of human hearing is so wide, sound levels are reported using “sound pressure levels” which are expressed in terms of decibels. The sound pressure level in decibels is the logarithm of the ratio of the sound pressure of the source to the reference sound pressure of 20 µPa, multiplied by 20.1
Table 1 provides some examples of common sources of sound and their sound pressure levels. All sound levels in this assessment are provided in A-weighted decibels, abbreviated “dB(A)” or “dBA.” The A-weighted sound level reflects how the human ear responds to sound. In the context of environmental sound, noise is defined as “unwanted sound.”
In the sections that follow, measured and predicted sound pressure levels are summarized utilizing the noise metrics described below and expressed in terms of A-weighted decibels.
“L10” is the sound level that is exceeded for 10-percent of time and is a measure of the intrusiveness of relatively short-duration noise events that occurred during the period.
“Leq” is the value or level of a steady, non-fluctuating sound that represents the same sound energy as the actual time-varying sound evaluated over the same time period.
“L50” is the sound level that is exceeded for 50-percent of time and is useful in understanding the audibility of power plants and industrial facilities.
1 The sound pressure level (“Lp”) in decibels (“dB”) corresponding to a sound pressure (“p”) is given by the following equation: Lp = 20 log10 ( p / pref); Where: p = the sound pressure in µPa; and pref = the reference sound pressure of 20 µPa.
Sound Survey and Analysis Report
August 2010
Page 2 Copyright © ESS Group, Inc., 2010 j:\w279-000-weston-sampson-cvec-brewster\noise\report\noise-report-cvec-brewster-2010-0922-rev3.doc
“L90” is the sound level that is exceeded for 90-percent of time and is a measure of the background or residual sound levels in the absence of recurring noise events.
“Ldn”, or the Day-Night Average Sound Level, is a 24-hour energy-average sound level with a 10-decibel weighting applied to sound levels in the nine nighttime hours from 10:00 p.m. to 7:00 a.m.
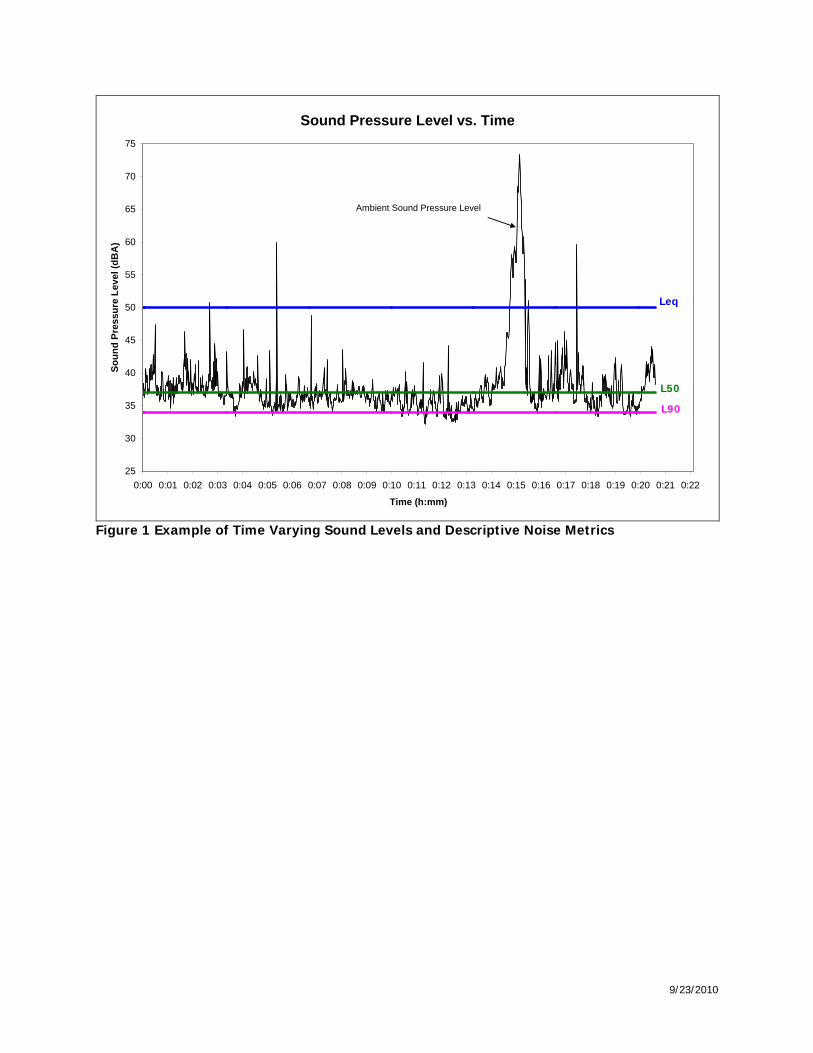
Figure 1 provides a graphic representation of the various noise metrics described above. The curve shown by the thin black line in the graph of Figure 1 represents the fluctuating 1-second sound pressure levels over a measurement period of roughly 20 minutes. The fluctuating sound pressure levels range from the mid 30’s to the mid 70’s and are expressed in terms of A-weighted decibels. The blue thick line in the graph represents the Leq for the measurement period and contains the same sound energy as the actual time-varying sound. For the measurement period in the graph, the Leq is 50 dBA. Three statistical noise metrics are also depicted on the graph. For the measurement period shown in Figure 1, the values of the L10, L50, and L90 are 41 dBA, 37 dBA, and 34 dBA, respectively.
1.2 Applicable Noise Standards and Regulations
Applicable noise standards for the Town of Brewster are contained within the Zoning Regulations.2 Section 179-40.2.E(6) and provides that the noise level at the lot line may not exceed 10 dBA over the ambient sound level and must comply with the existing Town of Brewster Noise Bylaw.3 The local standard in the Zoning Regulations is consistent with the Massachusetts Department of Environmental Protection (MassDEP) noise regulation, which is contained in 310 CMR 7.10. According to MassDEP, a source of sound violates the Department’s noise regulation if the source:
Increases the broadband sound level by more than 10 dB(A) above ambient; or
Produces a “pure tone” condition – when any octave band center frequency sound pressure level exceeds the two adjacent center frequency sound pressure levels by 3 decibels or more.
The MassDEP criteria are evaluated both at the property line and at the nearest inhabited residence or other sensitive land use. “Ambient” is defined as the background A-weighted sound level that is exceeded 90% of the time, measured during equipment operating hours.
The results of an ambient sound measurement program are presented in the following section. The objective of the program is to document background (ambient) sound levels in the vicinity of the proposed wind energy facility in the Town of Brewster. The results of the measurement program serve to establish a baseline against which to assess the potential noise impacts of the Project.
2 The Code of the Town of Brewster, Massachusetts, v29 Updated 7-15-2009 / Part II General Legislation / Chapter 179, Zoning / Article IX, Special Regulations / § 179-40.2. Wind energy turbines. 3 The Code of the Town of Brewster, Massachusetts, v29 Updated 7-15-1999 / Part II General Legislation / Chapter 125, Noise.

Sound Survey and Analysis Report
August 2010
Page 3 Copyright © ESS Group, Inc., 2010 j:\w279-000-weston-sampson-cvec-brewster\noise\report\noise-report-cvec-brewster-2010-0922-rev3.doc
2.0 EXISTING ENVIRONMENT
ESS personnel performed ambient sound level measurements at six locations to characterize the existing acoustic environment in the vicinity of the proposed wind energy facility. The results of the ambient sound measurements serve as the basis for assessing the potential noise impacts of the Project. This section summarizes the methodologies used by ESS personnel during the measurement program, describes the measurement sites, and presents the results of the measurement program.
2.1 Field Methodology
Ambient sound measurements at five community locations were performed using a Larson Davis Model 831 precision integrating sound level meter that meets the requirements of American National Standards Institute (ANSI) Standards for Type I instruments. Ambient sound measurements on the site of the proposed Project were performed using a Larson Davis Model 824 precision integrating sound level meter that also meets the ANSI standards for Type I instruments. In both cases, the microphone was fitted with a windscreen and set upon a tripod at a height of 5 feet above ground, and located out of the influence of any vertical reflecting surfaces. The sound level meters were calibrated at the beginning and end of the measurement period using either Larson Davis Model CAL200, or Model CAL250, acoustic calibrators following procedures that are traceable to the National Institute of Standards and Technology (NIST). The sound level meters were programmed to sample and store A-weighted sound level data including equivalent sound levels (Leq) and percentile levels (L1, L10, L33, L50, L90, and L99).
Ambient sound level measurements were performed for the period from April 23 to 26, 2010. Historical weather observations for the measurement period were obtained from the permanent weather station at Chatham Municipal Airport (CQX). Throughout the measurement period, there was little or no precipitation,4 temperatures ranged from the mid 40s at night to the low 60s (degrees Fahrenheit) during the day, and surface wind speeds generally ranged from 0 to 16 mph (0 to 7.2 m/s).
2.2 Measurement Locations
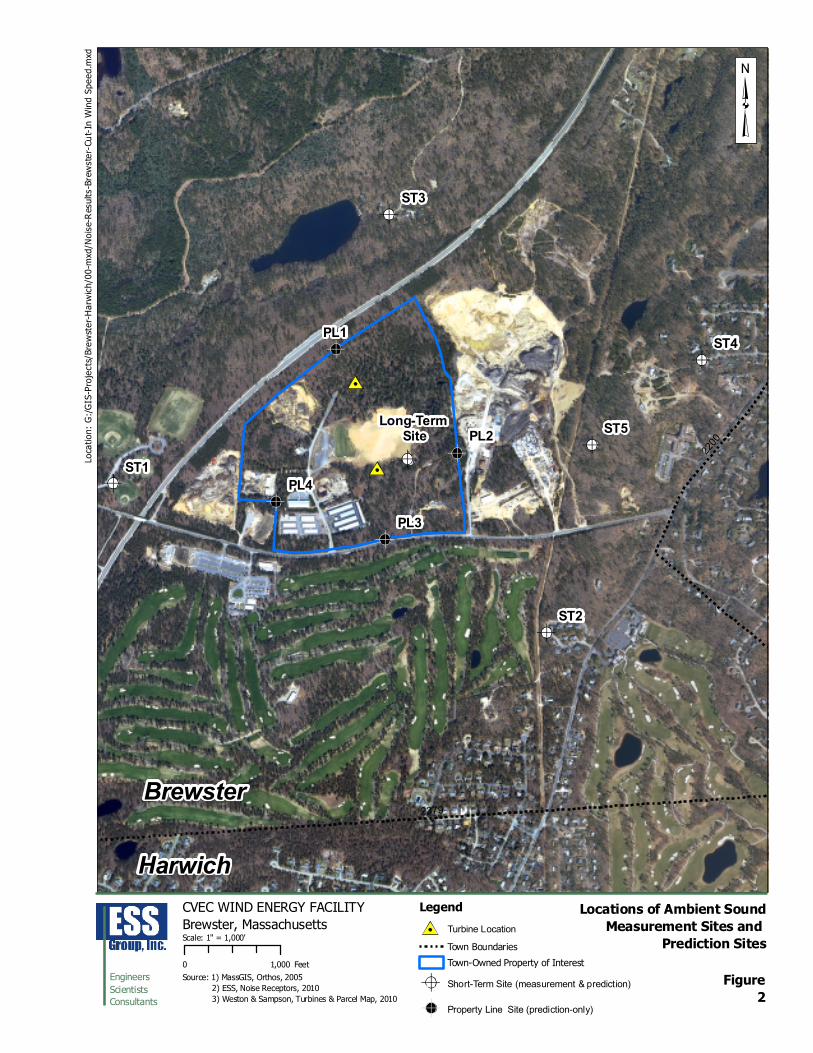
Long-term, unattended noise measurements were performed at one location on the site of the proposed Project. This measurement site (Site LT) was located in the southeast corner of the driving range on town-owned land within Commerce Park. The long-term monitoring site is shown on Figure 2. The results of the long-term sound measurements were used to understand the effects of area-wide wind speeds on ambient sound levels.
Additional short-term, attended ambient sound measurements were performed at five locations in the communities surrounding the Project site. The short-term sites were selected to be representative of closest noise-sensitive land use in the vicinity of the proposed wind energy facility. Short-term
4 Based on hourly observations at CQX, trace amounts of precipitation were recorded during the hours of 10:00 a.m. and 11:00 a.m. on Sunday, April 25th. Precipitation in trace amounts to as much as 0.02 inches per hour also occurred during several one-hour periods on the morning of Monday, April 26th.
Sound Survey and Analysis Report
August 2010
Page 4 Copyright © ESS Group, Inc., 2010 j:\w279-000-weston-sampson-cvec-brewster\noise\report\noise-report-cvec-brewster-2010-0922-rev3.doc
measurements of 20-minutes in duration were made at each community site both for typical daytime periods (between 7:00 a.m. and 10:00 p.m.) and for typical nighttime periods (between 10:00 p.m. and 7:00 a.m.).5 The short-term (ST) locations are mapped on Figure 2 and described below:
Site ST1: at the baseball fields on Freemans Way located approximately 2,760 feet from the closest turbine, representing the closest noise-sensitive land use to the west of the Project;
Site ST2: at the west end of Huckleberry Lane located approximately 2,460 feet from the closest turbine, representing the closest residential land use to the southeast of the Project;
Site ST3: at the west end of Nan-Ke-Rafe Path and north of Route 6, located approximately 1,800 feet from the closest turbine, representing the closest residential land use to the north of the Project;
Site ST4: at the west end of Timber Lane Drive located approximately 3,570 feet from the closest turbine, representing the closest residential land use to the east of the Project; and
Site ST5: at the north end of Old Mansion Road located approximately 2,250 feet from the closest turbine, at the location of an assisted living facility.
Figure 2 also shows the location of four “prediction-only” sites along the property lines of the proposed Facility (shown with a “PL” prefix). All of the sites shown in Figure 2 were included in the modeling, as discussed later in Sections 4 and 5.
2.3 Measurement Results: Long-term Site
Figure 3 provides a graph of the measured hourly sound levels at the long-term site over the period from April 23 to April 26, 2010. As shown in the graph, the on-site ambient sound levels exhibit strong diurnal patterns with higher ambient sound levels observed during daytime hours and lower levels at night. Measured hourly ambient sound levels ranged from 36 to 57 dBA Leq and from 35 to 52 dBA L90. Observed sources of noise that contributed to the existing acoustic environment at the long-term site included wind in the trees, distant traffic on local roads, birds, and activity at the sand pit abutting the Project site to the east.
The measured hourly L90 reached its minimum value of 35 dBA in the early morning hours of Saturday, April 24th, and again during the early morning hours of Monday, April 26th. As demonstrated in the paragraphs that follow, during these time periods when the measured L90 reached its minimum values, observed wind speeds were below the cut-in wind speed of the turbine.
The measured hourly L90 reached its maximum value of 51 dBA on the afternoon of Friday, April 23rd, and approached 50 dBA during the mid-morning hours of Monday, April 26th. During the deployment of the monitor on the afternoon of April 23rd, ESS personnel observed that the major sources of ambient sound included wind-in-the-trees and distant traffic. On the afternoon of April 27th, ESS
5 Due to limited site access, nighttime ambient sound measurements were not performed at Site ST2 or Site ST3.
Sound Survey and Analysis Report
August 2010
Page 5 Copyright © ESS Group, Inc., 2010 j:\w279-000-weston-sampson-cvec-brewster\noise\report\noise-report-cvec-brewster-2010-0922-rev3.doc
personnel observed that activity at the sand pit to the east of the Project site contributed to ambient sound levels at the long-term site.
2.4 Effects of Wind Speed on Ambient Sound Levels
To provide an understanding of the effect of area-wide wind speeds on ambient sound levels, observed wind speeds and directions for the measurement period were obtained from several sources including an on-site wind anemometer, the permanent weather station at Chatham Municipal Airport (CQX), the permanent weather station at Barnstable Municipal Airport (HYA), and from an anemometer at Cape Cod Regional Technical High School in Harwich, Massachusetts. The best correlation of measured wind speeds and ambient sound levels (expressed in terms of the hourly L90) were based on the observed wind speeds obtained from the high school’s anemometer. Since the high school’s anemometer is at a height of 25 feet (7.6 meters) above ground,6 measured wind speed data were normalized to a standard height of 10 meters above ground using the “power law” equation7 and a site-specific wind shear factor of 0.330.8
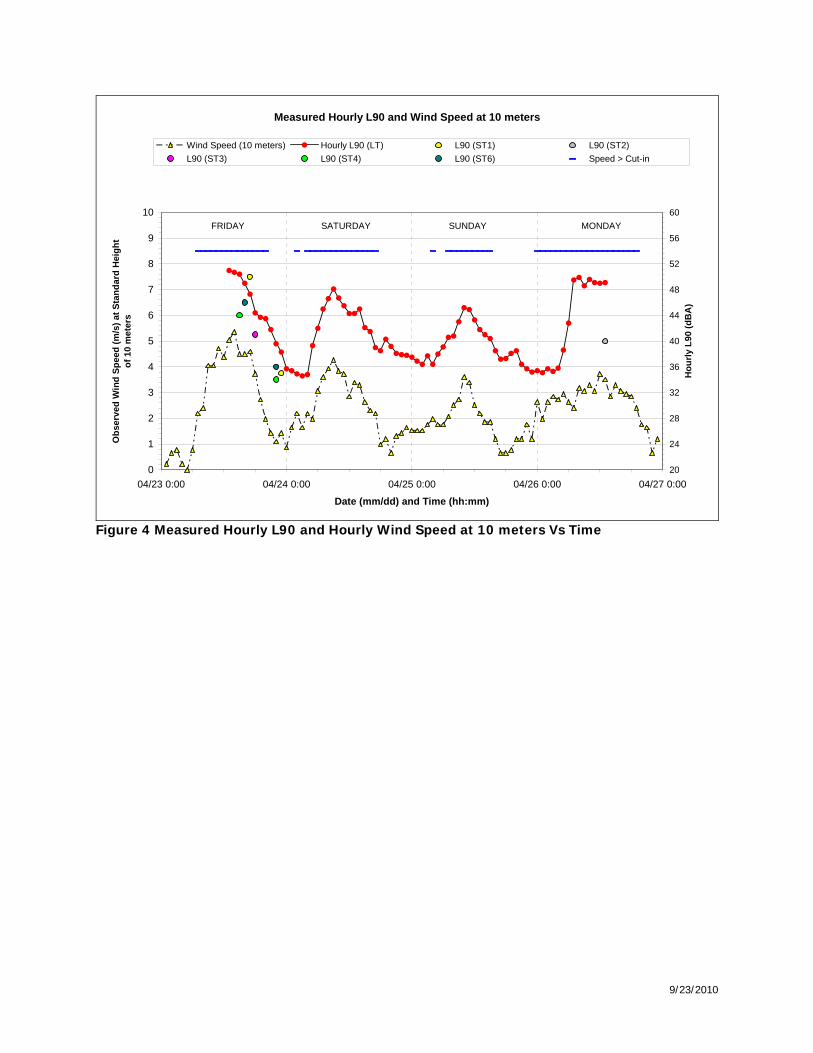
As shown in Figure 4, the measured hourly ambient sound levels show good correlation with the observed wind speeds from the anemometer installed at the high school. This figure also shows the hours for which the wind speed at the standard height of 10 meters exceeded the mechanical cut-in wind speed of the turbine.9 Observed wind speeds exceeded the cut-in wind speed of the turbine for slightly more that half the duration of the noise monitoring period. During the hours when wind speeds exceeded the cut-in wind speed of the turbine, ambient sound levels at the long-term site ranged from 35 to 51 dBA L90.
Ambient sound levels at the long-term site were not observed to fall below 35 dBA L90 even during nighttime periods when observed wind speeds were below the cut-in wind speed of the turbine.
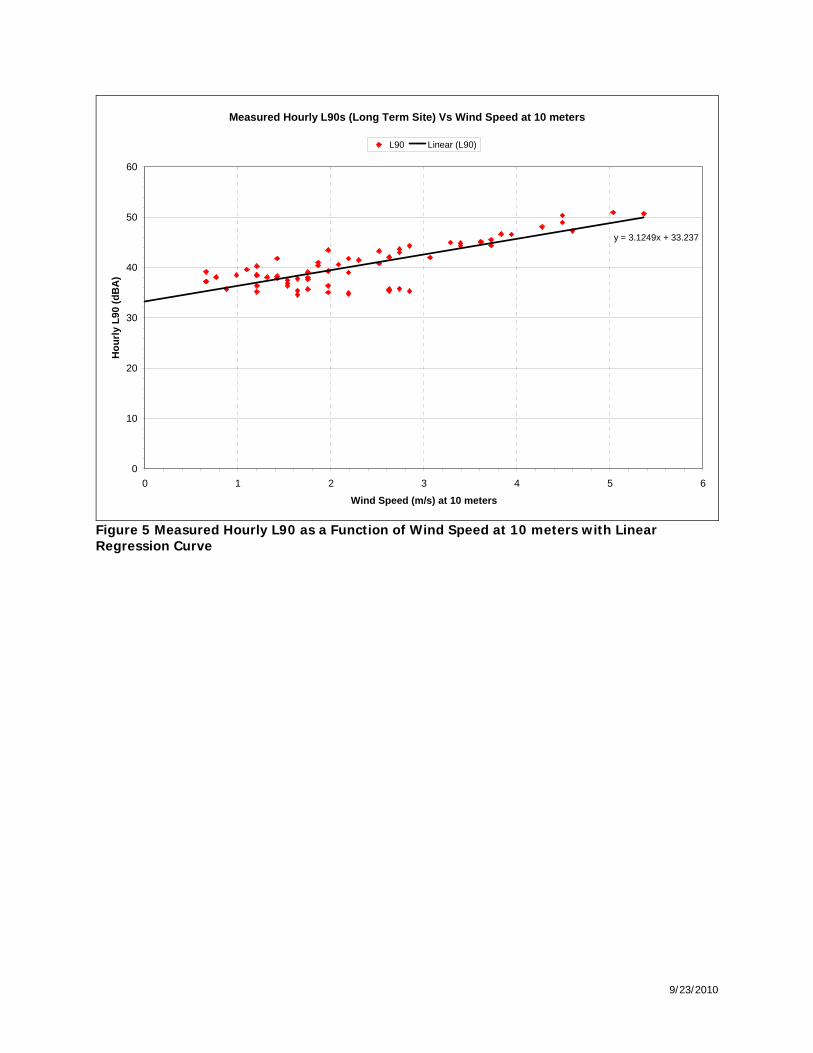
Figure 5 shows a linear regression of the measured hourly L90s and the observed wind speeds normalized to a standard height of 10 meters. The wind speeds at 10 meters were derived from the power law equation and observed wind speeds at the high school. This regression curve was used to provide an estimate of ambient sound levels (L90) for wind speeds that were not observed during the noise measurement period, in particular for higher wind speeds at which the turbine produces its maximum sound power level.
6 Based on a phone conversation with staff in the electrical department at the high school. 7 The wind speeds at 10 meters were derived from the “power law” equation, as shown below [Manwell, J.F., McGowan, J.G., and Rogers, A.L., Wind Energy Explained, John Wiley & Sons, Ltd., 2002, pp. 44-45]: Uz = Uz,ref * ( (Z) / (Zref) )A
Where: Uz = wind speed at height, Z, above ground; Uz,ref = wind speed at reference height, Zref, above ground; Z = height above ground; Zref = reference height above ground (10 meters); and A = wind shear 8 “Town of Brewster Wind Turbine Feasibility Study,” Black & Veatch, June 15, 2009. 9 The mechanical cut-in wind speed of the Vestas V90 is 3.5 m/s at hub height. This is equivalent to a wind speed of 1.8 m/s at the standard height of 10 meters, using the methods described in the preceding paragraph.

Sound Survey and Analysis Report
August 2010
Page 6 Copyright © ESS Group, Inc., 2010 j:\w279-000-weston-sampson-cvec-brewster\noise\report\noise-report-cvec-brewster-2010-0922-rev3.doc
The measurement results at the long-term site were used as conservative estimates of the ambient sound levels along the property line of the proposed Facility. The long-term site was located within the boundary of the proposed Facility, away from sources of noise that would yield higher levels of ambient sound (such as traffic on Route 6, traffic on Freemans Way, or activity at the gravel pit to the east). The location of the long-term site adds a level of conservatism to the impact assessment, as ambient sound levels along the property line are expected to be higher than the ambient sound levels at the long-term site. Using the equation for the regression curve shown in Figure 5, the on-site ambient sound level at higher wind speeds (6 m/s or more at 10 meters),10 the on-site ambient sound level is estimated to be 52 dBA L90.
2.5 Measurement Results: Short-term Sites
Table 2 provides a summary of the measured ambient sound levels at the short-term sites for typical daytime periods, while Table 3 summarizes the measured ambient sound levels for typical nighttime periods.
Site ST1 was located to the west of the Project site. Measured ambient sound levels ranged from 35 dBA L90 for a typical nighttime period to 50 dBA L90 for a typical daytime period. In general, ambient sound levels at Site ST1 were higher than the ambient at each of the other short-term sites. Sources of noise contributing to the acoustic environment at Site ST1 included traffic on Freemans Way, traffic on Route 6, and wind in the trees. During the daytime period, the observed wind speed was 4.6 m/s at the standard height of 10 meters. For the nighttime period, the observed wind speed was 1.4 m/s at the standard height, which is below the cut-in speed of the turbine at hub height.
Site ST2 was located to the southeast of the Project site. The measured ambient sound level for a typical daytime period was 40 dBA L90. Sources of noise contributing to the daytime acoustic environment at Site ST2 included wind in the trees, birds, distant heavy equipment, as well as distant traffic on Freemans Way and Route 137. During this measurement period, the observed wind speed was 3.5 m/s at the standard height of 10 meters, which is slightly above the cut-in wind speed of the turbine at hub height. Nighttime ambient sound levels were not measured at Site ST2 due as access was limited.
Site ST3 was located to the north of the Project site and to the north of Route 6. The measured ambient sound level for a typical daytime period at this site was 41 dBA L90. Sources of noise contributing to the daytime acoustic environment at Site ST3 included wind in the trees, birds, and distant traffic on Route 6. During this measurement period, the observed wind speed was 3.7 m/s at the standard height of 10 meters, which is slightly above the cut-in wind speed of the turbine at hub height. Nighttime ambient sound levels were not measured at Site ST3 due to limited access.
10 Based on the information provided by Vestas, the A-weighted sound power level of the V90 is 100 dBA at a wind speed of 4 m/s at the standard height of 10 meters and increases to a value of 103 dBA at a wind speed of 6 m/s at 10 meters. The sound power level of the turbine remains constant at 103 dBA for wind speeds from 6 to 14 m/s at the standard height of 10 meters. Note that the mechanical cut-in speed of the turbine is 3.5 m/s at hub height, which corresponds to a wind speed of 1.8 m/s at 10 meters. Also note that sound power level data were not available for wind speeds below 4 m/s at 10 meters.

Sound Survey and Analysis Report
August 2010
Page 7 Copyright © ESS Group, Inc., 2010 j:\w279-000-weston-sampson-cvec-brewster\noise\report\noise-report-cvec-brewster-2010-0922-rev3.doc
Site ST4 was located to the east of the Project site. Measured ambient sound levels ranged from 34 dBA L90 for a typical nighttime period to 44 dBA L90 for a typical daytime period. Sources of noise contributing to the acoustic environment at Site ST4 included distant traffic on Route 6, vehicles on Timber Lane, distant backup alarms, birds, and wind in the trees. During the daytime period, the observed wind speed was 4.5 m/s at the standard height of 10 meters. For the nighttime period, the observed wind speed was 1.1 m/s at the standard height, which is below the cut-in speed of the turbine at hub height.
Site ST5 was located to the east of the Project site on the grounds of an assisted living facility. Measured ambient sound levels ranged from 36 dBA L90 for a typical nighttime period to 46 dBA L90 for a typical daytime period. Sources of noise contributing to the acoustic environment at Site ST5 included distant traffic on Route 6, vehicles trips to and from the facility on Old Mansion Road, birds, wind in the trees, and heavy equipment at the gravel pit during the day. During the daytime period, the observed wind speed was 4.5 m/s at the standard height of 10 meters. For the nighttime period, the observed wind speed was 1.1 m/s at the standard height, which is below the cut-in speed of the turbine.
These measured values of the L90 were used as the basis for assessing the potential noise impact of the Project, as described in the Section 5.0. Note that in some cases, ambient sound levels were measured during periods at which the estimated hub height wind speed was below the cut-in wind speed of the turbine. This may lead to conservative estimates of the increase in ambient sound levels resulting from the Project.
3.0 MODELING METHODOLOGY AND ASSUMPTIONS
This section describes the methods and assumptions used to calculate noise levels due to full operation of the proposed wind energy facility.
3.1 Noise Prediction Model
The Cadna-A® computer noise model was used to calculate sound pressure levels from the operation of Project components at noise-sensitive locations in the vicinity of the proposed Project. An industry standard, Cadna-A® was developed by DataKustik GmbH to provide an estimate of sound levels at distances from specific noise sources. This model takes into account:
Sound power levels from stationary and mobile sources;
The effects of terrain features including relative elevations of noise sources;
The locations of noise-sensitive land use;
Intervening objects including buildings and sound barrier walls; and
Ground effects due to areas of pavement and unpaved ground.

Sound Survey and Analysis Report
August 2010
Page 8 Copyright © ESS Group, Inc., 2010 j:\w279-000-weston-sampson-cvec-brewster\noise\report\noise-report-cvec-brewster-2010-0922-rev3.doc
Cadna-A® accounts for shielding and reflections due to intervening buildings or other structures in the propagation path, as well as diffracted paths around and over structures, which tend to reduce computed noise levels. The shielding effects due to intervening buildings and ground vegetation were not included within the model. By excluding the shielding effects provided by buildings and ground vegetation, the computed operational sound levels include a level of conservatism.
The International Standards Organization current standard for outdoor sound propagation: ISO 9613 Part 2 – “Attenuation of sound during propagation outdoors” was used within Cadna-A®. This standard provides a method for calculating environmental noise in communities from a variety of sources with known emission levels. The method contained within the standard calculates the attenuation over the entire sound path under weather conditions that are favorable for sound propagation, such as for downwind propagation or “under a well-developed moderate ground-based temperature inversion.” Application of such weather conditions to the modeling of the facility yields conservative estimates of operational noise levels in the surrounding community.
The output from Cadna-A® includes tabular sound level results at selected receiver locations and colored noise contour maps (isopleths) that show areas of equal and similar sound levels.
3.2 Input to the Noise Prediction Model
Vestas provided the acoustic emissions of the V90 1.8/2.0 MW turbine for a range of normalized wind speeds. This wind turbine is expected to produce an A-weighted sound power level of 100 dBA at a wind speed of 4 m/s at a standard height of 10 meters. Based on information provided by the manufacturer, the A-weighted sound power level of the V90 increases to a value of 103 dBA at a wind speed of 6 m/s at 10 meters above the ground. At higher wind speeds (up to 14 m/s at 10 meters), the A-weighted sound power level of the V90 remains constant at 103 dBA. For this impact assessment, operational noise levels from the Project were evaluated for “high” wind speed conditions (6 m/s, or more, at 10 meters) and for “low” wind speed conditions (4 m/s at 10 meters).
Another level of conservatism was included in the noise level projections from the proposed facility by adopting a conservative estimate of the ground absorption coefficient as implemented in the ISO 9613 Standard within Cadna-A®. Possible values for the ground absorption coefficient range from zero (0.0) for sound propagation over acoustically “hard” ground such as water or pavement, to one (1.0) for propagation over acoustically “soft” ground such as fields or lawn or snow. While a higher value of the ground absorption coefficient would be justified due to the characteristics of the surrounding terrain (particularly for the community sites, the closest of which is approximately 1800 meters from the proposed wind energy facility), a value of zero (0.0) was assumed throughout the entire study area.
4.0 OPERATIONAL NOISE FROM THE WIND ENERGY FACILITY
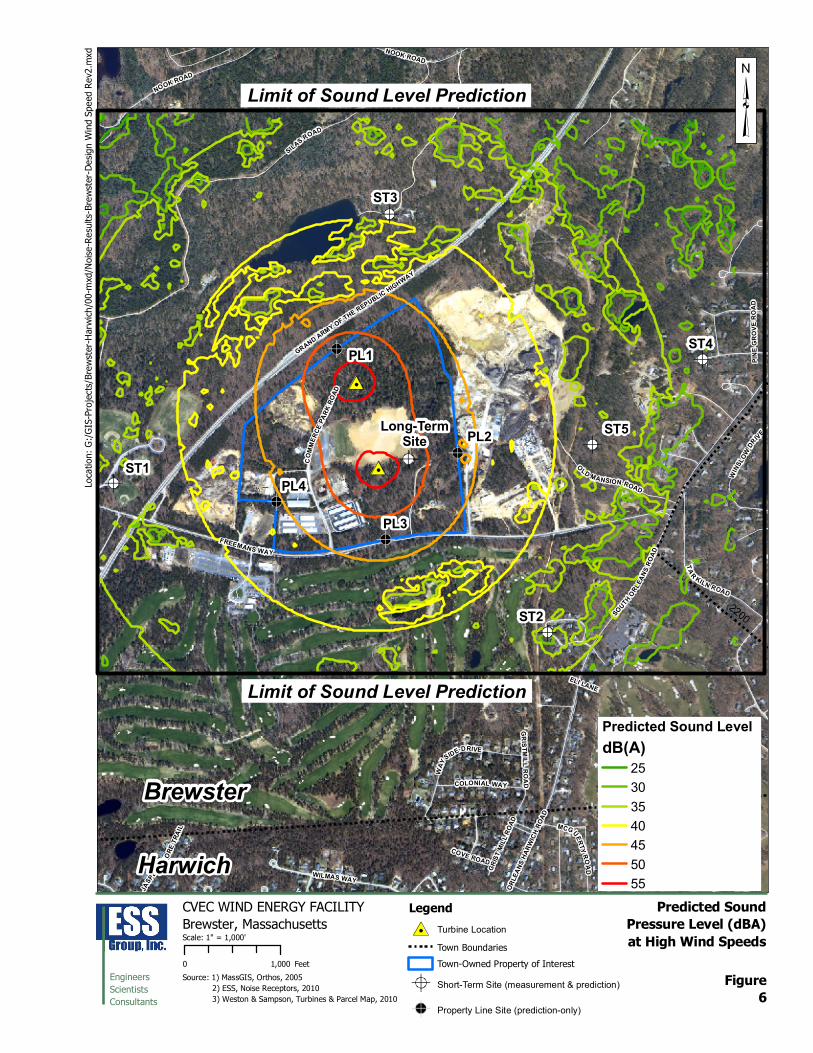
Figures 6 and 7 show the operational noise levels due to the proposed wind energy facility as noise contours in 5-dB intervals, for high wind speed conditions and for low wind speed conditions, respectively. The noise contours are graphical representations of the cumulative noise associated with full operation of the proposed facility, and show how operational noise would be distributed over the

Sound Survey and Analysis Report
August 2010
Page 9 Copyright © ESS Group, Inc., 2010 j:\w279-000-weston-sampson-cvec-brewster\noise\report\noise-report-cvec-brewster-2010-0922-rev3.doc
surrounding area. The contour lines shown in the figures are analogous to elevation contours on a topographic map, i.e. the noise contours are continuous lines of equal noise level around some source, or sources, of noise.
The noise contours in the figures are indicative of conditions that are favorable for sound propagation, such as those that occur under downwind propagation, as mentioned in the previous section. As a result, the noise contours shown in Figures 6 and 7 are considered conservative. In reality, wind speeds and direction are constantly changing. At those times when a particular receiver is located downwind from the proposed wind energy facility (wind blowing from the Facility to the receiver), the noise contours shown in Figures 6 and 7 would be applicable. However, at other times, a receiver may be upwind of the Facility (wind blowing from the receiver to the Facility). Under upwind conditions, the noise contours shown in Figures 6 and 7 may overestimate operational noise levels.
Figures 6 and 7 also show the locations of the measurement sites and the locations of additional receivers located at the property lines of the facility.
5.0 NOISE IMPACT ASSESSMENT
Table 4 provides a summary of the predicted noise levels from full operation of the wind energy facility at high wind speeds at each of the short-term measurement sites in the community. As shown in the table, predicted noise levels from the turbine are expected to range from 32 to 40 dBA at the closest noise-sensitive land uses in the vicinity of the Project. This table compares the predicted noise levels from the wind turbines to the measured daytime ambient sound levels at the short-term sites. As shown in the table, the projected increase in daytime ambient sound levels would range from 0 to 2 decibels, and so would meet the applicable state and local standards for an allowable increase in the ambient sound level.
Table 5 provides a summary of the predicted noise levels from full operation of the wind energy facility at low wind speeds at each of the short-term measurement sites. Predicted noise levels from the turbine are expected to range from 29 to 37 dBA at the closest noise-sensitive land uses in the vicinity of the Project. This table compares the predicted noise levels from the wind turbines to the measured nighttime ambient sound levels at the short-term sites. As shown in the table, the projected increase in nighttime ambient sound levels would range from 2 to 4 decibels, and so the Project is expected to meet the applicable state and local standards for an allowable increase in the ambient sound level. However, it should be noted that the ambient sound levels shown in the Table 5 were obtained during periods when the observed wind speeds were below the mechanical cut-in wind speed of the turbine. As a result, the increases in nighttime ambient sound levels at the short-term sites are a conservative estimate, since ambient sound levels are expected to be higher at higher wind speeds.
Table 6 shows the predicted sound levels due to full power operation of the wind energy facility (at high wind speeds) at four of the closest locations along each property line. As shown in the table, predicted sound levels due to the operation of the wind energy facility at high wind speeds are expected to range from 42 to 52 dBA. During the monitoring period, observed wind speeds did not reach 6 m/s at 10 meters – the minimum wind speed at which the turbine produces the maximum sound power level. Consequently, the equation for the linear regression curve shown in Figure 5 was used to estimate the

Sound Survey and Analysis Report
August 2010
Page 10 Copyright © ESS Group, Inc., 2010 j:\w279-000-weston-sampson-cvec-brewster\noise\report\noise-report-cvec-brewster-2010-0922-rev3.doc
ambient sound level (L90) at high wind speeds for the property line locations. Based on the linear regression curve, on-site ambient hourly sound levels are expected to be 52 dBA L90. As shown in the table, the predicted increase in ambient sound is expected to range from 0 to 3 decibels, meeting the applicable state and local standards for an allowable increase in the ambient sound level.
Table 7 shows the predicted sound levels due to operation of the wind energy facility at low wind speeds at four of the closest locations along each property line. As shown in the table, predicted sound levels due to the turbine would range from 39 to 49 dBA. Based on the regression curve in Figure 5, the ambient hourly sound level at low wind speeds (4 m/s at 10 meters) is approximately 46 dBA L90. As shown in Table 7, projected increases in ambient sound levels are expected to range from 1 to 5 decibels, meeting the applicable state and local standards for an allowable increase in the ambient sound level.
Table 8 shows the predicted Day-Night Average Sound Level (Ldn) due to full operation of the wind energy facility at a sustained high wind speeds (6 m/s, or more, at the standard height of 10 meters) over a full 24-hour period. If such wind conditions were to persist for a 24-hour period, the predicted Ldn at the property line would range from 54 to 59 dBA. In comparison, the measured ambient Ldn at the long-term site was 52 dBA, and included periods during which observed wind speeds were below 6 m/s at 10 meters, and other periods during which the observed wind speeds were below the mechanical cut-in wind speed of the turbine. Consequently, the projected increase in Ldn at high wind speeds is an over-estimate of the anticipated increase that may be experienced after the construction of the Project. As shown in Table 8, projected increases in Day-Night Ambient Sound Levels are expected to range from 2 to 7 decibels.11
Table 9 shows the predicted Ldn due to full operation of the wind energy facility at a sustained low wind speed (4 m/s at the standard height of 10 meters) over a full 24-hour period. If such wind conditions were to persist for a 24-hour period, the predicted Ldn at the property line would range from 53 to 57 dBA. As mentioned above, the measured ambient Ldn included periods during which observed wind speeds were below the cut-in wind speed of the turbine and other periods during which observed wind speeds were in excess of 4 m/s at 10 meters As shown in Table 9, projected increases in Day-Night Ambient Sound Levels for low wind speeds are expected to range from 1 to 5 decibels.
As described earlier these are conservative estimates of the ambient sound level along the property lines of the Project site. The ambient sound level along the property line is based on the results at the long-term site, which is relatively remote from traffic on both Route 6 and on Freemans Way, and from activities at the sand pit along the east property line. As a result, ambient sound levels along the property lines are expected to be higher than the ambient sound levels at the monitoring location.
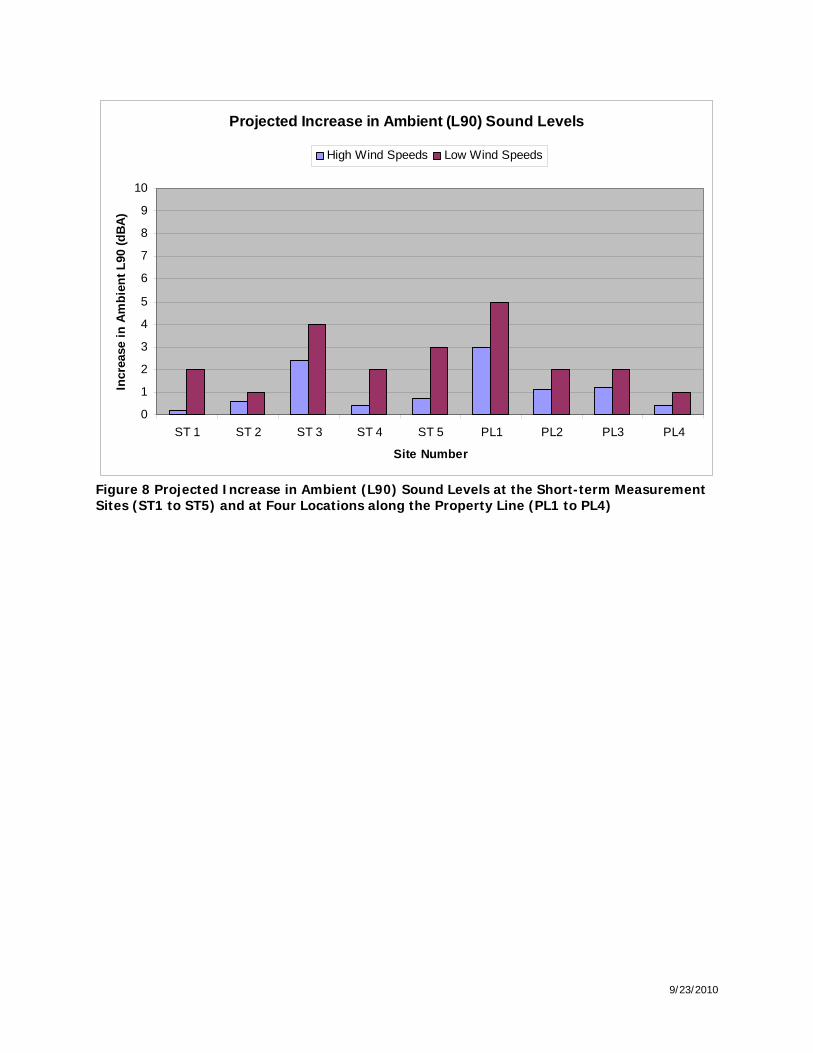
Figure 8 is a graphical representation of the projected increase in ambient sound levels associated with full operation of the wind energy facility at each short-term site and along each property line. As shown in the figure, the greatest increase in ambient sound, using the set of assumptions described in detail in 11 Note that the Mass DEP noise regulations describe the maximum increase in ambient sound levels in terms of the L90 and not in terms of Ldn.

Sound Survey and Analysis Report
August 2010
Page 11 Copyright © ESS Group, Inc., 2010 j:\w279-000-weston-sampson-cvec-brewster\noise\report\noise-report-cvec-brewster-2010-0922-rev3.doc
the previous sections, is expected to occur at Site PL1, which is located along the northern property adjacent to the Route 6 right-of-way. It should be noted that as per the MADEP Sound Level Policy, the Route 6 right-of-way is not considered noise-sensitive.
6.0 CONCLUSIONS
Noise levels from the operation of the proposed wind energy facility are expected to meet state and local limits for an increase in ambient sound levels. Figure 8 shows the projected increases in ambient sound levels are expected to be below the regulatory limit of a 10 dBA increase.
These results include several levels of conservatism. The projected sound levels due to operation of the wind turbines exclude the effects of excess attenuation due to propagation over acoustically “soft” ground and the excess attenuation due to ground vegetation. Also, the sound propagation algorithms within the noise prediction model assume an omni-directional downwind condition. That is, although it is physically impossible, the noise prediction model assumes that every point for which a sound level is computed is downwind of a turbine. These first two assumptions yield projections of wind turbine noise levels are conservatively “high.” Finally, the projected noise levels due to the wind turbines were compared to conservatively “low” values of the ambient sound level. In some cases, ambient sound levels were obtained during periods of time for which observed wind speeds were below the cut-in wind speed of the wind turbine. Since increases in wind speeds generally produce increases in ambient sound levels, ambient sound levels at some of the community locations are expected to be higher at the cut-in wind speed than what was measured. So although the wind turbines would not be operating at speeds below the cut-in wind speed (and so would not produce any sound), another level of conservatism was added to the noise assessment by comparing operational noise levels from the turbines to these conservatively “low” values of the ambient sound level.

Tables

Table 1 Examples of Common Indoor and Outdoor Sound Pressure Levels
Sound Level dB(A)
Common Indoor Sounds
Common Outdoor Sounds
110 100 90 80 70 60 50 40 25
Rock Band Inside NYC Subway Train Food Blender at 3 feet Garbage Disposal at 3 feet Vacuum Cleaner at 10 feet Normal Speech at 3 feet Dishwasher in Next Room Empty Conference Room Empty Concert Hall
Jet Takeoff at 1000 feet Chain Saw at 3 feet Impact Hammer (Hoe Ram) at 50 feet Diesel Truck at 50 feet Lawn Mower at 100 feet Auto (40 mph) at 100 feet Busy Suburban Area at night Quiet Suburban Area at night Rural Area at night
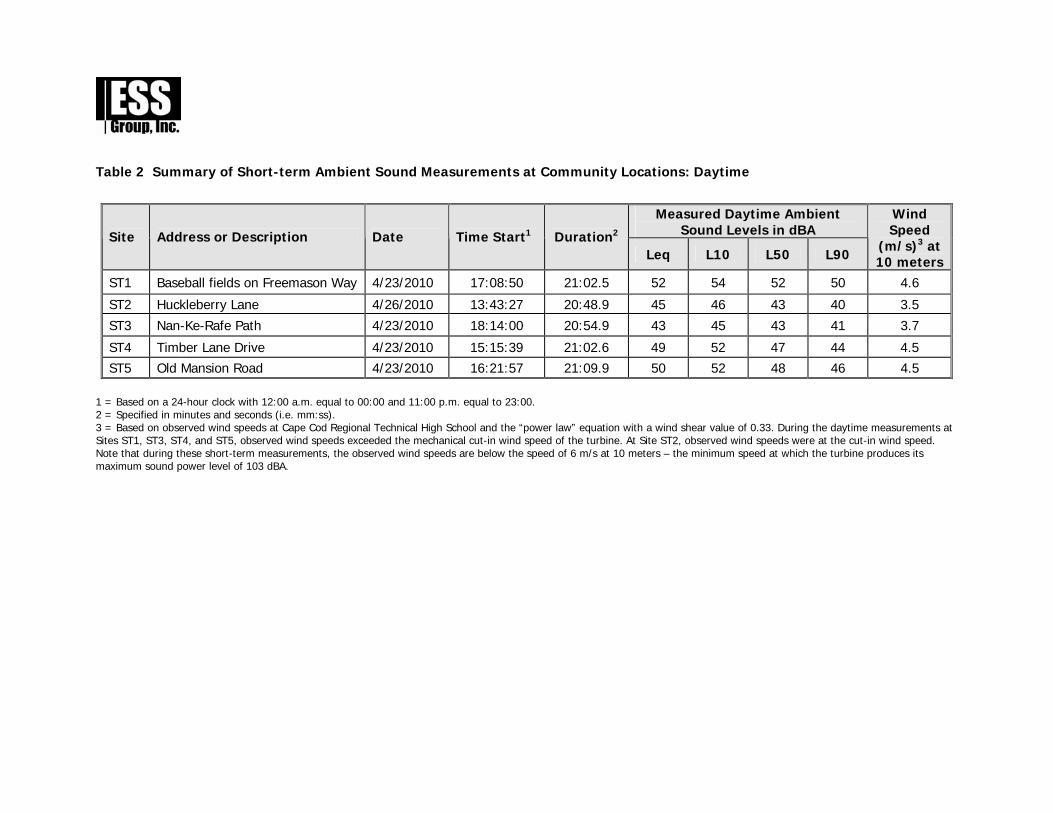
Table 2 Summary of Short-term Ambient Sound Measurements at Community Locations: Daytime
Measured Daytime Ambient
Sound Levels in dBA Site Address or Description Date Time Start1 Duration2 Leq L10 L50 L90
Wind Speed
(m/s)3 at 10 meters
ST1 Baseball fields on Freemason Way 4/23/2010 17:08:50 21:02.5 52 54 52 50 4.6
ST2 Huckleberry Lane 4/26/2010 13:43:27 20:48.9 45 46 43 40 3.5
ST3 Nan-Ke-Rafe Path 4/23/2010 18:14:00 20:54.9 43 45 43 41 3.7
ST4 Timber Lane Drive 4/23/2010 15:15:39 21:02.6 49 52 47 44 4.5 ST5 Old Mansion Road 4/23/2010 16:21:57 21:09.9 50 52 48 46 4.5
1 = Based on a 24-hour clock with 12:00 a.m. equal to 00:00 and 11:00 p.m. equal to 23:00. 2 = Specified in minutes and seconds (i.e. mm:ss). 3 = Based on observed wind speeds at Cape Cod Regional Technical High School and the “power law” equation with a wind shear value of 0.33. During the daytime measurements at Sites ST1, ST3, ST4, and ST5, observed wind speeds exceeded the mechanical cut-in wind speed of the turbine. At Site ST2, observed wind speeds were at the cut-in wind speed. Note that during these short-term measurements, the observed wind speeds are below the speed of 6 m/s at 10 meters – the minimum speed at which the turbine produces its maximum sound power level of 103 dBA.

Table 3 Summary of Short-term Ambient Sound Measurements at Community Locations: Nighttime
Measured Nighttime Ambient
Sound Levels in dBA Site Address or Description Date Time Start1 Duration2 Leq L10 L50 L90
Wind Speed
(m/s)3 at 10 meters
ST1 Baseball fields on Freemason Way 4/23/2010 22:08:29 20:44.9 44 48 42 35 1.4
ST4 Timber Lane Drive 4/23/2010 22:36:29 20:54.9 50 41 37 34 1.1 ST5 Old Mansion Road 4/23/2010 23:08:25 22:11.4 40 42 39 36 1.1
1 = Based on a 24-hour clock with 12:00 a.m. equal to 00:00 and 11:00 p.m. equal to 23:00. 2 = Specified in minutes and seconds (i.e. mm:ss). 3 = Based on observed wind speeds at Cape Cod Regional Technical High School and the “power law” equation with a wind shear value of 0.33. During the nighttime measurements, observed wind speeds were below the mechanical cut-in wind speed of the turbine, which is 3.5 m/s at hub height, or approximately 1.8 m/s at the standard height of 10 meters. Ambient sound levels at the cut-in wind speed are expected to be somewhat higher than the levels shown in the table.

Table 4 Calculated Project Sound Levels and Ambient Sound Levels at High Wind Speeds at Community Locations
Site
Calculated Project Sound Level (dBA)
at High Wind Speeds1
Daytime Ambient (L90) Sound Level
(dBA)2
Total Sound Level = Project Plus Ambient (dBA)
Increase in Ambient Sound
Level (dB)
Meets Criteria for Allowable Increase in Ambient Sound Level (Yes/No)?
ST1 37 50 50 0 Yes
ST2 32 40 41 1 Yes ST3 40 41 43 2 Yes ST4 34 44 44 0 Yes ST5 38 46 47 1 Yes
1 = At a wind speed of 6 m/s, or more, at the standard height of 10 meters. 2 = These ambient sound levels were measured when observed wind speeds were below 6 m/s at the standard height of 10 meters – the minimum speed at which the turbine produces its maximum sound power level. At higher wind speeds, ambient sound levels are expected to be higher than the values shown in the table. Therefore, the predicted increase in ambient sound levels includes a level of conservatism.

Table 5 Calculated Project Sound Levels and Ambient Sound Levels at Low Wind Speeds at Community Locations
Site
Calculated Project Sound Level (dBA)
at Low Wind Speeds1
Nighttime Ambient (L90) Sound Level2
(dBA)
Total Sound Level = Project Plus Ambient (dBA)
Increase in Ambient Sound
Level (dB)
Meets Criteria for Allowable Increase in Ambient Sound Level (Yes/No)?
ST1 34 35 37 2 Yes
ST2 29 343 35 1 Yes ST3 37 343 38 4 Yes ST4 31 34 36 2 Yes ST5 35 36 39 3 Yes
1 = At a wind speed of 4 m/s at the standard height of 10 meters. 2 = During the nighttime measurements, observed wind speeds were below the cut-in wind speed of the turbine, which is 3.5 m/s at hub height, or approximately 1.8 m/s at the standard height of 10 meters. At higher wind speeds, ambient sound levels are expected to be higher than the values shown in the table. Therefore, the predicted increase in ambient sound levels includes a level of conservatism, since the wind turbines would not operate, and so would not produce sound, at speeds lower than the cut-in speed. 3 = Since nighttime measurements were not performed at Sites ST2 and ST3, the nighttime ambient sound level for these sites is an estimate.
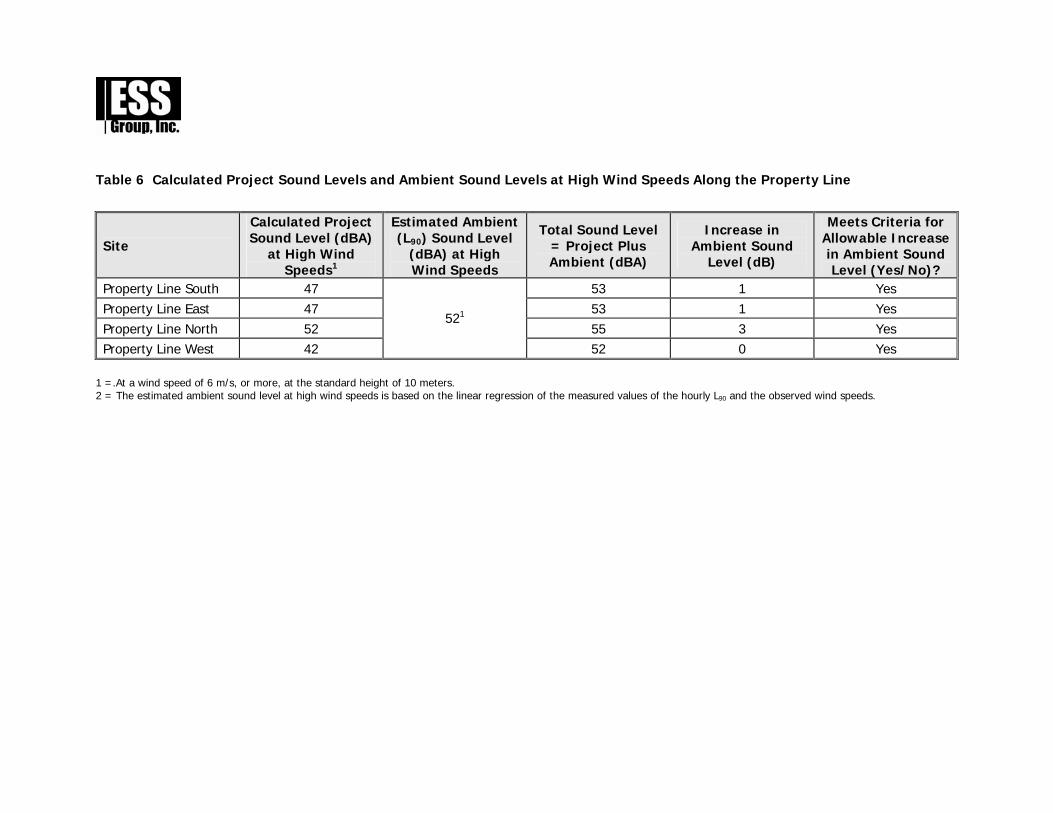
Table 6 Calculated Project Sound Levels and Ambient Sound Levels at High Wind Speeds Along the Property Line
Site
Calculated Project Sound Level (dBA)
at High Wind Speeds1
Estimated Ambient (L90) Sound Level
(dBA) at High Wind Speeds
Total Sound Level = Project Plus Ambient (dBA)
Increase in Ambient Sound
Level (dB)
Meets Criteria for Allowable Increase in Ambient Sound Level (Yes/No)?
Property Line South 47 53 1 Yes Property Line East 47 53 1 Yes Property Line North 52 55 3 Yes Property Line West 42
521
52 0 Yes 1 =.At a wind speed of 6 m/s, or more, at the standard height of 10 meters. 2 = The estimated ambient sound level at high wind speeds is based on the linear regression of the measured values of the hourly L90 and the observed wind speeds.

Table 7 Calculated Project Sound Levels and Ambient Sound Levels at Low Wind Speeds Along the Property Line
Site
Calculated Project Sound Level (dBA)1
at the Low Wind Speeds1
Estimated Ambient (L90) Sound Level2 (dBA) at the Low
Wind Speeds
Total Sound Level = Project Plus Ambient (dBA)
Increase in Ambient Sound
Level (dB)
Meets Criteria for Allowable Increase in Ambient Sound Level (Yes/No)?
Property Line South 44 48 2 Yes Property Line East 44 48 2 Yes Property Line North 49 51 5 Yes Property Line West 39
462
47 1 Yes 1 = At a wind speed of 4 m/s at the standard height of 10 meters. 2 = The estimated ambient sound level at low wind speeds is based on the linear regression of measured values of the hourly L90 and observed wind speeds.

Table 8 Calculated Project Ldn at Sustained High Wind Speeds and Ambient Ldn at the Property Line
Site Calculated Project Ldn (dBA)1 at High
Wind Speeds Ambient Ldn (dBA)2
Total Ldn = Project Ldn Plus Ambient
Ldn (dBA)
Increase in Ambient Ldn (dB)3
Property Line South 54 56 4 Property Line East 53 56 4 Property Line North 58 59 7 Property Line West 49
522
54 2 1 = The calculated value of the Project Ldn assumes that the turbine would operate continuously over a full 24-hour period at a sustained wind speed greater than or equal to 6 m/s at 10 meters. 2 = The ambient Ldn is based on the measurement data at the long-term site and includes periods when observed wind speeds were below the cut-in wind speed of the turbine. The ambient Ldn for a full 24-hour period with sustained wind speeds greater than or equal to the 6 m/s at 10 meters is expected to be greater than the value shown in the table. 3 = The projected increase in the ambient Ldn is considered an over-estimate of the actual increase in Ldn.

Table 9 Calculated Project Ldn at Sustained Low Wind Speeds and Ambient Ldn at the Property Line
Site Calculated Project Ldn (dBA)1 at Low
Wind Speeds Ambient Ldn (dBA)2
Total Ldn = Project Ldn Plus Ambient
Ldn (dBA)
Increase in Ambient Ldn (dB)
Property Line South 51 54 2 Property Line East 50 54 2 Property Line North 56 57 5 Property Line West 46
522
53 1 1 = The calculated value of the Project Ldn assumes that the turbine would operate continuously over a full 24-hour period at a sustained wind speed equal to 4 m/s at 10 meters. 2 = The ambient Ldn is based on the measurement data at the long-term site for a range of observed wind speeds.

Figures
9/23/2010
Sound Pressure Level vs. Time
25
30
35
40
45
50
55
60
65
70
75
0:00 0:01 0:02 0:03 0:04 0:05 0:06 0:07 0:08 0:09 0:10 0:11 0:12 0:13 0:14 0:15 0:16 0:17 0:18 0:19 0:20 0:21 0:22
Time (h:mm)
Soun
d Pr
essu
re L
evel
(dB
A)
Ambient Sound Pressure Level
Figure 1 Example of Time Varying Sound Levels and Descriptive Noise Metrics
Leq
L50
L90
Long-Term Site
ST2
ST1
ST5
ST4
2379
2200
PL4
PL1
PL2
PL3
ST3
Figure2
Locations of Ambient SoundMeasurement Sites and
Prediction SitesSource: 1) MassGIS, Orthos, 2005 2) ESS, Noise Receptors, 2010 3) Weston & Sampson, Turbines & Parcel Map, 2010
Scale: 1" = 1,000'
Loca
tion:
G:/G
IS-Pr
ojects
/Brew
ster-H
arwich
/00-m
xd/N
oise-R
esult
s-Brew
ster-C
ut-In
Wind
Spee
d.mxd
CVEC WIND ENERGY FACILITYBrewster, Massachusetts
EngineersScientistsConsultants
0 1,000 Feet
LegendTurbine LocationTown BoundariesTown-Owned Property of InterestShort-Term Site (measurement & prediction)
Property Line Site (prediction-only)
Brewster
Harwich

9/23/2010
Measured Hourly Ambient Sound Levels in dBA at Long-term Site
20
25
30
35
40
45
50
55
60
65
70
04-23 00:00 04-24 00:00 04-25 00:00 04-26 00:00 04-27 00:00
Date and Time
Mea
sure
d H
ourly
Sou
nd L
evel
in d
BA
L10 Leq L50 L90
FRIDAY SATURDAY SUNDAY MONDAY
Figure 3 Measured Hourly Ambient Sound Levels at the Long-term Site
9/23/2010
Measured Hourly L90 and Wind Speed at 10 meters
0
1
2
3
4
5
6
7
8
9
10
04/23 0:00 04/24 0:00 04/25 0:00 04/26 0:00 04/27 0:00
Date (mm/dd) and Time (hh:mm)
Obs
erve
d W
ind
Spee
d (m
/s) a
t Sta
ndar
d H
eigh
t of
10
met
ers
20
24
28
32
36
40
44
48
52
56
60
Hou
rly L
90 (d
BA
)
Wind Speed (10 meters) Hourly L90 (LT) L90 (ST1) L90 (ST2)L90 (ST3) L90 (ST4) L90 (ST6) Speed > Cut-in
FRIDAY SATURDAY SUNDAY MONDAY
Figure 4 Measured Hourly L90 and Hourly Wind Speed at 10 meters Vs Time
9/23/2010
Measured Hourly L90s (Long Term Site) Vs Wind Speed at 10 meters
y = 3.1249x + 33.237
0
10
20
30
40
50
60
0 1 2 3 4 5 6
Wind Speed (m/s) at 10 meters
Hou
rly L
90 (d
BA
)
L90 Linear (L90)
Figure 5 Measured Hourly L90 as a Function of Wind Speed at 10 meters with Linear Regression Curve
Long-TermSite
ST2
ST1
ST5
ST4
PL4
PL1
PL2
PL3
SILAS ROAD
FREEMANS WAY
SOUTH ORLEAN
S ROA
D
GRAND ARMY OF THE REPUBLIC HIGHWAY
NOOK ROAD
TAR KILN ROAD
WILMAS WAY
OLD MANSION ROAD
COMM
ERCE
PARK
ROAD
COLONIAL WAY
WINS
LOW DRIVE
MCGUERTY ROAD
GRIS T M ILL R OA D
WAY
SIDE DRIVE
GRIST
MILL
ROAD
ORLE
ANS H
ARWI
CH RO
AD
COVE ROAD
JASP
ER MOOR
E TRA
IL
PINE
GROV
E RO
AD
ELI LANE
NOOK ROAD
2379
2200
ST3
Figure6
Predicted SoundPressure Level (dBA)at High Wind Speeds
Source: 1) MassGIS, Orthos, 2005 2) ESS, Noise Receptors, 2010 3) Weston & Sampson, Turbines & Parcel Map, 2010
Scale: 1" = 1,000'
Loca
tion:
G:/G
IS-Pro
jects/
Brews
ter-H
arwich
/00-m
xd/N
oise-R
esult
s-Brew
ster-D
esign
Wind
Spee
d Rev
2.mxd
CVEC WIND ENERGY FACILITYBrewster, Massachusetts
EngineersScientistsConsultants
0 1,000 Feet
LegendTurbine LocationTown BoundariesTown-Owned Property of InterestShort-Term Site (measurement & prediction)
Property Line Site (prediction-only)
Predicted Sound LeveldB(A)
25303540455055
Brewster
Harwich
Limit of Sound Level Prediction
Limit of Sound Level Prediction

Long-Term Site
ST2
ST1
ST5
ST4
2379
2200
PL4
PL1
PL2
PL3
ST3
Figure7
Predicted Sound Pressure Level (dBA)at Low Wind Speeds
Source: 1) MassGIS, Orthos, 2005 2) ESS, Noise Receptors, 2010 3) Weston & Sampson, Turbines & Parcel Map, 2010
Scale: 1" = 1,000'
Loca
tion:
G:/G
IS-Pro
jects/
Brews
ter-H
arwich
/00-m
xd/N
oise-R
esult
s-Brew
ster-C
ut-In
Wind
Spee
d Rev
2.mxd
CVEC WIND ENERGY FACILITYBrewster, Massachusetts
EngineersScientistsConsultants
0 1,000 Feet
LegendTurbine LocationTown BoundariesTown-Owned Property of InterestShort-Term Site (measurement & prediction)
Property Line Site (prediction-only)
Predicted Sound LeveldB(A)
253035404550
Brewster
Harwich
Limit of Sound Level Prediction
Limit of Sound Level Prediction
9/23/2010
Projected Increase in Ambient (L90) Sound Levels
0
1
2
3
4
5
6
7
8
9
10
ST 1 ST 2 ST 3 ST 4 ST 5 PL1 PL2 PL3 PL4
Site Number
Incr
ease
in A
mbi
ent L
90 (d
BA)
High Wind Speeds Low Wind Speeds
Figure 8 Projected Increase in Ambient (L90) Sound Levels at the Short-term Measurement Sites (ST1 to ST5) and at Four Locations along the Property Line (PL1 to PL4)