appendix k - preparation guidelines for project report€¦ · 20.02.2015 · v. freeway tunnel...
TRANSCRIPT


Draft Project Report January 2015
TBG060614123321LAC iii
CH2M HILL
TABLE OF CONTENTS
ACRONYMS AND ABBREVIATIONS
1. INTRODUCTION ....................................................................................................................................... 1
2. RECOMMENDATION ............................................................................................................................... 2
3. BACKGROUND ......................................................................................................................................... 4
A. Project History ........................................................................................................................... 4
B. Community Interaction .............................................................................................................. 5
C. Existing Facility ........................................................................................................................... 5
4. PURPOSE AND NEED ............................................................................................................................... 6
A. Problem, Deficiencies, Justification ........................................................................................... 6
B. Regional and System Planning ................................................................................................... 8
I. Federal and State Systems ............................................................................................ 8
II. State Planning ............................................................................................................... 8
III. Regional Planning .......................................................................................................... 8
IV. Local Planning ............................................................................................................... 9
V. Transit Operator Planning ............................................................................................. 9
C. Traffic ......................................................................................................................................... 9
I. Existing Traffic Analysis ................................................................................................. 9
II. Future Traffic Conditions ............................................................................................ 14
III. Collision Analysis ......................................................................................................... 18
5. ALTERNATIVES ....................................................................................................................................... 23
A. Viable Alternatives ................................................................................................................... 23
I. No Build Alternative .................................................................................................... 23
II. Transportation System Management/Transportation Demand Management
(TSM/TDM) Alternative ............................................................................................... 23
III. Bus Rapid Transit (BRT) Alternative ............................................................................ 30
IV. Light Rail Transit (LRT) Alternative .............................................................................. 33
V. Freeway Tunnel Alternative ........................................................................................ 36
B. Rejected Alternatives ............................................................................................................... 40
Draft Project Report January 2015
iv
CH2M HILL
6. CONSIDERATIONS REQUIRING DISCUSSION ......................................................................................... 44
A. Hazardous Waste ..................................................................................................................... 44
B. Value Analysis .......................................................................................................................... 45
C. Resource Conservation ............................................................................................................ 47
D. Right-of-Way Issues ................................................................................................................. 47
E. Environmental Issues .............................................................................................................. 50
F. Air Quality Conformity ............................................................................................................. 50
G. Health Risk Assessment ........................................................................................................... 50
H. Title VI Considerations ............................................................................................................. 51
I. Noise Abatement Decision Report .......................................................................................... 52
I. Results of the Noise Study Report .............................................................................. 52
J. Traffic Analysis ......................................................................................................................... 66
K. Design Exceptions .................................................................................................................... 72
I. Transportation System Management/Transportation Demand Management
(TSM/TDM) Alternative .............................................................................................. 73
II. Bus Rapid Transit (BRT) Alternative ............................................................................ 75
III. Light Rail Transit (LRT) Alternative ............................................................................. 76
IV. Freeway Tunnel Alternative ....................................................................................... 77
L. Needed Structure Rehabilitation and Upgrading .................................................................... 84
I. Transportation System Management/Transportation Demand Management
(TSM/TDM) Alternative .............................................................................................. 85
II. Freeway Tunnel Alternative – Dual-Bore Tunnel ....................................................... 85
III. Freeway Tunnel Alternative – Single-Bore Tunnel ..................................................... 87
M. Utility and Other Owner Involvement ..................................................................................... 88
I. Transportation System Management/Transportation Demand Management
(TSM/TDM) Alternative .............................................................................................. 88
II. Bus Rapid Transit (BRT) Alternative ............................................................................ 88
III. Light Rail Transit (LRT) Alternative ............................................................................. 89
IV. Freeway Tunnel Alternative ....................................................................................... 90
7. OTHER CONSIDERATIONS ..................................................................................................................... 91
A. Public Hearing Process ............................................................................................................ 91
B. Route Matters ......................................................................................................................... 91
Draft Project Report January 2015
v
CH2M HILL
C. Permits ..................................................................................................................................... 92
D. Cooperative Agreements ......................................................................................................... 92
E. Other Agreements ................................................................................................................... 92
F. Transportation Management Plan for Use During Construction ............................................. 92
G. Stage Construction ................................................................................................................... 93
H. Drainage ................................................................................................................................... 93
I. Surface Drainage ......................................................................................................... 93
II. Tunnel Drainage .......................................................................................................... 95
I. Stormwater Quality Management ........................................................................................... 96
J. Fire/Life Safety Measures ........................................................................................................ 97
K. Accommodation of Oversize Loads.......................................................................................... 97
L. Graffiti Control ......................................................................................................................... 98
M. Visual Impact ............................................................................................................................ 98
8. FUNDING / PROGRAMMING ................................................................................................................. 98
9. SCHEDULE ............................................................................................................................................. 99
10. RISKS...................................................................................................................................................... 99
11. FHWA COORDINATION ......................................................................................................................... 99
12. PROJECT REVIEWS ................................................................................................................................. 99
13. PROJECT PERSONNEL .......................................................................................................................... 100
14. REFERENCES ........................................................................................................................................ 101
15. LIST OF ATTACHMENTS (UNDER SEPARATE COVER) ........................................................................... 102


Draft Project Report January 2015
vii
CH2M HILL
ACRONYMS AND ABBREVIATIONS
AA Alternatives Analysis
ADA Americans with Disabilities Act
ADL aerially deposited lead
ADT average daily traffic
APS Advance Planning Study
ASTM ASTM International (formerly American Society for Testing and Materials)
ATM Active Traffic Management
BC begin horizontal curve
bgs below ground surface
BMP Best Management Practice
BNB BRT noise barrier
BRT Bus Rapid Transit
Cal State LA California State University, Los Angeles
Caltrans California Department of Transportation
CB catch basin
CEQA California Environmental Quality Act
CMS changeable message sign
dBA A-weighted decibel
DPR Draft Project Report
DEIR/EIS Draft Environmental Impact Report/Environmental Impact Statement
EB eastbound
EC end horizontal curve
FFFS Fixed Fire Fighting System
FHWA Federal Highway Administration
ft2 square feet
FTA Federal Transit Administration
FTIP Federal Transportation Improvement Program
FTNB freeway tunnel noise barrier
HCM Highway Capacity Manual
HDM Highway Design Manual
HOV high-occupancy vehicle
HRA Health Risk Assessment
Draft Project Report January 2015
viii
CH2M HILL
I Interstate
ID internal design diameter
ISA Initial Site Assessment
ITS Intelligent Transportation System
JPL Jet Propulsion Laboratory
LID low-impact development
LOS level of service
LRT Light Rail Transit
LRTP Long-Range Transportation Plan
LSA LSA Associates, Inc.
Metro Los Angeles County Metropolitan Transportation Authority
mph miles per hour
MSA Metropolitan Statistical Area
MSAT mobile source air toxic
MTC Multimodal Transportation Centers
NAC Noise Abatement Criteria
NADR Noise Abatement Decision Report
NB northbound
NEPA National Environmental Policy Act
NFPA National Fire Protection Association
NOD Notice of Determination
NOI Notice of Intent
NOP Notice of Preparation
NPDES National Pollutant Discharge Elimination System
NSR Noise Study Report
OC overcrossing
O&M operations and maintenance
PPP Public-Private Partnership
RCB reinforced concrete box
RCC reinforced concrete channel
RCP reinforced concrete pipe
REC recognized environmental condition
ROD Record of Decision
ROW right-of-way

Draft Project Report January 2015
ix
CH2M HILL
RTP Regional Transportation Plan
SB southbound
SCAG Southern California Association of Governments
SCAQMD South Coast Air Quality Management District
SCS Sustainable Communities Strategy
SR State Route
SWDR Stormwater Data Report
SWITRS Statewide Integrated Traffic Records System
TAP Transit Access Pass
TASAS Traffic Accident Surveillance and Analysis System
TBF tree box filter
TBM tunnel boring machine
TDM Transportation Demand Management
TMP Transportation Management Plan
TNB TSM/TDM noise barrier
TSM Transportation System Management
TSSP Traffic Signal Synchronization Program
TTR Transportation Technical Report
UPRR Union Pacific Railroad
US United States Route
VA Value Analysis
VOC volatile organic compounds
WB westbound


Draft Project Report January 2015
1
CH2M HILL
07 - LA - 710, PM 26.7/32.1T
07 – 187900
EFIS 0700000191
DRAFT PROJECT REPORT
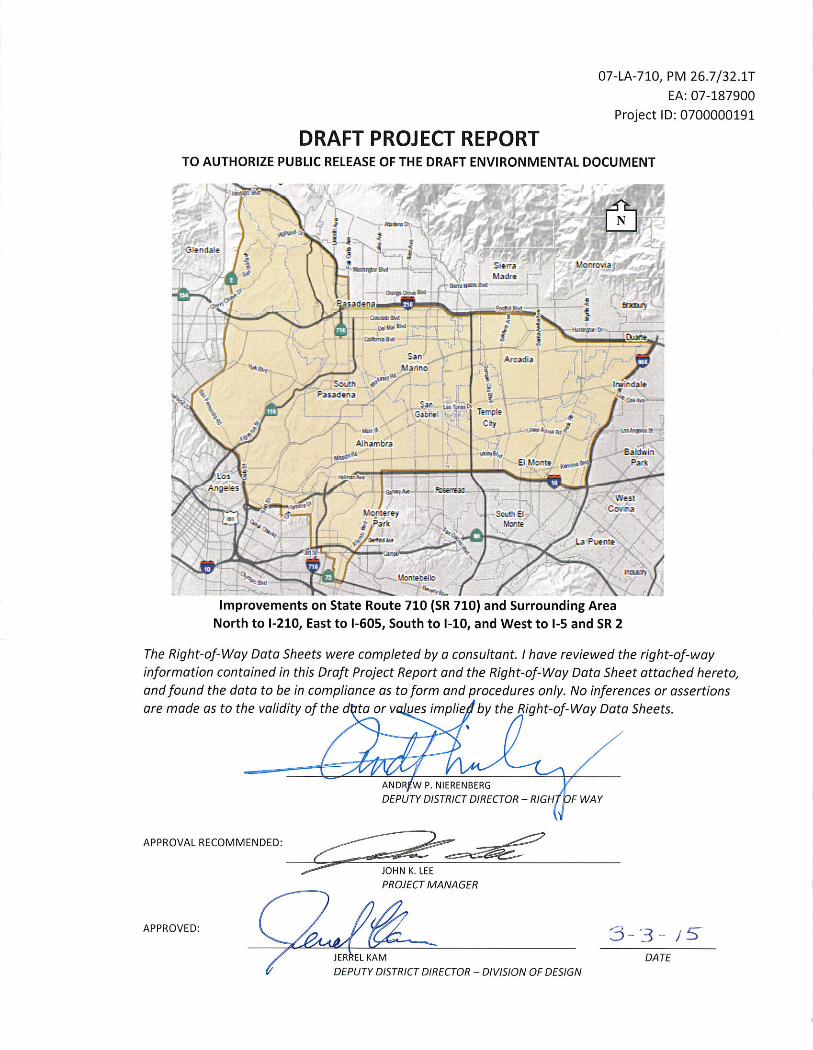
State Route 710 North Study
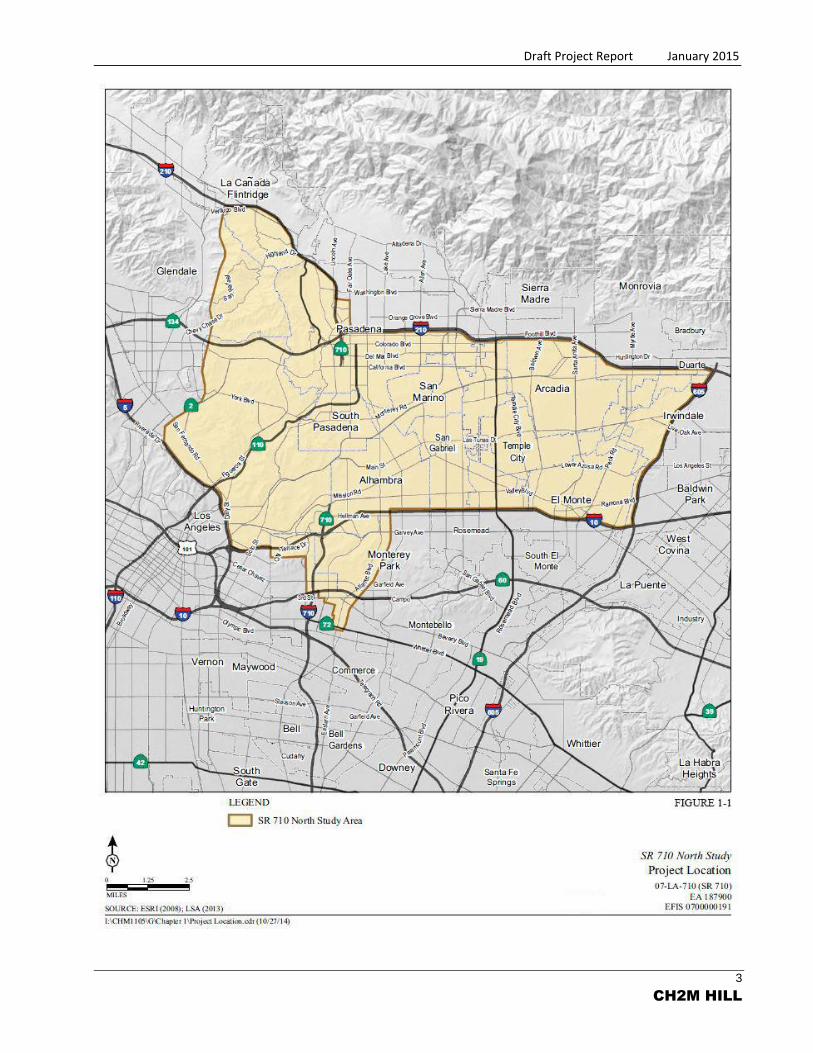
1. INTRODUCTION
The State Route (SR) 710 North Study is the culmination of a long history of efforts to address north-south
mobility in east/northeast Los Angeles and the western San Gabriel Valley. The lack of continuous
north-south transportation facilities leads to congestion on freeways and local streets, and poor transit
operations within the area between SR 2 and Interstates 5, 10, 210, and 605 (I-5, I-10, I-210, and I-605,
respectively). The SR 710 North Study area is shown in Figure 1-1.
The California Department of Transportation (Caltrans) is the lead agency under the National
Environmental Policy Act (NEPA) and California Environmental Quality Act (CEQA). Caltrans, in
cooperation with the Los Angeles County Metropolitan Transportation Authority (Metro), proposes
transportation improvements to improve efficiency and reduce congestion in the area. The SR 710 North
Study area is approximately 100 square miles and generally bounded by I-210 on the north, I-605 on the
east, I-10 on the south, and I-5 and SR 2 on the west.
The proposed build alternatives were developed to improve the efficiency of regional and local
north-south travel demands, reduce congestion, and minimize environmental impacts related to mobile
sources in the study area. This Draft Project Report (DPR) will focus on the improvements within the
proposed Caltrans right-of-way (ROW) of each alternative. The full scope of the Bus Rapid Transit (BRT)
and Light Rail Transit (LRT) Alternatives, with the majority of improvements proposed outside Caltrans
ROW (Chapter 5, Section A-III and A-IV of this DPR), will be presented in their respective Advanced
Conceptual Engineering Reports.
Draft Project Report January 2015
2
CH2M HILL
At the current stage, five alternatives are being refined to avoid or minimize potential impacts to the
extent possible. Where impacts cannot be avoided or minimized, feasible mitigation measures are
identified to reduce impacts. The five alternatives included in this report are:
No Build Alternative
Transportation System Management/Transportation Demand Management (TSM/TDM)
Alternative
BRT Alternative
LRT Alternative
Freeway Tunnel Alternative
2. RECOMMENDATION
It is recommended that the DPR transmit the Draft Environmental Impact Report/Environmental Impact
Statement (DEIR/EIS), allowing the DEIR/EIS to be circulated to the public for review and comment. The
supporting technical documents will be made available in facilities at Caltrans District 7, Metro, and local
libraries in the study area. A complete distribution list can be found in the DEIR/EIS.
A public hearing will be held during the circulation period of the DEIR/EIS. All comments will be reviewed,
responded to, taken into consideration, and incorporated into the final document as appropriate. It is
also recommended that Caltrans and Metro prepare a Cooperative Agreement to define the terms and
conditions under which the cooperative features of this project described herein will be implemented,
and the roles and responsibilities of the respective parties.
Draft Project Report January 2015
3
CH2M HILL
Draft Project Report January 2015
4
CH2M HILL
3. BACKGROUND
A. Project History
The history of the planning efforts to complete the SR 710 Freeway corridor dates back to 1933 when
Legislative Route 167, later renamed SR 7, was defined to run from San Pedro east to Long Beach and
north to the vicinity of Monterey Park. In 1959, the proposed northern limits of SR 7 were extended
to the planned Foothill Freeway (now I-210). The part of the facility from Long Beach to the I-10 was
incorporated in 1983 into the Interstate Highway System as Interstate 710 (I-710). The part of the
facility from I-10 to Valley Boulevard (southern stub) and from I-210 to the I-210/SR 710/SR 134
interchange (northern stub) was designated as SR 710 in 1984.
Over the years, planning efforts continued on SR 710 to evaluate alternatives and address community
and agency concerns, eventually leading to the issuance of a Record of Decision (ROD) in 1998 by the
Federal Highway Administration (FHWA) for a surface freeway. After litigation initiated by some of
the affected communities, FHWA rescinded the ROD in 2003, citing changes in project circumstances
such as funding uncertainty and the opening of the Metro Gold Line to Pasadena, and requiring a
more thorough evaluation of the feasibility of a bored tunnel. Feasibility studies were performed in
2006 that found a bored tunnel alternative would be viable and would warrant more detailed
evaluation.
In November 2008, Measure R (a half-cent sales tax dedicated to transportation projects in
Los Angeles County) was approved by a two-thirds majority of county voters. Included in the
Measure R plan is the commitment of $780 million to improve the connection between the SR 710
and I-210 freeways.
As a result of initial screening, the Alternatives Analysis Report (AA Report) was issued with the
State Route 710 Study Conceptual Engineering Report as one of its appendices in December 2012
(CH2M HILL, 2012a).
Twelve possible alternatives (some with design variations) were analyzed, including the No Build
Alternative, TSM/TDM Alternative, two BRT Alternatives, two LRT Alternatives, four Freeway
Alternatives, and two Highway/ Arterial Alternatives. For these alternatives, additional data were
collected and a more-detailed analysis was conducted, including assessments of the impacts to land
use and planning, the community, and the social and economic systems in the study area. Based on
the more-detailed analysis, five viable alternatives (No Build, TSM/TDM, BRT, LRT, and Freeway
Tunnel) were carried forward into the secondary screening.

Draft Project Report January 2015
5
CH2M HILL
B. Community Interaction
In March 2011, Caltrans published a Notice of Intent (NOI) under NEPA and a Notice of Preparation
(NOP) under CEQA to initiate the environmental review process for the proposed project. The
environmental review process began with a series of “SR 710 Conversations” as an outreach effort
led by Metro, including 21 prescoping and scoping meetings throughout the study area. In March and
April of 2011, Caltrans and Metro accepted comments on the proposed project and documented all
the scoping comments in the SR 710 North Gap Closure, Scoping Summary Report (Volumes I and II),
dated September 2011 (Caltrans, 2011). Metro also initiated the SR 710 Gap Closure Transit Profile
Study to gather transit service and patronage data and to assess current and future transit travel
markets within the study area.
During the feasibility study for the AA Report and throughout the development of the DEIR/EIS, there
have been extensive outreach efforts including:
Stakeholder Outreach Advisory Committee Meetings
Technical Advisory Committee Meetings
All Communities Convening Information Sessions and Open House Meetings
Community Liaison Council Meetings
Geotechnical boring outreach efforts
Social media postings and updates
Web site updates
The DEIR/EIS provides more details on the community outreach efforts.
C. Existing Facility
The study area is approximately 100 square miles and is generally bounded by I-210 on the north,
I-605 on the east, I-10 on the south, and I-5 and SR 2 on the west. According to data from the
Southern California Association of Governments (SCAG), the study area had a population of
0.95 million people in 2012, and 389,000 jobs were located in the study area.
At the southern end of the project limits, the existing I-710 south of the interchange with I-10 has
three lanes in the northbound direction and three to four lanes in the southbound direction. All lanes
are 12 feet wide. Median and outside shoulders are provided; however, the widths of shoulders are
nonstandard in some segments. In the northbound direction, the median width is 15 feet and the
outside shoulder width is 8 feet. In the southbound direction, the existing median has a total width of
Draft Project Report January 2015
6
CH2M HILL
30 feet with a barrier/metal beam guard railing that separates the opposing traffic. The outside
shoulder is paved with widths varying from 8 to 10 feet. The typical section showing the existing
freeway configuration at the southern end of the project limits is provided in Attachments I-1b and
J-1b. North of the I-10 interchange, the existing SR 710 has three lanes in the southbound direction
beginning with a two-lane on-ramp from Valley Boulevard. In the northbound direction, SR 710 varies
from two to three lanes ending with a two-lane off-ramp to Valley Boulevard.
At the northern end of the project limits, the existing SR 710 south of the interchange with
I-210/SR 134 has two to three lanes in the northbound direction and one to two lanes in the
southbound direction. All lanes are 12 feet wide. Channelizers are placed along the inside edge of
traveled way to route the southbound traffic. There is an existing concrete median barrier with
15 feet of paved median to either side; the existing outside shoulders in both directions vary from
8 to 14 feet. The typical section showing the existing freeway configuration at the northern end of the
project limits is provided in Attachments I-1c and J-1c.
4. PURPOSE AND NEED
A. Problem, Deficiencies, Justification
The study area is centrally located within the extended urbanized area of Southern California. With
few exceptions, the area from Santa Clarita in the north to San Clemente in the south (approximately
90 miles) is continuously urbanized. Physical features such as the San Gabriel Mountains and Angeles
National Forest on the north, and the Puente Hills and Cleveland National Forest on the south have
concentrated urban activity between the Pacific Ocean and these physical constraints. This urbanized
area functions as a single social and economic region, identified by the Census Bureau as the
Los Angeles-Long Beach-Santa Ana Metropolitan Statistical Area (MSA).
There are seven major east-west freeway routes and seven major north-south freeway routes in the
central portion of the Los Angeles-Long Beach-Santa Ana MSA:
Major east-west freeway routes
SR 118
United States Route (US)-101/SR 134/I-210
I-10
SR 60

Draft Project Report January 2015
7
CH2M HILL
I-105
SR 91
SR 22
Major north-south freeway routes:
I-405
US-101/SR 170
I-5
SR 110
I-710/SR 710
I-605
SR 57
Of the seven north-south routes, four are located partially within the study area (I-5, SR 110, I-710,
and I-605), two of these (SR 110 and I-710/SR 710) terminate within the study area without
connecting to another freeway. As a result, a high volume of north-south regional travel demand is
concentrated on a few freeways, or diverted to local streets within the study area. This effect is
exacerbated by the overall southwest-to-northeast orientation of I-605, which makes it an
unappealing route for traffic between the southern part of the region and the urbanized areas to the
northwest in the San Fernando Valley, the Santa Clarita Valley, and the Arroyo-Verdugo region.
The lack of continuous north‐south transportation facilities in the study area affects the overall
efficiency of the larger regional transportation system, causing congestion on freeways in the study
area, contributing to cut‐through traffic that affects the local streets in the study area, and resulting
in poor bus transit operations within the study area due to congestion on the local arterial roads.
Cut‐through trips are vehicle trips that pass through residential areas without stopping or without at
least one trip end in the residential area.
Due to the lack of continuous north-south transportation facilities in the study area, there is
congestion on freeways, cut-through traffic that affects local streets, and poor transit operations in
the study area. Therefore, the following project purpose has been established.
Draft Project Report January 2015
8
CH2M HILL
The purpose of the proposed action is to effectively and efficiently accommodate regional and local
north-south travel demands in the study area of the western San Gabriel Valley and east/northeast
Los Angeles, including the following considerations:
Improve efficiency of the existing regional freeway and transit networks.
Reduce congestion on local arterials adversely affected due to accommodating regional traffic
volumes.
Minimize environmental impacts related to mobile sources.
B. Regional and System Planning
I. Federal and State Systems
The route 710 is included in the State Freeway and Expressway System and is classified as a
freeway. The portions of the 710 freeway from I-10 to Valley Boulevard and the freeway south
of the I-210/SR 134 interchange are designated as SR 710. South of the I-10 interchange the 710
freeway is designated as I-710. The SR 710 terminates at the I-210/SR 134 interchange in
Pasadena.
II. State Planning
According to Caltrans seismic design criteria, the SR 710 north of I-10 within the study area is
classified as an ordinary nonstandard facility.
III. Regional Planning
The proposed SR 710 North Study has taken into consideration regional projects that are
included in the 2012 SCAG Regional Transportation Plan/Sustainable Commuter Strategy
(RTP/SCS). These proposed regional future project improvements are included in the No Build
Alternative (Chapter 5 Section A-1 and Attachment E-1 in this report). Regional planning projects
include:
The financially constrained list of projects in the 2012 SCAG RTP.
The currently planned projects in Los Angeles County that are identified in Measure R
(Note: Measure R is the transportation sales tax measure approved by voters in 2008).
Other projects as defined in the “Constrained Plan” of Metro’s 2009 Long-Range
Transportation Plan (through 2035).
Draft Project Report January 2015
9
CH2M HILL
IV. Local Planning
The concepts such as TSM/TDM, BRT, and LRT have been analyzed to generate the engineering
design of the build alternatives. The build alternatives also incorporate regional projects that are
included in the 2012 SCAG RTP/SCS and other planning projects included in the No Build
Alternative (Chapter 5 Section A-1 and Attachment E-1 in this report).
V. Transit Operator Planning
Currently, there are a number of transit operators and bus lines operating within the project
study area. In addition to the two major transit providers – Foothill Transit and Metro – there
are also existing local bus lines. All existing available transit systems within the study area have
been evaluated, and refinements were included to complement existing routes as well as
suggested new transit routes. The BRT Alternative and the LRT Alternative provide the analysis
and proposed improvements to bus and light rail transit systems, respectively. The TSM/TDM
Alternative consists of local street and intersection improvements that could be implemented
alone or incorporated into other build alternatives as applicable.
C. Traffic
I. Existing Traffic Analysis
The existing traffic analysis was conducted using available and newly collected data for the study
area freeway system and intersections. New data were collected in 2013, the base year for the
existing condition traffic analysis. Tables 4-1 and 4-2 summarize the existing traffic conditions on
the freeway system. Nine freeways are included in the analysis; the limits and post miles are
listed in both tables. The Transportation Technical Report (TTR), SR 710 North Study, Los Angeles
County, California (CH2M HILL, 2014b) includes detailed information on the traffic forecasting
and operational analysis summarized in this DPR.
The range of the daily and peak hour traffic volumes is provided in Table 4-1. Average daily
traffic (ADT) is for both directions of travel, while the peak hour volumes are shown for the peak
direction only. The volume ranges are relatively large because of the length of the freeways
(approximately 7 to 37 miles), which include intersecting freeways where traffic volumes change
substantially.

Draft Project Report January 2015
10
CH2M HILL
TABLE 4-1. Existing Conditions (2013) Freeway Volumes
Freeway Limits Absolute
Post Miles
Volume
ADTa AM Peak Hourb PM Peak Hourb
I-5 Between I-710 and SR 134 129.9 <-> 144.7 87,000 - 285,000 3,800 - 10,400 5,300 - 12,700
I-10 Between I-5 and I-605 17.2 <-> 30.1 114,000 - 237,000 4,900 - 8,900 4,900 - 10,200
I-210 Between I-5 and I-605 0 <-> 37.4 55,000 - 281,000 1,800 - 11,100 2,400 - 13,900
I-605 Between SR 60 and I-210 7.0 <-> 27.5 102,000 - 251,000 3,700 - 9,600 2,200 - 9,800
I-710c Between I-5 and Valley Boulevard
18.5 <-> 27.1 43,000 - 205,000 2,200 - 10,200 3,000 - 9,900
SR 2 Between I-5 and I-210 7.0 <-> 15.7 45,000 - 162,000 2,600 - 9,200 2,300 - 8,700
SR 60 Between I-5 and I-605 0.6 <-> 12.3 109,000 - 267,000 5,800 - 10,800 4,600 - 12,800
SR 110 Between I-5 and Fair Oaks Avenue
25.3 <-> 32.1 37,000 - 191,000 1,300 - 11,200 1,600 - 7,100
SR 134 Between I-5 and I-210/SR 710 5.0 <-> 14.7 93,000 - 224,000 4,300 - 8,900 3,500 - 8,300
Source: TTR (CH2M HILL, 2014b) Notes: Additional details can be found in Tables 5-3 to 5-24 of the TTR (CH2M HILL, 2014b) a Both directions b Peak direction only c Includes SR 710 between I-10 and Valley Boulevard
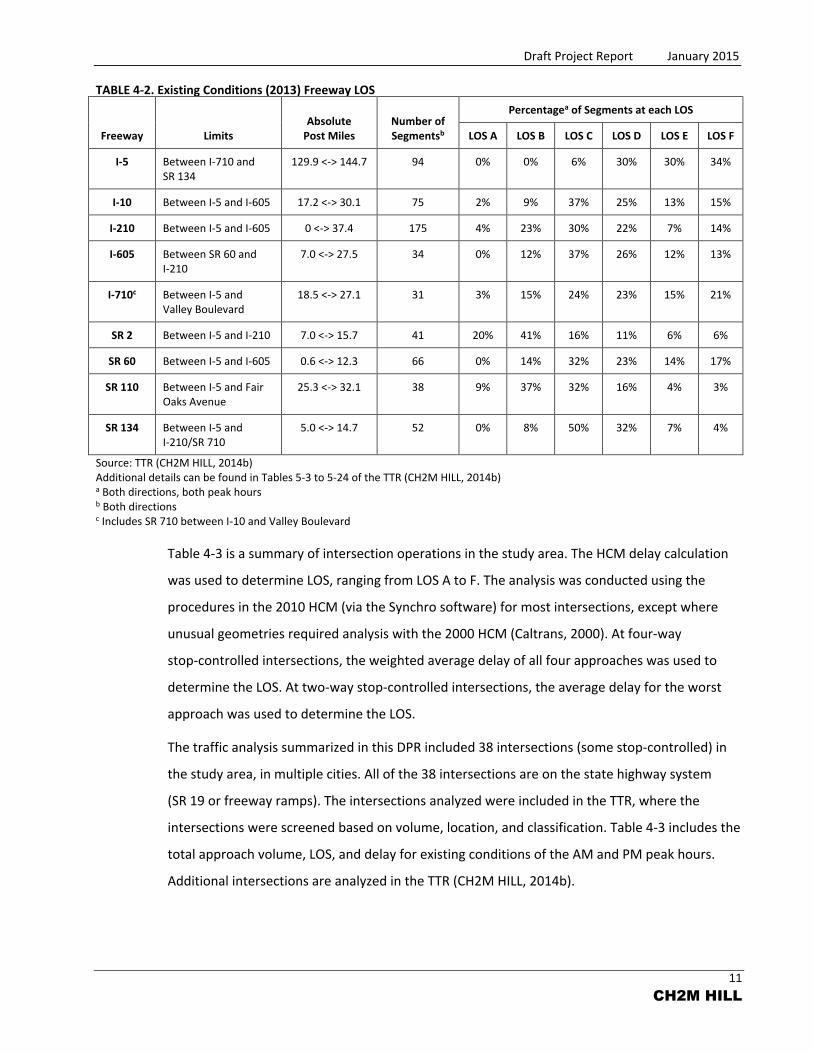
Table 4-2 is an overview of the level of service (LOS) for the freeways. The analysis was
conducted using the 2010 Highway Capacity Manual (HCM) procedures for merge, diverge,
weave, and basic sections (Caltrans, 2010a). The procedures and analysis criteria in Chapters 11,
12, and 13 of Volume 2 of the HCM were applied using a standard methodology to divide a
freeway corridor into analysis segments. Each freeway is composed of multiple segments (a total
of 31 to 175 segments in both directions).
The breakdown of the percentage of peak hour segments operating at each LOS grade is
provided in Table 4-2. The percentages were calculated by summing the total number of
segments for both directions and peak hours operating at a specific LOS, and dividing by
two times the total number of segments in the freeway. I-5 has the highest percentage of LOS E
and F segments, while SR 110 (north of I-5) has the lowest.
Draft Project Report January 2015
11
CH2M HILL
TABLE 4-2. Existing Conditions (2013) Freeway LOS
Freeway Limits Absolute
Post Miles Number of Segmentsb
Percentagea of Segments at each LOS
LOS A LOS B LOS C LOS D LOS E LOS F
I-5 Between I-710 and SR 134
129.9 <-> 144.7 94 0% 0% 6% 30% 30% 34%
I-10 Between I-5 and I-605 17.2 <-> 30.1 75 2% 9% 37% 25% 13% 15%
I-210 Between I-5 and I-605 0 <-> 37.4 175 4% 23% 30% 22% 7% 14%
I-605 Between SR 60 and I-210
7.0 <-> 27.5 34 0% 12% 37% 26% 12% 13%
I-710c Between I-5 and Valley Boulevard
18.5 <-> 27.1 31 3% 15% 24% 23% 15% 21%
SR 2 Between I-5 and I-210 7.0 <-> 15.7 41 20% 41% 16% 11% 6% 6%
SR 60 Between I-5 and I-605 0.6 <-> 12.3 66 0% 14% 32% 23% 14% 17%
SR 110 Between I-5 and Fair Oaks Avenue
25.3 <-> 32.1 38 9% 37% 32% 16% 4% 3%
SR 134 Between I-5 and I-210/SR 710
5.0 <-> 14.7 52 0% 8% 50% 32% 7% 4%
Source: TTR (CH2M HILL, 2014b) Additional details can be found in Tables 5-3 to 5-24 of the TTR (CH2M HILL, 2014b) a Both directions, both peak hours b Both directions c Includes SR 710 between I-10 and Valley Boulevard
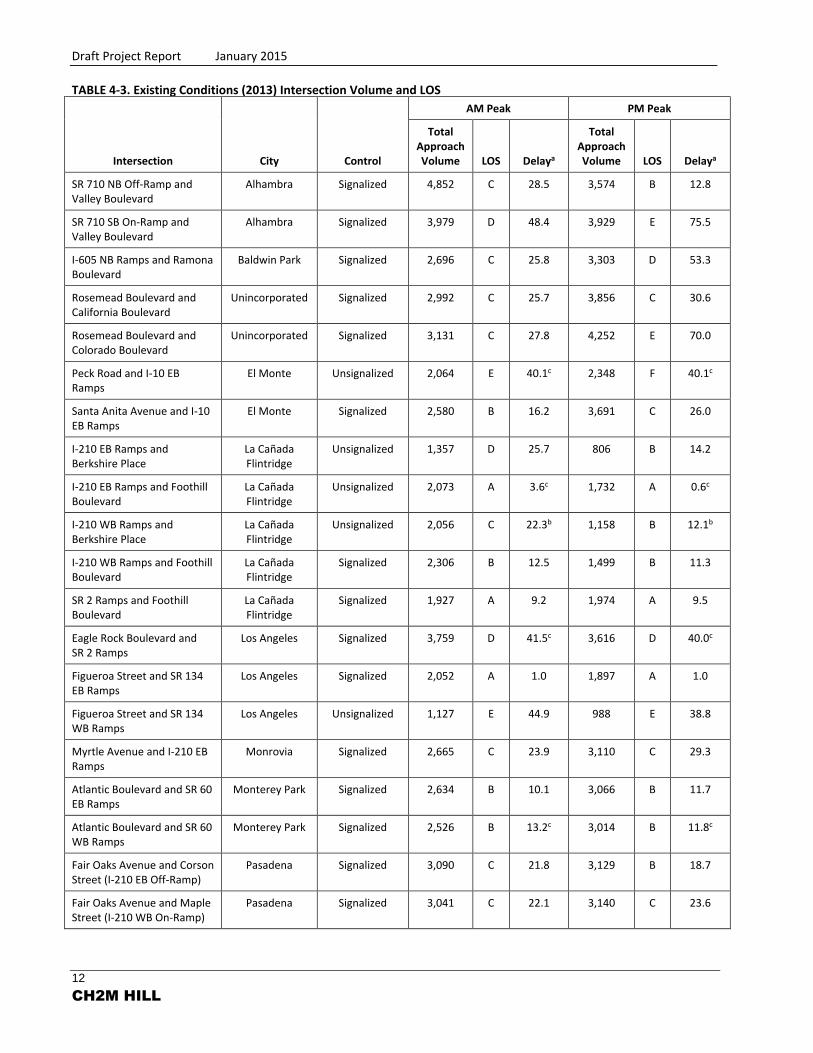
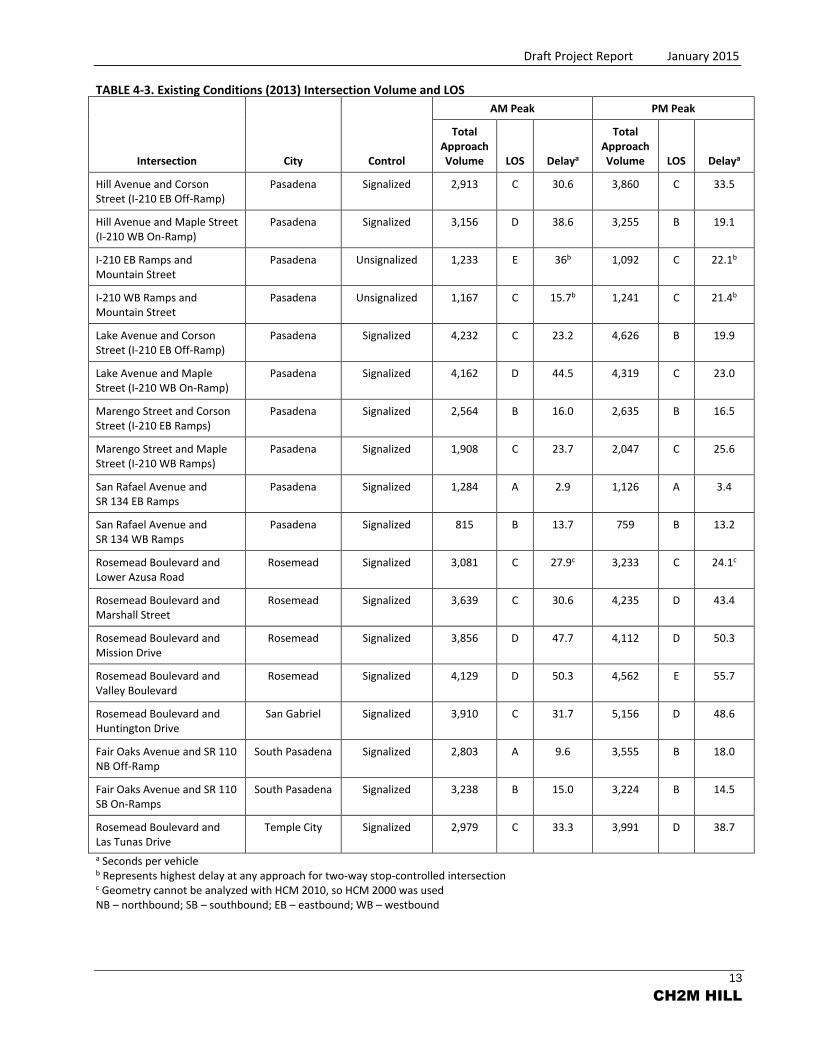
Table 4-3 is a summary of intersection operations in the study area. The HCM delay calculation
was used to determine LOS, ranging from LOS A to F. The analysis was conducted using the
procedures in the 2010 HCM (via the Synchro software) for most intersections, except where
unusual geometries required analysis with the 2000 HCM (Caltrans, 2000). At four-way
stop-controlled intersections, the weighted average delay of all four approaches was used to
determine the LOS. At two-way stop-controlled intersections, the average delay for the worst
approach was used to determine the LOS.
The traffic analysis summarized in this DPR included 38 intersections (some stop-controlled) in
the study area, in multiple cities. All of the 38 intersections are on the state highway system
(SR 19 or freeway ramps). The intersections analyzed were included in the TTR, where the
intersections were screened based on volume, location, and classification. Table 4-3 includes the
total approach volume, LOS, and delay for existing conditions of the AM and PM peak hours.
Additional intersections are analyzed in the TTR (CH2M HILL, 2014b).
Draft Project Report January 2015
12
CH2M HILL
TABLE 4-3. Existing Conditions (2013) Intersection Volume and LOS
Intersection City Control
AM Peak PM Peak
Total Approach Volume LOS Delaya
Total Approach Volume LOS Delaya
SR 710 NB Off-Ramp and Valley Boulevard
Alhambra Signalized 4,852 C 28.5 3,574 B 12.8
SR 710 SB On-Ramp and Valley Boulevard
Alhambra Signalized 3,979 D 48.4 3,929 E 75.5
I-605 NB Ramps and Ramona Boulevard
Baldwin Park Signalized 2,696 C 25.8 3,303 D 53.3
Rosemead Boulevard and California Boulevard
Unincorporated Signalized 2,992 C 25.7 3,856 C 30.6
Rosemead Boulevard and Colorado Boulevard
Unincorporated Signalized 3,131 C 27.8 4,252 E 70.0
Peck Road and I-10 EB Ramps
El Monte Unsignalized 2,064 E 40.1c 2,348 F 40.1c
Santa Anita Avenue and I-10 EB Ramps
El Monte Signalized 2,580 B 16.2 3,691 C 26.0
I-210 EB Ramps and Berkshire Place
La Cañada Flintridge
Unsignalized 1,357 D 25.7 806 B 14.2
I-210 EB Ramps and Foothill Boulevard
La Cañada Flintridge
Unsignalized 2,073 A 3.6c 1,732 A 0.6c
I-210 WB Ramps and Berkshire Place
La Cañada Flintridge
Unsignalized 2,056 C 22.3b 1,158 B 12.1b
I-210 WB Ramps and Foothill Boulevard
La Cañada Flintridge
Signalized 2,306 B 12.5 1,499 B 11.3
SR 2 Ramps and Foothill Boulevard
La Cañada Flintridge
Signalized 1,927 A 9.2 1,974 A 9.5
Eagle Rock Boulevard and SR 2 Ramps
Los Angeles Signalized 3,759 D 41.5c 3,616 D 40.0c
Figueroa Street and SR 134 EB Ramps
Los Angeles Signalized 2,052 A 1.0 1,897 A 1.0
Figueroa Street and SR 134 WB Ramps
Los Angeles Unsignalized 1,127 E 44.9 988 E 38.8
Myrtle Avenue and I-210 EB Ramps
Monrovia Signalized 2,665 C 23.9 3,110 C 29.3
Atlantic Boulevard and SR 60 EB Ramps
Monterey Park Signalized 2,634 B 10.1 3,066 B 11.7
Atlantic Boulevard and SR 60 WB Ramps
Monterey Park Signalized 2,526 B 13.2c 3,014 B 11.8c
Fair Oaks Avenue and Corson Street (I-210 EB Off-Ramp)
Pasadena Signalized 3,090 C 21.8 3,129 B 18.7
Fair Oaks Avenue and Maple Street (I-210 WB On-Ramp)
Pasadena Signalized 3,041 C 22.1 3,140 C 23.6
Draft Project Report January 2015
13
CH2M HILL
TABLE 4-3. Existing Conditions (2013) Intersection Volume and LOS
Intersection City Control
AM Peak PM Peak
Total Approach Volume LOS Delaya
Total Approach Volume LOS Delaya
Hill Avenue and Corson Street (I-210 EB Off-Ramp)
Pasadena Signalized 2,913 C 30.6 3,860 C 33.5
Hill Avenue and Maple Street (I-210 WB On-Ramp)
Pasadena Signalized 3,156 D 38.6 3,255 B 19.1
I-210 EB Ramps and Mountain Street
Pasadena Unsignalized 1,233 E 36b 1,092 C 22.1b
I-210 WB Ramps and Mountain Street
Pasadena Unsignalized 1,167 C 15.7b 1,241 C 21.4b
Lake Avenue and Corson Street (I-210 EB Off-Ramp)
Pasadena Signalized 4,232 C 23.2 4,626 B 19.9
Lake Avenue and Maple Street (I-210 WB On-Ramp)
Pasadena Signalized 4,162 D 44.5 4,319 C 23.0
Marengo Street and Corson Street (I-210 EB Ramps)
Pasadena Signalized 2,564 B 16.0 2,635 B 16.5
Marengo Street and Maple Street (I-210 WB Ramps)
Pasadena Signalized 1,908 C 23.7 2,047 C 25.6
San Rafael Avenue and SR 134 EB Ramps
Pasadena Signalized 1,284 A 2.9 1,126 A 3.4
San Rafael Avenue and SR 134 WB Ramps
Pasadena Signalized 815 B 13.7 759 B 13.2
Rosemead Boulevard and Lower Azusa Road
Rosemead Signalized 3,081 C 27.9c 3,233 C 24.1c
Rosemead Boulevard and Marshall Street
Rosemead Signalized 3,639 C 30.6 4,235 D 43.4
Rosemead Boulevard and Mission Drive
Rosemead Signalized 3,856 D 47.7 4,112 D 50.3
Rosemead Boulevard and Valley Boulevard
Rosemead Signalized 4,129 D 50.3 4,562 E 55.7
Rosemead Boulevard and Huntington Drive
San Gabriel Signalized 3,910 C 31.7 5,156 D 48.6
Fair Oaks Avenue and SR 110 NB Off-Ramp
South Pasadena Signalized 2,803 A 9.6 3,555 B 18.0
Fair Oaks Avenue and SR 110 SB On-Ramps
South Pasadena Signalized 3,238 B 15.0 3,224 B 14.5
Rosemead Boulevard and Las Tunas Drive
Temple City Signalized 2,979 C 33.3 3,991 D 38.7
a Seconds per vehicle b Represents highest delay at any approach for two-way stop-controlled intersection c Geometry cannot be analyzed with HCM 2010, so HCM 2000 was used NB – northbound; SB – southbound; EB – eastbound; WB – westbound
Draft Project Report January 2015
14
CH2M HILL
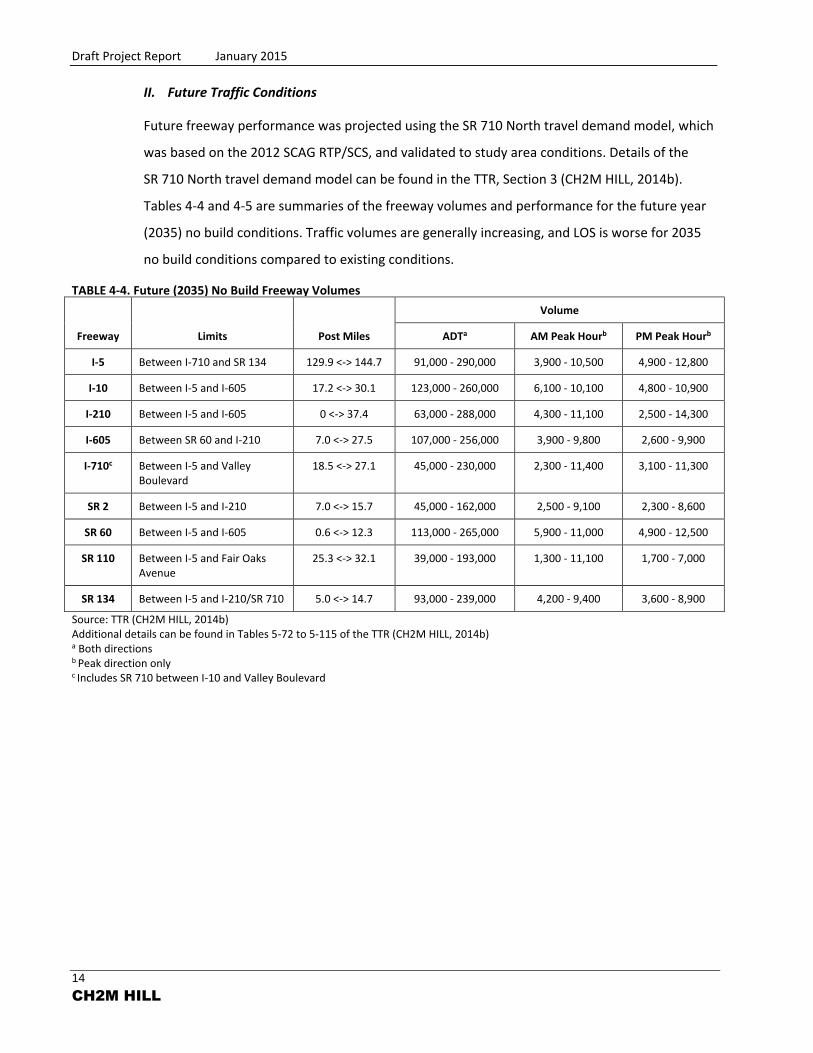
II. Future Traffic Conditions
Future freeway performance was projected using the SR 710 North travel demand model, which
was based on the 2012 SCAG RTP/SCS, and validated to study area conditions. Details of the
SR 710 North travel demand model can be found in the TTR, Section 3 (CH2M HILL, 2014b).
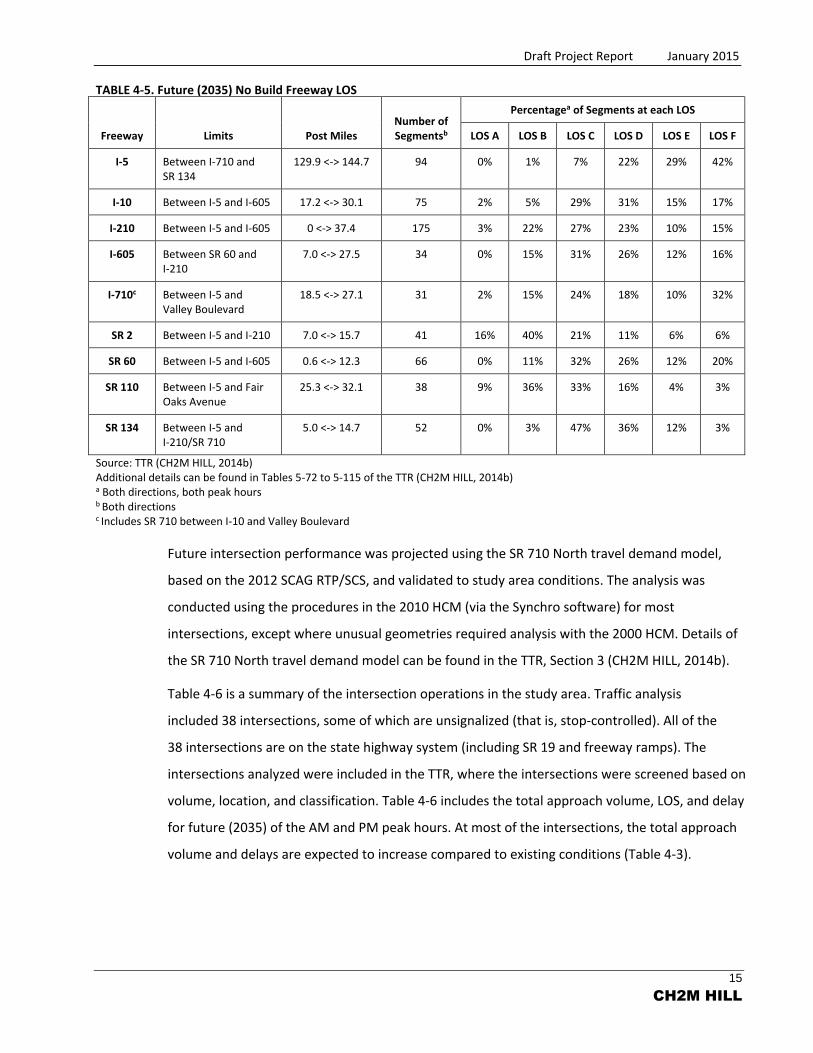
Tables 4-4 and 4-5 are summaries of the freeway volumes and performance for the future year
(2035) no build conditions. Traffic volumes are generally increasing, and LOS is worse for 2035
no build conditions compared to existing conditions.
TABLE 4-4. Future (2035) No Build Freeway Volumes
Freeway Limits Post Miles
Volume
ADTa AM Peak Hourb PM Peak Hourb
I-5 Between I-710 and SR 134 129.9 <-> 144.7 91,000 - 290,000 3,900 - 10,500 4,900 - 12,800
I-10 Between I-5 and I-605 17.2 <-> 30.1 123,000 - 260,000 6,100 - 10,100 4,800 - 10,900
I-210 Between I-5 and I-605 0 <-> 37.4 63,000 - 288,000 4,300 - 11,100 2,500 - 14,300
I-605 Between SR 60 and I-210 7.0 <-> 27.5 107,000 - 256,000 3,900 - 9,800 2,600 - 9,900
I-710c Between I-5 and Valley Boulevard
18.5 <-> 27.1 45,000 - 230,000 2,300 - 11,400 3,100 - 11,300
SR 2 Between I-5 and I-210 7.0 <-> 15.7 45,000 - 162,000 2,500 - 9,100 2,300 - 8,600
SR 60 Between I-5 and I-605 0.6 <-> 12.3 113,000 - 265,000 5,900 - 11,000 4,900 - 12,500
SR 110 Between I-5 and Fair Oaks Avenue
25.3 <-> 32.1 39,000 - 193,000 1,300 - 11,100 1,700 - 7,000
SR 134 Between I-5 and I-210/SR 710 5.0 <-> 14.7 93,000 - 239,000 4,200 - 9,400 3,600 - 8,900
Source: TTR (CH2M HILL, 2014b) Additional details can be found in Tables 5-72 to 5-115 of the TTR (CH2M HILL, 2014b) a Both directions b Peak direction only c Includes SR 710 between I-10 and Valley Boulevard
Draft Project Report January 2015
15
CH2M HILL
TABLE 4-5. Future (2035) No Build Freeway LOS
Freeway Limits Post Miles Number of Segmentsb
Percentagea of Segments at each LOS
LOS A LOS B LOS C LOS D LOS E LOS F
I-5 Between I-710 and SR 134
129.9 <-> 144.7 94 0% 1% 7% 22% 29% 42%
I-10 Between I-5 and I-605 17.2 <-> 30.1 75 2% 5% 29% 31% 15% 17%
I-210 Between I-5 and I-605 0 <-> 37.4 175 3% 22% 27% 23% 10% 15%
I-605 Between SR 60 and I-210
7.0 <-> 27.5 34 0% 15% 31% 26% 12% 16%
I-710c Between I-5 and Valley Boulevard
18.5 <-> 27.1 31 2% 15% 24% 18% 10% 32%
SR 2 Between I-5 and I-210 7.0 <-> 15.7 41 16% 40% 21% 11% 6% 6%
SR 60 Between I-5 and I-605 0.6 <-> 12.3 66 0% 11% 32% 26% 12% 20%
SR 110 Between I-5 and Fair Oaks Avenue
25.3 <-> 32.1 38 9% 36% 33% 16% 4% 3%
SR 134 Between I-5 and I-210/SR 710
5.0 <-> 14.7 52 0% 3% 47% 36% 12% 3%
Source: TTR (CH2M HILL, 2014b) Additional details can be found in Tables 5-72 to 5-115 of the TTR (CH2M HILL, 2014b) a Both directions, both peak hours b Both directions c Includes SR 710 between I-10 and Valley Boulevard
Future intersection performance was projected using the SR 710 North travel demand model,
based on the 2012 SCAG RTP/SCS, and validated to study area conditions. The analysis was
conducted using the procedures in the 2010 HCM (via the Synchro software) for most
intersections, except where unusual geometries required analysis with the 2000 HCM. Details of
the SR 710 North travel demand model can be found in the TTR, Section 3 (CH2M HILL, 2014b).
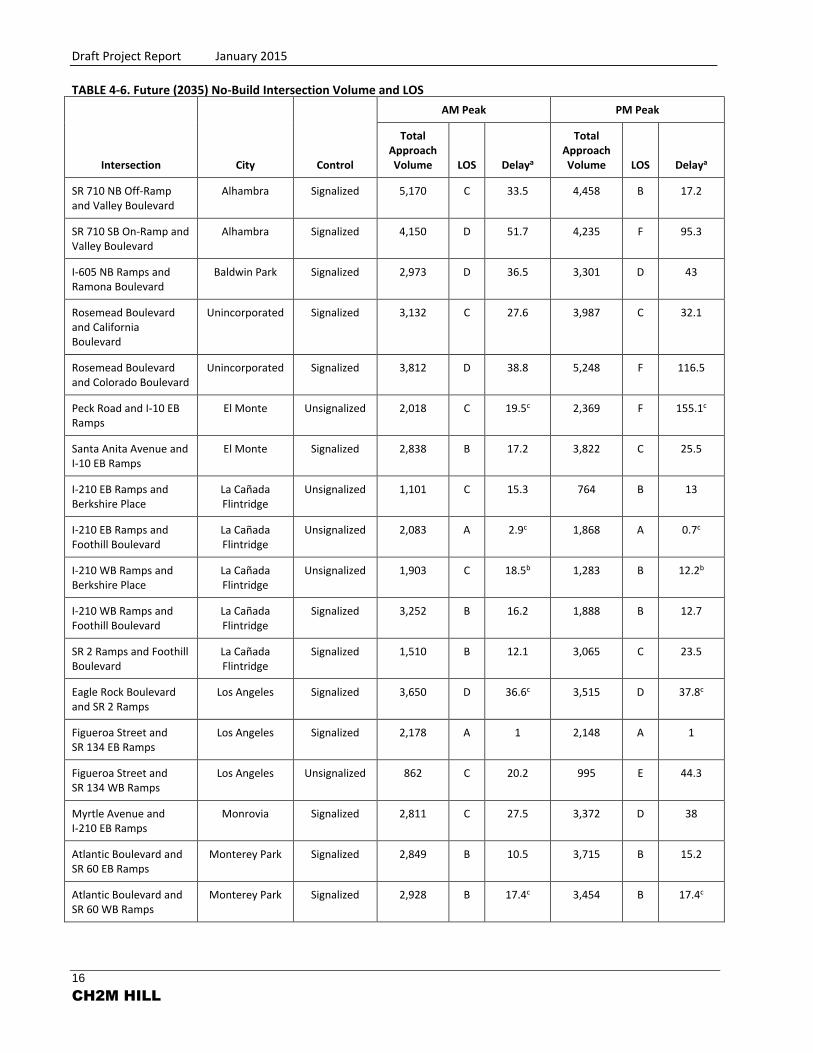
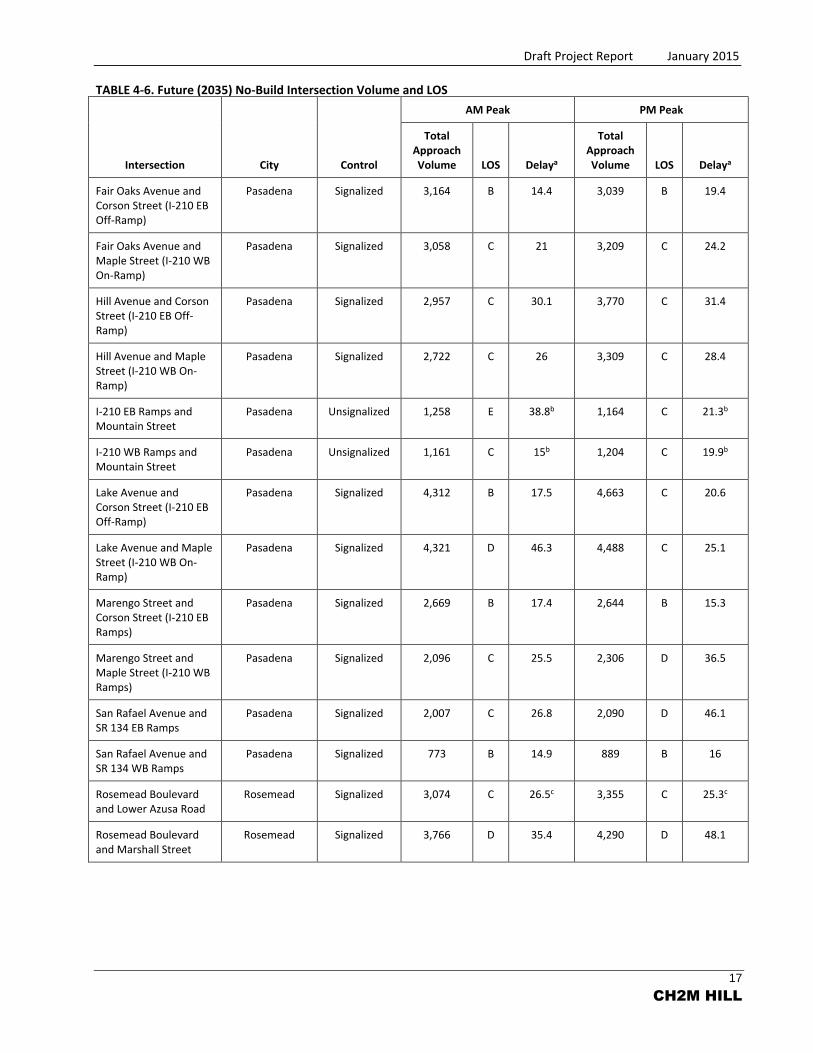
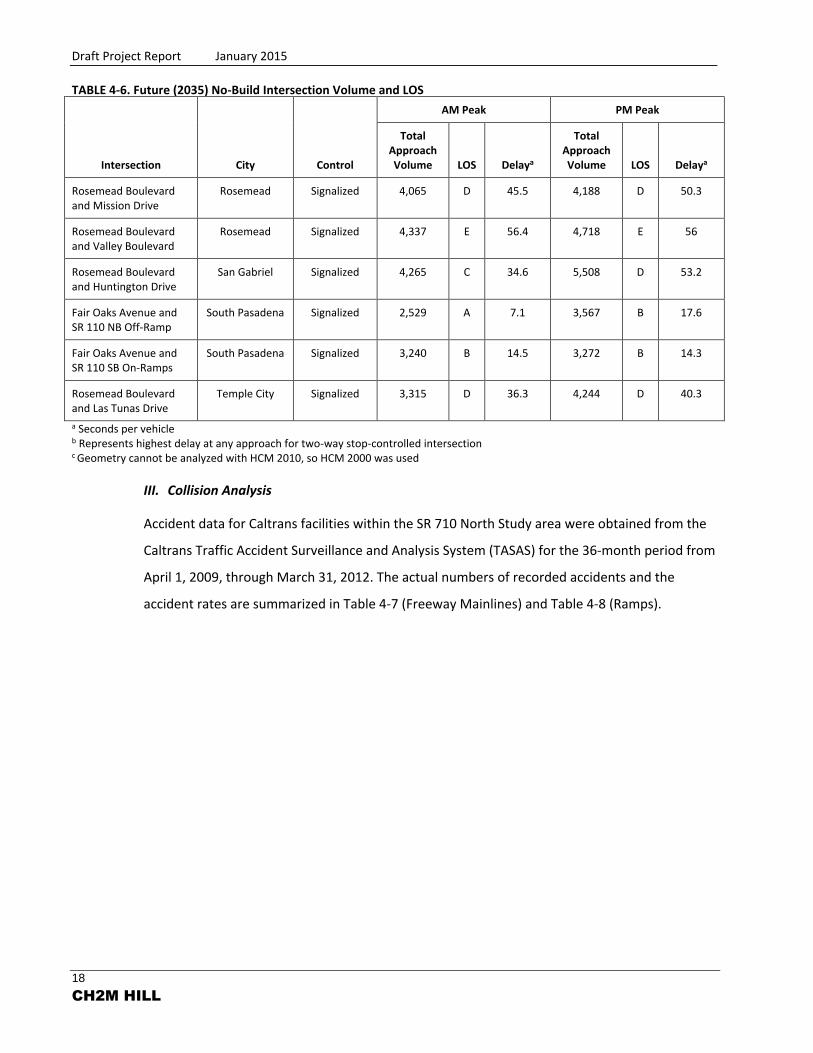
Table 4-6 is a summary of the intersection operations in the study area. Traffic analysis
included 38 intersections, some of which are unsignalized (that is, stop-controlled). All of the
38 intersections are on the state highway system (including SR 19 and freeway ramps). The
intersections analyzed were included in the TTR, where the intersections were screened based on
volume, location, and classification. Table 4-6 includes the total approach volume, LOS, and delay
for future (2035) of the AM and PM peak hours. At most of the intersections, the total approach
volume and delays are expected to increase compared to existing conditions (Table 4-3).
Draft Project Report January 2015
16
CH2M HILL
TABLE 4-6. Future (2035) No-Build Intersection Volume and LOS
Intersection City Control
AM Peak PM Peak
Total Approach Volume LOS Delaya
Total Approach Volume LOS Delaya
SR 710 NB Off-Ramp and Valley Boulevard
Alhambra Signalized 5,170 C 33.5 4,458 B 17.2
SR 710 SB On-Ramp and Valley Boulevard
Alhambra Signalized 4,150 D 51.7 4,235 F 95.3
I-605 NB Ramps and Ramona Boulevard
Baldwin Park Signalized 2,973 D 36.5 3,301 D 43
Rosemead Boulevard and California Boulevard
Unincorporated Signalized 3,132 C 27.6 3,987 C 32.1
Rosemead Boulevard and Colorado Boulevard
Unincorporated Signalized 3,812 D 38.8 5,248 F 116.5
Peck Road and I-10 EB Ramps
El Monte Unsignalized 2,018 C 19.5c 2,369 F 155.1c
Santa Anita Avenue and I-10 EB Ramps
El Monte Signalized 2,838 B 17.2 3,822 C 25.5
I-210 EB Ramps and Berkshire Place
La Cañada Flintridge
Unsignalized 1,101 C 15.3 764 B 13
I-210 EB Ramps and Foothill Boulevard
La Cañada Flintridge
Unsignalized 2,083 A 2.9c 1,868 A 0.7c
I-210 WB Ramps and Berkshire Place
La Cañada Flintridge
Unsignalized 1,903 C 18.5b 1,283 B 12.2b
I-210 WB Ramps and Foothill Boulevard
La Cañada Flintridge
Signalized 3,252 B 16.2 1,888 B 12.7
SR 2 Ramps and Foothill Boulevard
La Cañada Flintridge
Signalized 1,510 B 12.1 3,065 C 23.5
Eagle Rock Boulevard and SR 2 Ramps
Los Angeles Signalized 3,650 D 36.6c 3,515 D 37.8c
Figueroa Street and SR 134 EB Ramps
Los Angeles Signalized 2,178 A 1 2,148 A 1
Figueroa Street and SR 134 WB Ramps
Los Angeles Unsignalized 862 C 20.2 995 E 44.3
Myrtle Avenue and I-210 EB Ramps
Monrovia Signalized 2,811 C 27.5 3,372 D 38
Atlantic Boulevard and SR 60 EB Ramps
Monterey Park Signalized 2,849 B 10.5 3,715 B 15.2
Atlantic Boulevard and SR 60 WB Ramps
Monterey Park Signalized 2,928 B 17.4c 3,454 B 17.4c
Draft Project Report January 2015
17
CH2M HILL
TABLE 4-6. Future (2035) No-Build Intersection Volume and LOS
Intersection City Control
AM Peak PM Peak
Total Approach Volume LOS Delaya
Total Approach Volume LOS Delaya
Fair Oaks Avenue and Corson Street (I-210 EB Off-Ramp)
Pasadena Signalized 3,164 B 14.4 3,039 B 19.4
Fair Oaks Avenue and Maple Street (I-210 WB On-Ramp)
Pasadena Signalized 3,058 C 21 3,209 C 24.2
Hill Avenue and Corson Street (I-210 EB Off-Ramp)
Pasadena Signalized 2,957 C 30.1 3,770 C 31.4
Hill Avenue and Maple Street (I-210 WB On-Ramp)
Pasadena Signalized 2,722 C 26 3,309 C 28.4
I-210 EB Ramps and Mountain Street
Pasadena Unsignalized 1,258 E 38.8b 1,164 C 21.3b
I-210 WB Ramps and Mountain Street
Pasadena Unsignalized 1,161 C 15b 1,204 C 19.9b
Lake Avenue and Corson Street (I-210 EB Off-Ramp)
Pasadena Signalized 4,312 B 17.5 4,663 C 20.6
Lake Avenue and Maple Street (I-210 WB On-Ramp)
Pasadena Signalized 4,321 D 46.3 4,488 C 25.1
Marengo Street and Corson Street (I-210 EB Ramps)
Pasadena Signalized 2,669 B 17.4 2,644 B 15.3
Marengo Street and Maple Street (I-210 WB Ramps)
Pasadena Signalized 2,096 C 25.5 2,306 D 36.5
San Rafael Avenue and SR 134 EB Ramps
Pasadena Signalized 2,007 C 26.8 2,090 D 46.1
San Rafael Avenue and SR 134 WB Ramps
Pasadena Signalized 773 B 14.9 889 B 16
Rosemead Boulevard and Lower Azusa Road
Rosemead Signalized 3,074 C 26.5c 3,355 C 25.3c
Rosemead Boulevard and Marshall Street
Rosemead Signalized 3,766 D 35.4 4,290 D 48.1
Draft Project Report January 2015
18
CH2M HILL
TABLE 4-6. Future (2035) No-Build Intersection Volume and LOS
Intersection City Control
AM Peak PM Peak
Total Approach Volume LOS Delaya
Total Approach Volume LOS Delaya
Rosemead Boulevard and Mission Drive
Rosemead Signalized 4,065 D 45.5 4,188 D 50.3
Rosemead Boulevard and Valley Boulevard
Rosemead Signalized 4,337 E 56.4 4,718 E 56
Rosemead Boulevard and Huntington Drive
San Gabriel Signalized 4,265 C 34.6 5,508 D 53.2
Fair Oaks Avenue and SR 110 NB Off-Ramp
South Pasadena Signalized 2,529 A 7.1 3,567 B 17.6
Fair Oaks Avenue and SR 110 SB On-Ramps
South Pasadena Signalized 3,240 B 14.5 3,272 B 14.3
Rosemead Boulevard and Las Tunas Drive
Temple City Signalized 3,315 D 36.3 4,244 D 40.3
a Seconds per vehicle b Represents highest delay at any approach for two-way stop-controlled intersection c Geometry cannot be analyzed with HCM 2010, so HCM 2000 was used
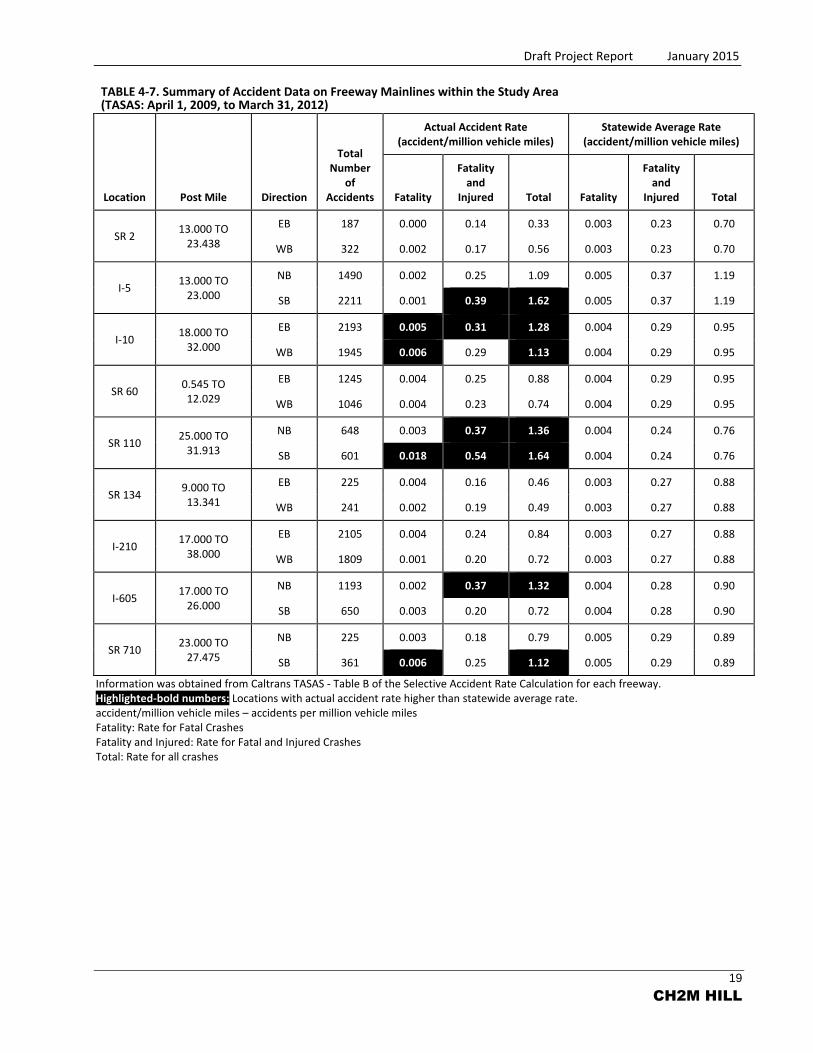
III. Collision Analysis
Accident data for Caltrans facilities within the SR 710 North Study area were obtained from the
Caltrans Traffic Accident Surveillance and Analysis System (TASAS) for the 36-month period from
April 1, 2009, through March 31, 2012. The actual numbers of recorded accidents and the
accident rates are summarized in Table 4-7 (Freeway Mainlines) and Table 4-8 (Ramps).
Draft Project Report January 2015
19
CH2M HILL
TABLE 4-7. Summary of Accident Data on Freeway Mainlines within the Study Area (TASAS: April 1, 2009, to March 31, 2012)
Location Post Mile Direction
Total Number
of Accidents
Actual Accident Rate (accident/million vehicle miles)
Statewide Average Rate (accident/million vehicle miles)
Fatality
Fatality and
Injured Total Fatality
Fatality and
Injured Total
SR 2 13.000 TO
23.438
EB 187 0.000 0.14 0.33 0.003 0.23 0.70
WB 322 0.002 0.17 0.56 0.003 0.23 0.70
I-5 13.000 TO
23.000
NB 1490 0.002 0.25 1.09 0.005 0.37 1.19
SB 2211 0.001 0.39 1.62 0.005 0.37 1.19
I-10 18.000 TO
32.000
EB 2193 0.005 0.31 1.28 0.004 0.29 0.95
WB 1945 0.006 0.29 1.13 0.004 0.29 0.95
SR 60 0.545 TO 12.029
EB 1245 0.004 0.25 0.88 0.004 0.29 0.95
WB 1046 0.004 0.23 0.74 0.004 0.29 0.95
SR 110 25.000 TO
31.913
NB 648 0.003 0.37 1.36 0.004 0.24 0.76
SB 601 0.018 0.54 1.64 0.004 0.24 0.76
SR 134 9.000 TO 13.341
EB 225 0.004 0.16 0.46 0.003 0.27 0.88
WB 241 0.002 0.19 0.49 0.003 0.27 0.88
I-210 17.000 TO
38.000
EB 2105 0.004 0.24 0.84 0.003 0.27 0.88
WB 1809 0.001 0.20 0.72 0.003 0.27 0.88
I-605 17.000 TO
26.000
NB 1193 0.002 0.37 1.32 0.004 0.28 0.90
SB 650 0.003 0.20 0.72 0.004 0.28 0.90
SR 710 23.000 TO
27.475
NB 225 0.003 0.18 0.79 0.005 0.29 0.89
SB 361 0.006 0.25 1.12 0.005 0.29 0.89
Information was obtained from Caltrans TASAS - Table B of the Selective Accident Rate Calculation for each freeway. Highlighted-bold numbers: Locations with actual accident rate higher than statewide average rate. accident/million vehicle miles – accidents per million vehicle miles Fatality: Rate for Fatal Crashes Fatality and Injured: Rate for Fatal and Injured Crashes Total: Rate for all crashes
Draft Project Report January 2015
20
CH2M HILL
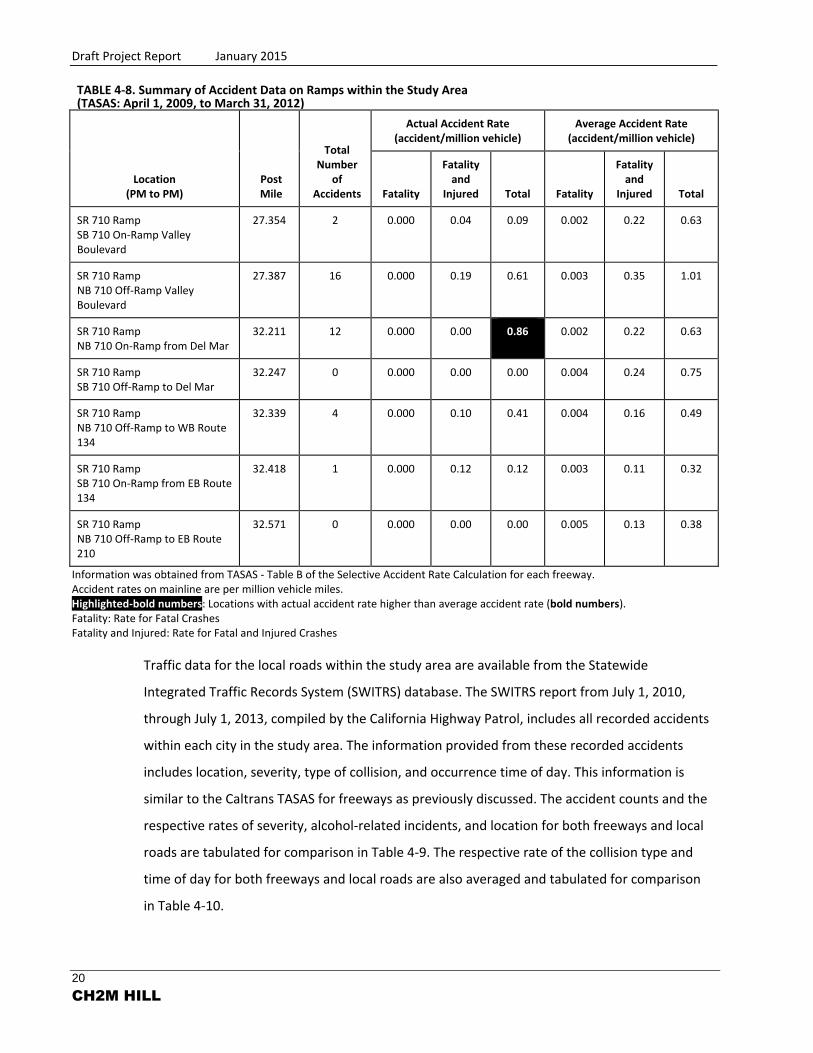
TABLE 4-8. Summary of Accident Data on Ramps within the Study Area (TASAS: April 1, 2009, to March 31, 2012)
Location (PM to PM)
Post Mile
Total Number
of Accidents
Actual Accident Rate (accident/million vehicle)
Average Accident Rate (accident/million vehicle)
Fatality
Fatality and
Injured Total Fatality
Fatality and
Injured Total
SR 710 Ramp SB 710 On-Ramp Valley Boulevard
27.354 2 0.000 0.04 0.09 0.002 0.22 0.63
SR 710 Ramp NB 710 Off-Ramp Valley Boulevard
27.387 16 0.000 0.19 0.61 0.003 0.35 1.01
SR 710 Ramp NB 710 On-Ramp from Del Mar
32.211 12 0.000 0.00 0.86 0.002 0.22 0.63
SR 710 Ramp SB 710 Off-Ramp to Del Mar
32.247 0 0.000 0.00 0.00 0.004 0.24 0.75
SR 710 Ramp NB 710 Off-Ramp to WB Route 134
32.339 4 0.000 0.10 0.41 0.004 0.16 0.49
SR 710 Ramp SB 710 On-Ramp from EB Route 134
32.418 1 0.000 0.12 0.12 0.003 0.11 0.32
SR 710 Ramp NB 710 Off-Ramp to EB Route 210
32.571 0 0.000 0.00 0.00 0.005 0.13 0.38
Information was obtained from TASAS - Table B of the Selective Accident Rate Calculation for each freeway. Accident rates on mainline are per million vehicle miles. Highlighted-bold numbers: Locations with actual accident rate higher than average accident rate (bold numbers). Fatality: Rate for Fatal Crashes Fatality and Injured: Rate for Fatal and Injured Crashes
Traffic data for the local roads within the study area are available from the Statewide
Integrated Traffic Records System (SWITRS) database. The SWITRS report from July 1, 2010,
through July 1, 2013, compiled by the California Highway Patrol, includes all recorded accidents
within each city in the study area. The information provided from these recorded accidents
includes location, severity, type of collision, and occurrence time of day. This information is
similar to the Caltrans TASAS for freeways as previously discussed. The accident counts and the
respective rates of severity, alcohol-related incidents, and location for both freeways and local
roads are tabulated for comparison in Table 4-9. The respective rate of the collision type and
time of day for both freeways and local roads are also averaged and tabulated for comparison
in Table 4-10.

Draft Project Report January 2015
21
CH2M HILL
TABLE 4-9. Local Street and Caltrans Accident Data Comparisona (Accident Counts, Rate of Severity, Alcohol-Related Accidents, and Location)
City
Year (Number of accidents)
Severity (%)b
Alcohol (%)b
State Highway (%)b
2010-2011
2011-2012
2012-2013 Total PDO Injury Fatality Alcohol? Yes No
Alhambra 970 1,026 242 2,238 73% 27% 0.1% 4% 0% 100%
Baldwin Park 296 384 77 757 61% 39% 0.7% 11% 3% 97%
El Monte 612 623 266 1,501 40% 60% 0.1% 12% 2% 98%
Los Angeles 33,611 33,811 14,950 82,372 33% 66% 0.7% 9% 2% 98%
Monrovia 282 285 100 667 56% 44% 0.1% 9% 3% 97%
Monterey Park 436 521 163 1,120 59% 41% 0.4% 6% 1% 99%
Pasadena 1,786 1,650 497 3,933 52% 48% 0.3% 6% 2% 98%
San Gabriel 276 253 125 654 38% 62% 0.3% 14% 1% 99%
South Pasadena 168 153 46 367 42% 58% 0.3% 11% 4% 96%
Total 38,437 38,706 16,466 93,609
Local Road Average
4,271 4,301 1,830 18,722 50% 49% 0.3% 9% 2% 98%
Freeway Average
N/A N/A N/A 2,080 71% 28% 0.4% 5% 100% 0%
a Accident data for the local street (from SWITRS) were not fully recorded for the range 2012-2013. b Data shown are the average value of the 3-year period (2010-2013). PDO – property damage only N/A – not applicable
Draft Project Report January 2015
22
CH2M HILL
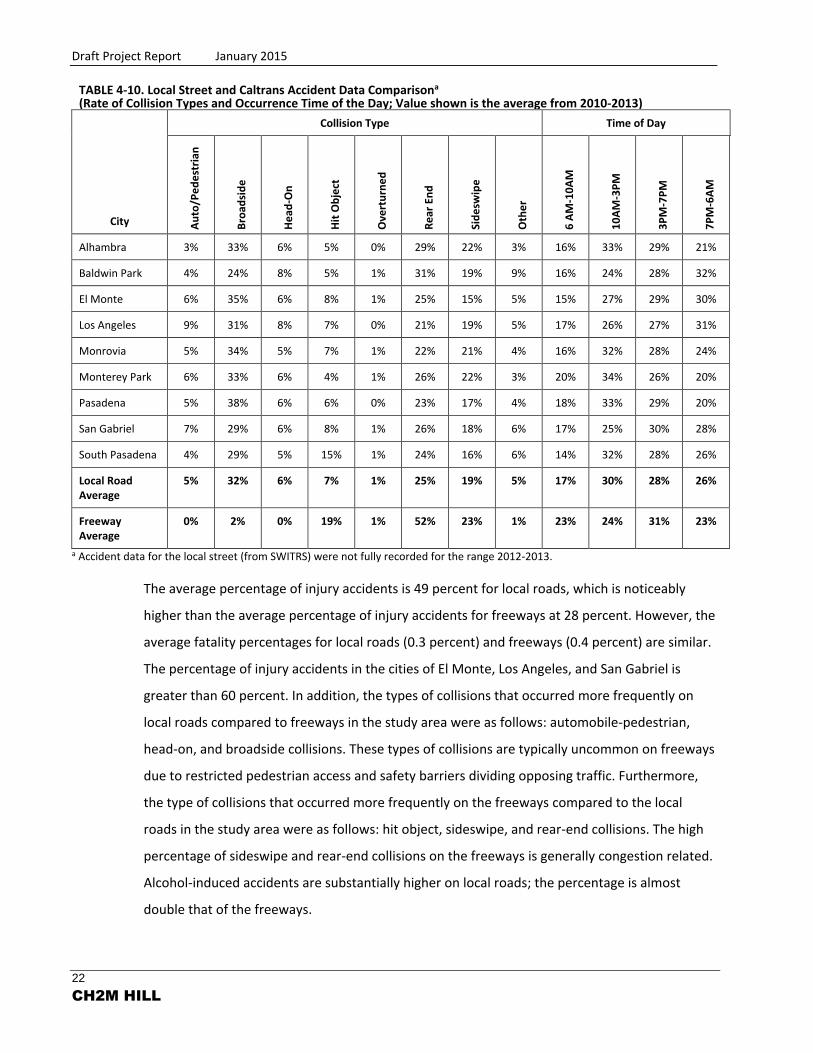
TABLE 4-10. Local Street and Caltrans Accident Data Comparisona (Rate of Collision Types and Occurrence Time of the Day; Value shown is the average from 2010-2013)
City
Collision Type Time of Day
Au
to/P
ed
est
rian
Bro
adsi
de
He
ad-O
n
Hit
Ob
ject
Ove
rtu
rne
d
Re
ar E
nd
Sid
esw
ipe
Oth
er
6 A
M-1
0A
M
10
AM
-3P
M
3P
M-7
PM
7P
M-6
AM
Alhambra 3% 33% 6% 5% 0% 29% 22% 3% 16% 33% 29% 21%
Baldwin Park 4% 24% 8% 5% 1% 31% 19% 9% 16% 24% 28% 32%
El Monte 6% 35% 6% 8% 1% 25% 15% 5% 15% 27% 29% 30%
Los Angeles 9% 31% 8% 7% 0% 21% 19% 5% 17% 26% 27% 31%
Monrovia 5% 34% 5% 7% 1% 22% 21% 4% 16% 32% 28% 24%
Monterey Park 6% 33% 6% 4% 1% 26% 22% 3% 20% 34% 26% 20%
Pasadena 5% 38% 6% 6% 0% 23% 17% 4% 18% 33% 29% 20%
San Gabriel 7% 29% 6% 8% 1% 26% 18% 6% 17% 25% 30% 28%
South Pasadena 4% 29% 5% 15% 1% 24% 16% 6% 14% 32% 28% 26%
Local Road Average
5% 32% 6% 7% 1% 25% 19% 5% 17% 30% 28% 26%
Freeway Average
0% 2% 0% 19% 1% 52% 23% 1% 23% 24% 31% 23%
a Accident data for the local street (from SWITRS) were not fully recorded for the range 2012-2013.
The average percentage of injury accidents is 49 percent for local roads, which is noticeably
higher than the average percentage of injury accidents for freeways at 28 percent. However, the
average fatality percentages for local roads (0.3 percent) and freeways (0.4 percent) are similar.
The percentage of injury accidents in the cities of El Monte, Los Angeles, and San Gabriel is
greater than 60 percent. In addition, the types of collisions that occurred more frequently on
local roads compared to freeways in the study area were as follows: automobile-pedestrian,
head-on, and broadside collisions. These types of collisions are typically uncommon on freeways
due to restricted pedestrian access and safety barriers dividing opposing traffic. Furthermore,
the type of collisions that occurred more frequently on the freeways compared to the local
roads in the study area were as follows: hit object, sideswipe, and rear-end collisions. The high
percentage of sideswipe and rear-end collisions on the freeways is generally congestion related.
Alcohol-induced accidents are substantially higher on local roads; the percentage is almost
double that of the freeways.
Draft Project Report January 2015
23
CH2M HILL
5. ALTERNATIVES
The proposed alternatives include the No Build Alternative, the TSM/TDM Alternative, the BRT
Alternative, the LRT Alternative, and the Freeway Tunnel Alternative. As discussed in the AA Report
(CH2M HILL, 2012a), a screening analysis was conducted to determine the alternatives to be carried
forward for analysis in the DEIR/EIS. The screening of alternatives followed a three-step sequential
process: preliminary screening, initial screening, and secondary screening. The proposed alternatives
(No Build, TSM/TDM, BRT, LRT, and Freeway Tunnel Alternatives) are each described below. Section B
includes transportation alternatives that were withdrawn from further consideration.
A. Viable Alternatives
I. No Build Alternative
The No Build Alternative does not include the SR 710 North Study improvements. The No Build
Alternative includes projects/planned improvements through 2035 that are contained in the
Federal Transportation Improvement Program (FTIP), as listed in the SCAG 2012 RTP/SCS,
Measure R, and the funded part of Metro’s 2009 Long-Range Transportation Plan (LRTP).
Attachment E-1 illustrates the projects included in the No Build Alternative. These projects have
been, or are being, evaluated separately.
II. Transportation System Management/Transportation Demand Management (TSM/TDM)
Alternative
The TSM/TDM Alternative consists of strategies and improvements to increase efficiency and
capacity for all modes in the transportation system with lower capital cost investments and/or
lower potential impacts. The TSM/TDM Alternative is designed to maximize the efficiency of the
existing transportation system by improving capacity and reducing the effects of bottlenecks and
chokepoints. Components of the TSM/TDM Alternative are presented in Attachment F-1.
The TSM/TDM Alternative is being evaluated as a stand‐alone alternative. Improvements
included in the TSM/TDM Alternative have also been incorporated into the other build
alternatives. The components of the TSM/TDM Alternative that are incorporated into the other
build alternatives are described under each alternative.
a. Transportation System Management (TSM)
TSM strategies increase the efficiency of existing facilities (that is, TSM strategies are actions
that increase the number of vehicle trips that a facility can carry without increasing the number
Draft Project Report January 2015
24
CH2M HILL
of through lanes). TSM also encourages automobile, public and private transit, ridesharing
programs, and bicycle and pedestrian improvements as elements of a unified urban
transportation system. Modal alternatives integrate multiple forms of transportation modes,
such as pedestrian, bicycle, automobile, rail, and mass transit. TSM strategies include Intelligent
Transportation Systems (ITS), local street and intersection improvements, and Active Traffic
Management (ATM):
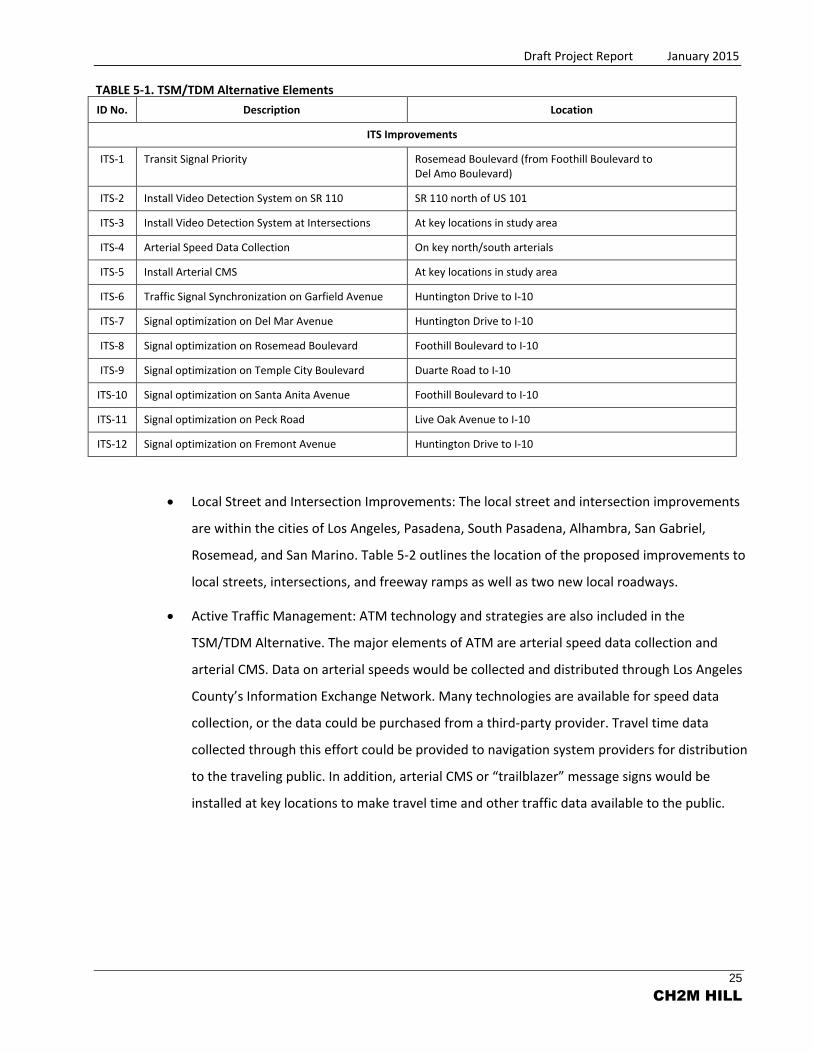
ITS Improvements: ITS improvements include traffic signal upgrades, synchronization and
transit prioritization, arterial changeable message signs (CMS), and arterial video and speed
data collection systems. The TSM/TDM Alternative includes signal optimization on corridors
with signal coordination hardware already installed by Metro's Traffic Signal Synchronization
Program (TSSP). These corridors include Del Mar Avenue, Rosemead Boulevard, Temple City
Boulevard, Santa Anita Avenue, Fair Oaks Avenue, Fremont Avenue, and Peck Road. The only
remaining major north-south corridor in the San Gabriel Valley in which TSSP has not been
implemented is Garfield Avenue; therefore, TSSP on this corridor is included in the TSM/TDM
Alternative. The locations are listed in Table 5-1. The following provides a further explanation
of the ITS elements:
Traffic signal upgrades include turn arrows, vehicle and bicycle detection, accessible
pedestrian signals, pedestrian countdown timers, incorporation into regional
management traffic center for real-time monitoring of traffic, and updating of signal
timing.
Synchronization is accomplished through signal coordination to optimize travel times
and reduce delay.
Transit signal prioritization includes adjusting signal times for transit vehicles to optimize
travel times for public transit riders.
Arterial CMS are used to alert travelers about unusual road conditions, special event
traffic, accident detours, and other incidents.
Video and speed data collection includes cameras and other vehicle detection systems
that are connected to a central monitoring location, allowing for faster detection and
response to traffic incidents and other unusual traffic conditions.
Draft Project Report January 2015
25
CH2M HILL
TABLE 5-1. TSM/TDM Alternative Elements
ID No. Description Location
ITS Improvements
ITS-1 Transit Signal Priority Rosemead Boulevard (from Foothill Boulevard to Del Amo Boulevard)
ITS-2 Install Video Detection System on SR 110 SR 110 north of US 101
ITS-3 Install Video Detection System at Intersections At key locations in study area
ITS-4 Arterial Speed Data Collection On key north/south arterials
ITS-5 Install Arterial CMS At key locations in study area
ITS-6 Traffic Signal Synchronization on Garfield Avenue Huntington Drive to I-10
ITS-7 Signal optimization on Del Mar Avenue Huntington Drive to I-10
ITS-8 Signal optimization on Rosemead Boulevard Foothill Boulevard to I-10
ITS-9 Signal optimization on Temple City Boulevard Duarte Road to I-10
ITS-10 Signal optimization on Santa Anita Avenue Foothill Boulevard to I-10
ITS-11 Signal optimization on Peck Road Live Oak Avenue to I-10
ITS-12 Signal optimization on Fremont Avenue Huntington Drive to I-10
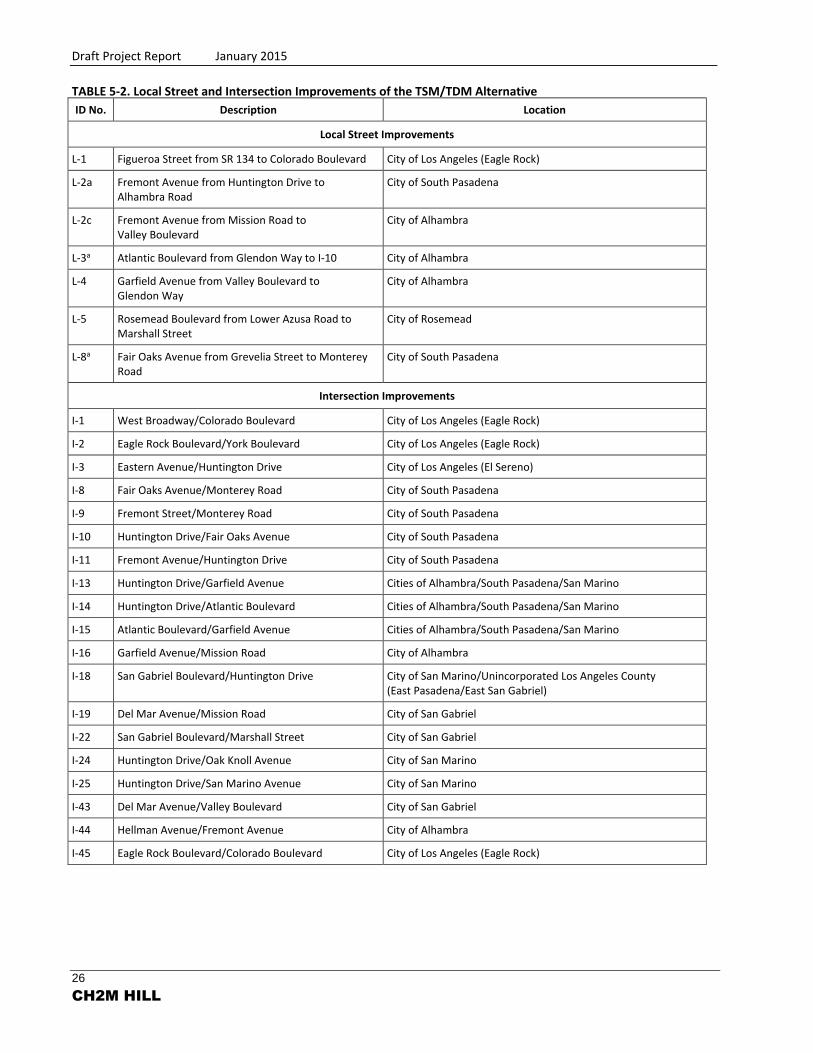
Local Street and Intersection Improvements: The local street and intersection improvements
are within the cities of Los Angeles, Pasadena, South Pasadena, Alhambra, San Gabriel,
Rosemead, and San Marino. Table 5-2 outlines the location of the proposed improvements to
local streets, intersections, and freeway ramps as well as two new local roadways.
Active Traffic Management: ATM technology and strategies are also included in the
TSM/TDM Alternative. The major elements of ATM are arterial speed data collection and
arterial CMS. Data on arterial speeds would be collected and distributed through Los Angeles
County’s Information Exchange Network. Many technologies are available for speed data
collection, or the data could be purchased from a third-party provider. Travel time data
collected through this effort could be provided to navigation system providers for distribution
to the traveling public. In addition, arterial CMS or “trailblazer” message signs would be
installed at key locations to make travel time and other traffic data available to the public.
Draft Project Report January 2015
26
CH2M HILL
TABLE 5-2. Local Street and Intersection Improvements of the TSM/TDM Alternative
ID No. Description Location
Local Street Improvements
L-1 Figueroa Street from SR 134 to Colorado Boulevard City of Los Angeles (Eagle Rock)
L-2a Fremont Avenue from Huntington Drive to Alhambra Road
City of South Pasadena
L-2c Fremont Avenue from Mission Road to Valley Boulevard
City of Alhambra
L-3a Atlantic Boulevard from Glendon Way to I-10 City of Alhambra
L-4 Garfield Avenue from Valley Boulevard to Glendon Way
City of Alhambra
L-5 Rosemead Boulevard from Lower Azusa Road to Marshall Street
City of Rosemead
L-8a Fair Oaks Avenue from Grevelia Street to Monterey Road
City of South Pasadena
Intersection Improvements
I-1 West Broadway/Colorado Boulevard City of Los Angeles (Eagle Rock)
I-2 Eagle Rock Boulevard/York Boulevard City of Los Angeles (Eagle Rock)
I-3 Eastern Avenue/Huntington Drive City of Los Angeles (El Sereno)
I-8 Fair Oaks Avenue/Monterey Road City of South Pasadena
I-9 Fremont Street/Monterey Road City of South Pasadena
I-10 Huntington Drive/Fair Oaks Avenue City of South Pasadena
I-11 Fremont Avenue/Huntington Drive City of South Pasadena
I-13 Huntington Drive/Garfield Avenue Cities of Alhambra/South Pasadena/San Marino
I-14 Huntington Drive/Atlantic Boulevard Cities of Alhambra/South Pasadena/San Marino
I-15 Atlantic Boulevard/Garfield Avenue Cities of Alhambra/South Pasadena/San Marino
I-16 Garfield Avenue/Mission Road City of Alhambra
I-18 San Gabriel Boulevard/Huntington Drive City of San Marino/Unincorporated Los Angeles County (East Pasadena/East San Gabriel)
I-19 Del Mar Avenue/Mission Road City of San Gabriel
I-22 San Gabriel Boulevard/Marshall Street City of San Gabriel
I-24 Huntington Drive/Oak Knoll Avenue City of San Marino
I-25 Huntington Drive/San Marino Avenue City of San Marino
I-43 Del Mar Avenue/Valley Boulevard City of San Gabriel
I-44 Hellman Avenue/Fremont Avenue City of Alhambra
I-45 Eagle Rock Boulevard/Colorado Boulevard City of Los Angeles (Eagle Rock)

Draft Project Report January 2015
27
CH2M HILL
TABLE 5-2. Local Street and Intersection Improvements of the TSM/TDM Alternative
ID No. Description Location
Other Road Improvements
T-1b Valley Boulevard to Mission Road Connector Cities of Alhambra/Los Angeles (El Sereno)
T-2 SR 110/Fair Oaks Avenue Hook Ramps Cities of South Pasadena/Pasadena
T-3c St. John Avenue Extension between Del Mar Avenue and California Boulevard
City of Pasadena
a Local Street Improvements L-3 and L-8 would not be constructed with the BRT Alternative. b Other Road Improvement T-1 would only be constructed with the TSM/TDM and BRT Alternatives. c Other Road Improvement T-3 would not be constructed with either the dual-bore or single-bore design variation of the Freeway Tunnel Alternative.
b. Transportation Demand Management (TDM)
TDM strategies focus on regional means of reducing the number of vehicle trips and vehicle
miles traveled as well as increasing vehicle occupancy. TDM strategies facilitate higher vehicle
occupancy or reduce traffic congestion by expanding the traveler’s transportation options in
terms of travel method, travel time, travel route, travel costs, and the quality and convenience
of the travel experience. The TDM strategies include reducing the demand for travel during peak
periods, reducing the use of motor vehicles, shifting the use of motor vehicles to uncongested
times of the day, encouraging rideshare and transit use, eliminating trips (telecommuting), and
improved transportation options. The TDM strategies associated with the TSM/TDM Alternative
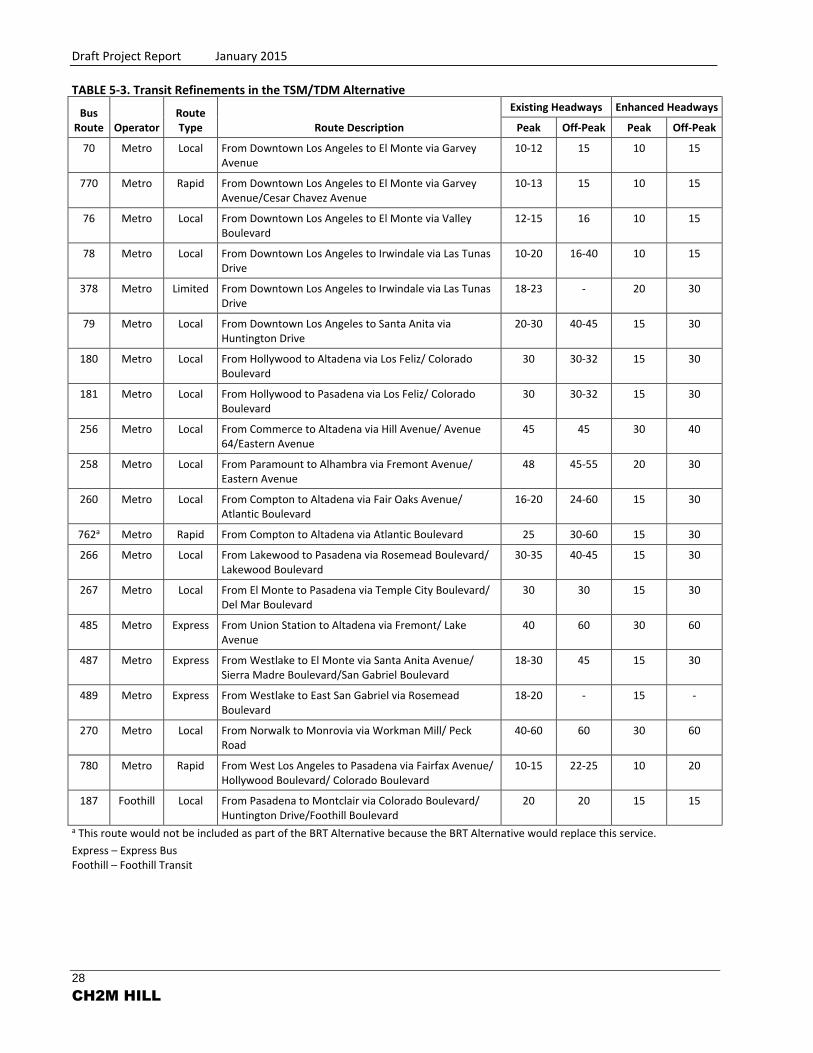
include expanded bus service, bus service improvements, and bicycle improvements:
Expanded Bus Service and Bus Service Improvements: Transit service improvements included
in the TSM/TDM Alternative are summarized in Tables 5-3 and 5-4 and illustrated in
Attachment F-1. The transit service improvements enhance bus headways between 10 and
30 minutes during the peak hour and 15 to 60 minutes during the off-peak period. Bus
headways are the amount of time between consecutive bus trips (traveling in the same
direction) on the bus route. Some of the bus service enhancements almost double existing
bus service.
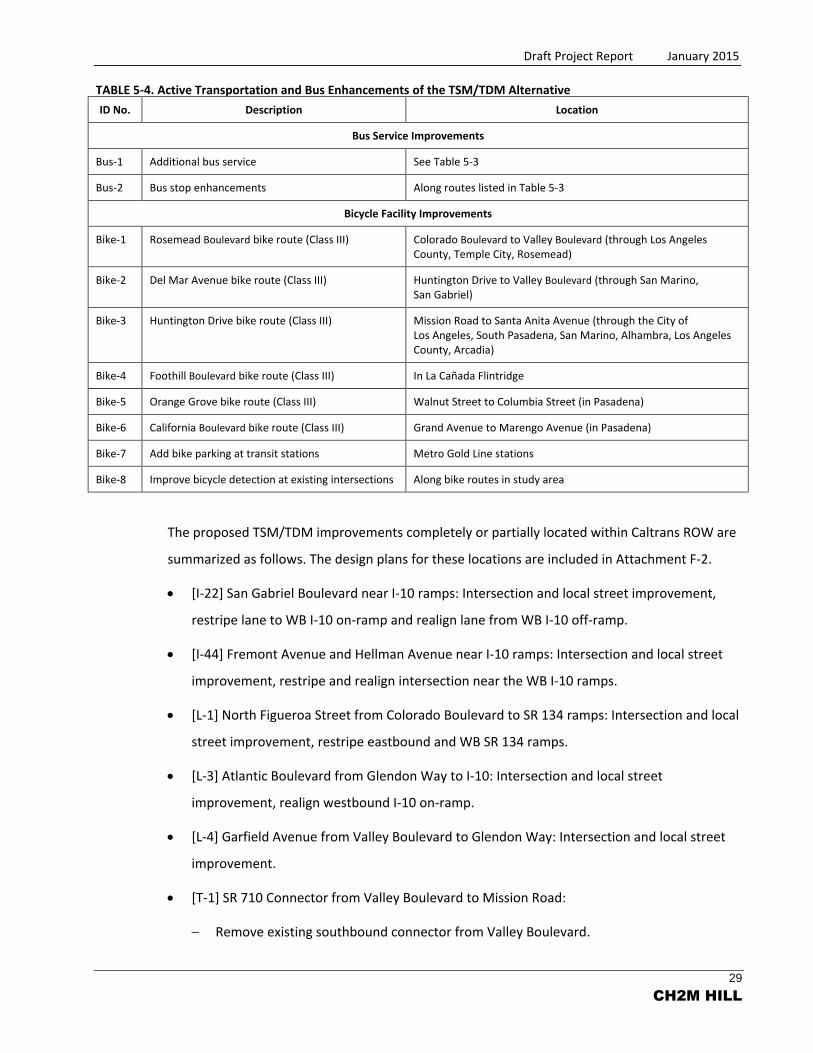
Bicycle Facility Improvements: The bicycle facility improvements include on-street Class III
bicycle facilities that support access to transit facilities through the study area and expansion
of bicycle parking facilities at existing Metro Gold Line stations. Proposed bicycle facility
improvements are outlined in Table 5-4.
Draft Project Report January 2015
28
CH2M HILL
TABLE 5-3. Transit Refinements in the TSM/TDM Alternative
Bus Route Operator
Route Type Route Description
Existing Headways Enhanced Headways
Peak Off-Peak Peak Off-Peak
70 Metro Local From Downtown Los Angeles to El Monte via Garvey Avenue
10-12 15 10 15
770 Metro Rapid From Downtown Los Angeles to El Monte via Garvey Avenue/Cesar Chavez Avenue
10-13 15 10 15
76 Metro Local From Downtown Los Angeles to El Monte via Valley Boulevard
12-15 16 10 15
78 Metro Local From Downtown Los Angeles to Irwindale via Las Tunas Drive
10-20 16-40 10 15
378 Metro Limited From Downtown Los Angeles to Irwindale via Las Tunas Drive
18-23 - 20 30
79 Metro Local From Downtown Los Angeles to Santa Anita via Huntington Drive
20-30 40-45 15 30
180 Metro Local From Hollywood to Altadena via Los Feliz/ Colorado Boulevard
30 30-32 15 30
181 Metro Local From Hollywood to Pasadena via Los Feliz/ Colorado Boulevard
30 30-32 15 30
256 Metro Local From Commerce to Altadena via Hill Avenue/ Avenue 64/Eastern Avenue
45 45 30 40
258 Metro Local From Paramount to Alhambra via Fremont Avenue/ Eastern Avenue
48 45-55 20 30
260 Metro Local From Compton to Altadena via Fair Oaks Avenue/ Atlantic Boulevard
16-20 24-60 15 30
762a Metro Rapid From Compton to Altadena via Atlantic Boulevard 25 30-60 15 30
266 Metro Local From Lakewood to Pasadena via Rosemead Boulevard/ Lakewood Boulevard
30-35 40-45 15 30
267 Metro Local From El Monte to Pasadena via Temple City Boulevard/ Del Mar Boulevard
30 30 15 30
485 Metro Express From Union Station to Altadena via Fremont/ Lake Avenue
40 60 30 60
487 Metro Express From Westlake to El Monte via Santa Anita Avenue/ Sierra Madre Boulevard/San Gabriel Boulevard
18-30 45 15 30
489 Metro Express From Westlake to East San Gabriel via Rosemead Boulevard
18-20 - 15 -
270 Metro Local From Norwalk to Monrovia via Workman Mill/ Peck Road
40-60 60 30 60
780 Metro Rapid From West Los Angeles to Pasadena via Fairfax Avenue/ Hollywood Boulevard/ Colorado Boulevard
10-15 22-25 10 20
187 Foothill Local From Pasadena to Montclair via Colorado Boulevard/ Huntington Drive/Foothill Boulevard
20 20 15 15
a This route would not be included as part of the BRT Alternative because the BRT Alternative would replace this service.
Express – Express Bus Foothill – Foothill Transit
Draft Project Report January 2015
29
CH2M HILL
TABLE 5-4. Active Transportation and Bus Enhancements of the TSM/TDM Alternative
ID No. Description Location
Bus Service Improvements
Bus-1 Additional bus service See Table 5-3
Bus-2 Bus stop enhancements Along routes listed in Table 5-3
Bicycle Facility Improvements
Bike-1 Rosemead Boulevard bike route (Class III) Colorado Boulevard to Valley Boulevard (through Los Angeles County, Temple City, Rosemead)
Bike-2 Del Mar Avenue bike route (Class III) Huntington Drive to Valley Boulevard (through San Marino, San Gabriel)
Bike-3 Huntington Drive bike route (Class III) Mission Road to Santa Anita Avenue (through the City of Los Angeles, South Pasadena, San Marino, Alhambra, Los Angeles County, Arcadia)
Bike-4 Foothill Boulevard bike route (Class III) In La Cañada Flintridge
Bike-5 Orange Grove bike route (Class III) Walnut Street to Columbia Street (in Pasadena)
Bike-6 California Boulevard bike route (Class III) Grand Avenue to Marengo Avenue (in Pasadena)
Bike-7 Add bike parking at transit stations Metro Gold Line stations
Bike-8 Improve bicycle detection at existing intersections Along bike routes in study area
The proposed TSM/TDM improvements completely or partially located within Caltrans ROW are
summarized as follows. The design plans for these locations are included in Attachment F-2.
[I-22] San Gabriel Boulevard near I-10 ramps: Intersection and local street improvement,
restripe lane to WB I-10 on-ramp and realign lane from WB I-10 off-ramp.
[I-44] Fremont Avenue and Hellman Avenue near I-10 ramps: Intersection and local street
improvement, restripe and realign intersection near the WB I-10 ramps.
[L-1] North Figueroa Street from Colorado Boulevard to SR 134 ramps: Intersection and local
street improvement, restripe eastbound and WB SR 134 ramps.
[L-3] Atlantic Boulevard from Glendon Way to I-10: Intersection and local street
improvement, realign westbound I-10 on-ramp.
[L-4] Garfield Avenue from Valley Boulevard to Glendon Way: Intersection and local street
improvement.
[T-1] SR 710 Connector from Valley Boulevard to Mission Road:
Remove existing southbound connector from Valley Boulevard.
Draft Project Report January 2015
30
CH2M HILL
[T-1] SR 710 Connector at Valley Boulevard:
Propose intersection and local street improvement.
Add two-lane SR 710 connector from Valley Boulevard.
Realign and restripe northbound SR 710 connector to Valley Boulevard.
Add new four-lane SR 710 connector north of Valley Boulevard.
[T-1] SR 710 Connector at Alhambra Avenue:
Add new four-lane SR 710 connector south of Alhambra Avenue.
Add roundabout at the intersection of SR 710 connector and Alhambra Avenue.
[T-2] SR 110 Hook Ramps and Fair Oaks Avenue:
Propose intersection and local street improvement.
Add one through-lane and one right-turn-only lane to the northbound SR 110 off-ramp,
and restripe the existing ramp lanes for left-turning traffic only.
Construct additional retaining walls.
[T-2] SR 110 and State Street:
Realign the southbound SR 110 off-ramp to State Street.
Add new southbound SR 710 on-ramp from State Street.
[T-2] SR 110 and State Street:
Realign the southbound SR 110 off-ramp to State Street.
[T-3] St. John Avenue from California Boulevard to Del Mar Boulevard:
Add extension of St. John Avenue.
Realign the southbound SR 710 off-ramp to California Boulevard.
III. Bus Rapid Transit (BRT) Alternative
The BRT Alternative would provide high-speed, high-frequency bus service through a
combination of the existing bus lanes, new dedicated bus lanes, and mixed-flow traffic lanes to
key destinations between East Los Angeles and Pasadena. Attachment G-1 illustrates the route
of the BRT Alternative, which is approximately 12 miles in length, crossing I-10, SR 60, and
SR 110 with minor impacts to Caltrans ROW. The plans of the proposed BRT design within
Draft Project Report January 2015
31
CH2M HILL
Caltrans ROW are also included in Attachment G-2. A complete discussion and proposed design
is presented in the Advanced Conceptual Engineering Report Bus Rapid Transit Alternative
(CH2M HILL, 2014e).
The BRT Alternative includes the BRT trunk line arterial street and station improvements,
frequent bus service, new bus feeder services, and enhanced connecting bus services.
Buses are expected to operate every 10 minutes during peak hours and every 20 minutes during
off-peak hours. The BRT service would generally replace, within the study area, the existing
Metro Route 762 service. The 12-mile route would begin at Atlantic Boulevard and Whittier
Boulevard to the south; follow Atlantic Boulevard, Huntington Drive, Fair Oaks Avenue, and
Del Mar Boulevard; and end with a terminal loop in Pasadena to the north. Buses operating in
the corridor would be given transit signal priority from a baseline transit signal priority project
that will be implemented separately by Metro.
Where feasible, buses would run in dedicated bus lanes adjacent to the curb, either in one
direction or both directions, during peak periods. The new dedicated bus lanes would generally
be created within the existing street ROW through a variety of methods that include restriping
the roadway, restricted on-street parking during peak periods, and narrowing medians, planted
parkways, or sidewalks. Buses would share existing lanes with other traffic in cases where there
is not enough ROW. The exclusive lanes would be exclusive to buses and right-turning traffic
during AM and PM peak hours only. At other times of day, the exclusive lanes would be available
for mixed-flow traffic and/or on-street parking use.
The BRT service would include 60-foot articulated buses with three doors, and would have the
latest fare collection technology such as on-board smart card (Transit Access Pass [TAP] card)
readers to reduce dwell times at stations.
A total of 17 BRT stations with amenities would be placed, on average, at approximately 0.8-mile
intervals at major activity centers and cross streets. Typical station amenities would include
new shelters, branding elements, seating, wind screens, leaning rails, variable message signs
(next bus information), lighting, bus waiting signals, trash receptacles, and stop markers. Some
of these stops will be combined with existing stops, while in some cases, new stops for BRT will
be provided directly adjacent to existing local stops on the same side of the street.
Draft Project Report January 2015
32
CH2M HILL
The BRT stops would be provided at the following 17 locations:
Atlantic Boulevard at Whittier Boulevard
Atlantic Boulevard between Pomona Boulevard and Beverly Boulevard
Atlantic Boulevard at Cesar Chavez Avenue/Riggin Street
Atlantic Boulevard at Garvey Avenue
Atlantic Boulevard at Valley Boulevard
Atlantic Boulevard at Main Street
Huntington Drive at Garfield Road
Huntington Drive at Marengo Avenue
Fair Oaks Avenue at Glenarm Street
Fair Oaks Avenue at Mission Street
Fair Oaks Avenue at California Boulevard
Fair Oaks Avenue at Del Mar Boulevard
Del Mar Boulevard at Los Robles Avenue
Del Mar Boulevard at Lake Avenue
Del Mar Boulevard at Hill Avenue (single direction only)
Colorado Boulevard at Lake Avenue (single direction only)
Colorado Boulevard at Hill Avenue (single direction only)
Two bus feeder routes that would connect additional destinations with the BRT mainline are
also proposed in this alternative:
Bus feeder route that runs along Colorado Boulevard, Rosemead Boulevard, and Valley
Boulevard to the El Monte transit station.
Bus feeder route that would travel from Atlantic Boulevard near the Gold Line station to the
Metrolink stations in the City of Commerce and Montebello via Beverly Boulevard and
Garfield Avenue.
The TSM/TDM Alternative improvements would also be constructed as part of the BRT
Alternative; except Local Street Improvement L-8 (Fair Oaks Avenue from Grevelia Street to

Draft Project Report January 2015
33
CH2M HILL
Monterey Road), the reversible lane component of Local Street Improvement L-3
(Atlantic Boulevard from Glendon Way to I-10), and the transit refinement on Route 762.
These improvements would provide the additional enhancements to maximize the efficiency of
the existing transportation system by improving capacity and reducing the effects of bottlenecks
and chokepoints. Many Intersection Improvements, such as I-8, I-10, I-13, and I-14, would also
be partially or fully incorporated as appropriate.
The proposed BRT improvements completely or partially located within Caltrans ROW are
summarized below. The design plans for these locations are included in Attachment G-2.
Atlantic Boulevard/SR 60: Realign the SR 60 eastbound and westbound on-ramps
(Sheets 6 and 7).
Atlantic Boulevard/SR 60: Modify the SR 60 westbound off-ramp curb returns at Atlantic
Boulevard (Sheet 8).
Atlantic Boulevard/I-10: Modify the entrance to the I-10 westbound on-ramp (Sheet 10).
Fair Oaks Avenue/SR 110: Add one through lane and one right-turn-only lane to the SR 110
northbound off-ramp, restripe the existing ramp lanes for left-turning traffic only, and
construct additional retaining walls (Sheet 11).
IV. Light Rail Transit (LRT) Alternative
The LRT Alternative would include passenger rail operated along a dedicated guideway, similar
to other Metro light rail lines. The LRT alignment is approximately 7.5 miles long, with 3 miles of
aerial segments and 4.5 miles of bored tunnel segments. Attachment H-1 provides the LRT
Alternative exhibit along with the proposed design plans within Caltrans ROW. The detailed
design and analysis is covered in Advanced Conceptual Engineering Report Light Rail Transit
Alternative (AECOM, 2014).
The LRT Alternative would begin at an aerial station on Mednik Avenue adjacent to the existing
East Los Angeles Civic Center Station on the Metro Gold Line (Eastside Extension). The alignment
would remain elevated as it travels north on Mednik Avenue, west on Floral Drive, north across
Corporate Center Drive, and then along the west side of I-710, primarily in Caltrans ROW, to a
station adjacent to the California State University, Los Angeles (Cal State LA). The alignment
would descend into a tunnel south of Valley Boulevard and travel northeast to Fremont Avenue,
north under Fremont Avenue, and easterly to Fair Oaks Avenue. The alignment would then cross

Draft Project Report January 2015
34
CH2M HILL
under SR 110 and end at an underground station beneath Raymond Avenue adjacent to the
existing Fillmore Station on the Metro Gold Line in Pasadena.
Two approximately 20-foot diameter tunnels (one in each direction) are expected to be
constructed with cross passages connecting the tunnels to allow for emergency access. The LRT
tunnels are expected to be constructed using tunnel boring machines (TBMs) except at the
portals and the stations. The cut-and-cover construction method would be used at the portals
and the stations. The depth of the bored tunnel will vary from approximately 20 feet to 90 feet
below ground surface (bgs) measured from the crown (top) of the tunnel. The depth would be
shallower near the construction portal. The cut-and-cover tunnel would vary from 5 feet to
20 feet bgs. The horizontal and vertical alignments would be refined during final design, if this
alternative is selected, based on more detailed geotechnical investigations and engineering.
Other supporting tunnel systems include emergency evacuation cross passages for pedestrians,
a ventilation system consisting of exhaust fans at each portal and an exhaust duct along the
entire length of the tunnel, fire detection and suppression systems, communications and
surveillance systems, and 24-hour monitoring, similar to the existing LRT system.
Trains would operate at speeds of up to 65 miles per hour (mph) approximately every 5 minutes
during peak hours and every 10 minutes during off-peak hours.
Seven stations would be located along the LRT alignment:
Mednik Station at Mednik Avenue in East Los Angeles
Floral Station at Floral Drive in Monterey Park
Cal State LA Station at Cal State LA in Los Angeles
Alhambra Station at Fremont Avenue in Alhambra
Huntington Station at Huntington Drive in South Pasadena
South Pasadena Station at Mission Street in South Pasadena
Fillmore Station at Fillmore Street in Pasadena
The Alhambra Station, the Huntington Station, the South Pasadena Station, and the Fillmore
Station would be underground stations. The Huntington Station excavation would also include
an underground crossover; the Fillmore Station would include underground tail tracks at the
Draft Project Report January 2015
35
CH2M HILL
northernmost end of the alignment. New park-and‐ride facilities would be provided at all the
proposed stations except the Mednik Avenue, Cal State LA, and Fillmore Street stations.
A maintenance yard to clean, maintain, and store light rail vehicles would be located on both
sides of Valley Boulevard at the terminus of SR 710. A track spur from the LRT mainline to the
maintenance yard would cross above Valley Boulevard.
Two bus feeder services would be provided. One would travel from the Commerce Station on
the Orange County Metrolink line and the Montebello Station on the Riverside Metrolink line to
the Floral Station, via East Los Angeles College. The other would travel from the El Monte Bus
Station to the Fillmore Station via Rosemead and Colorado Boulevards. In addition, other
existing bus services in the study area would be increased in frequency and/or span of service.
The TSM/TDM Alternative improvements would also be constructed as part of the LRT
Alternative. These improvements would provide the additional enhancements to maximize the
efficiency of the existing transportation system by improving capacity and reducing the effects of
bottlenecks and chokepoints. The only components of the TSM/TDM Alternative improvements
that would not be constructed with the LRT Alternative is Other Road Improvement T-1
(Valley Boulevard to Mission Road Connector) because it would conflict with the LRT Alternative
maintenance yard near Mission Road.
The proposed LRT improvements completely or partially located within Caltrans ROW are
summarized below. The design plans for the alignment segments are included in
Attachment H-2.
SR 60 at Mednik Avenue Overcrossing (OC): Construct three columns — one in the median
and two located on either side of SR 60 and within Caltrans ROW (Sheet 1).
SR 710 from Floral Drive to Valley Boulevard: Construct elevated railway structure within
Caltrans ROW (Sheets 2 through 11).
I-710 at Valley Boulevard: Construct elevated railway structure and railway tunnel structure,
realign I-710 off-ramp at Valley Boulevard, and construct additional retaining walls and sound
walls (Sheets 12 through 117).
SR 110 at Fair Oaks Avenue: Construct railway tunnel structure beneath Caltrans ROW
(Sheets 18 and 19).

Draft Project Report January 2015
36
CH2M HILL
V. Freeway Tunnel Alternative
The alignment for the Freeway Tunnel Alternative starts at the existing southern stub of SR 710
in Alhambra, just north of I-10, and connects to the existing northern stub of SR 710 south of
the I-210/SR 134 interchange in Pasadena. Both tunnel design variations, dual-bore tunnel and
single-bore tunnel, would include the following tunnel support systems (each with a secondary
supply and backup system):
Lighting
Emergency evacuation for pedestrians and vehicles
Air scrubbers
Ventilation system with air monitoring and emergency controls
Fixed fire detection and suppression systems
Communications, monitoring and surveillance systems
Radio rebroadcast system
Drainage collection and spill containment systems
Traffic control of the entire tunnel
Other systems as required by the Emergency Response Plan
The operations and maintenance (O&M) buildings would be constructed at the northern and
southern ends of the tunnel. There would be no operational restrictions for the tunnel, with the
exception of vehicles carrying flammable or hazardous materials. Attachments I-1a and J-1a
illustrate the dual-bore and single-bore tunnel design variations for the Freeway Tunnel
Alternative, respectively.
As part of both design variations of the Freeway Tunnel Alternative, the I-710 northbound
off-ramp and southbound on-ramp at Valley Boulevard would be modified.
The TSM/TDM Alternative improvements would also be included as part of the Freeway Tunnel
Alternative, in either the dual-bore or single-bore design variations. These improvements would
provide the additional enhancements to maximize the efficiency of the existing transportation
system by improving capacity and reducing the effects of bottlenecks and chokepoints. The only
component of the TSM/TDM Alternative improvements that would not be constructed with the
Freeway Tunnel Alternative are Other Road Improvement T-1 (Valley Boulevard to Mission Road

Draft Project Report January 2015
37
CH2M HILL
Connector) and Other Road Improvement T-3 (St. John Avenue Extension between Del Mar
Boulevard and California Boulevard).
a. Design Variations
The Freeway Tunnel Alternative includes two design variations. These variations relate to the
number of tunnels constructed. The dual-bore design variation includes two tunnels that
independently convey northbound and southbound vehicles. The single-bore design variation
includes one tunnel that carries both northbound and southbound vehicles. Each of these design
variations is described below.
Dual-Bore Tunnel: The dual-bore tunnel design variation is approximately 6.3 miles long,
with 4.2 miles of bored tunnel, 0.7 mile of cut-and-cover tunnel, and 1.4 miles of at-grade
segments. The dual-bore tunnel design variation would consist of two side-by-side tunnels
(one for northbound traffic and one for southbound traffic). Each tunnel would have
two levels with traffic traveling in the same direction. Each tunnel would consist of two lanes
on each level for a total of four lanes in each tunnel. The easterly tunnel would be for
northbound traffic; the westerly tunnel would be for southbound traffic. Each bored tunnel
would have an excavated diameter of approximately 60 feet. Vehicle cross passages would be
provided throughout this tunnel design variation that would connect one tunnel to the other
tunnel for use in an emergency situation.
Short segments of cut-and-cover tunnels would be located at the south and north termini to
provide access via portals to the bored tunnels. The portal at the southern terminus would be
located south of Valley Boulevard. The portal at northern terminus would be located north of
Del Mar Boulevard. No intermediate interchanges are planned for the tunnel.
The approximate depth of the full-range bored tunnel for the dual-bore tunnel is
approximately 20 to 280 feet bgs measured from the crown (top) of the tunnel. The depth
would be shallower near the north and south construction portals. The majority of the
underground segment of the freeway will be constructed using a TBM while the remaining
segments would be constructed using the cut-and-cover construction method. The cut-and-
cover tunnel segment at the south portal would be up to approximately 5 to 60 feet bgs from
the top of the tunnel. The cut-and-cover tunnel segment at the north portal would be up to
approximately 0 feet to 30 feet bgs from the top of the tunnel. The horizontal and vertical
Draft Project Report January 2015
38
CH2M HILL
alignments would be refined during final design, if this alternative is selected, based on more
detailed geotechnical investigations and engineering.
Attachments I-1d and I-1e demonstrate the typical tunnel cross-sections. The design plans
for the dual-bore tunnel variation of the Freeway Tunnel Alternative are included in
Attachment I-2.
Single-Bore Tunnel: The single-bore tunnel design variation is also approximately 6.3 miles
long, with 4.2 miles of bored tunnel, 0.7 mile of cut-and-cover tunnel, and 1.4 miles of at-
grade segments. The single-bore tunnel design variation would consist of a single, two-level,
bored tunnel with two lanes traveling in the same direction on each level. Northbound traffic
would use the two lanes on the upper level; southbound traffic would use the two lanes
on the lower level. The single-bore tunnel would also have an excavated diameter of
approximately 60 feet. It would be in the same location as the northbound tunnel in the dual-
bore tunnel design variation.
The approximate depth of the single-bore tunnel is approximately 20 to 280 feet bgs
measured from the crown (top) of the tunnel. The depth would be shallower near the north
and south construction portals. The majority of the underground segment of the freeway will
be constructed using a TBM while the remaining segments would be constructed using the
cut-and-cover construction method. The cut-and-cover tunnel at the south portal would be
up to approximately 5 to 60 feet bgs from the top of the tunnel. The cut-and-cover tunnel
segment at the north portal would be up to approximately 0 to 30 feet bgs from the top of
the tunnel. The horizontal and vertical alignments would be refined during final design, if this
alternative is selected, based on more detailed geotechnical investigations and engineering.
Attachments J-1d and J-1e demonstrate the typical tunnel cross-sections. The design plans for
the single-bore tunnel variation of the Freeway Tunnel Alternative are included in
Attachment J-2.
b. Operational Variations
There were three different parameters related to the operational variations of the Freeway
Tunnel Alternative:
Tolling: Tolls could be charged for vehicles using the tunnel, or it could be free for all drivers
(freeway).
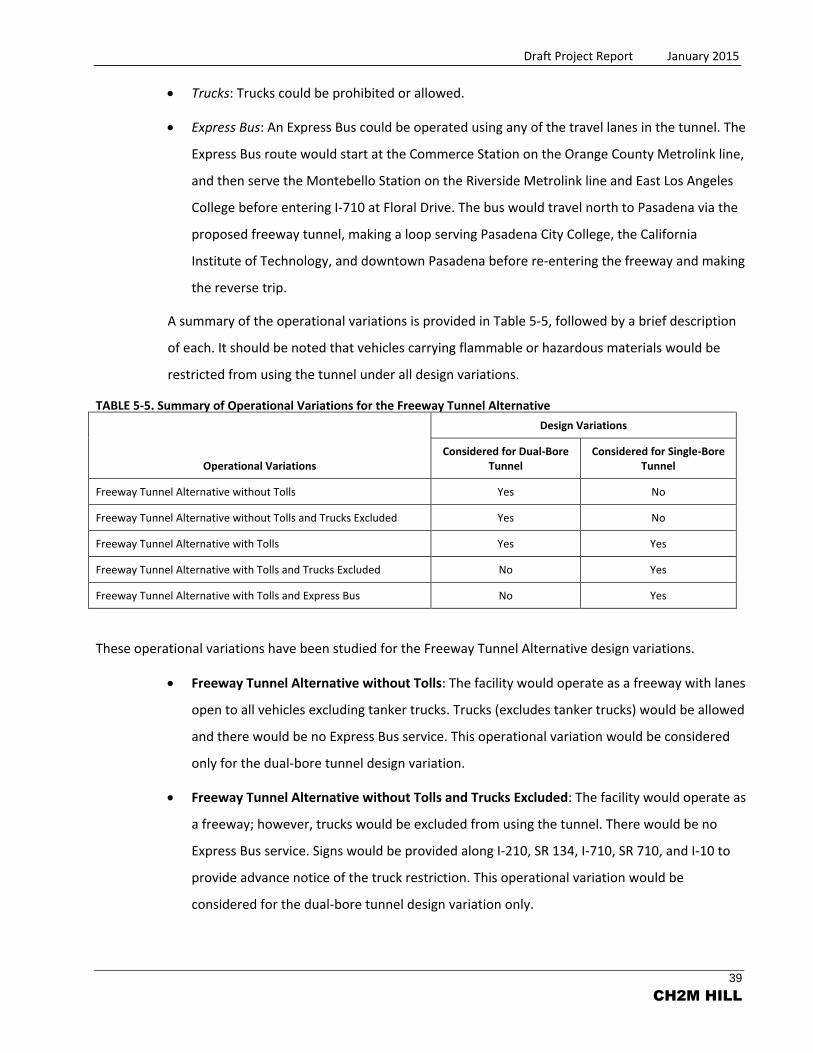
Draft Project Report January 2015
39
CH2M HILL
Trucks: Trucks could be prohibited or allowed.
Express Bus: An Express Bus could be operated using any of the travel lanes in the tunnel. The
Express Bus route would start at the Commerce Station on the Orange County Metrolink line,
and then serve the Montebello Station on the Riverside Metrolink line and East Los Angeles
College before entering I-710 at Floral Drive. The bus would travel north to Pasadena via the
proposed freeway tunnel, making a loop serving Pasadena City College, the California
Institute of Technology, and downtown Pasadena before re-entering the freeway and making
the reverse trip.
A summary of the operational variations is provided in Table 5-5, followed by a brief description
of each. It should be noted that vehicles carrying flammable or hazardous materials would be
restricted from using the tunnel under all design variations.
TABLE 5-5. Summary of Operational Variations for the Freeway Tunnel Alternative
Operational Variations
Design Variations
Considered for Dual-Bore Tunnel
Considered for Single-Bore Tunnel
Freeway Tunnel Alternative without Tolls Yes No
Freeway Tunnel Alternative without Tolls and Trucks Excluded Yes No
Freeway Tunnel Alternative with Tolls Yes Yes
Freeway Tunnel Alternative with Tolls and Trucks Excluded No Yes
Freeway Tunnel Alternative with Tolls and Express Bus No Yes
These operational variations have been studied for the Freeway Tunnel Alternative design variations.
Freeway Tunnel Alternative without Tolls: The facility would operate as a freeway with lanes
open to all vehicles excluding tanker trucks. Trucks (excludes tanker trucks) would be allowed
and there would be no Express Bus service. This operational variation would be considered
only for the dual-bore tunnel design variation.
Freeway Tunnel Alternative without Tolls and Trucks Excluded: The facility would operate as
a freeway; however, trucks would be excluded from using the tunnel. There would be no
Express Bus service. Signs would be provided along I-210, SR 134, I-710, SR 710, and I-10 to
provide advance notice of the truck restriction. This operational variation would be
considered for the dual-bore tunnel design variation only.
Draft Project Report January 2015
40
CH2M HILL
Freeway Tunnel Alternative with Tolls: All vehicles, except tanker trucks, using the tunnel(s)
would be tolled. There would be no Express Bus service. This operational variation would be
considered for both the dual-bore and single-bore tunnel design variations.
Freeway Tunnel Alternative with Tolls and Trucks Excluded: This facility would operate as a
freeway; however, trucks would be excluded from using the tunnel. All automobiles would be
tolled, and there would be no Express Bus service. Signs would be provided along I-210,
SR 134, I-710, SR 710, and I-10 to provide advance notice of the truck restriction. This
operational variation would be considered for the single-bore tunnel design variation only.
Freeway Tunnel Alternative with Tolls and Express Bus: This operational variation would be
considered for the single-bore tunnel design variation only. The freeway tunnel would
operate as a tolled facility and include an Express Bus component. The Express Bus would be
allowed in any of the travel lanes in the tunnel; no bus-restricted or exclusive lanes would be
provided. Trucks would be permitted. The Express Bus route would start at the Commerce
Station on the Orange County Metrolink line, and then serve the Montebello Station on the
Riverside Metrolink line and East Los Angeles College before entering I-710 at Floral Drive.
The bus would travel north to Pasadena via the proposed freeway tunnel, making a loop
serving Pasadena City College, the California Institute of Technology, and downtown
Pasadena before re-entering the freeway and making the reverse trip.
Toll/no toll operational variations were considered because of the potential for tolled operations
to improve the financial feasibility of a freeway tunnel. Truck/no truck operational variations
were considered because of the potential for restricting use by trucks to address community
concerns. A freeway tunnel with the Express Bus operational variation was considered because
of the potential for this variation to improve the performance of the overall regional transit
system, decrease north-south transit travel time through the study area, and attract additional
transit ridership.
B. Rejected Alternatives
The initial screening evaluated a preliminary set of alternatives based on project objectives.
This evaluation step resulted in the identification of 12 alternatives that were presented in the
AA Report/Conceptual Engineering Report (CH2M HILL, 2012a) for further conceptual engineering
and initial environmental analysis evaluation. The set of alternatives included the No Build
Alternative, TSM/TDM Alternative, two BRT Alternatives, two LRT Alternatives, four Freeway (F)

Draft Project Report January 2015
41
CH2M HILL
Alternatives, and two Highway/Arterial (H) Alternatives. As the screening processes developed, some
of the alternatives were rejected based on performance, environmental, and/or community impacts.
They are listed and briefly described below:
BRT-1: This BRT alternative would provide service between Patsaouras Transit Plaza at
Los Angeles Union Station and the Jet Propulsion Laboratory (JPL) in La Cañada Flintridge.
The route of this alternative contains both exclusive bus lanes and mixed-flow lanes for a
total length of 13.9 miles. Upon further analysis, Alternative BRT-1 was rejected for the
following reasons:
The potential service area of BRT-1 overlaps the service area of the Metro Gold Line.
Compared with the current BRT Alternative described in Section 5-A-III, this alternative
(BRT-1) performs worse regarding increasing access to high-frequency transit service
and increasing north-south transit patronage.
LRT-6: This LRT alternative consisted of a nearly 8.3-mile LRT corridor and is generally
at-grade along Atlantic Boulevard, Huntington Drive, and Fair Oaks Avenue. Two aerial
stations and elevated structure segments over I-10 and SR 60 also were proposed for this
alternative. The alignment of LRT-6 connects to the Metro Gold Line LRT to Pasadena and
East Los Angeles at the northern and southern ends, respectively.
Upon further analysis, Alternative LRT-6 was rejected for the following reasons:
It would require extensive property acquisitions (over 200 properties) along the
alignment, and has the highest impact to historic resources compare to other LRT
alternatives.
There would be extensive loss of parking spaces and loading areas.
There was difficulty in siting a maintenance yard.
F-2: This freeway alternative would originate at the existing SR 710 southerly stub at the I-10
freeway in Alhambra, and connect to the SR 2 freeway in the vicinity of the existing Verdugo
Road and York Boulevard interchanges. Alternative F-2 would be an eight-lane freeway
primarily constructed in two bored tunnels with cut-and-cover tunnels used for the tunnel
entry and exit points (portals) at the southerly and northerly termini with I-10 and SR 2,
respectively. The typical tunnel depth of this alternative was 130 to 450 feet from the top of
the tunnel to ground level. The length of improvements would be approximately 6.9 miles,
Draft Project Report January 2015
42
CH2M HILL
including 4.3 miles of bored tunnel, 0.7 mile of cut-and-cover tunnel, and 1.9 miles of
surface/depressed/elevated alignment. Upon further analysis, Alternative F-2 was rejected
for the following reasons:
It has the highest cost compared to other freeway alternatives, mainly because of the
substantial ROW impacts.
It was the least effective of the freeway alternatives at (1) increasing north-south
freeway throughput, (2) reducing north-south local street volumes, (3) reducing freeway
congestion, and (4) reducing local street congestion.
F-5: Alternative F-5 would originate at the existing SR 710 southerly stub near I-10, and
continue northward connecting to SR 134 near the Colorado Boulevard interchange. Similar
to Alternative F-2, this alternative also would be an eight-lane freeway in two bored tunnels
with a depth of 100 to 200 feet from the top of the tunnel to ground level. The length of
improvements would be approximately 5.8 miles, including 3.8 miles of bored tunnel,
0.6 mile of cut-and-cover tunnel, and 1.4 miles of surface/depressed/elevated alignment.
Upon further analysis, Alternative F-5 was rejected for the following reasons:
There were substantial ROW impacts.
It was less effective at (1) increasing north-south freeway throughput, (2) reducing
north-south local street volumes, (3) reducing freeway congestion, and (4) reducing local
street congestion.
F-6: Similar to Alternatives F-2 and F-5, this freeway alternative also would originate at the
existing SR 710 southerly stub near I-10 and connect to the existing SR 710 northerly stub just
south of the I-120/SR 134 interchange. This alternative would be an eight-lane freeway
providing three general purpose lanes and one high-occupancy vehicle (HOV) lane in each
direction. The alignment of this alternative would be approximately 5.8 miles long and is very
similar to the “Depressed Meridian Variation” approved in the ROD in 1992. It contains
0.4 mile of cut-and-cover tunnel and 5.4 miles of surface/depressed/elevated alignment.
Grade-separated interchanges would be provided at all major arterials while other minor
streets that currently cross the Alternative F-6 alignment would become discontinuous
with the use of cul-de-sacs. Upon further analysis, Alternative F-6 was rejected for the
following reasons:

Draft Project Report January 2015
43
CH2M HILL
High property acquisitions.
It has more human environment impacts than freeway Alternative F-7, such as the
relocation of business/job opportunities and the required relocation of existing
communities.
H-2: In this alternative, the SR 710 freeway would come to an end at Valley Boulevard and
transition to a highway/arterial at Concord Avenue that would cross over Valley Boulevard,
the Union Pacific Railroad (UPRR) tracks, and Mission Road/Alhambra Avenue; then proceed
northward to the ending near the intersection of San Rafael Avenue and Linda Vista Avenue
with a connection to SR 134. The total length of H-2 would be approximately 7.4 miles;
access to local streets would be provided by connector roads with at-grade intersections.
The addition of the frontage road was not always feasible in this alternative because of the
hilly terrain. Also, some of the smaller local side streets with existing access would be
converted to cul-de-sacs.
Upon further analysis, Alternative H-2 was rejected for the following reasons:
It has the largest number of property acquisitions of all alternatives.
Access control of the proposed alternative affects the operation of the local street
system; access to local streets would be limited.
H-6: This highway/arterial alternative begins at the existing SR 710 southerly stub just north
of I-10, and connects the SR 710 freeway directly to Sheffield Avenue. The alignment of this
alternative would cross over Valley Boulevard, the UPRR tracks, and Mission Road/Alhambra
Avenue to Sheffield Avenue, then proceed northward. At the northern end of this alternative,
the roadway would split between St. John Avenue and Pasadena Avenue and then connect
to the SR 710 using the existing ramps. The total length of the improvements would be
approximately 6.3 miles. The addition of a frontage road is not always feasible because of
ROW constraints. Many of the smaller side streets with existing access would be converted to
cul-de-sacs to accommodate the improvements. Upon further analysis, Alternative H-6 was
rejected for the following reasons:
There would be substantial ROW impact, including acquisitions of both residential and
commercial properties.
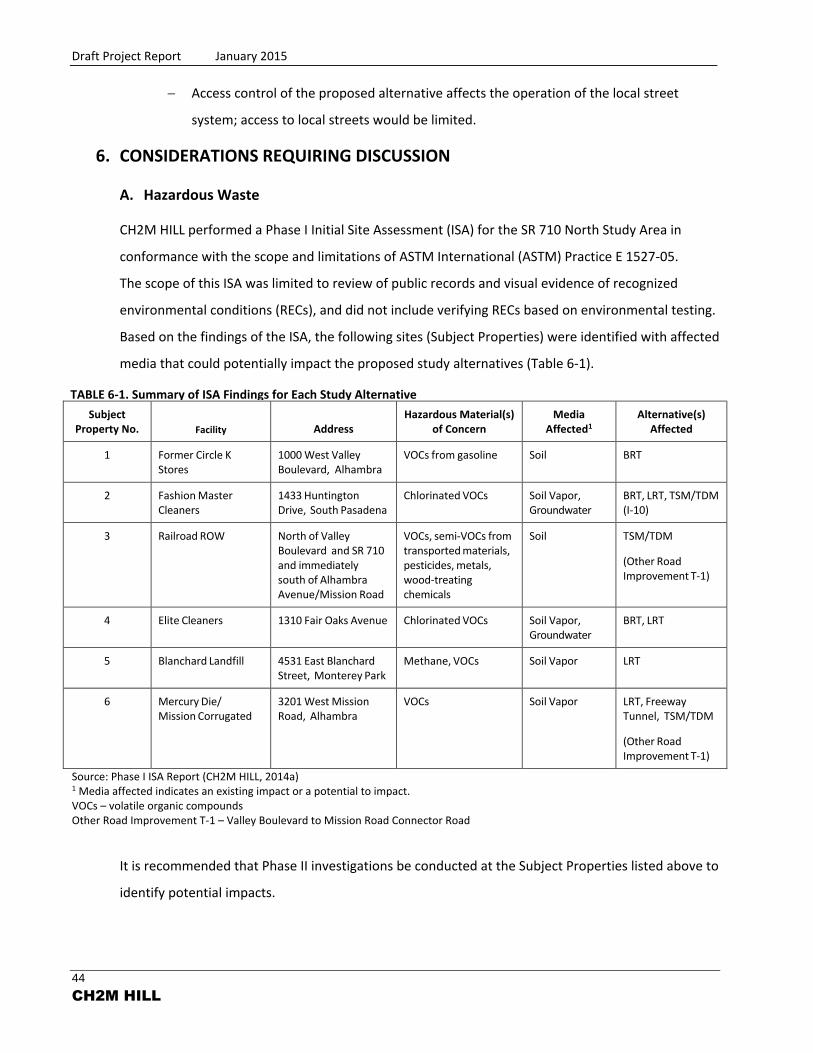
Draft Project Report January 2015
44
CH2M HILL
Access control of the proposed alternative affects the operation of the local street
system; access to local streets would be limited.
6. CONSIDERATIONS REQUIRING DISCUSSION
A. Hazardous Waste
CH2M HILL performed a Phase I Initial Site Assessment (ISA) for the SR 710 North Study Area in
conformance with the scope and limitations of ASTM International (ASTM) Practice E 1527-05.
The scope of this ISA was limited to review of public records and visual evidence of recognized
environmental conditions (RECs), and did not include verifying RECs based on environmental testing.
Based on the findings of the ISA, the following sites (Subject Properties) were identified with affected
media that could potentially impact the proposed study alternatives (Table 6-1).
TABLE 6-1. Summary of ISA Findings for Each Study Alternative
Subject Property No. Facility Address
Hazardous Material(s) of Concern
Media Affected1
Alternative(s) Affected
1 Former Circle K Stores
1000 West Valley Boulevard, Alhambra
VOCs from gasoline Soil BRT
2 Fashion Master Cleaners
1433 Huntington Drive, South Pasadena
Chlorinated VOCs Soil Vapor, Groundwater
BRT, LRT, TSM/TDM (I‐10)
3 Railroad ROW North of Valley Boulevard and SR 710 and immediately south of Alhambra Avenue/Mission Road
VOCs, semi‐VOCs from transported materials, pesticides, metals, wood‐treating chemicals
Soil TSM/TDM
(Other Road Improvement T‐1)
4 Elite Cleaners 1310 Fair Oaks Avenue Chlorinated VOCs Soil Vapor, Groundwater
BRT, LRT
5 Blanchard Landfill 4531 East Blanchard Street, Monterey Park
Methane, VOCs Soil Vapor LRT
6 Mercury Die/ Mission Corrugated
3201 West Mission Road, Alhambra
VOCs Soil Vapor LRT, Freeway Tunnel, TSM/TDM
(Other Road Improvement T‐1)
Source: Phase I ISA Report (CH2M HILL, 2014a) 1 Media affected indicates an existing impact or a potential to impact. VOCs – volatile organic compounds Other Road Improvement T-1 – Valley Boulevard to Mission Road Connector Road
It is recommended that Phase II investigations be conducted at the Subject Properties listed above to
identify potential impacts.

Draft Project Report January 2015
45
CH2M HILL
Also, as is typical with older freeways such as those in parts of the study area, the potential for
encountering aerially deposited lead (ADL) on the sides of the freeway is high; ADL is associated with
exhaust from former lead-gasoline combustion in motor vehicles. Therefore, prior to construction
activities, it is recommended that an ADL investigation be conducted during the Phase II investigation.
If a potential ADL impact is present within these areas, the Caltrans ADL guidance document should
be followed. A full discussion on hazardous waste is included in the Phase I ISA report (CH2M HILL,
2014a).
B. Value Analysis
A Value Analysis (VA) study was conducted for the SR 710 North Study. The VA study assessed the
no build and build alternatives that were brought forward for consideration in this DPR. A 2-week-
long comprehensive VA meeting was held in March 2013. There were 23 VA proposals, including
1 TSM proposal, 3 BRT proposals, 6 LRT proposals, 10 Freeway Tunnel proposals, and 3 VA Strategies,
that were generated from the VA study. All of the VA proposals and the disposition recommendations
are tabulated in Table 6-2. Details of the evaluation and decision making are provided in the Value
Analysis Study Report, District 7, SR 710 North Study, Los Angeles County, California (CH2M HILL,
2014c).
TABLE 6-2. Summary of VA Proposal and Disposition Recommendationa
VA PROPOSAL
DISPOSITION RECOMMENDATION
Agr
ee
Agr
ee
wit
h
Mo
dif
icat
ion
s
Furt
he
r St
ud
y
Ne
ed
ed
Dis
agre
e
TSM-1 Peak Direction HOV Lane on Fremont Avenue and Fair Oaks Avenue during Peak Periods
X
BRT-1 BRT Enhanced Technology – Guided BRT Operation Combined with Passenger Information System and ITS Technologies
X
BRT-2 Multimodal Transportation Centers (MTC) for BRT Alternative Combined with Single-Bore Freeway Tunnel with Managed Lanes (FT-1)
X
BRT-3 Streetcar along Alternative BRT-6Aa Alignment X
LRT-1 LRT-4Aa Alignment on I-710 Median X
LRT-2 Valley Boulevard OC of LRT X
LRT-3 Terminate LRT-4Aa Alignment at Gold Line North of Arroyo Seco Parkway (SR 110)
X
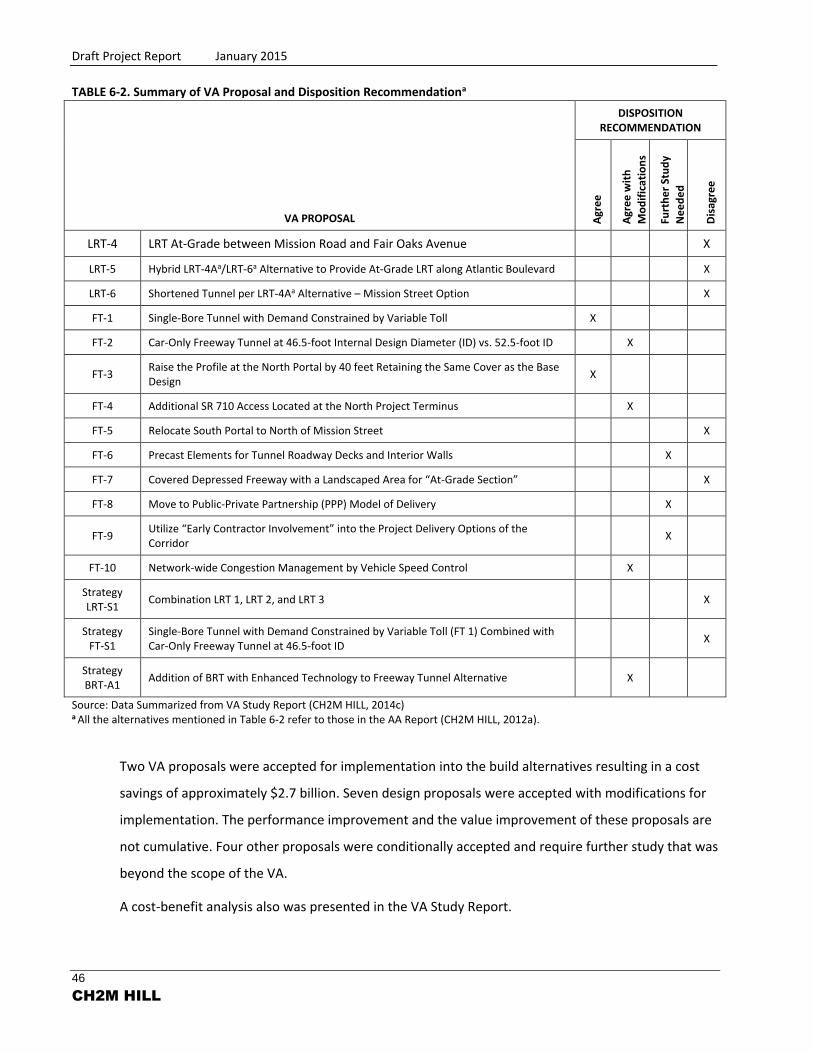
Draft Project Report January 2015
46
CH2M HILL
TABLE 6-2. Summary of VA Proposal and Disposition Recommendationa
VA PROPOSAL
DISPOSITION RECOMMENDATION
Agr
ee
Agr
ee
wit
h
Mo
dif
icat
ion
s
Furt
he
r St
ud
y
Ne
ed
ed
Dis
agre
e
LRT-4 LRT At-Grade between Mission Road and Fair Oaks Avenue X
LRT-5 Hybrid LRT-4Aa/LRT-6a Alternative to Provide At-Grade LRT along Atlantic Boulevard X
LRT-6 Shortened Tunnel per LRT-4Aa Alternative – Mission Street Option X
FT-1 Single-Bore Tunnel with Demand Constrained by Variable Toll X
FT-2 Car-Only Freeway Tunnel at 46.5-foot Internal Design Diameter (ID) vs. 52.5-foot ID X
FT-3 Raise the Profile at the North Portal by 40 feet Retaining the Same Cover as the Base Design
X
FT-4 Additional SR 710 Access Located at the North Project Terminus X
FT-5 Relocate South Portal to North of Mission Street X
FT-6 Precast Elements for Tunnel Roadway Decks and Interior Walls X
FT-7 Covered Depressed Freeway with a Landscaped Area for “At-Grade Section” X
FT-8 Move to Public-Private Partnership (PPP) Model of Delivery X
FT-9 Utilize “Early Contractor Involvement” into the Project Delivery Options of the Corridor
X
FT-10 Network-wide Congestion Management by Vehicle Speed Control X
Strategy LRT-S1
Combination LRT 1, LRT 2, and LRT 3 X
Strategy FT-S1
Single-Bore Tunnel with Demand Constrained by Variable Toll (FT 1) Combined with Car-Only Freeway Tunnel at 46.5-foot ID
X
Strategy BRT-A1
Addition of BRT with Enhanced Technology to Freeway Tunnel Alternative X
Source: Data Summarized from VA Study Report (CH2M HILL, 2014c) a All the alternatives mentioned in Table 6-2 refer to those in the AA Report (CH2M HILL, 2012a).
Two VA proposals were accepted for implementation into the build alternatives resulting in a cost
savings of approximately $2.7 billion. Seven design proposals were accepted with modifications for
implementation. The performance improvement and the value improvement of these proposals are
not cumulative. Four other proposals were conditionally accepted and require further study that was
beyond the scope of the VA.
A cost-benefit analysis also was presented in the VA Study Report.
Draft Project Report January 2015
47
CH2M HILL
C. Resource Conservation
The proposed project, by increasing capacity and providing TSM/TDM strategies, should reduce
congestion, improve traffic flow and reduce energy consumption. The proposed improvements to
transit services and active transportation options, such as bicycles and pedestrians, also should help
in reducing fossil fuel consumption and greenhouse gas emission.
D. Right-of-Way Issues
Throughout the development of the build alternatives, efforts have been made to minimize ROW
impacts to the extent possible. ROW impacts included full and partial property acquisitions, and
permanent and temporary easements.
TSM/TDM Alternative: The ROW impacts in the TSM/TDM Alternative occur at the street
intersections. The majority of impacts are to commercial properties such as restaurants,
drug stores, spas, service stations, and others. Residential properties are impacted by the
improvements at some smaller intersections as well. The ROW Data Sheet for the TSM/TDM
Alternative is provided in Attachment N-1.
BRT Alternative: This alternative was designed within the confines of the existing street
alignment. The majority of the improvements can be completed within the existing ROW;
however, partial acquisitions and temporary construction easements are proposed at and
near some street intersections. The ROW impacts are anticipated to be minor relative to the
other build alternatives. The ROW Data Sheet for the BRT Alternative with the feasible
TSM/TDM improvements is provided in Attachment N-2.
LRT Alternative: The majority of the LRT Alternative is either underground or aerial. For this
reason, the properties impacted are mainly those used for station sites, traction power
substations, tunnel ventilation, and the portal areas at the ends of the alignment. There
are potential impacts that could result from the encumbrance of aerial easements and
subsurface easements under this alternative. The ROW Data Sheet for the LRT Alternative
with the feasible TSM/TDM improvements is provided in Attachment N-3.
Freeway Tunnel Alternative: Both the dual-bore and single-bore variations of the Freeway
Tunnel Alternative are almost entirely underground and connect the existing discontinuous
SR 710 between the terminus north of I-10 to the terminus south of the I-210/SR 134
interchange. Therefore, the property impacts are concentrated at the portals of both ends

Draft Project Report January 2015
48
CH2M HILL
of the proposed alignments where the tunnels surface. Other than the property acquisitions,
potential ROW impacts could also result from the subsurface easements for the Freeway
Tunnel Alternative. The ROW Data Sheets for both the dual-bore tunnel design and
single-bore tunnel design of this alternative with the feasible TSM/TDM improvements are
provided in Attachments N-4 and N-5, respectively.
Impacts to residential properties would include the acquisition of subterranean easements for bored
tunnel segments of the Freeway Tunnel and LRT Alternatives. The effects of these impacts will be
nominal, and no displacements are expected to result. Nonresidential impacts would include the
acquisition of real property and easements from commercial, industrial, and service-related
businesses near tunnel portal sites, at light rail stations, and along street and intersection
improvements throughout the study area. Table 6-3 summarizes the anticipated displacement units
by alternative alone, without incorporation of the possible TSM/TDM improvements.
TABLE 6-3. Summary of Displacement Units by Alternative
Units
Freeway Tunnel with Incorporated TSM/TDM
LRT with incorporated
TSM/TDM
BRT with incorporated
TSM/TDM TSM/TDM Dual Bore
Option Single Bore
Option
Residential Units 0 0 0 0 0
Residential Displacements (residents)
0 0 0 0 0
Nonresidential Units (including Agriculture)
2 2 94 1 1
Source: Data summarized from Draft Relocation Impact Report (Epic Land Solutions, Inc., 2014)
Across all alternatives, no residential displacements are anticipated. However, some businesses will
be displaced and will require relocation. These displacements are anticipated to be minimal for the
TSM/TDM, BRT, and Freeway Tunnel Alternatives; but they would be more substantial for the LRT
Alternative. Proposed replacement sites for the displaced properties have been identified within the
state-mandated 50-mile radius, and primarily fall within the boundaries of the displacement
cities/communities. The lists of anticipated full/partial parcel acquisition, temporary construction
easement acquisition, and permanent easement acquisition of each alternative are provided in the
Draft Relocation Impact Report (Epic Land Solutions, Inc., 2014), and summarized in Table 6-4
(information shown in Table 6-4 for the BRT, LRT, and Freeway Tunnels Alternatives includes the
acquisition of incorporated TSM/TDM improvements).

Draft Project Report January 2015
49
CH2M HILL
TABLE 6-4. Summary of Parcel/Area Acquisition
Full Acquisition
Freeway Tunnel with Incorporated TSM/TDM LRT with
incorporated TSM/TDM
BRT with incorporated
TSM/TDM TSM/TDM Dual Bore Single Bore
Number of
Parcels
Total 1 1 58 1 1
Total within State ROW
1 1 1a 0 0
Total Acquisition Area (ft2) 11,901 11,901 477,372 8,020 8,020
Total Acquisition Area within State ROW (ft2)
11,901 11,901 11,397a 0 0
Partial Acquisitionb
Freeway Tunnel with Incorporated TSM/TDM LRT with
incorporated TSM/TDM
BRT with incorporated
TSM/TDM TSM/TDM Dual Bore Single Bore
Number of
Parcels
Total 387 278 236 579 41
Total within State ROW
387 278 9a 0 4
Total Partial Fee Acquisition Area
(ft2) 93,257 65,823 338,834 27,283 15,623
Total Partial Fee Acquisition Area
within State ROW (ft2) 93,257 65,823 166,621a 0 600
Total TCE (ft2) 707,663 688,205 421,712 58,908 32,571
Total TCE within State ROW (ft2)
707,663 688,205 131,155a 0 19,869
Total PE (ft2) 1,816,927 826,997 657,005 9,945 9,945
Total PE within State ROW (ft2)
1,816,927 826,997 13,047a 0 8,972
Source: Data summarized from Draft Relocation Impact Report (Epic Land Solutions, Inc., 2014) “State ROW” in this table refers to the future state ROW associated with the proposed alternative. a Potential acquisition that may be considered state ROW in the future. b Partial acquisitions include right of entries. TCE – temporary construction easement PE – permanent easement ft2 – square feet

Draft Project Report January 2015
50
CH2M HILL
Research shows that as of the time of this DPR, adequate relocation resources exist and will be
available to all displacees without discrimination. The agencies should be advised that depending on
the alternative selected, funds will need to be allocated toward relocation and ROW requirements.
The actual estimated value of the ROW for each alternative has been provided in the Caltrans ROW
Data Sheets (Attachment N). The detailed study and in-depth analysis of ROW issues are presented in
the Draft Relocation Impact Report (Epic Land Solutions, Inc., 2014).
E. Environmental Issues
The DEIR/EIS has been prepared in accordance with Caltrans environmental procedures, as well as
state and federal environmental regulations. The attached DEIR/EIS is the appropriate document for
the proposed project.
F. Air Quality Conformity
For a project to conform to the State Implementation Plan, the project must be included in approved
transportation plans and programs, such as the RTP and FTIP. The tolled operational variation of the
Freeway Tunnel Alternative dual-bore design variation is consistent with the scope of the design
concept as described in the SCAG 2012 RTP (SR710 North Extension [tunnel] [alignment TBD]. 4 toll
lanes in each direction in tunnel) and the 2013 FTIP (Project ID: 18790 Route 710: Study to perform
alternative analysis, engineering, and environmental studies to close 710 Freeway gap).
The alternatives comply with the RTPs and programs, and are considered to be regionally important.
These alternatives are not exempt from regional emissions analyses due to the proposed freeway
tunnel and roadway widening. At the local level, the proposed improvements are not expected to
result in carbon monoxide concentrations exceeding standards and new violations of particulate
matter emission levels. However, the Freeway Tunnel Alternatives may potentially be a project of
air quality concern, which will be a determination made by the SCAG Transportation Conformity
Working Group. The SR 710 North Study area is located in the South Coast Air Basin, within which the
air quality regulations are administered by the South Coast Air Quality Management District
(SCAQMD). The proposed build alternatives will comply with all SCAQMD requirements.
G. Health Risk Assessment
The general Health Risk Assessment (HRA) approach has been communicated among Caltrans, Metro,
and SCAQMD; the current decision is that the HRA discussion for this project will be provided in the
CEQA context only. The HRA will evaluate risks from the eight mobile source air toxics (MSATs)

Draft Project Report January 2015
51
CH2M HILL
included in the Caltrans CT-EMFAC model (Version 5), and only the alternatives determined to
have high potential of MSAT effects (that is, with a high potential for an increase of diesel vehicle
emissions) will be included in the quantitative HRA. Assuming the TSM/TDM, BRT, and LRT
Alternatives show no potential or low potential for substantial health risk impacts, a quantitative HRA
will be performed only for each design variation under the Freeway Tunnel Alternative.
Two scenarios are evaluated in the HRA:
Scenario 1: No Build Alternative and Freeway Tunnel Alternative versus Existing Condition
(70-year average emissions)
Scenario 2: Freeway Tunnel Alternative versus No Build Alternative (snapshot emissions)
Although the quantitative health risk modeling will not be performed for the alternatives with
no potential or low potential for MSAT effects, MSAT emission analysis will be performed for each of
the alternatives. Then, the results will be used to compare the MSAT emission trend on highways and
principle arterials within the project area among the alternatives.
H. Title VI Considerations
It has been the FHWA's and the Federal Transit Administration's (FTA's) long-standing policy to
actively ensure nondiscrimination under Title VI of the 1964 Civil Rights Act in federally funded
activities. The Civil Rights Restoration Act of 1987 clarified the intent of Title VI to include all
programs and activities of federal-aid recipients, subrecipients, and contractors whether those
programs and activities are federally funded or not. Environmental justice has been a concern within
the SR 710 study area, and it was a major concern raised by the El Sereno community during prior
environmental review in the 1980s and 1990s. Therefore, the potential for an alternative to result in
environmental justice impacts (that is, a disproportionate adverse impact to low income and minority
populations) was identified as one of the criteria in analyzing the alternatives of the SR 710 North
Study.
Draft Project Report January 2015
52
CH2M HILL
I. Noise Abatement Decision Report
There are four build alternatives included in the SR 710 North Study. According to the initial analysis,
the Noise Abatement Decision Report (NADR) was prepared after the completion of the Noise Study
Report (NSR) and prior to circulation of the DEIR/EIS.
I. Results of the Noise Study Report
The NSR for the SR 710 North Study was prepared by LSA Associates, Inc. (LSA), and
submitted for the approval of Branch Chief/Noise and Vibration Branch of Caltrans District 7 in
October 2014. The results of the NSR (LSA, 2014b) are summarized below.
A total of 26 long-term and 152 short-term noise level measurements were conducted
at representative locations to document the existing noise environment. Additionally,
26 short-term exterior-to-interior noise level measurements were conducted at 13 schools
within the study area. A total of 899 representative receptors were evaluated for potential noise
impacts resulting from the alternatives.
TSM/TDM Alternative, BRT Alternative, and Freeway Tunnel Alternatives
The implementation of the TSM/TDM, BRT, and Freeway Tunnel Alternatives would result in
potential short-term noise impacts during construction and long-term operational noise impacts
after completion. The future traffic noise levels were modeled using either the peak-hour traffic
volumes provided in the SR 710 North Study TTR (CH2M HILL, 2014b), or the worst-case traffic
operations (prior to speed degradation), whichever is lower. When traffic noise impacts have
been identified as one or more of the following occurrences, noise abatement measures must be
considered:
(1) An increase of 12 A-weighted decibels (dBA) or more over existing noise levels
(2) Predicted noise levels that approach or exceed the Noise Abatement Criteria (NAC)
No substantial noise level increase of 12 dBA or more from the corresponding existing noise
level would result from the operation of the completed TSM/TDM, BRT, and Freeway Tunnel
Alternatives. Based on the modeling results, a total of 9 noise barriers for the TSM/TDM
Alternative, 6 noise barriers for the BRT Alternative, and 18 noise barriers for the Freeway
Tunnel Alternatives were evaluated.
Draft Project Report January 2015
53
CH2M HILL
The NADR (LSA, 2014a) is an evaluation of the reasonableness and feasibility of incorporating
noise abatement measures into the alternative analysis and constitutes the preliminary decision
on noise abatement measures to be incorporated into the DEIR/EIS. It is also required for
Caltrans to meet the conditions of Title 23 Code of Federal Regulations, Part 772 of the FHWA
standards.
The construction cost estimates for sound barriers are compared to reasonable allowances in
the NADR to identify which sound barrier configurations are reasonable from a cost perspective;
however, the NADR does not present the final decision regarding noise abatement. Rather,
it presents key information on abatement to be considered throughout the environmental
review process, based on the best available information at the time the DEIR/EIS is published.
If pertinent parameters change substantially during the final project design, the preliminary
noise barrier designs presented in the NADR may be modified or eliminated from the final
project.
Tables 6-5 to 6-8 summarize the results of feasible noise barriers from the NADR for the
TSM/TDM Alternative, BRT Alternative, Freeway Tunnel Dual-Bore Alternative, and Freeway
Tunnel Single-Bore Alternative, respectively.
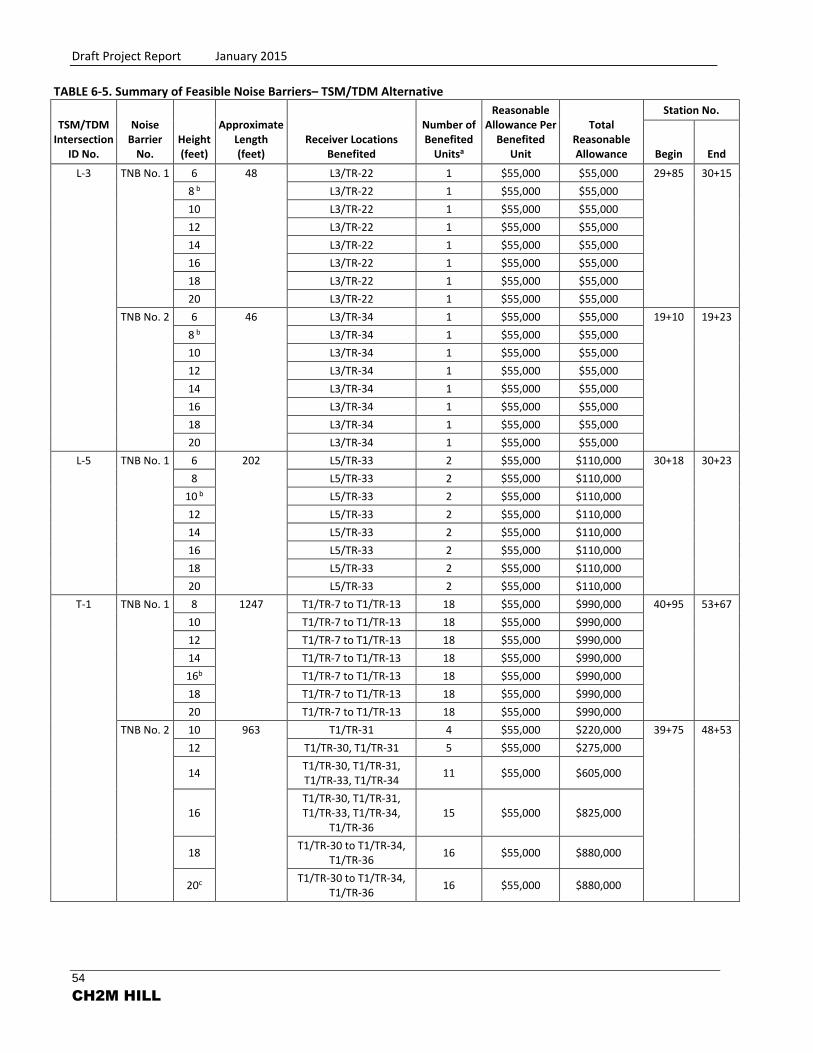
Draft Project Report January 2015
54
CH2M HILL
TABLE 6-5. Summary of Feasible Noise Barriers– TSM/TDM Alternative
TSM/TDM Intersection
ID No.
Noise Barrier
No. Height (feet)
Approximate Length (feet)
Receiver Locations Benefited
Number of Benefited
Unitsa
Reasonable Allowance Per
Benefited Unit
Total Reasonable Allowance
Station No.
Begin End
L-3 TNB No. 1 6 48 L3/TR-22 1 $55,000 $55,000 29+85 30+15
8 b
L3/TR-22 1 $55,000 $55,000
10
L3/TR-22 1 $55,000 $55,000
12
L3/TR-22 1 $55,000 $55,000
14
L3/TR-22 1 $55,000 $55,000
16
L3/TR-22 1 $55,000 $55,000
18
L3/TR-22 1 $55,000 $55,000
20
L3/TR-22 1 $55,000 $55,000
TNB No. 2 6 46 L3/TR-34 1 $55,000 $55,000 19+10 19+23
8 b
L3/TR-34 1 $55,000 $55,000
10
L3/TR-34 1 $55,000 $55,000
12
L3/TR-34 1 $55,000 $55,000
14
L3/TR-34 1 $55,000 $55,000
16
L3/TR-34 1 $55,000 $55,000
18
L3/TR-34 1 $55,000 $55,000
20
L3/TR-34 1 $55,000 $55,000
L-5 TNB No. 1 6 202 L5/TR-33 2 $55,000 $110,000 30+18 30+23
8
L5/TR-33 2 $55,000 $110,000
10 b
L5/TR-33 2 $55,000 $110,000
12
L5/TR-33 2 $55,000 $110,000
14
L5/TR-33 2 $55,000 $110,000
16
L5/TR-33 2 $55,000 $110,000
18
L5/TR-33 2 $55,000 $110,000
20
L5/TR-33 2 $55,000 $110,000
T-1 TNB No. 1 8 1247 T1/TR-7 to T1/TR-13 18 $55,000 $990,000 40+95 53+67
10
T1/TR-7 to T1/TR-13 18 $55,000 $990,000
12
T1/TR-7 to T1/TR-13 18 $55,000 $990,000
14
T1/TR-7 to T1/TR-13 18 $55,000 $990,000
16b
T1/TR-7 to T1/TR-13 18 $55,000 $990,000
18
T1/TR-7 to T1/TR-13 18 $55,000 $990,000
20
T1/TR-7 to T1/TR-13 18 $55,000 $990,000
TNB No. 2 10 963 T1/TR-31 4 $55,000 $220,000 39+75 48+53
12
T1/TR-30, T1/TR-31 5 $55,000 $275,000
14
T1/TR-30, T1/TR-31, T1/TR-33, T1/TR-34
11 $55,000 $605,000
16
T1/TR-30, T1/TR-31, T1/TR-33, T1/TR-34,
T1/TR-36 15 $55,000 $825,000
18
T1/TR-30 to T1/TR-34, T1/TR-36
16 $55,000 $880,000
20c
T1/TR-30 to T1/TR-34, T1/TR-36
16 $55,000 $880,000
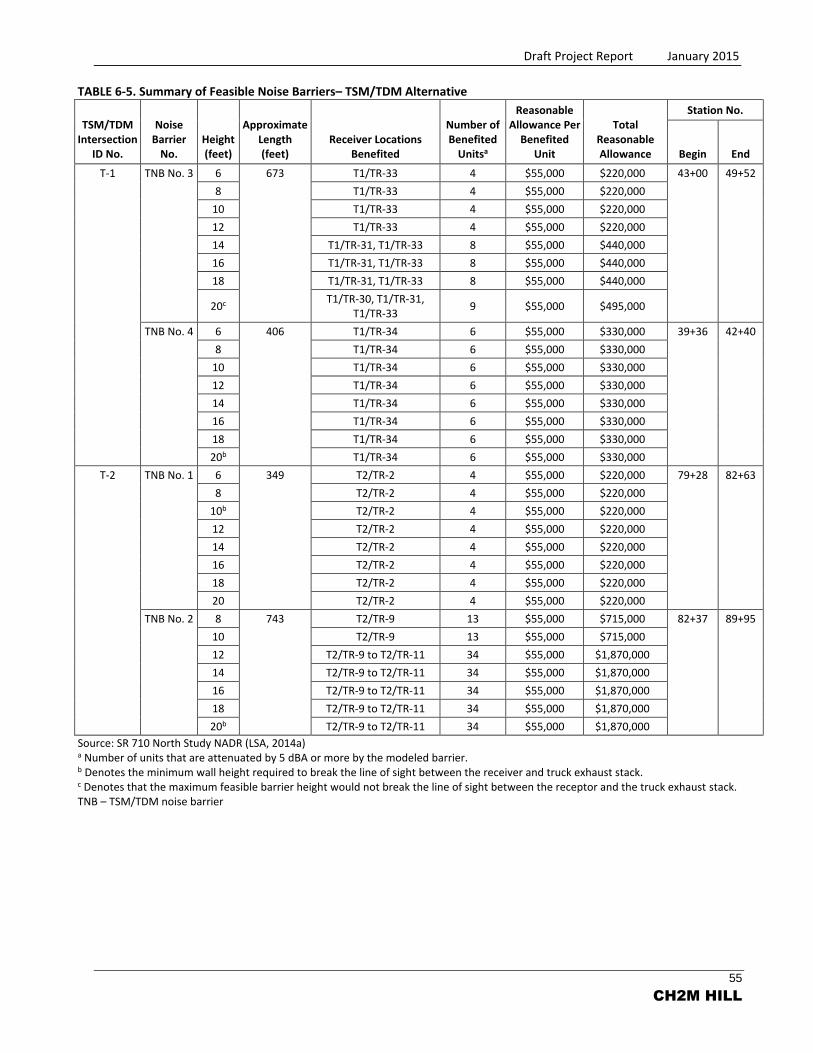
Draft Project Report January 2015
55
CH2M HILL
TABLE 6-5. Summary of Feasible Noise Barriers– TSM/TDM Alternative
TSM/TDM Intersection
ID No.
Noise Barrier
No. Height (feet)
Approximate Length (feet)
Receiver Locations Benefited
Number of Benefited
Unitsa
Reasonable Allowance Per
Benefited Unit
Total Reasonable Allowance
Station No.
Begin End
T-1 TNB No. 3 6 673 T1/TR-33 4 $55,000 $220,000 43+00 49+52
8
T1/TR-33 4 $55,000 $220,000
10
T1/TR-33 4 $55,000 $220,000
12
T1/TR-33 4 $55,000 $220,000
14
T1/TR-31, T1/TR-33 8 $55,000 $440,000
16
T1/TR-31, T1/TR-33 8 $55,000 $440,000
18
T1/TR-31, T1/TR-33 8 $55,000 $440,000
20c
T1/TR-30, T1/TR-31, T1/TR-33
9 $55,000 $495,000
TNB No. 4 6 406 T1/TR-34 6 $55,000 $330,000 39+36 42+40
8
T1/TR-34 6 $55,000 $330,000
10
T1/TR-34 6 $55,000 $330,000
12
T1/TR-34 6 $55,000 $330,000
14
T1/TR-34 6 $55,000 $330,000
16
T1/TR-34 6 $55,000 $330,000
18
T1/TR-34 6 $55,000 $330,000
20b
T1/TR-34 6 $55,000 $330,000
T-2 TNB No. 1 6 349 T2/TR-2 4 $55,000 $220,000 79+28 82+63
8
T2/TR-2 4 $55,000 $220,000
10b
T2/TR-2 4 $55,000 $220,000
12
T2/TR-2 4 $55,000 $220,000
14
T2/TR-2 4 $55,000 $220,000
16
T2/TR-2 4 $55,000 $220,000
18
T2/TR-2 4 $55,000 $220,000
20
T2/TR-2 4 $55,000 $220,000
TNB No. 2 8 743 T2/TR-9 13 $55,000 $715,000 82+37 89+95
10
T2/TR-9 13 $55,000 $715,000
12
T2/TR-9 to T2/TR-11 34 $55,000 $1,870,000
14
T2/TR-9 to T2/TR-11 34 $55,000 $1,870,000
16
T2/TR-9 to T2/TR-11 34 $55,000 $1,870,000
18
T2/TR-9 to T2/TR-11 34 $55,000 $1,870,000
20b
T2/TR-9 to T2/TR-11 34 $55,000 $1,870,000
Source: SR 710 North Study NADR (LSA, 2014a) a Number of units that are attenuated by 5 dBA or more by the modeled barrier. b Denotes the minimum wall height required to break the line of sight between the receiver and truck exhaust stack. c Denotes that the maximum feasible barrier height would not break the line of sight between the receptor and the truck exhaust stack. TNB – TSM/TDM noise barrier
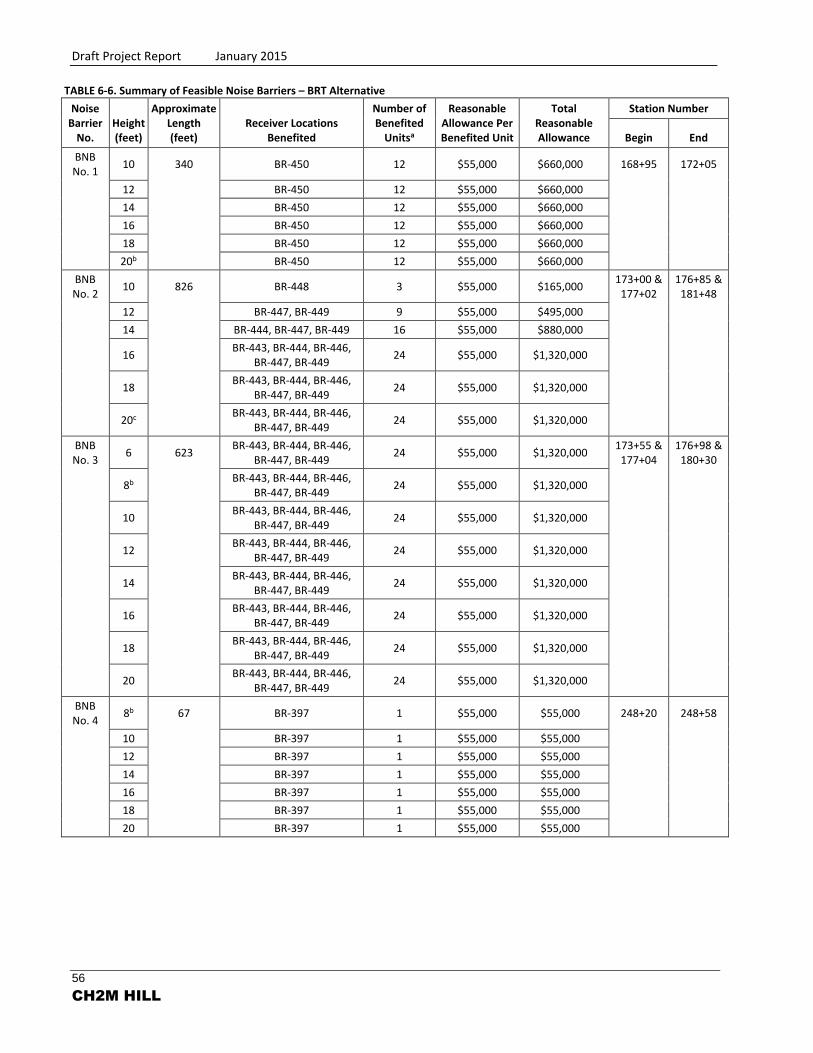
Draft Project Report January 2015
56
CH2M HILL
TABLE 6-6. Summary of Feasible Noise Barriers – BRT Alternative
Noise Barrier
No. Height (feet)
Approximate Length (feet)
Receiver Locations Benefited
Number of Benefited
Unitsa
Reasonable Allowance Per Benefited Unit
Total Reasonable Allowance
Station Number
Begin End
BNB No. 1
10 340 BR-450 12 $55,000 $660,000 168+95 172+05
12
BR-450 12 $55,000 $660,000
14
BR-450 12 $55,000 $660,000
16
BR-450 12 $55,000 $660,000
18
BR-450 12 $55,000 $660,000
20b
BR-450 12 $55,000 $660,000
BNB No. 2
10 826 BR-448 3 $55,000 $165,000 173+00 &
177+02 176+85 &
181+48
12
BR-447, BR-449 9 $55,000 $495,000
14
BR-444, BR-447, BR-449 16 $55,000 $880,000
16
BR-443, BR-444, BR-446, BR-447, BR-449
24 $55,000 $1,320,000
18
BR-443, BR-444, BR-446, BR-447, BR-449
24 $55,000 $1,320,000
20c
BR-443, BR-444, BR-446, BR-447, BR-449
24 $55,000 $1,320,000
BNB No. 3
6 623 BR-443, BR-444, BR-446,
BR-447, BR-449 24 $55,000 $1,320,000
173+55 & 177+04
176+98 & 180+30
8b
BR-443, BR-444, BR-446, BR-447, BR-449
24 $55,000 $1,320,000
10
BR-443, BR-444, BR-446, BR-447, BR-449
24 $55,000 $1,320,000
12
BR-443, BR-444, BR-446, BR-447, BR-449
24 $55,000 $1,320,000
14
BR-443, BR-444, BR-446, BR-447, BR-449
24 $55,000 $1,320,000
16
BR-443, BR-444, BR-446, BR-447, BR-449
24 $55,000 $1,320,000
18
BR-443, BR-444, BR-446, BR-447, BR-449
24 $55,000 $1,320,000
20
BR-443, BR-444, BR-446, BR-447, BR-449
24 $55,000 $1,320,000
BNB No. 4
8b 67 BR-397 1 $55,000 $55,000 248+20 248+58
10
BR-397 1 $55,000 $55,000
12
BR-397 1 $55,000 $55,000
14
BR-397 1 $55,000 $55,000
16
BR-397 1 $55,000 $55,000
18
BR-397 1 $55,000 $55,000
20
BR-397 1 $55,000 $55,000
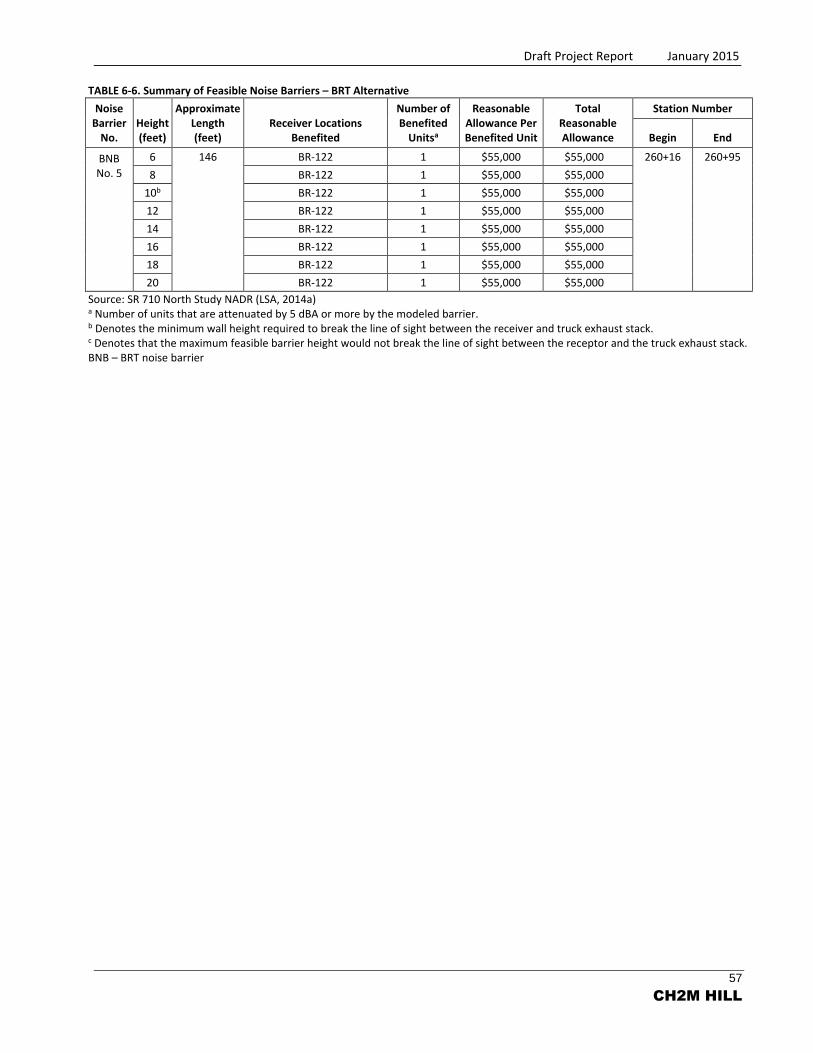
Draft Project Report January 2015
57
CH2M HILL
TABLE 6-6. Summary of Feasible Noise Barriers – BRT Alternative
Noise Barrier
No. Height (feet)
Approximate Length (feet)
Receiver Locations Benefited
Number of Benefited
Unitsa
Reasonable Allowance Per Benefited Unit
Total Reasonable Allowance
Station Number
Begin End
BNB No. 5
6 146 BR-122 1 $55,000 $55,000 260+16 260+95
8
BR-122 1 $55,000 $55,000
10b
BR-122 1 $55,000 $55,000
12
BR-122 1 $55,000 $55,000
14
BR-122 1 $55,000 $55,000
16
BR-122 1 $55,000 $55,000
18
BR-122 1 $55,000 $55,000
20
BR-122 1 $55,000 $55,000
Source: SR 710 North Study NADR (LSA, 2014a) a Number of units that are attenuated by 5 dBA or more by the modeled barrier. b Denotes the minimum wall height required to break the line of sight between the receiver and truck exhaust stack. c Denotes that the maximum feasible barrier height would not break the line of sight between the receptor and the truck exhaust stack. BNB – BRT noise barrier
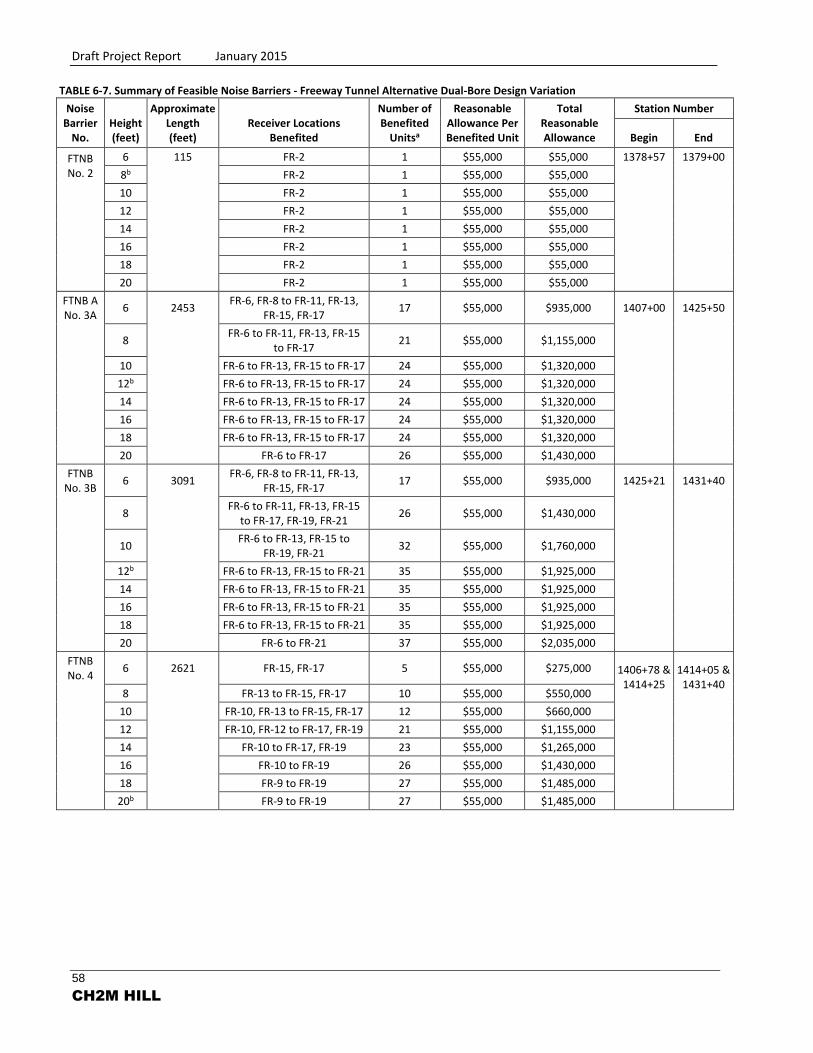
Draft Project Report January 2015
58
CH2M HILL
TABLE 6-7. Summary of Feasible Noise Barriers - Freeway Tunnel Alternative Dual-Bore Design Variation Noise
Barrier No.
Height (feet)
Approximate Length (feet)
Receiver Locations Benefited
Number of Benefited
Unitsa
Reasonable Allowance Per Benefited Unit
Total Reasonable Allowance
Station Number
Begin End
FTNB No. 2
6 115 FR-2 1 $55,000 $55,000 1378+57 1379+00
8b
FR-2 1 $55,000 $55,000
10
FR-2 1 $55,000 $55,000
12
FR-2 1 $55,000 $55,000
14
FR-2 1 $55,000 $55,000
16
FR-2 1 $55,000 $55,000
18
FR-2 1 $55,000 $55,000
20
FR-2 1 $55,000 $55,000
FTNB A No. 3A
6 2453 FR-6, FR-8 to FR-11, FR-13,
FR-15, FR-17 17 $55,000 $935,000 1407+00 1425+50
8
FR-6 to FR-11, FR-13, FR-15 to FR-17
21 $55,000 $1,155,000
10
FR-6 to FR-13, FR-15 to FR-17 24 $55,000 $1,320,000
12b
FR-6 to FR-13, FR-15 to FR-17 24 $55,000 $1,320,000
14
FR-6 to FR-13, FR-15 to FR-17 24 $55,000 $1,320,000
16
FR-6 to FR-13, FR-15 to FR-17 24 $55,000 $1,320,000
18
FR-6 to FR-13, FR-15 to FR-17 24 $55,000 $1,320,000
20
FR-6 to FR-17 26 $55,000 $1,430,000
FTNB
No. 3B 6 3091
FR-6, FR-8 to FR-11, FR-13, FR-15, FR-17
17 $55,000 $935,000 1425+21 1431+40
8
FR-6 to FR-11, FR-13, FR-15 to FR-17, FR-19, FR-21
26 $55,000 $1,430,000
10
FR-6 to FR-13, FR-15 to FR-19, FR-21
32 $55,000 $1,760,000
12b
FR-6 to FR-13, FR-15 to FR-21 35 $55,000 $1,925,000
14
FR-6 to FR-13, FR-15 to FR-21 35 $55,000 $1,925,000
16
FR-6 to FR-13, FR-15 to FR-21 35 $55,000 $1,925,000
18
FR-6 to FR-13, FR-15 to FR-21 35 $55,000 $1,925,000
20
FR-6 to FR-21 37 $55,000 $2,035,000
FTNB No. 4
6 2621 FR-15, FR-17 5 $55,000 $275,000 1406+78 & 1414+25
1414+05 & 1431+40
8
FR-13 to FR-15, FR-17 10 $55,000 $550,000
10
FR-10, FR-13 to FR-15, FR-17 12 $55,000 $660,000
12
FR-10, FR-12 to FR-17, FR-19 21 $55,000 $1,155,000
14
FR-10 to FR-17, FR-19 23 $55,000 $1,265,000
16
FR-10 to FR-19 26 $55,000 $1,430,000
18
FR-9 to FR-19 27 $55,000 $1,485,000
20b
FR-9 to FR-19 27 $55,000 $1,485,000
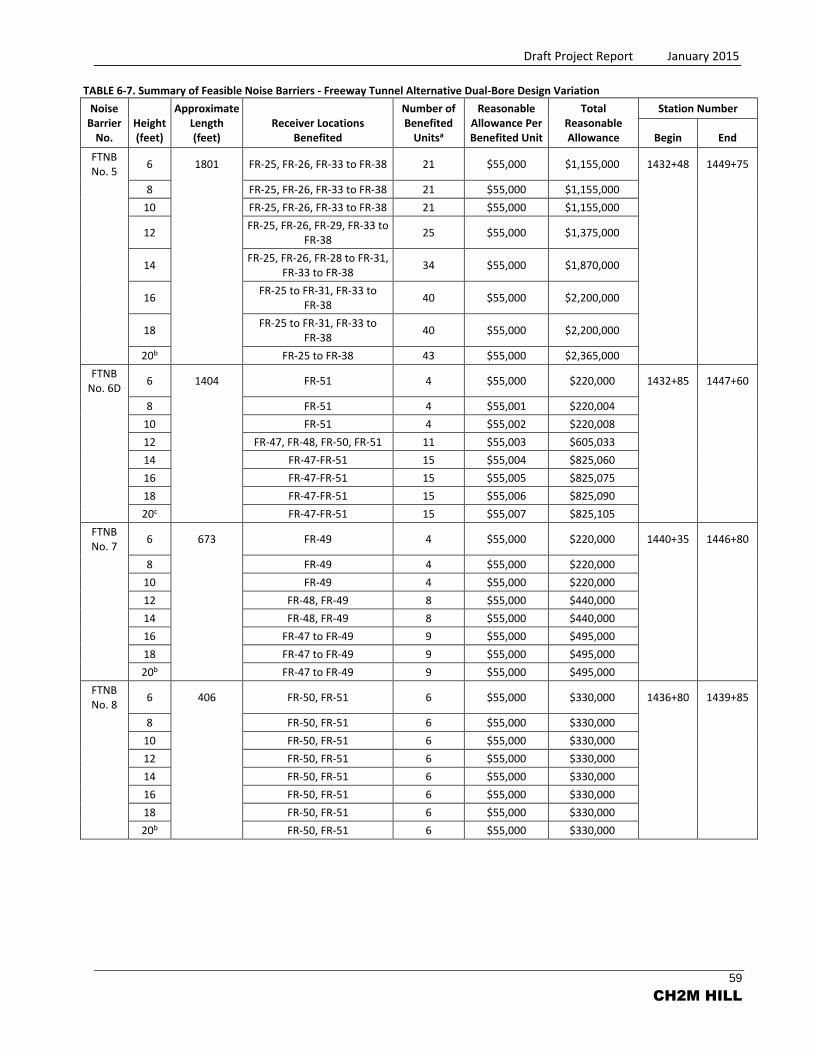
Draft Project Report January 2015
59
CH2M HILL
TABLE 6-7. Summary of Feasible Noise Barriers - Freeway Tunnel Alternative Dual-Bore Design Variation Noise
Barrier No.
Height (feet)
Approximate Length (feet)
Receiver Locations Benefited
Number of Benefited
Unitsa
Reasonable Allowance Per Benefited Unit
Total Reasonable Allowance
Station Number
Begin End
FTNB No. 5
6 1801 FR-25, FR-26, FR-33 to FR-38 21 $55,000 $1,155,000 1432+48 1449+75
8
FR-25, FR-26, FR-33 to FR-38 21 $55,000 $1,155,000
10
FR-25, FR-26, FR-33 to FR-38 21 $55,000 $1,155,000
12
FR-25, FR-26, FR-29, FR-33 to FR-38
25 $55,000 $1,375,000
14
FR-25, FR-26, FR-28 to FR-31, FR-33 to FR-38
34 $55,000 $1,870,000
16
FR-25 to FR-31, FR-33 to FR-38
40 $55,000 $2,200,000
18
FR-25 to FR-31, FR-33 to FR-38
40 $55,000 $2,200,000
20b
FR-25 to FR-38 43 $55,000 $2,365,000
FTNB
No. 6D 6 1404 FR-51 4 $55,000 $220,000 1432+85 1447+60
8
FR-51 4 $55,001 $220,004
10
FR-51 4 $55,002 $220,008
12
FR-47, FR-48, FR-50, FR-51 11 $55,003 $605,033
14
FR-47-FR-51 15 $55,004 $825,060
16
FR-47-FR-51 15 $55,005 $825,075
18
FR-47-FR-51 15 $55,006 $825,090
20c
FR-47-FR-51 15 $55,007 $825,105
FTNB No. 7
6 673 FR-49 4 $55,000 $220,000 1440+35 1446+80
8
FR-49 4 $55,000 $220,000
10
FR-49 4 $55,000 $220,000
12
FR-48, FR-49 8 $55,000 $440,000
14
FR-48, FR-49 8 $55,000 $440,000
16
FR-47 to FR-49 9 $55,000 $495,000
18
FR-47 to FR-49 9 $55,000 $495,000
20b
FR-47 to FR-49 9 $55,000 $495,000
FTNB No. 8
6 406 FR-50, FR-51 6 $55,000 $330,000 1436+80 1439+85
8
FR-50, FR-51 6 $55,000 $330,000
10
FR-50, FR-51 6 $55,000 $330,000
12
FR-50, FR-51 6 $55,000 $330,000
14
FR-50, FR-51 6 $55,000 $330,000
16
FR-50, FR-51 6 $55,000 $330,000
18
FR-50, FR-51 6 $55,000 $330,000
20b
FR-50, FR-51 6 $55,000 $330,000
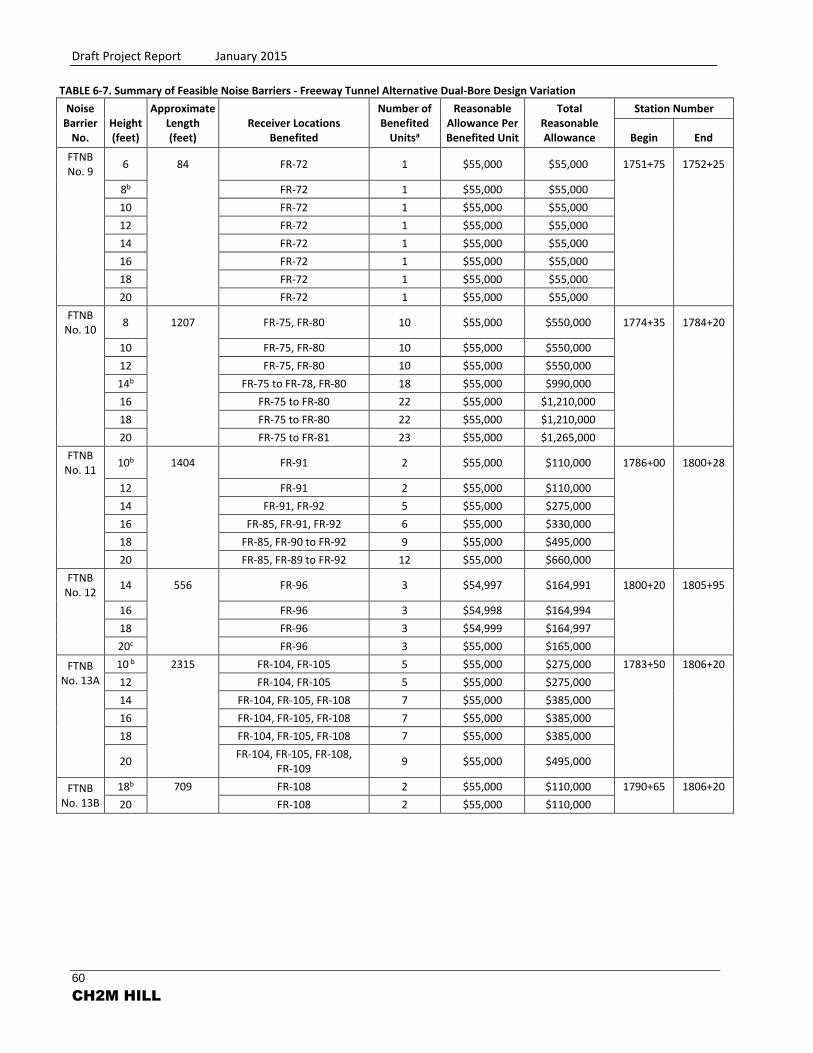
Draft Project Report January 2015
60
CH2M HILL
TABLE 6-7. Summary of Feasible Noise Barriers - Freeway Tunnel Alternative Dual-Bore Design Variation Noise
Barrier No.
Height (feet)
Approximate Length (feet)
Receiver Locations Benefited
Number of Benefited
Unitsa
Reasonable Allowance Per Benefited Unit
Total Reasonable Allowance
Station Number
Begin End
FTNB No. 9
6 84 FR-72 1 $55,000 $55,000 1751+75 1752+25
8b
FR-72 1 $55,000 $55,000
10
FR-72 1 $55,000 $55,000
12
FR-72 1 $55,000 $55,000
14
FR-72 1 $55,000 $55,000
16
FR-72 1 $55,000 $55,000
18
FR-72 1 $55,000 $55,000
20
FR-72 1 $55,000 $55,000
FTNB
No. 10 8 1207 FR-75, FR-80 10 $55,000 $550,000 1774+35 1784+20
10
FR-75, FR-80 10 $55,000 $550,000
12
FR-75, FR-80 10 $55,000 $550,000
14b
FR-75 to FR-78, FR-80 18 $55,000 $990,000
16
FR-75 to FR-80 22 $55,000 $1,210,000
18
FR-75 to FR-80 22 $55,000 $1,210,000
20
FR-75 to FR-81 23 $55,000 $1,265,000
FTNB
No. 11 10b 1404 FR-91 2 $55,000 $110,000 1786+00 1800+28
12
FR-91 2 $55,000 $110,000
14
FR-91, FR-92 5 $55,000 $275,000
16
FR-85, FR-91, FR-92 6 $55,000 $330,000
18
FR-85, FR-90 to FR-92 9 $55,000 $495,000
20
FR-85, FR-89 to FR-92 12 $55,000 $660,000
FTNB
No. 12 14 556 FR-96 3 $54,997 $164,991 1800+20 1805+95
16
FR-96 3 $54,998 $164,994
18
FR-96 3 $54,999 $164,997
20c
FR-96 3 $55,000 $165,000
FTNB
No. 13A
10 b 2315 FR-104, FR-105 5 $55,000 $275,000 1783+50 1806+20
12
FR-104, FR-105 5 $55,000 $275,000
14
FR-104, FR-105, FR-108 7 $55,000 $385,000
16
FR-104, FR-105, FR-108 7 $55,000 $385,000
18
FR-104, FR-105, FR-108 7 $55,000 $385,000
20
FR-104, FR-105, FR-108, FR-109
9 $55,000 $495,000
FTNB No. 13B
18b 709 FR-108 2 $55,000 $110,000 1790+65 1806+20
20
FR-108 2 $55,000 $110,000

Draft Project Report January 2015
61
CH2M HILL
TABLE 6-7. Summary of Feasible Noise Barriers - Freeway Tunnel Alternative Dual-Bore Design Variation Noise
Barrier No.
Height (feet)
Approximate Length (feet)
Receiver Locations Benefited
Number of Benefited
Unitsa
Reasonable Allowance Per Benefited Unit
Total Reasonable Allowance
Station Number
Begin End
FTNB No. 14
8 263 FR-115 1 $55,000 $55,000 1774+15 1776+22
10
FR-115 1 $55,000 $55,000
12
FR-115 1 $55,000 $55,000
14
FR-115 1 $55,000 $55,000
16b
FR-115 1 $55,000 $55,000
18
FR-115 1 $55,000 $55,000
20
FR-115 1 $55,000 $55,000
FTNB
No. 15 8 262 FR-116 1 $55,000 $55,000 1768+60 1769+90
10
FR-116 1 $55,000 $55,000
12b
FR-116 1 $55,000 $55,000
14
FR-116, FR-117 2 $55,000 $110,000
16
FR-116, FR-117 2 $55,000 $110,000
18
FR-116, FR-117 2 $55,000 $110,000
20
FR-116, FR-117 2 $55,000 $110,000
Source: SR 710 North Study NADR (LSA, 2014a) a Number of units that are attenuated by 5 dBA or more by the modeled barrier. b Denotes the minimum wall height required to break the line of sight between the receiver and truck exhaust stack. c Denotes that the maximum feasible barrier height would not break the line of sight between the receptor and the truck exhaust stack. FTNB – freeway tunnel noise barrier
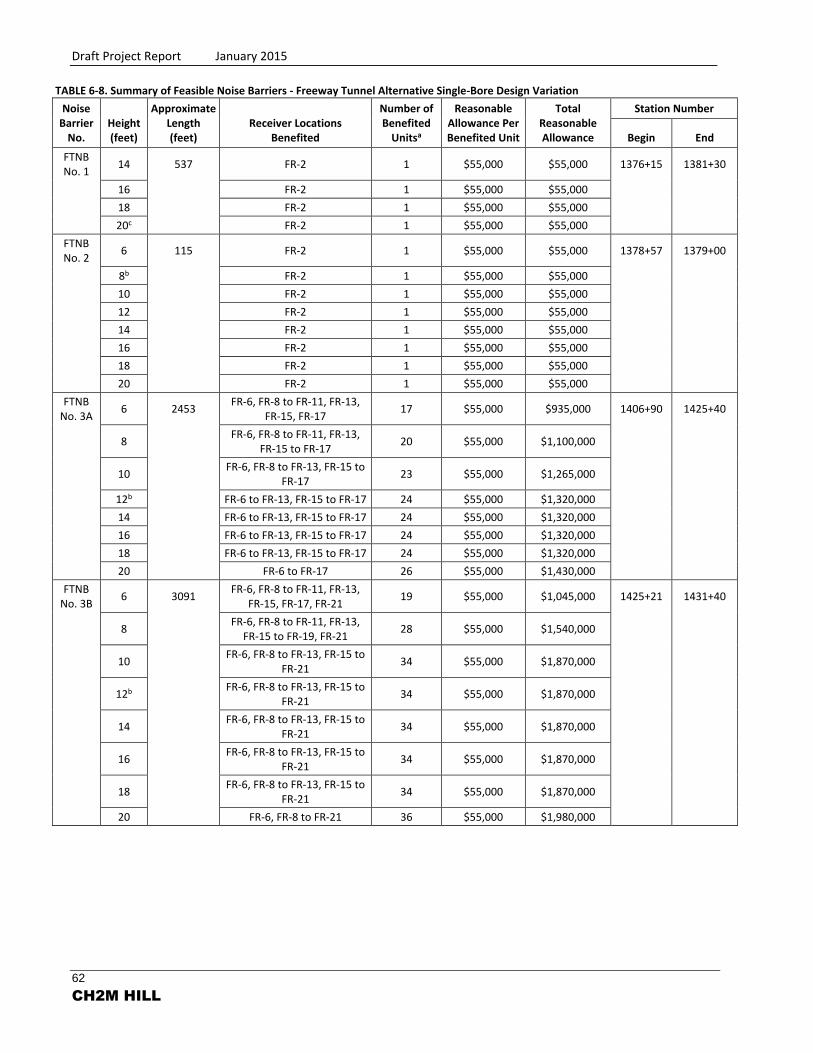
Draft Project Report January 2015
62
CH2M HILL
TABLE 6-8. Summary of Feasible Noise Barriers - Freeway Tunnel Alternative Single-Bore Design Variation
Noise Barrier
No. Height (feet)
Approximate Length (feet)
Receiver Locations Benefited
Number of Benefited
Unitsa
Reasonable Allowance Per Benefited Unit
Total Reasonable Allowance
Station Number
Begin End
FTNB No. 1
14 537 FR-2 1 $55,000 $55,000 1376+15 1381+30
16
FR-2 1 $55,000 $55,000
18
FR-2 1 $55,000 $55,000
20c
FR-2 1 $55,000 $55,000
FTNB No. 2
6 115 FR-2 1 $55,000 $55,000 1378+57 1379+00
8b
FR-2 1 $55,000 $55,000
10
FR-2 1 $55,000 $55,000
12
FR-2 1 $55,000 $55,000
14
FR-2 1 $55,000 $55,000
16
FR-2 1 $55,000 $55,000
18
FR-2 1 $55,000 $55,000
20
FR-2 1 $55,000 $55,000
FTNB
No. 3A 6 2453
FR-6, FR-8 to FR-11, FR-13, FR-15, FR-17
17 $55,000 $935,000 1406+90 1425+40
8
FR-6, FR-8 to FR-11, FR-13, FR-15 to FR-17
20 $55,000 $1,100,000
10
FR-6, FR-8 to FR-13, FR-15 to FR-17
23 $55,000 $1,265,000
12b
FR-6 to FR-13, FR-15 to FR-17 24 $55,000 $1,320,000
14
FR-6 to FR-13, FR-15 to FR-17 24 $55,000 $1,320,000
16
FR-6 to FR-13, FR-15 to FR-17 24 $55,000 $1,320,000
18
FR-6 to FR-13, FR-15 to FR-17 24 $55,000 $1,320,000
20
FR-6 to FR-17 26 $55,000 $1,430,000
FTNB
No. 3B 6 3091
FR-6, FR-8 to FR-11, FR-13, FR-15, FR-17, FR-21
19 $55,000 $1,045,000 1425+21 1431+40
8
FR-6, FR-8 to FR-11, FR-13, FR-15 to FR-19, FR-21
28 $55,000 $1,540,000
10
FR-6, FR-8 to FR-13, FR-15 to FR-21
34 $55,000 $1,870,000
12b
FR-6, FR-8 to FR-13, FR-15 to FR-21
34 $55,000 $1,870,000
14
FR-6, FR-8 to FR-13, FR-15 to FR-21
34 $55,000 $1,870,000
16
FR-6, FR-8 to FR-13, FR-15 to FR-21
34 $55,000 $1,870,000
18
FR-6, FR-8 to FR-13, FR-15 to FR-21
34 $55,000 $1,870,000
20
FR-6, FR-8 to FR-21 36 $55,000 $1,980,000
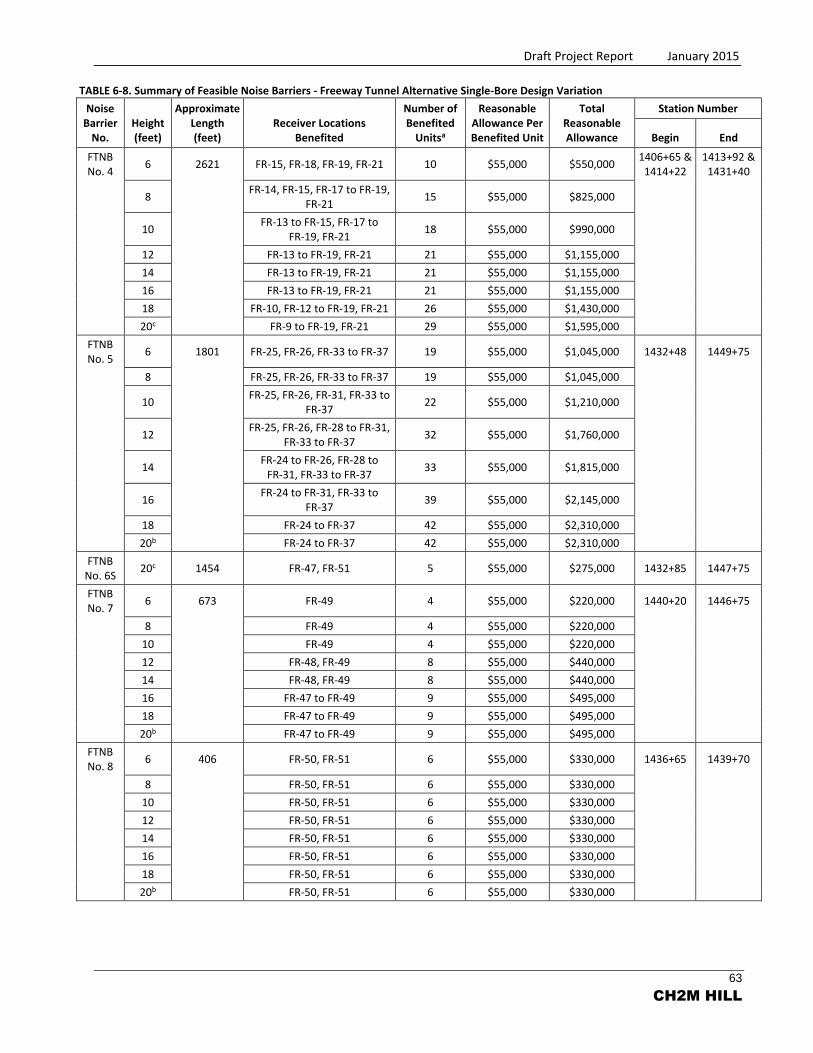
Draft Project Report January 2015
63
CH2M HILL
TABLE 6-8. Summary of Feasible Noise Barriers - Freeway Tunnel Alternative Single-Bore Design Variation
Noise Barrier
No. Height (feet)
Approximate Length (feet)
Receiver Locations Benefited
Number of Benefited
Unitsa
Reasonable Allowance Per Benefited Unit
Total Reasonable Allowance
Station Number
Begin End
FTNB No. 4
6 2621 FR-15, FR-18, FR-19, FR-21 10 $55,000 $550,000 1406+65 &
1414+22 1413+92 &
1431+40
8
FR-14, FR-15, FR-17 to FR-19, FR-21
15 $55,000 $825,000
10
FR-13 to FR-15, FR-17 to FR-19, FR-21
18 $55,000 $990,000
12
FR-13 to FR-19, FR-21 21 $55,000 $1,155,000
14
FR-13 to FR-19, FR-21 21 $55,000 $1,155,000
16
FR-13 to FR-19, FR-21 21 $55,000 $1,155,000
18
FR-10, FR-12 to FR-19, FR-21 26 $55,000 $1,430,000
20c
FR-9 to FR-19, FR-21 29 $55,000 $1,595,000
FTNB No. 5
6 1801 FR-25, FR-26, FR-33 to FR-37 19 $55,000 $1,045,000 1432+48 1449+75
8
FR-25, FR-26, FR-33 to FR-37 19 $55,000 $1,045,000
10
FR-25, FR-26, FR-31, FR-33 to FR-37
22 $55,000 $1,210,000
12
FR-25, FR-26, FR-28 to FR-31, FR-33 to FR-37
32 $55,000 $1,760,000
14
FR-24 to FR-26, FR-28 to FR-31, FR-33 to FR-37
33 $55,000 $1,815,000
16
FR-24 to FR-31, FR-33 to FR-37
39 $55,000 $2,145,000
18
FR-24 to FR-37 42 $55,000 $2,310,000
20b
FR-24 to FR-37 42 $55,000 $2,310,000
FTNB
No. 6S 20c 1454 FR-47, FR-51 5 $55,000 $275,000 1432+85 1447+75
FTNB No. 7
6 673 FR-49 4 $55,000 $220,000 1440+20 1446+75
8
FR-49 4 $55,000 $220,000
10
FR-49 4 $55,000 $220,000
12
FR-48, FR-49 8 $55,000 $440,000
14
FR-48, FR-49 8 $55,000 $440,000
16
FR-47 to FR-49 9 $55,000 $495,000
18
FR-47 to FR-49 9 $55,000 $495,000
20b
FR-47 to FR-49 9 $55,000 $495,000
FTNB No. 8
6 406 FR-50, FR-51 6 $55,000 $330,000 1436+65 1439+70
8
FR-50, FR-51 6 $55,000 $330,000
10
FR-50, FR-51 6 $55,000 $330,000
12
FR-50, FR-51 6 $55,000 $330,000
14
FR-50, FR-51 6 $55,000 $330,000
16
FR-50, FR-51 6 $55,000 $330,000
18
FR-50, FR-51 6 $55,000 $330,000
20b
FR-50, FR-51 6 $55,000 $330,000
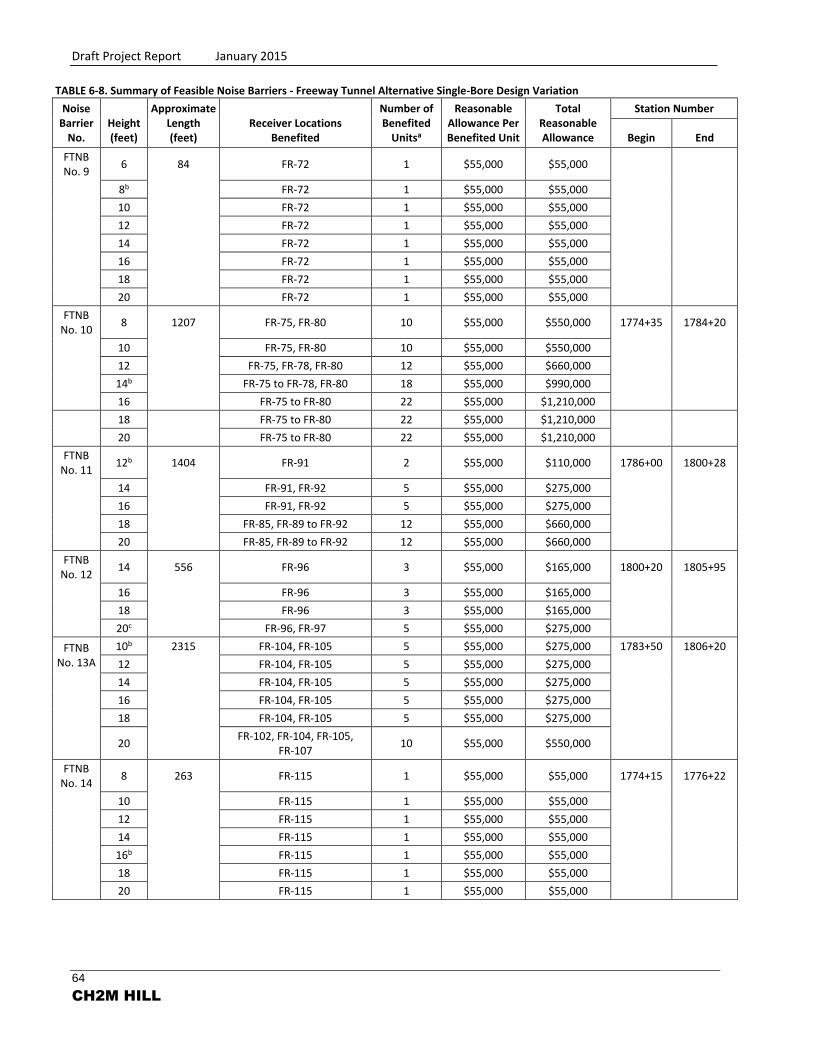
Draft Project Report January 2015
64
CH2M HILL
TABLE 6-8. Summary of Feasible Noise Barriers - Freeway Tunnel Alternative Single-Bore Design Variation
Noise Barrier
No. Height (feet)
Approximate Length (feet)
Receiver Locations Benefited
Number of Benefited
Unitsa
Reasonable Allowance Per Benefited Unit
Total Reasonable Allowance
Station Number
Begin End
FTNB No. 9
6 84 FR-72 1 $55,000 $55,000
8b
FR-72 1 $55,000 $55,000
10
FR-72 1 $55,000 $55,000
12
FR-72 1 $55,000 $55,000
14
FR-72 1 $55,000 $55,000
16
FR-72 1 $55,000 $55,000
18
FR-72 1 $55,000 $55,000
20
FR-72 1 $55,000 $55,000
FTNB
No. 10 8 1207 FR-75, FR-80 10 $55,000 $550,000 1774+35 1784+20
10
FR-75, FR-80 10 $55,000 $550,000
12
FR-75, FR-78, FR-80 12 $55,000 $660,000
14b
FR-75 to FR-78, FR-80 18 $55,000 $990,000
16
FR-75 to FR-80 22 $55,000 $1,210,000
18
FR-75 to FR-80 22 $55,000 $1,210,000
20
FR-75 to FR-80 22 $55,000 $1,210,000
FTNB
No. 11 12b 1404 FR-91 2 $55,000 $110,000 1786+00 1800+28
14
FR-91, FR-92 5 $55,000 $275,000
16
FR-91, FR-92 5 $55,000 $275,000
18
FR-85, FR-89 to FR-92 12 $55,000 $660,000
20
FR-85, FR-89 to FR-92 12 $55,000 $660,000
FTNB
No. 12 14 556 FR-96 3 $55,000 $165,000 1800+20 1805+95
16
FR-96 3 $55,000 $165,000
18
FR-96 3 $55,000 $165,000
20c
FR-96, FR-97 5 $55,000 $275,000
FTNB
No. 13A
10b 2315 FR-104, FR-105 5 $55,000 $275,000 1783+50 1806+20
12
FR-104, FR-105 5 $55,000 $275,000
14
FR-104, FR-105 5 $55,000 $275,000
16
FR-104, FR-105 5 $55,000 $275,000
18
FR-104, FR-105 5 $55,000 $275,000
20
FR-102, FR-104, FR-105, FR-107
10 $55,000 $550,000
FTNB No. 14
8 263 FR-115 1 $55,000 $55,000 1774+15 1776+22
10
FR-115 1 $55,000 $55,000
12
FR-115 1 $55,000 $55,000
14
FR-115 1 $55,000 $55,000
16b
FR-115 1 $55,000 $55,000
18
FR-115 1 $55,000 $55,000
20
FR-115 1 $55,000 $55,000
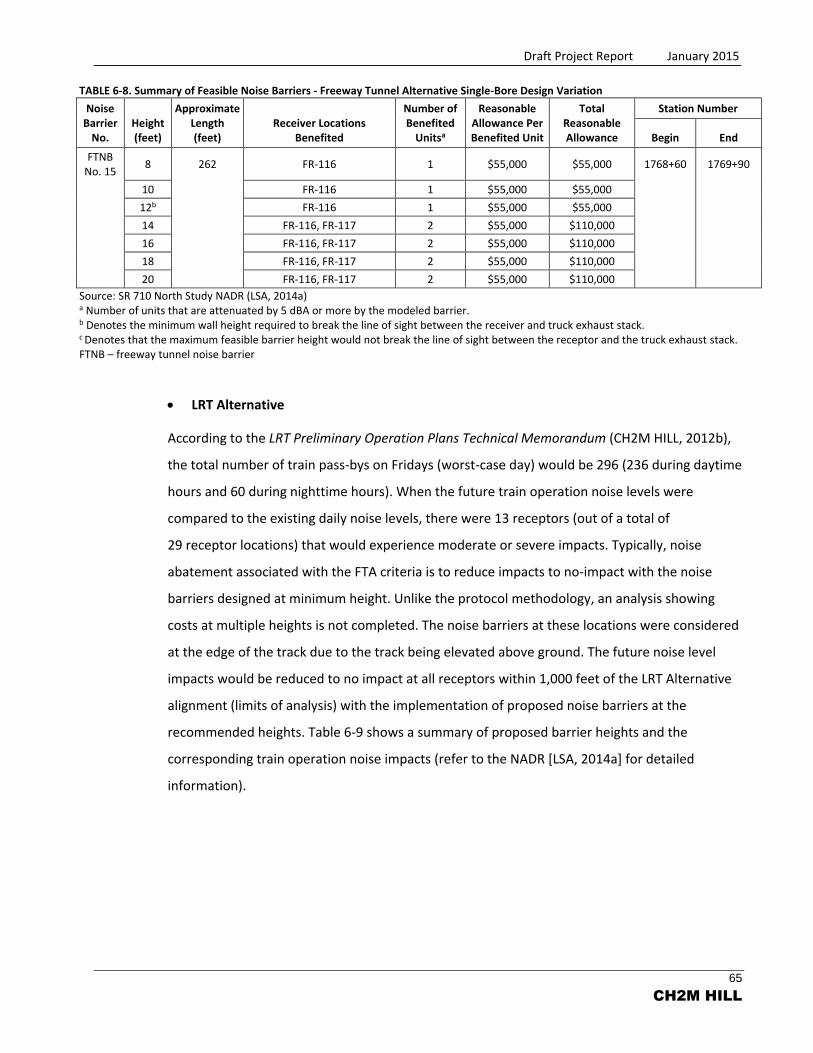
Draft Project Report January 2015
65
CH2M HILL
TABLE 6-8. Summary of Feasible Noise Barriers - Freeway Tunnel Alternative Single-Bore Design Variation
Noise Barrier
No. Height (feet)
Approximate Length (feet)
Receiver Locations Benefited
Number of Benefited
Unitsa
Reasonable Allowance Per Benefited Unit
Total Reasonable Allowance
Station Number
Begin End
FTNB No. 15
8 262 FR-116 1 $55,000 $55,000 1768+60 1769+90
10
FR-116 1 $55,000 $55,000
12b
FR-116 1 $55,000 $55,000
14
FR-116, FR-117 2 $55,000 $110,000
16
FR-116, FR-117 2 $55,000 $110,000
18
FR-116, FR-117 2 $55,000 $110,000
20
FR-116, FR-117 2 $55,000 $110,000
Source: SR 710 North Study NADR (LSA, 2014a) a Number of units that are attenuated by 5 dBA or more by the modeled barrier. b Denotes the minimum wall height required to break the line of sight between the receiver and truck exhaust stack. c Denotes that the maximum feasible barrier height would not break the line of sight between the receptor and the truck exhaust stack. FTNB – freeway tunnel noise barrier
LRT Alternative
According to the LRT Preliminary Operation Plans Technical Memorandum (CH2M HILL, 2012b),
the total number of train pass-bys on Fridays (worst-case day) would be 296 (236 during daytime
hours and 60 during nighttime hours). When the future train operation noise levels were
compared to the existing daily noise levels, there were 13 receptors (out of a total of
29 receptor locations) that would experience moderate or severe impacts. Typically, noise
abatement associated with the FTA criteria is to reduce impacts to no-impact with the noise
barriers designed at minimum height. Unlike the protocol methodology, an analysis showing
costs at multiple heights is not completed. The noise barriers at these locations were considered
at the edge of the track due to the track being elevated above ground. The future noise level
impacts would be reduced to no impact at all receptors within 1,000 feet of the LRT Alternative
alignment (limits of analysis) with the implementation of proposed noise barriers at the
recommended heights. Table 6-9 shows a summary of proposed barrier heights and the
corresponding train operation noise impacts (refer to the NADR [LSA, 2014a] for detailed
information).

Draft Project Report January 2015
66
CH2M HILL
TABLE 6-9. Summary of Barrier Evaluation and Operations Noise Impact Analysis for LRT Alternative
Receptor Location
Existing Noise Level
(Ldn)
Train Operations Noise Level
(Ldn)
Noise Exposure Increase
(dBA)
No Impact, Moderate,
Severea
Proposed Barrier Height (feet)b
Train Noise Level With Mitigation
(dBA)
No Impact, Moderate,
Severe After Mitigationa
LR-01 54.6 63.6 9.5 Severe 6.0 54.4 No Impact
LR-02 54.6 57.2 4.5 Moderate 4.0 51.8 No Impact
LR-03 63.1 67.5 5.7 Severe 5.5 59.5 No Impact
LR-04 63.1 60.5 1.9 Moderate 4.0 55.8 No Impact
LR-05 64.6 63.7 2.6 Moderate 4.0 58.4 No Impact
LR-06 58.0 67.3 9.8 Severe 9.5 56.9 No Impact
LR-07c 61.9 63.7 4.0 - 0.0 - -
LR-08 61.9 68.3 7.3 Severe 7.0 58.7 No Impact
LR-09 60.0 59.1 2.6 Moderate 4.0 54.4 No Impact
LR-10 65.6 69.3 5.2 Severe 5.0 60.8 No Impact
LR-11 67.8 68.4 3.3 Moderate 4.0 61.4 No Impact
LR-12 67.6 67.9 3.2 Moderate 4.0 60.6 No Impact
LR-13 67.6 67.9 3.2 Moderate 4.0 60.6 No Impact
LR-14 67.6 67.3 2.9 Moderate 4.0 60.2 No Impact
LR-15 67.6 67.6 3.0 Moderate 4.0 60.4 No Impact
LR-16 67.7 60.5 0.8 No Impact 0.0 - -
LR-17 61.7 54.7 0.8 No Impact 0.0 - -
LR-18 67.0 56.3 0.4 No Impact 0.0 - -
LR-19 64.4 55.9 0.6 No Impact 0.0 - -
LR-20 61.9 61.9 3.0 Moderate 4.0 56.4 No Impact
LR-21 65.9 62.1 1.5 Moderate 4.0 56.5 No Impact
LR-22 61.8 62.0 3.1 Moderate 4.0 57.0 No Impact
LR-23 69.7 63.0 0.8 No Impact 0.0 - -
LR-24 77.0 65.8 0.3 No Impact 0.0 - -
LR-25 63.3 56.2 0.8 No Impact 0.0 - -
LR-26 76.7 57.0 0.0 No Impact 0.0 - -
LR-27 71.4 61.6 0.4 No Impact 0.0 - -
LR-28 58.9 52.3 0.9 No Impact 0.0 - -
LR-29 58.1 54.2 1.5 No Impact 0.0 - -
Source: SR 710 North Study NADR (LSA, 2014a)
a Transit Noise and Vibration Impact Assessment Manual, Table 3-1 (FTA, 2006) b Proposed barrier height is relative to the track height level. c Non-noise-sensitive active park. Only passive parks are classified as being noise sensitive. Level shown for reporting purposes only. Ldn – day-night average sound level
J. Traffic Analysis
Traffic analysis for all the build alternatives was performed using the same methodology described in
Future Traffic Conditions (Section 4.C.II of this DPR). Future freeway performance was projected using
the SR 710 North travel demand model, based on the 2012 SCAG RTP/SCS, with post-processing of
the results for consistency. Details of the SR 710 North travel demand model can be found in the TTR,
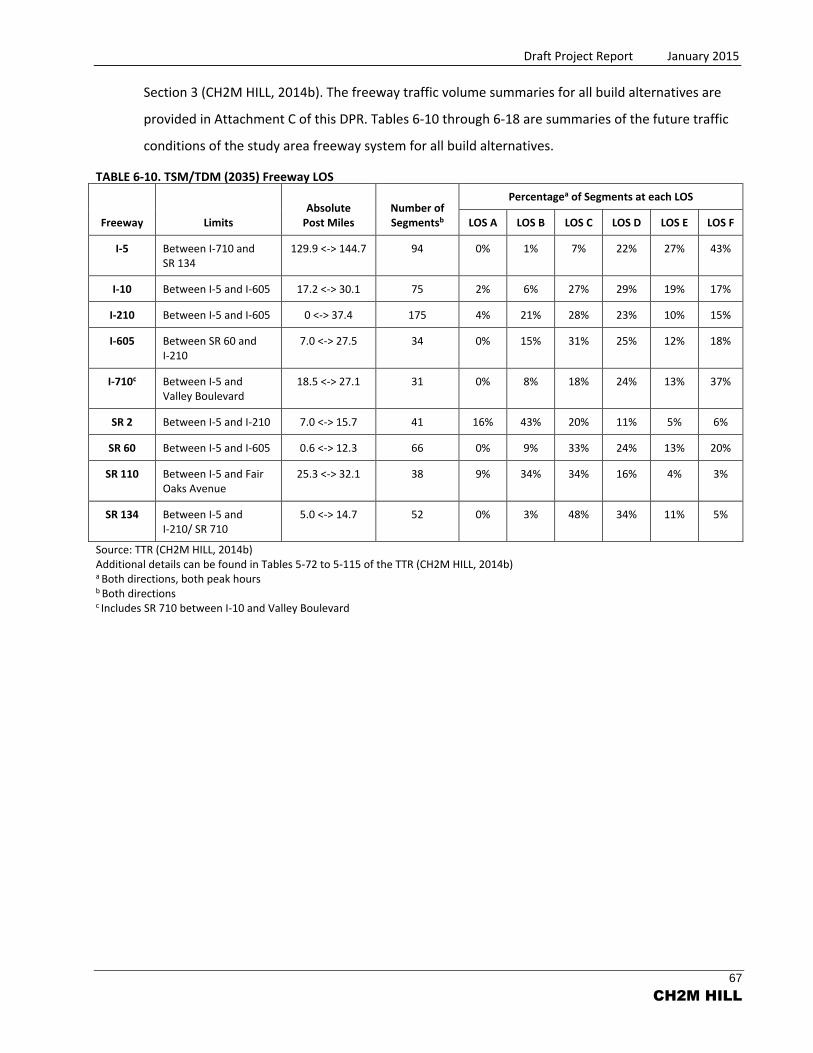
Draft Project Report January 2015
67
CH2M HILL
Section 3 (CH2M HILL, 2014b). The freeway traffic volume summaries for all build alternatives are
provided in Attachment C of this DPR. Tables 6-10 through 6-18 are summaries of the future traffic
conditions of the study area freeway system for all build alternatives.
TABLE 6-10. TSM/TDM (2035) Freeway LOS
Freeway Limits Absolute
Post Miles Number of Segmentsb
Percentagea of Segments at each LOS
LOS A LOS B LOS C LOS D LOS E LOS F
I-5 Between I-710 and SR 134
129.9 <-> 144.7 94 0% 1% 7% 22% 27% 43%
I-10 Between I-5 and I-605 17.2 <-> 30.1 75 2% 6% 27% 29% 19% 17%
I-210 Between I-5 and I-605 0 <-> 37.4 175 4% 21% 28% 23% 10% 15%
I-605 Between SR 60 and I-210
7.0 <-> 27.5 34 0% 15% 31% 25% 12% 18%
I-710c Between I-5 and Valley Boulevard
18.5 <-> 27.1 31 0% 8% 18% 24% 13% 37%
SR 2 Between I-5 and I-210 7.0 <-> 15.7 41 16% 43% 20% 11% 5% 6%
SR 60 Between I-5 and I-605 0.6 <-> 12.3 66 0% 9% 33% 24% 13% 20%
SR 110 Between I-5 and Fair Oaks Avenue
25.3 <-> 32.1 38 9% 34% 34% 16% 4% 3%
SR 134 Between I-5 and I-210/ SR 710
5.0 <-> 14.7 52 0% 3% 48% 34% 11% 5%
Source: TTR (CH2M HILL, 2014b) Additional details can be found in Tables 5-72 to 5-115 of the TTR (CH2M HILL, 2014b) a Both directions, both peak hours b Both directions c Includes SR 710 between I-10 and Valley Boulevard
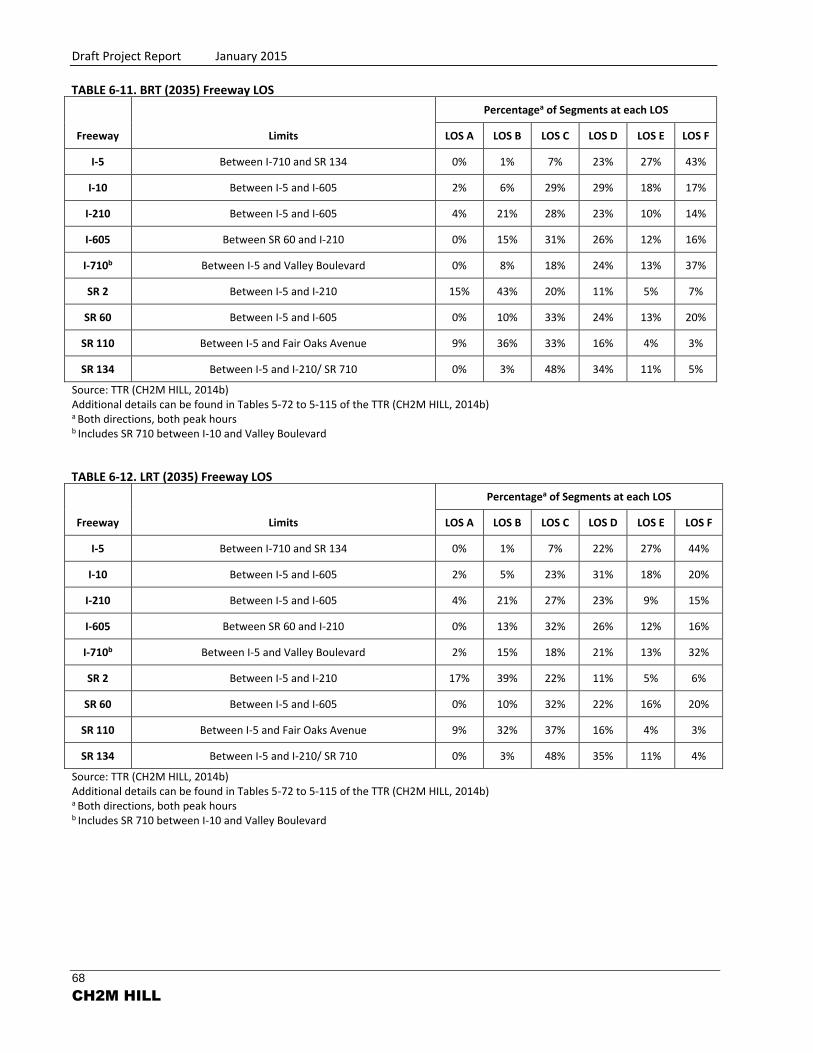
Draft Project Report January 2015
68
CH2M HILL
TABLE 6-11. BRT (2035) Freeway LOS
Freeway Limits
Percentagea of Segments at each LOS
LOS A LOS B LOS C LOS D LOS E LOS F
I-5 Between I-710 and SR 134 0% 1% 7% 23% 27% 43%
I-10 Between I-5 and I-605 2% 6% 29% 29% 18% 17%
I-210 Between I-5 and I-605 4% 21% 28% 23% 10% 14%
I-605 Between SR 60 and I-210 0% 15% 31% 26% 12% 16%
I-710b Between I-5 and Valley Boulevard 0% 8% 18% 24% 13% 37%
SR 2 Between I-5 and I-210 15% 43% 20% 11% 5% 7%
SR 60 Between I-5 and I-605 0% 10% 33% 24% 13% 20%
SR 110 Between I-5 and Fair Oaks Avenue 9% 36% 33% 16% 4% 3%
SR 134 Between I-5 and I-210/ SR 710 0% 3% 48% 34% 11% 5%
Source: TTR (CH2M HILL, 2014b) Additional details can be found in Tables 5-72 to 5-115 of the TTR (CH2M HILL, 2014b) a Both directions, both peak hours b Includes SR 710 between I-10 and Valley Boulevard TABLE 6-12. LRT (2035) Freeway LOS
Freeway Limits
Percentagea of Segments at each LOS
LOS A LOS B LOS C LOS D LOS E LOS F
I-5 Between I-710 and SR 134 0% 1% 7% 22% 27% 44%
I-10 Between I-5 and I-605 2% 5% 23% 31% 18% 20%
I-210 Between I-5 and I-605 4% 21% 27% 23% 9% 15%
I-605 Between SR 60 and I-210 0% 13% 32% 26% 12% 16%
I-710b Between I-5 and Valley Boulevard 2% 15% 18% 21% 13% 32%
SR 2 Between I-5 and I-210 17% 39% 22% 11% 5% 6%
SR 60 Between I-5 and I-605 0% 10% 32% 22% 16% 20%
SR 110 Between I-5 and Fair Oaks Avenue 9% 32% 37% 16% 4% 3%
SR 134 Between I-5 and I-210/ SR 710 0% 3% 48% 35% 11% 4%
Source: TTR (CH2M HILL, 2014b) Additional details can be found in Tables 5-72 to 5-115 of the TTR (CH2M HILL, 2014b) a Both directions, both peak hours b Includes SR 710 between I-10 and Valley Boulevard
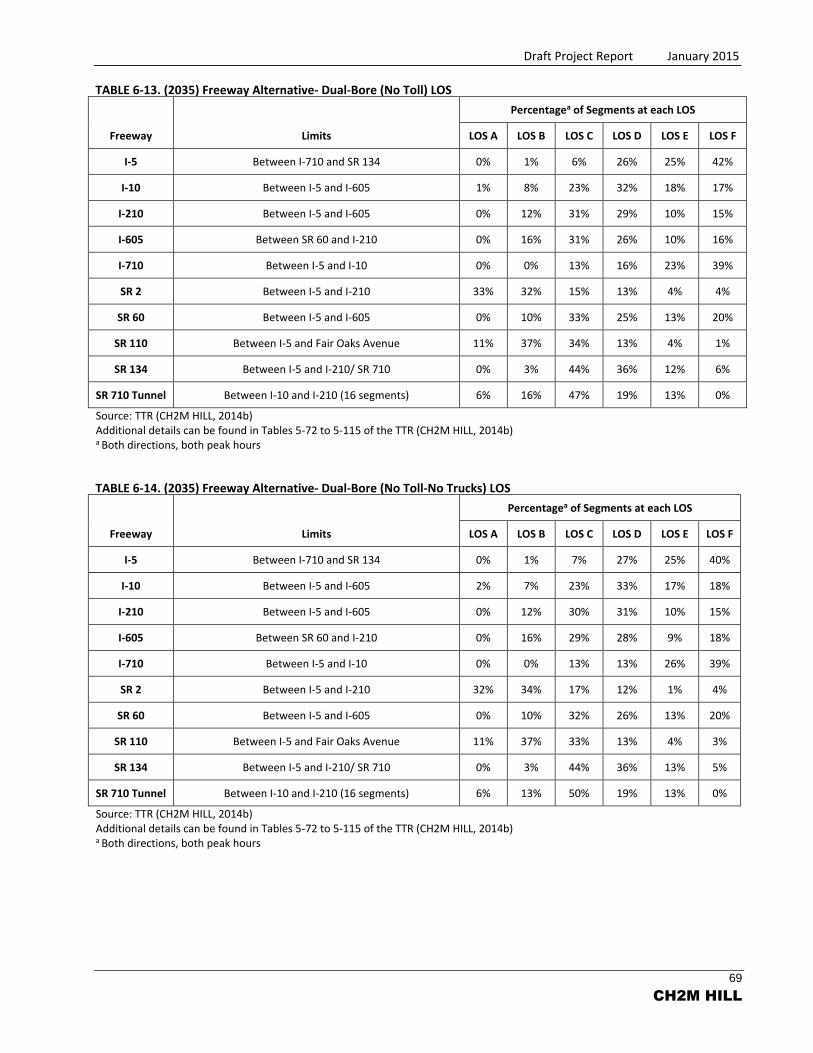
Draft Project Report January 2015
69
CH2M HILL
TABLE 6-13. (2035) Freeway Alternative- Dual-Bore (No Toll) LOS
Freeway Limits
Percentagea of Segments at each LOS
LOS A LOS B LOS C LOS D LOS E LOS F
I-5 Between I-710 and SR 134 0% 1% 6% 26% 25% 42%
I-10 Between I-5 and I-605 1% 8% 23% 32% 18% 17%
I-210 Between I-5 and I-605 0% 12% 31% 29% 10% 15%
I-605 Between SR 60 and I-210 0% 16% 31% 26% 10% 16%
I-710 Between I-5 and I-10 0% 0% 13% 16% 23% 39%
SR 2 Between I-5 and I-210 33% 32% 15% 13% 4% 4%
SR 60 Between I-5 and I-605 0% 10% 33% 25% 13% 20%
SR 110 Between I-5 and Fair Oaks Avenue 11% 37% 34% 13% 4% 1%
SR 134 Between I-5 and I-210/ SR 710 0% 3% 44% 36% 12% 6%
SR 710 Tunnel Between I-10 and I-210 (16 segments) 6% 16% 47% 19% 13% 0%
Source: TTR (CH2M HILL, 2014b) Additional details can be found in Tables 5-72 to 5-115 of the TTR (CH2M HILL, 2014b) a Both directions, both peak hours TABLE 6-14. (2035) Freeway Alternative- Dual-Bore (No Toll-No Trucks) LOS
Freeway Limits
Percentagea of Segments at each LOS
LOS A LOS B LOS C LOS D LOS E LOS F
I-5 Between I-710 and SR 134 0% 1% 7% 27% 25% 40%
I-10 Between I-5 and I-605 2% 7% 23% 33% 17% 18%
I-210 Between I-5 and I-605 0% 12% 30% 31% 10% 15%
I-605 Between SR 60 and I-210 0% 16% 29% 28% 9% 18%
I-710 Between I-5 and I-10 0% 0% 13% 13% 26% 39%
SR 2 Between I-5 and I-210 32% 34% 17% 12% 1% 4%
SR 60 Between I-5 and I-605 0% 10% 32% 26% 13% 20%
SR 110 Between I-5 and Fair Oaks Avenue 11% 37% 33% 13% 4% 3%
SR 134 Between I-5 and I-210/ SR 710 0% 3% 44% 36% 13% 5%
SR 710 Tunnel Between I-10 and I-210 (16 segments) 6% 13% 50% 19% 13% 0%
Source: TTR (CH2M HILL, 2014b) Additional details can be found in Tables 5-72 to 5-115 of the TTR (CH2M HILL, 2014b) a Both directions, both peak hours
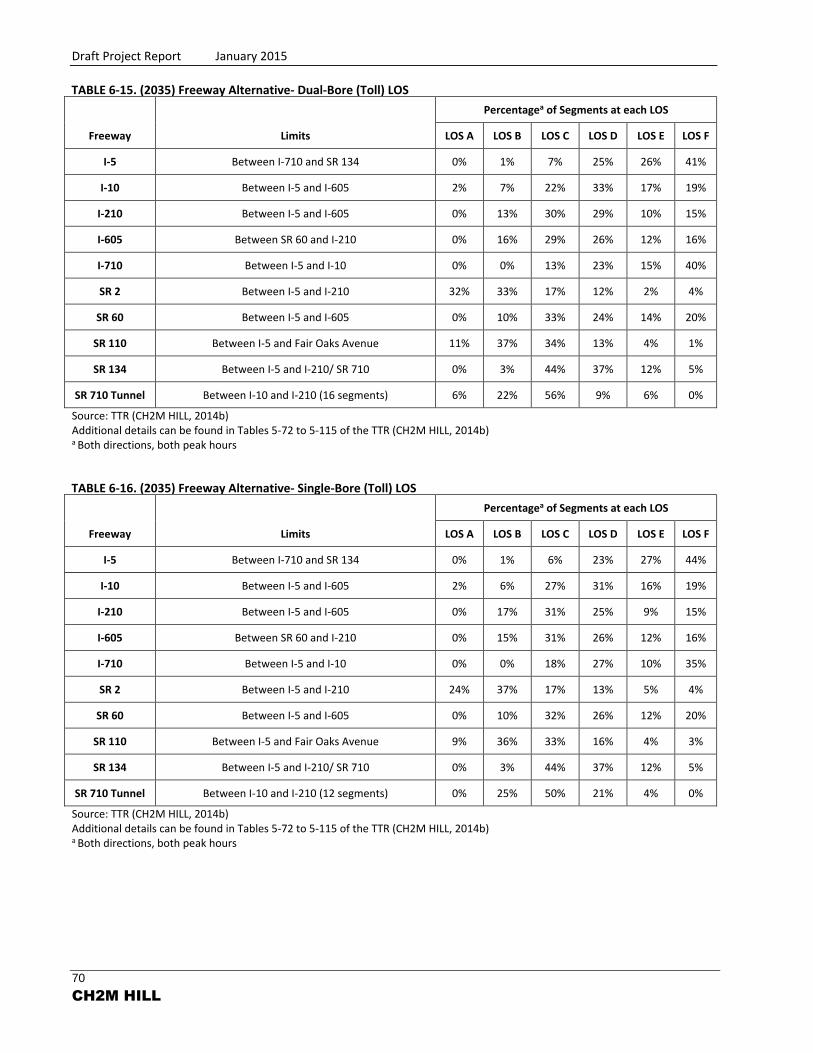
Draft Project Report January 2015
70
CH2M HILL
TABLE 6-15. (2035) Freeway Alternative- Dual-Bore (Toll) LOS
Freeway Limits
Percentagea of Segments at each LOS
LOS A LOS B LOS C LOS D LOS E LOS F
I-5 Between I-710 and SR 134 0% 1% 7% 25% 26% 41%
I-10 Between I-5 and I-605 2% 7% 22% 33% 17% 19%
I-210 Between I-5 and I-605 0% 13% 30% 29% 10% 15%
I-605 Between SR 60 and I-210 0% 16% 29% 26% 12% 16%
I-710 Between I-5 and I-10 0% 0% 13% 23% 15% 40%
SR 2 Between I-5 and I-210 32% 33% 17% 12% 2% 4%
SR 60 Between I-5 and I-605 0% 10% 33% 24% 14% 20%
SR 110 Between I-5 and Fair Oaks Avenue 11% 37% 34% 13% 4% 1%
SR 134 Between I-5 and I-210/ SR 710 0% 3% 44% 37% 12% 5%
SR 710 Tunnel Between I-10 and I-210 (16 segments) 6% 22% 56% 9% 6% 0%
Source: TTR (CH2M HILL, 2014b) Additional details can be found in Tables 5-72 to 5-115 of the TTR (CH2M HILL, 2014b) a Both directions, both peak hours TABLE 6-16. (2035) Freeway Alternative- Single-Bore (Toll) LOS
Freeway Limits
Percentagea of Segments at each LOS
LOS A LOS B LOS C LOS D LOS E LOS F
I-5 Between I-710 and SR 134 0% 1% 6% 23% 27% 44%
I-10 Between I-5 and I-605 2% 6% 27% 31% 16% 19%
I-210 Between I-5 and I-605 0% 17% 31% 25% 9% 15%
I-605 Between SR 60 and I-210 0% 15% 31% 26% 12% 16%
I-710 Between I-5 and I-10 0% 0% 18% 27% 10% 35%
SR 2 Between I-5 and I-210 24% 37% 17% 13% 5% 4%
SR 60 Between I-5 and I-605 0% 10% 32% 26% 12% 20%
SR 110 Between I-5 and Fair Oaks Avenue 9% 36% 33% 16% 4% 3%
SR 134 Between I-5 and I-210/ SR 710 0% 3% 44% 37% 12% 5%
SR 710 Tunnel Between I-10 and I-210 (12 segments) 0% 25% 50% 21% 4% 0%
Source: TTR (CH2M HILL, 2014b) Additional details can be found in Tables 5-72 to 5-115 of the TTR (CH2M HILL, 2014b) a Both directions, both peak hours
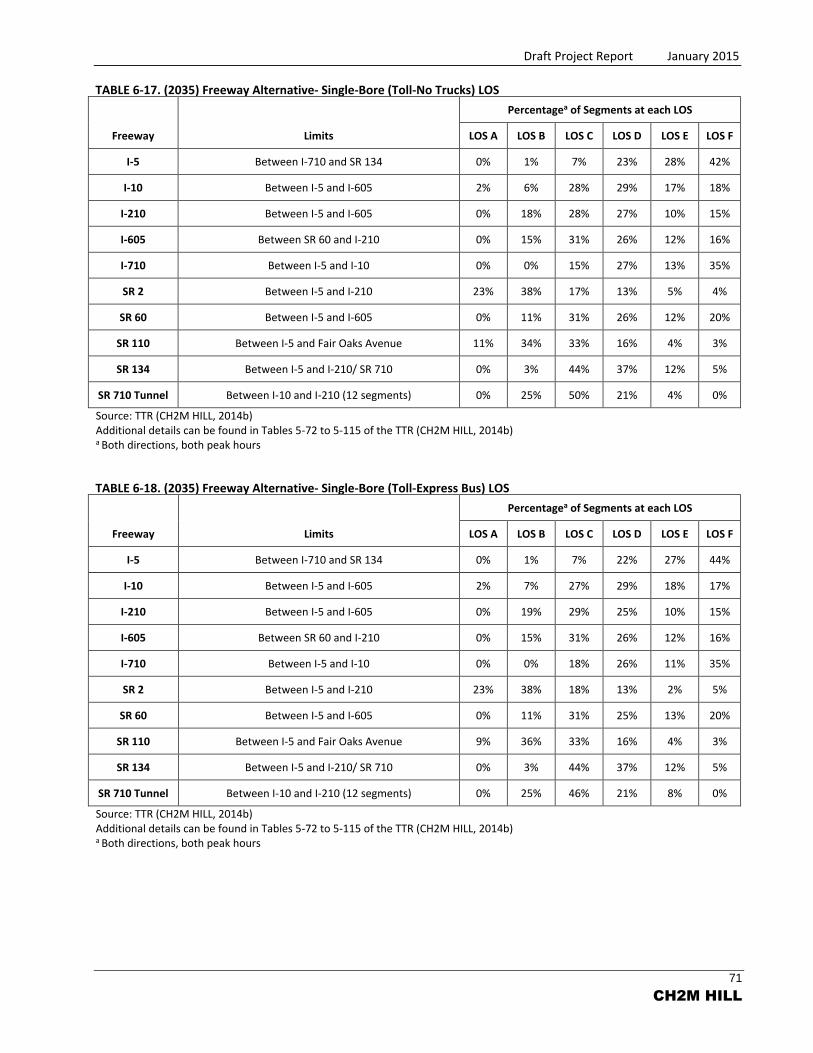
Draft Project Report January 2015
71
CH2M HILL
TABLE 6-17. (2035) Freeway Alternative- Single-Bore (Toll-No Trucks) LOS
Freeway Limits
Percentagea of Segments at each LOS
LOS A LOS B LOS C LOS D LOS E LOS F
I-5 Between I-710 and SR 134 0% 1% 7% 23% 28% 42%
I-10 Between I-5 and I-605 2% 6% 28% 29% 17% 18%
I-210 Between I-5 and I-605 0% 18% 28% 27% 10% 15%
I-605 Between SR 60 and I-210 0% 15% 31% 26% 12% 16%
I-710 Between I-5 and I-10 0% 0% 15% 27% 13% 35%
SR 2 Between I-5 and I-210 23% 38% 17% 13% 5% 4%
SR 60 Between I-5 and I-605 0% 11% 31% 26% 12% 20%
SR 110 Between I-5 and Fair Oaks Avenue 11% 34% 33% 16% 4% 3%
SR 134 Between I-5 and I-210/ SR 710 0% 3% 44% 37% 12% 5%
SR 710 Tunnel Between I-10 and I-210 (12 segments) 0% 25% 50% 21% 4% 0%
Source: TTR (CH2M HILL, 2014b) Additional details can be found in Tables 5-72 to 5-115 of the TTR (CH2M HILL, 2014b) a Both directions, both peak hours TABLE 6-18. (2035) Freeway Alternative- Single-Bore (Toll-Express Bus) LOS
Freeway Limits
Percentagea of Segments at each LOS
LOS A LOS B LOS C LOS D LOS E LOS F
I-5 Between I-710 and SR 134 0% 1% 7% 22% 27% 44%
I-10 Between I-5 and I-605 2% 7% 27% 29% 18% 17%
I-210 Between I-5 and I-605 0% 19% 29% 25% 10% 15%
I-605 Between SR 60 and I-210 0% 15% 31% 26% 12% 16%
I-710 Between I-5 and I-10 0% 0% 18% 26% 11% 35%
SR 2 Between I-5 and I-210 23% 38% 18% 13% 2% 5%
SR 60 Between I-5 and I-605 0% 11% 31% 25% 13% 20%
SR 110 Between I-5 and Fair Oaks Avenue 9% 36% 33% 16% 4% 3%
SR 134 Between I-5 and I-210/ SR 710 0% 3% 44% 37% 12% 5%
SR 710 Tunnel Between I-10 and I-210 (12 segments) 0% 25% 46% 21% 8% 0%
Source: TTR (CH2M HILL, 2014b) Additional details can be found in Tables 5-72 to 5-115 of the TTR (CH2M HILL, 2014b) a Both directions, both peak hours
Draft Project Report January 2015
72
CH2M HILL
Adverse effects analysis was performed based on comparisons of all the build alternatives
compared to the No Build Alternative with an established set of criteria. Detailed summaries of
the adverse effects are summarized for each build alternative for freeways and intersections in the
TTR, Section 7 (CH2M HILL, 2014b).
In general, the build alternatives shift both arterial traffic and freeway traffic. The Freeway Tunnel
Alternative variations result in a marked shift in traffic from the arterial to the freeway. The biggest
increases are on I-210 and the system interchanges on either side of the tunnel alignment. The
TSM/TDM, BRT, and LRT Alternatives have a mixed effect; the increase in transit service results in
some reduction in arterial traffic, but the intersection improvements drive traffic back to the freeway.
On the freeways, there are some negative effects from the TSM/TDM, BRT, and LRT Alternatives due
to the TSM/TDM improvements changing interchange traffic patterns without adding freeway
capacity. While the freeway traffic volumes will increase with the Freeway Tunnel Alternative
variations, there is little net overall change in LOS. In other words, the alternatives can accommodate
the increased traffic (primarily on the connections to the SR 710 tunnel) while still providing surface
street benefits.
Potential improvement analysis for intersections and freeways was performed for the identified
adverse effects based on a wide range of considerations. Potential improvements were evaluated for
feasibility, and some were recommended for implementation. Detailed summaries of the potential
improvements are summarized for each build alternative in the TTR, Section 7 (CH2M HILL, 2014b).
K. Design Exceptions
Due to existing design constraints and limitations along the proposed build alternatives, such as
surrounding land use and limited ROW, the following design exceptions have been proposed.
Approval for exceptions of proposed nonstandard features will require approval for the preferred
alternative once selected. Based on the Caltrans Highway Design Manual (HDM) Table 82.1A
Mandatory Standards, and Table 82.1B Advisory Standards (Caltrans, 2012), the required design
exceptions for the portions of the build alternatives within the state ROW are provided in Tables 6-19
through 6-28.
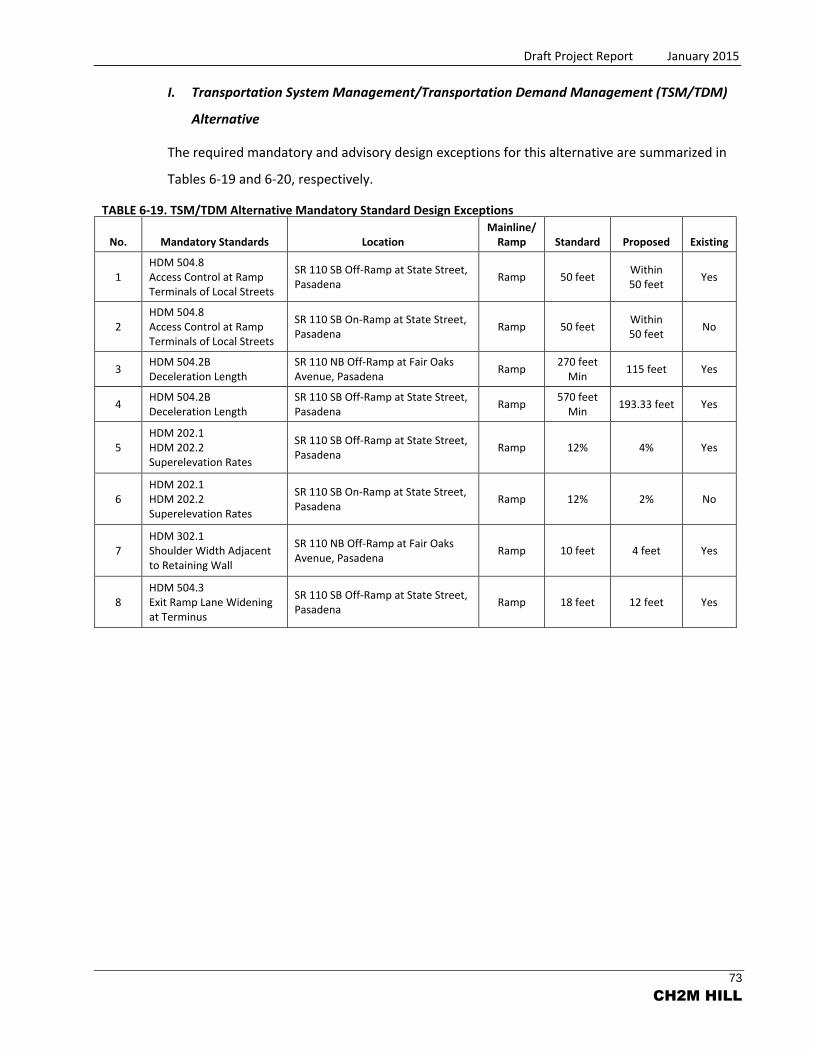
Draft Project Report January 2015
73
CH2M HILL
I. Transportation System Management/Transportation Demand Management (TSM/TDM)
Alternative
The required mandatory and advisory design exceptions for this alternative are summarized in
Tables 6-19 and 6-20, respectively.
TABLE 6-19. TSM/TDM Alternative Mandatory Standard Design Exceptions
No. Mandatory Standards Location Mainline/
Ramp Standard Proposed Existing
1 HDM 504.8 Access Control at Ramp Terminals of Local Streets
SR 110 SB Off-Ramp at State Street, Pasadena
Ramp 50 feet Within 50 feet
Yes
2 HDM 504.8 Access Control at Ramp Terminals of Local Streets
SR 110 SB On-Ramp at State Street, Pasadena
Ramp 50 feet Within 50 feet
No
3 HDM 504.2B Deceleration Length
SR 110 NB Off-Ramp at Fair Oaks Avenue, Pasadena
Ramp 270 feet
Min 115 feet Yes
4 HDM 504.2B Deceleration Length
SR 110 SB Off-Ramp at State Street, Pasadena
Ramp 570 feet
Min 193.33 feet Yes
5 HDM 202.1 HDM 202.2 Superelevation Rates
SR 110 SB Off-Ramp at State Street, Pasadena
Ramp 12% 4% Yes
6 HDM 202.1 HDM 202.2 Superelevation Rates
SR 110 SB On-Ramp at State Street, Pasadena
Ramp 12% 2% No
7 HDM 302.1 Shoulder Width Adjacent to Retaining Wall
SR 110 NB Off-Ramp at Fair Oaks Avenue, Pasadena
Ramp 10 feet 4 feet Yes
8 HDM 504.3 Exit Ramp Lane Widening at Terminus
SR 110 SB Off-Ramp at State Street, Pasadena
Ramp 18 feet 12 feet Yes
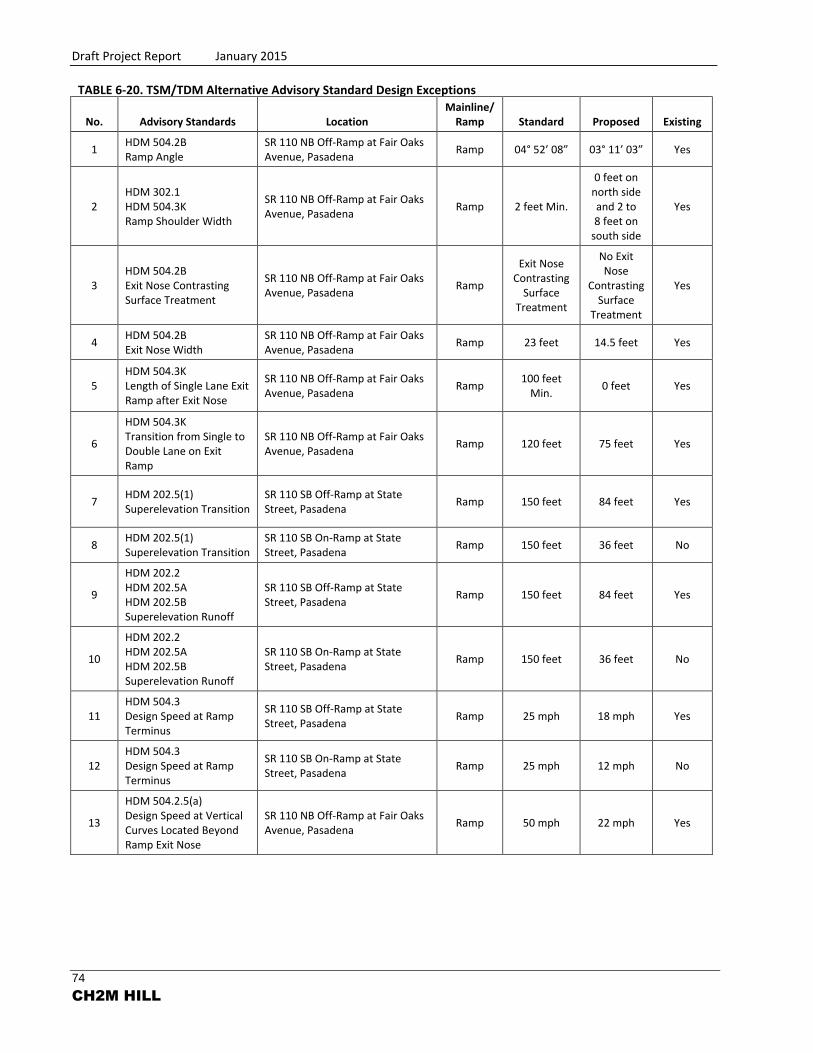
Draft Project Report January 2015
74
CH2M HILL
TABLE 6-20. TSM/TDM Alternative Advisory Standard Design Exceptions
No. Advisory Standards Location Mainline/
Ramp Standard Proposed Existing
1 HDM 504.2B Ramp Angle
SR 110 NB Off-Ramp at Fair Oaks Avenue, Pasadena
Ramp 04° 52’ 08” 03° 11’ 03” Yes
2 HDM 302.1 HDM 504.3K Ramp Shoulder Width
SR 110 NB Off-Ramp at Fair Oaks Avenue, Pasadena
Ramp 2 feet Min.
0 feet on north side and 2 to 8 feet on
south side
Yes
3 HDM 504.2B Exit Nose Contrasting Surface Treatment
SR 110 NB Off-Ramp at Fair Oaks Avenue, Pasadena
Ramp
Exit Nose Contrasting
Surface Treatment
No Exit Nose
Contrasting Surface
Treatment
Yes
4 HDM 504.2B Exit Nose Width
SR 110 NB Off-Ramp at Fair Oaks Avenue, Pasadena
Ramp 23 feet 14.5 feet Yes
5 HDM 504.3K Length of Single Lane Exit Ramp after Exit Nose
SR 110 NB Off-Ramp at Fair Oaks Avenue, Pasadena
Ramp 100 feet
Min. 0 feet Yes
6
HDM 504.3K Transition from Single to Double Lane on Exit Ramp
SR 110 NB Off-Ramp at Fair Oaks Avenue, Pasadena
Ramp 120 feet 75 feet Yes
7 HDM 202.5(1) Superelevation Transition
SR 110 SB Off-Ramp at State Street, Pasadena
Ramp 150 feet 84 feet Yes
8 HDM 202.5(1) Superelevation Transition
SR 110 SB On-Ramp at State Street, Pasadena
Ramp 150 feet 36 feet No
9
HDM 202.2 HDM 202.5A HDM 202.5B Superelevation Runoff
SR 110 SB Off-Ramp at State Street, Pasadena
Ramp 150 feet 84 feet Yes
10
HDM 202.2 HDM 202.5A HDM 202.5B Superelevation Runoff
SR 110 SB On-Ramp at State Street, Pasadena
Ramp 150 feet 36 feet No
11 HDM 504.3 Design Speed at Ramp Terminus
SR 110 SB Off-Ramp at State Street, Pasadena
Ramp 25 mph 18 mph Yes
12 HDM 504.3 Design Speed at Ramp Terminus
SR 110 SB On-Ramp at State Street, Pasadena
Ramp 25 mph 12 mph No
13
HDM 504.2.5(a) Design Speed at Vertical Curves Located Beyond Ramp Exit Nose
SR 110 NB Off-Ramp at Fair Oaks Avenue, Pasadena
Ramp 50 mph 22 mph Yes

Draft Project Report January 2015
75
CH2M HILL
II. Bus Rapid Transit (BRT) Alternative
The required mandatory and advisory design exceptions for this alternative are summarized in
Tables 6-21 and 6-22, respectively.
TABLE 6-21. BRT Alternative Mandatory Standard Design Exceptions
No. Mandatory Standards Location Mainline/
Ramp Standard Proposed Existing
1 HDM 202.2 Superelevation Rates
SR 60 EB-Loop On-Ramp at Atlantic Boulevard, Monterey Park, 185-foot Radius Curve
Ramp 12% 4% Yes
2 HDM 202.2 Superelevation Rates
SR 60 EB-Loop On-Ramp at Atlantic Boulevard, Monterey Park, 180-foot Radius Curve
Ramp 12% 4% Yes
3 HDM 202.2 Superelevation Rates
SR 60 WB-Loop On-Ramp at Atlantic Boulevard, Monterey Park, 170-foot Radius Curve
Ramp 12% 6% No
4 HDM 202.2 Superelevation Rates
SR 60 EB-Loop On-Ramp at Atlantic Boulevard, Monterey Park, 160-foot Radius Curve
Ramp 12% 6% No
5 HDM 203.2 Curve Radius
SR 60 EB-Loop On-Ramp at Atlantic Boulevard, Monterey Park, 250-foot Radius Curve
Ramp 215 feet 180 feet No
6 HDM 203.2 Curve Radius
SR 60 EB-Loop On-Ramp at Atlantic Boulevard, Monterey Park, 185-foot Radius Curve
Ramp 215 feet 185 feet Yes
7 HDM 203.2 Curve Radius
SR 60 WB-Loop On-Ramp at Atlantic Boulevard, Monterey Park, 225-foot Radius Curve
Ramp 215 feet 160 feet No
8 HDM 203.2 Curve Radius
SR 60 WB-Loop On-Ramp at Atlantic Boulevard, Monterey Park, 170-foot Radius Curve
Ramp 215 feet 170 feet Yes
9 HDM 504.3 Lane Widths
SR 60 EB-Loop On-Ramp at Atlantic Boulevard, Monterey Park, 185-foot Radius Curve
Ramp 15 feet 13 - 15 feet No
10 HDM 504.3 Lane Widths
SR 60 WB-Loop On-Ramp at Atlantic Boulevard, Monterey Park, 170-foot Radius Curve
Ramp 16 feet 13 feet Yes
TABLE 6-22. BRT Alternative Advisory Standard Design Exceptions
No. Advisory Standards Location Mainline/
Ramp Standard Proposed Existing
1 HDM 202.5 (1) (2) Superelevation Transition
SR 60 WB-Loop On-Ramp at Atlantic Boulevard, Monterey Park
Ramp 1/3 of
transition in curve
All in curve Yes
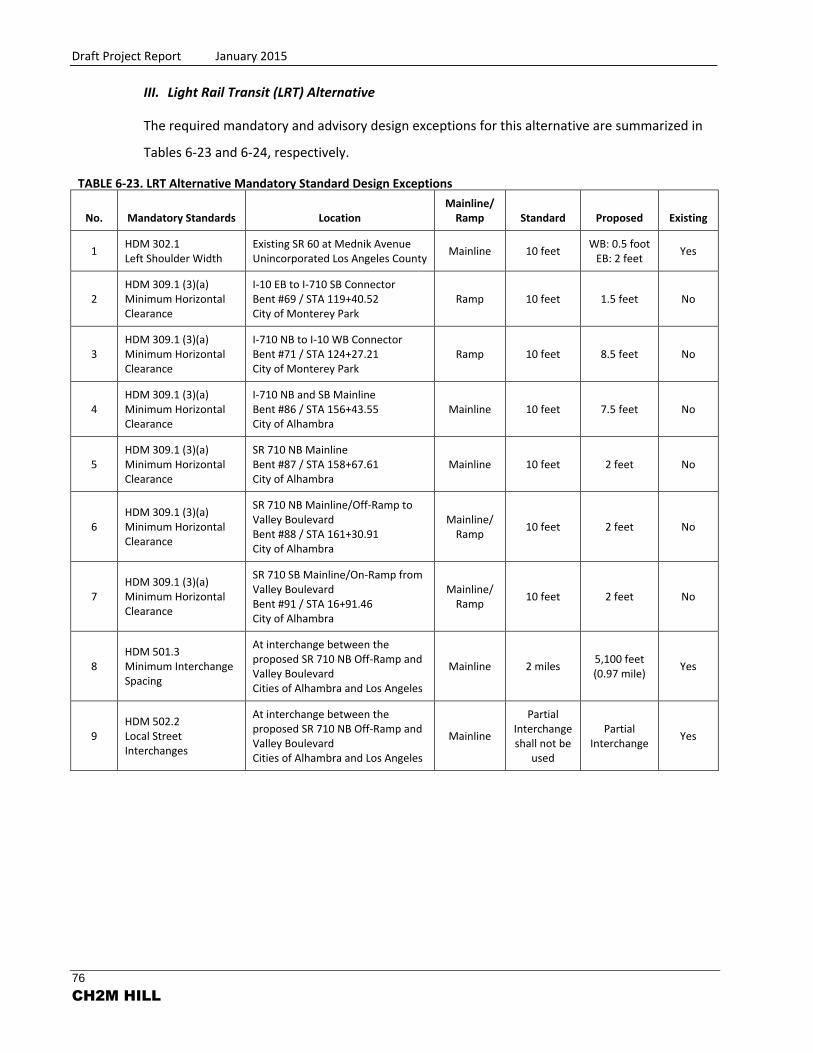
Draft Project Report January 2015
76
CH2M HILL
III. Light Rail Transit (LRT) Alternative
The required mandatory and advisory design exceptions for this alternative are summarized in
Tables 6-23 and 6-24, respectively.
TABLE 6-23. LRT Alternative Mandatory Standard Design Exceptions
No. Mandatory Standards Location Mainline/
Ramp Standard Proposed Existing
1 HDM 302.1 Left Shoulder Width
Existing SR 60 at Mednik Avenue Unincorporated Los Angeles County
Mainline 10 feet WB: 0.5 foot
EB: 2 feet Yes
2 HDM 309.1 (3)(a) Minimum Horizontal Clearance
I-10 EB to I-710 SB Connector Bent #69 / STA 119+40.52 City of Monterey Park
Ramp 10 feet 1.5 feet No
3 HDM 309.1 (3)(a) Minimum Horizontal Clearance
I-710 NB to I-10 WB Connector Bent #71 / STA 124+27.21 City of Monterey Park
Ramp 10 feet 8.5 feet No
4 HDM 309.1 (3)(a) Minimum Horizontal Clearance
I-710 NB and SB Mainline Bent #86 / STA 156+43.55 City of Alhambra
Mainline 10 feet 7.5 feet No
5 HDM 309.1 (3)(a) Minimum Horizontal Clearance
SR 710 NB Mainline Bent #87 / STA 158+67.61 City of Alhambra
Mainline 10 feet 2 feet No
6 HDM 309.1 (3)(a) Minimum Horizontal Clearance
SR 710 NB Mainline/Off-Ramp to Valley Boulevard Bent #88 / STA 161+30.91 City of Alhambra
Mainline/ Ramp
10 feet 2 feet No
7 HDM 309.1 (3)(a) Minimum Horizontal Clearance
SR 710 SB Mainline/On-Ramp from Valley Boulevard Bent #91 / STA 16+91.46 City of Alhambra
Mainline/ Ramp
10 feet 2 feet No
8 HDM 501.3 Minimum Interchange Spacing
At interchange between the proposed SR 710 NB Off-Ramp and Valley Boulevard Cities of Alhambra and Los Angeles
Mainline 2 miles 5,100 feet (0.97 mile)
Yes
9 HDM 502.2 Local Street Interchanges
At interchange between the proposed SR 710 NB Off-Ramp and Valley Boulevard Cities of Alhambra and Los Angeles
Mainline
Partial Interchange shall not be
used
Partial Interchange
Yes
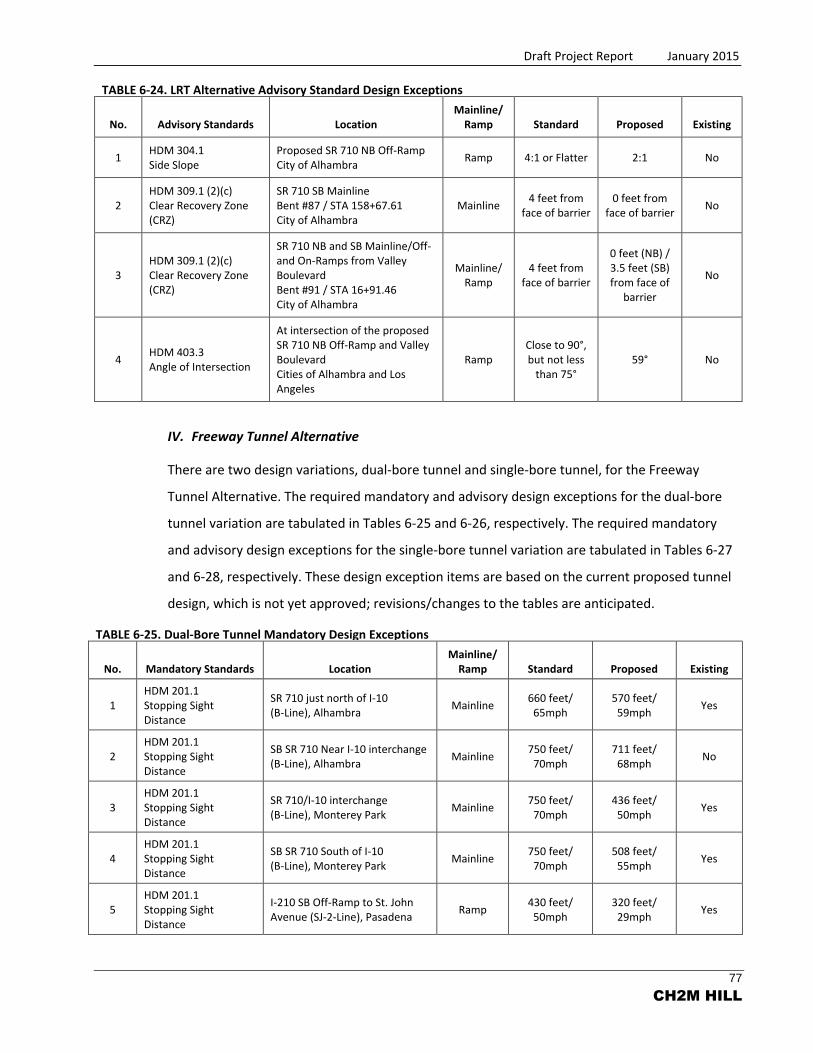
Draft Project Report January 2015
77
CH2M HILL
TABLE 6-24. LRT Alternative Advisory Standard Design Exceptions
No. Advisory Standards Location Mainline/
Ramp Standard Proposed Existing
1 HDM 304.1 Side Slope
Proposed SR 710 NB Off-Ramp City of Alhambra
Ramp 4:1 or Flatter 2:1 No
2 HDM 309.1 (2)(c) Clear Recovery Zone (CRZ)
SR 710 SB Mainline Bent #87 / STA 158+67.61 City of Alhambra
Mainline 4 feet from
face of barrier 0 feet from
face of barrier No
3 HDM 309.1 (2)(c) Clear Recovery Zone (CRZ)
SR 710 NB and SB Mainline/Off- and On-Ramps from Valley Boulevard Bent #91 / STA 16+91.46 City of Alhambra
Mainline/ Ramp
4 feet from face of barrier
0 feet (NB) / 3.5 feet (SB) from face of
barrier
No
4 HDM 403.3 Angle of Intersection
At intersection of the proposed SR 710 NB Off-Ramp and Valley Boulevard Cities of Alhambra and Los Angeles
Ramp Close to 90°, but not less
than 75° 59° No
IV. Freeway Tunnel Alternative
There are two design variations, dual-bore tunnel and single-bore tunnel, for the Freeway
Tunnel Alternative. The required mandatory and advisory design exceptions for the dual-bore
tunnel variation are tabulated in Tables 6-25 and 6-26, respectively. The required mandatory
and advisory design exceptions for the single-bore tunnel variation are tabulated in Tables 6-27
and 6-28, respectively. These design exception items are based on the current proposed tunnel
design, which is not yet approved; revisions/changes to the tables are anticipated.
TABLE 6-25. Dual-Bore Tunnel Mandatory Design Exceptions
No. Mandatory Standards Location Mainline/
Ramp Standard Proposed Existing
1 HDM 201.1 Stopping Sight Distance
SR 710 just north of I-10 (B-Line), Alhambra
Mainline 660 feet/
65mph 570 feet/
59mph Yes
2 HDM 201.1 Stopping Sight Distance
SB SR 710 Near I-10 interchange (B-Line), Alhambra
Mainline 750 feet/
70mph 711 feet/
68mph No
3 HDM 201.1 Stopping Sight Distance
SR 710/I-10 interchange (B-Line), Monterey Park
Mainline 750 feet/
70mph 436 feet/
50mph Yes
4 HDM 201.1 Stopping Sight Distance
SB SR 710 South of I-10 (B-Line), Monterey Park
Mainline 750 feet/
70mph 508 feet/
55mph Yes
5 HDM 201.1 Stopping Sight Distance
I-210 SB Off-Ramp to St. John Avenue (SJ-2-Line), Pasadena
Ramp 430 feet/
50mph 320 feet/
29mph Yes
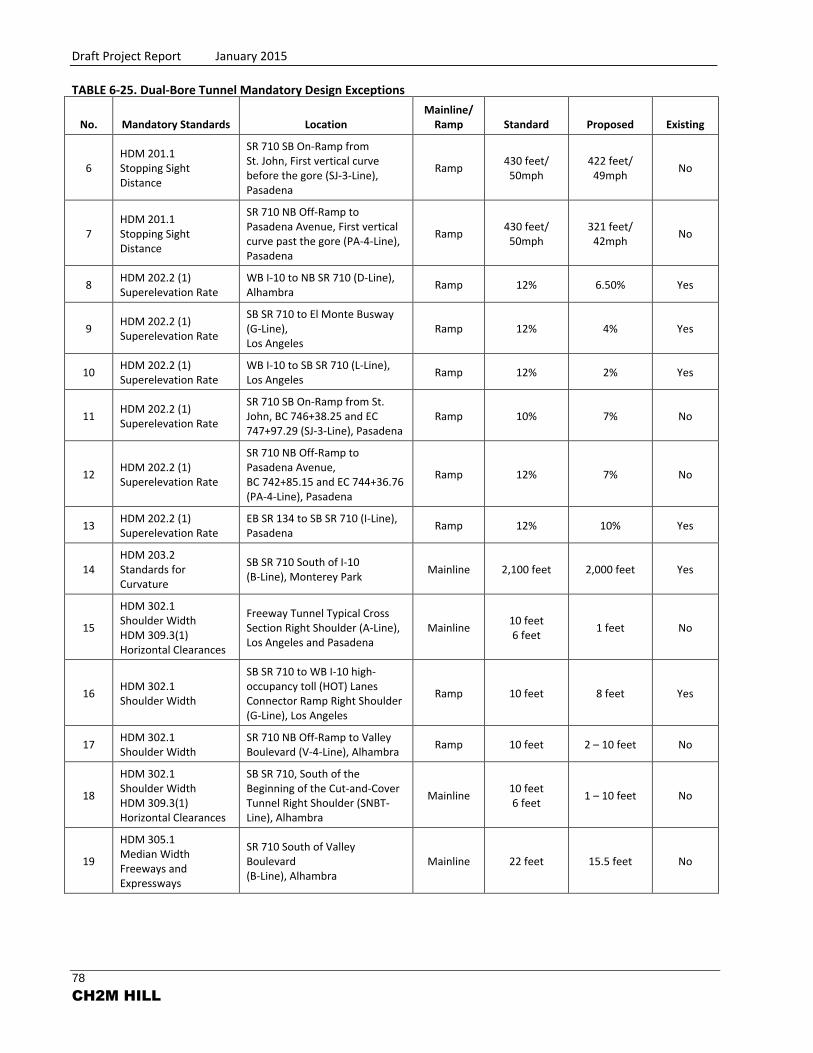
Draft Project Report January 2015
78
CH2M HILL
TABLE 6-25. Dual-Bore Tunnel Mandatory Design Exceptions
No. Mandatory Standards Location Mainline/
Ramp Standard Proposed Existing
6 HDM 201.1 Stopping Sight Distance
SR 710 SB On-Ramp from St. John, First vertical curve before the gore (SJ-3-Line), Pasadena
Ramp 430 feet/
50mph 422 feet/
49mph No
7 HDM 201.1 Stopping Sight Distance
SR 710 NB Off-Ramp to Pasadena Avenue, First vertical curve past the gore (PA-4-Line), Pasadena
Ramp 430 feet/
50mph 321 feet/
42mph No
8 HDM 202.2 (1) Superelevation Rate
WB I-10 to NB SR 710 (D-Line), Alhambra
Ramp 12% 6.50% Yes
9 HDM 202.2 (1) Superelevation Rate
SB SR 710 to El Monte Busway (G-Line), Los Angeles
Ramp 12% 4% Yes
10 HDM 202.2 (1) Superelevation Rate
WB I-10 to SB SR 710 (L-Line), Los Angeles
Ramp 12% 2% Yes
11 HDM 202.2 (1) Superelevation Rate
SR 710 SB On-Ramp from St. John, BC 746+38.25 and EC 747+97.29 (SJ-3-Line), Pasadena
Ramp 10% 7% No
12 HDM 202.2 (1) Superelevation Rate
SR 710 NB Off-Ramp to Pasadena Avenue, BC 742+85.15 and EC 744+36.76 (PA-4-Line), Pasadena
Ramp 12% 7% No
13 HDM 202.2 (1) Superelevation Rate
EB SR 134 to SB SR 710 (I-Line), Pasadena
Ramp 12% 10% Yes
14 HDM 203.2 Standards for Curvature
SB SR 710 South of I-10 (B-Line), Monterey Park
Mainline 2,100 feet 2,000 feet Yes
15
HDM 302.1 Shoulder Width HDM 309.3(1) Horizontal Clearances
Freeway Tunnel Typical Cross Section Right Shoulder (A-Line), Los Angeles and Pasadena
Mainline 10 feet 6 feet
1 feet No
16 HDM 302.1 Shoulder Width
SB SR 710 to WB I-10 high-occupancy toll (HOT) Lanes Connector Ramp Right Shoulder (G-Line), Los Angeles
Ramp 10 feet 8 feet Yes
17 HDM 302.1 Shoulder Width
SR 710 NB Off-Ramp to Valley Boulevard (V-4-Line), Alhambra
Ramp 10 feet 2 – 10 feet No
18
HDM 302.1 Shoulder Width HDM 309.3(1) Horizontal Clearances
SB SR 710, South of the Beginning of the Cut-and-Cover Tunnel Right Shoulder (SNBT-Line), Alhambra
Mainline 10 feet 6 feet
1 – 10 feet No
19
HDM 305.1 Median Width Freeways and Expressways
SR 710 South of Valley Boulevard (B-Line), Alhambra
Mainline 22 feet 15.5 feet No

Draft Project Report January 2015
79
CH2M HILL
TABLE 6-25. Dual-Bore Tunnel Mandatory Design Exceptions
No. Mandatory Standards Location Mainline/
Ramp Standard Proposed Existing
20 HDM 309.2 (1).(a) Vertical Clearances Major Structures
SR 710 (A-Line) Tunnels Mainline 16.5 feet 15.5 feet No
21 HDM 501.3 Interchange Spacing
SR 710 between Valley Boulevard and I-10, Alhambra
Mainline 2 miles
(10,560 feet) 1 mile
(5,280 feet) Yes
22
HDM 502.2 Isolated Off-Ramps and Partial Interchanges
SR 710 Valley Boulevard Interchange, Los Angeles
Mainline Full Diamond Half Diamond Yes
23
HDM 504.3 Distance Between Ramp Intersection and Local Road Intersection
SR 710 NB Off-Ramp at Valley Boulevard and Westmont Drive (V-4-Line), Alhambra and Los Angeles
Local Street 400 feet 130 feet Yes
24
HDM 504.3 Distance Between Ramp Intersection and Local Road Intersection
SR 710 SB On-Ramp at Valley Boulevard and Highbury Avenue (V-3-Line), Los Angeles and Alhambra
Local Street 400 feet 160 feet Yes
25 HDM 504.7 Weaving Sections
WB I-10 ramp and NB Valley Boulevard Exit (SNBT-Line), Alhambra
Mainline 5,000 feet 1,575 feet No
26 HDM 504.7 Weaving Sections
SR 710 SB On-Ramp at Valley Boulevard and EB I-10 ramp (SSBT-Line), Alhambra
Mainline 5,000 feet 1,290 feet No
27 HDM 504.7 Weaving Sections
SR 710 SB On-Ramp at Valley Boulevard and WB I-10 ramp (SSBT-Line), Alhambra
Mainline 5,000 feet 2,250 feet No
28 HDM 504.7 Weaving Sections
EB BUSWAY ramp and NB Top Level Tunnel (B-Line), Alhambra
Mainline 5,000 feet 1,400 feet No
29 HDM 504.7 Weaving Sections
EB I-10 ramp and NB Top Level Tunnel (B-Line), Monterey Park & Alhambra
Mainline 5,000 feet 2,215 feet No
BC – begin horizontal curve EC – end horizontal curve
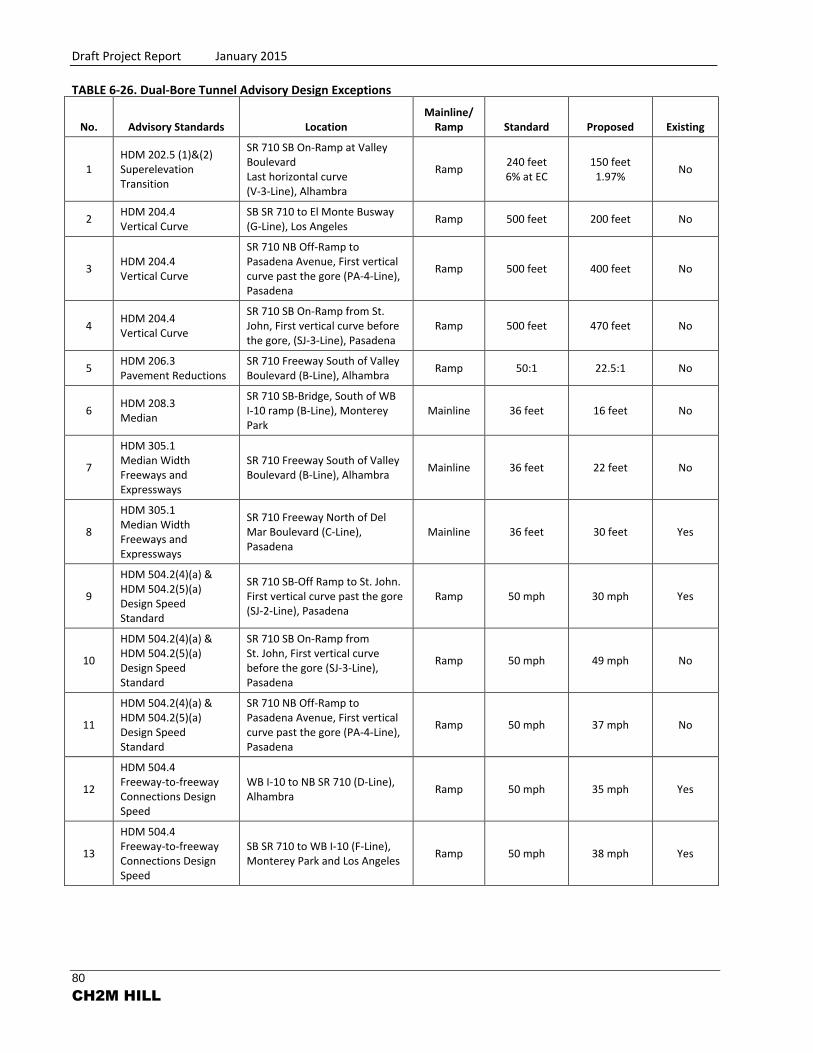
Draft Project Report January 2015
80
CH2M HILL
TABLE 6-26. Dual-Bore Tunnel Advisory Design Exceptions
No. Advisory Standards Location Mainline/
Ramp Standard Proposed Existing
1 HDM 202.5 (1)&(2) Superelevation Transition
SR 710 SB On-Ramp at Valley Boulevard Last horizontal curve (V-3-Line), Alhambra
Ramp 240 feet 6% at EC
150 feet 1.97%
No
2 HDM 204.4 Vertical Curve
SB SR 710 to El Monte Busway (G-Line), Los Angeles
Ramp 500 feet 200 feet No
3 HDM 204.4 Vertical Curve
SR 710 NB Off-Ramp to Pasadena Avenue, First vertical curve past the gore (PA-4-Line), Pasadena
Ramp 500 feet 400 feet No
4 HDM 204.4 Vertical Curve
SR 710 SB On-Ramp from St. John, First vertical curve before the gore, (SJ-3-Line), Pasadena
Ramp 500 feet 470 feet No
5 HDM 206.3 Pavement Reductions
SR 710 Freeway South of Valley Boulevard (B-Line), Alhambra
Ramp 50:1 22.5:1 No
6 HDM 208.3 Median
SR 710 SB-Bridge, South of WB I-10 ramp (B-Line), Monterey Park
Mainline 36 feet 16 feet No
7
HDM 305.1 Median Width Freeways and Expressways
SR 710 Freeway South of Valley Boulevard (B-Line), Alhambra
Mainline 36 feet 22 feet No
8
HDM 305.1 Median Width Freeways and Expressways
SR 710 Freeway North of Del Mar Boulevard (C-Line), Pasadena
Mainline 36 feet 30 feet Yes
9
HDM 504.2(4)(a) & HDM 504.2(5)(a) Design Speed Standard
SR 710 SB-Off Ramp to St. John. First vertical curve past the gore (SJ-2-Line), Pasadena
Ramp 50 mph 30 mph Yes
10
HDM 504.2(4)(a) & HDM 504.2(5)(a) Design Speed Standard
SR 710 SB On-Ramp from St. John, First vertical curve before the gore (SJ-3-Line), Pasadena
Ramp 50 mph 49 mph No
11
HDM 504.2(4)(a) & HDM 504.2(5)(a) Design Speed Standard
SR 710 NB Off-Ramp to Pasadena Avenue, First vertical curve past the gore (PA-4-Line), Pasadena
Ramp 50 mph 37 mph No
12
HDM 504.4 Freeway-to-freeway Connections Design Speed
WB I-10 to NB SR 710 (D-Line), Alhambra
Ramp 50 mph 35 mph Yes
13
HDM 504.4 Freeway-to-freeway Connections Design Speed
SB SR 710 to WB I-10 (F-Line), Monterey Park and Los Angeles
Ramp 50 mph 38 mph Yes
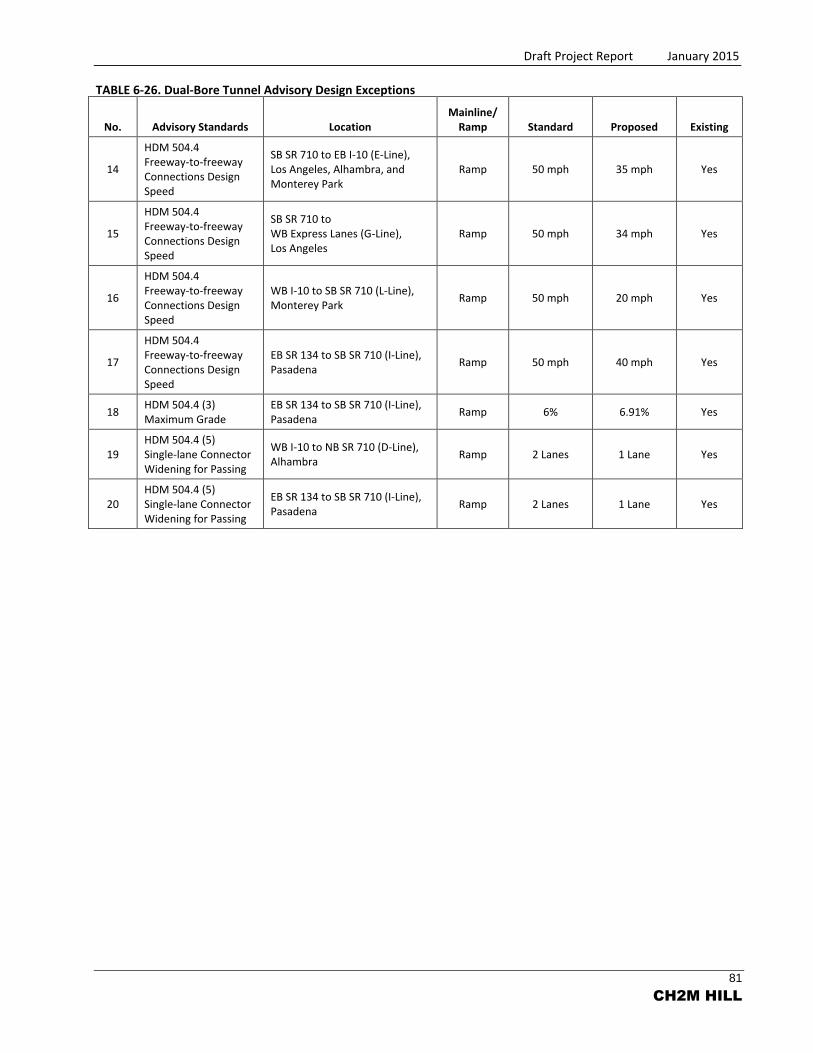
Draft Project Report January 2015
81
CH2M HILL
TABLE 6-26. Dual-Bore Tunnel Advisory Design Exceptions
No. Advisory Standards Location Mainline/
Ramp Standard Proposed Existing
14
HDM 504.4 Freeway-to-freeway Connections Design Speed
SB SR 710 to EB I-10 (E-Line), Los Angeles, Alhambra, and Monterey Park
Ramp 50 mph 35 mph Yes
15
HDM 504.4 Freeway-to-freeway Connections Design Speed
SB SR 710 to WB Express Lanes (G-Line), Los Angeles
Ramp 50 mph 34 mph Yes
16
HDM 504.4 Freeway-to-freeway Connections Design Speed
WB I-10 to SB SR 710 (L-Line), Monterey Park
Ramp 50 mph 20 mph Yes
17
HDM 504.4 Freeway-to-freeway Connections Design Speed
EB SR 134 to SB SR 710 (I-Line), Pasadena
Ramp 50 mph 40 mph Yes
18 HDM 504.4 (3) Maximum Grade
EB SR 134 to SB SR 710 (I-Line), Pasadena
Ramp 6% 6.91% Yes
19 HDM 504.4 (5) Single-lane Connector Widening for Passing
WB I-10 to NB SR 710 (D-Line), Alhambra
Ramp 2 Lanes 1 Lane Yes
20 HDM 504.4 (5) Single-lane Connector Widening for Passing
EB SR 134 to SB SR 710 (I-Line), Pasadena
Ramp 2 Lanes 1 Lane Yes

Draft Project Report January 2015
82
CH2M HILL
TABLE 6-27. Single-Bore Tunnel Mandatory Design Exceptions
No. Mandatory Standards Location Mainline/
Ramp Standard Proposed Existing
1 HDM 201.1 Stopping Sight Distance
EB SR 134 to SB SR 710 (I-line), Pasadena
Ramp 430 feet/ 50 mph
330 feet/ 42.5mph
No
2 HDM 201.1 Stopping Sight Distance
SR 710 NB Off-Ramp to Pasadena Avenue, First vertical curve past the gore (PA-4-Line), Pasadena
Ramp 430 feet/ 50 mph
321 feet/ 42mph
No
3 HDM 202.2 (1) Superelevation Rate
WB I-10 to NB SR 710 (D-Line), Alhambra
Ramp 12% 6.5% Yes
4 HDM 202.2 (1) Superelevation Rate
SB SR 710 to El Monte Busway (E line) and EB I-10, Los Angeles
Ramp 7% 3% Yes
5 HDM 202.2 (1) Superelevation Rate
SR 710 NB Off-Ramp to Pasadena Avenue, BC 742+85.15 and EC 744+36.76 (PA-4-Line), Pasadena
Ramp 12% 7% No
6 HDM 202.2 (1) Superelevation Rate
EB SR 134 to SB SR 710 (I-Line), Pasadena
Ramp 12% 10% Yes
7
HDM 302.1 Shoulder Width HDM 309.3(1) Horizontal Clearances
Freeway Tunnel Typical Cross Section NB Right Shoulder (A-Line), Los Angeles and Pasadena
Mainline 10 feet 6 feet
1 foot No
8
HDM 302.1 Shoulder Width HDM 309.3(1) Horizontal Clearances
Freeway Tunnel Typical Cross Section SB Left Shoulder (A-Line), Los Angeles and Pasadena
Mainline 5 feet
4.5 feet 1 foot No
9 HDM 302.1 Shoulder Width
SR 710 NB Off-Ramp to Valley Boulevard (V-4-Line), Alhambra
Ramp 10 feet 2 - 10 feet No
10 HDM 302.1 Shoulder Width
SR 710 SB On-Ramp from Valley Boulevard (V-3-Line), Alhambra
Ramp 10 feet 8 feet No
11
HDM 302.1 Shoulder Width HDM 309.3(1) Horizontal Clearances
SB SR 710, South of the Beginning of the Cut-and-Cover Tunnel Right Shoulder (SNBT-Line), Alhambra
Mainline 10 feet 6 feet
1 - 10 feet No
12
HDM 305.1 Median Width Freeways and Expressways
SR 710 Freeway North of Del Mar Boulevard and South of Colorado Boulevard (C-Line), Pasadena
Mainline 22 feet 16 feet No
13
HDM 309.2 (1).(a) Vertical Clearances
Major Structures
SR 710 (A-Line) Tunnel Mainline 16.5 feet 15.5 feet No
14 HDM 501.3 Interchange Spacing
Valley Boulevard and I-10 Alhambra
Mainline 2 miles
(10,560 feet) 1 mile
(5,280 feet) Yes
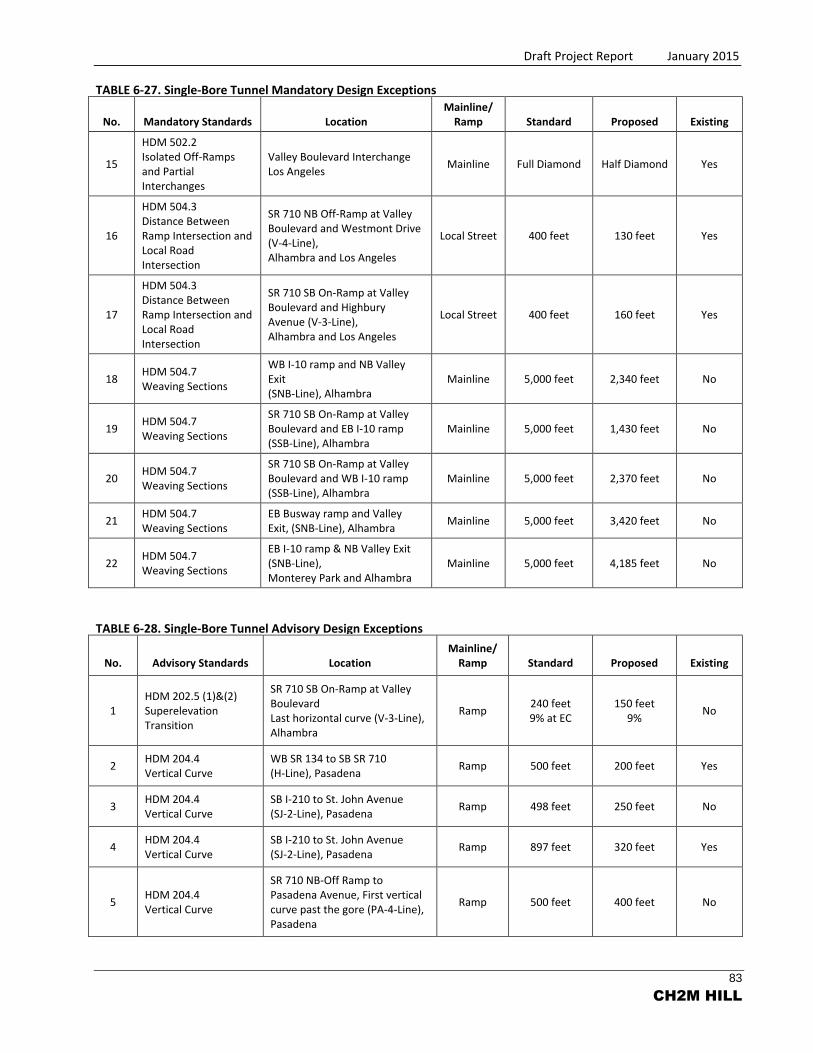
Draft Project Report January 2015
83
CH2M HILL
TABLE 6-27. Single-Bore Tunnel Mandatory Design Exceptions
No. Mandatory Standards Location Mainline/
Ramp Standard Proposed Existing
15
HDM 502.2 Isolated Off-Ramps and Partial Interchanges
Valley Boulevard Interchange Los Angeles
Mainline Full Diamond Half Diamond Yes
16
HDM 504.3 Distance Between Ramp Intersection and Local Road Intersection
SR 710 NB Off-Ramp at Valley Boulevard and Westmont Drive (V-4-Line), Alhambra and Los Angeles
Local Street 400 feet 130 feet Yes
17
HDM 504.3 Distance Between Ramp Intersection and Local Road Intersection
SR 710 SB On-Ramp at Valley Boulevard and Highbury Avenue (V-3-Line), Alhambra and Los Angeles
Local Street 400 feet 160 feet Yes
18 HDM 504.7 Weaving Sections
WB I-10 ramp and NB Valley Exit (SNB-Line), Alhambra
Mainline 5,000 feet 2,340 feet No
19 HDM 504.7 Weaving Sections
SR 710 SB On-Ramp at Valley Boulevard and EB I-10 ramp (SSB-Line), Alhambra
Mainline 5,000 feet 1,430 feet No
20 HDM 504.7 Weaving Sections
SR 710 SB On-Ramp at Valley Boulevard and WB I-10 ramp (SSB-Line), Alhambra
Mainline 5,000 feet 2,370 feet No
21 HDM 504.7 Weaving Sections
EB Busway ramp and Valley Exit, (SNB-Line), Alhambra
Mainline 5,000 feet 3,420 feet No
22 HDM 504.7 Weaving Sections
EB I-10 ramp & NB Valley Exit (SNB-Line), Monterey Park and Alhambra
Mainline 5,000 feet 4,185 feet No
TABLE 6-28. Single-Bore Tunnel Advisory Design Exceptions
No. Advisory Standards Location Mainline/
Ramp Standard Proposed Existing
1 HDM 202.5 (1)&(2) Superelevation Transition
SR 710 SB On-Ramp at Valley Boulevard Last horizontal curve (V-3-Line), Alhambra
Ramp 240 feet 9% at EC
150 feet 9%
No
2 HDM 204.4 Vertical Curve
WB SR 134 to SB SR 710 (H-Line), Pasadena
Ramp 500 feet 200 feet Yes
3 HDM 204.4 Vertical Curve
SB I-210 to St. John Avenue (SJ-2-Line), Pasadena
Ramp 498 feet 250 feet No
4 HDM 204.4 Vertical Curve
SB I-210 to St. John Avenue (SJ-2-Line), Pasadena
Ramp 897 feet 320 feet Yes
5 HDM 204.4 Vertical Curve
SR 710 NB-Off Ramp to Pasadena Avenue, First vertical curve past the gore (PA-4-Line), Pasadena
Ramp 500 feet 400 feet No
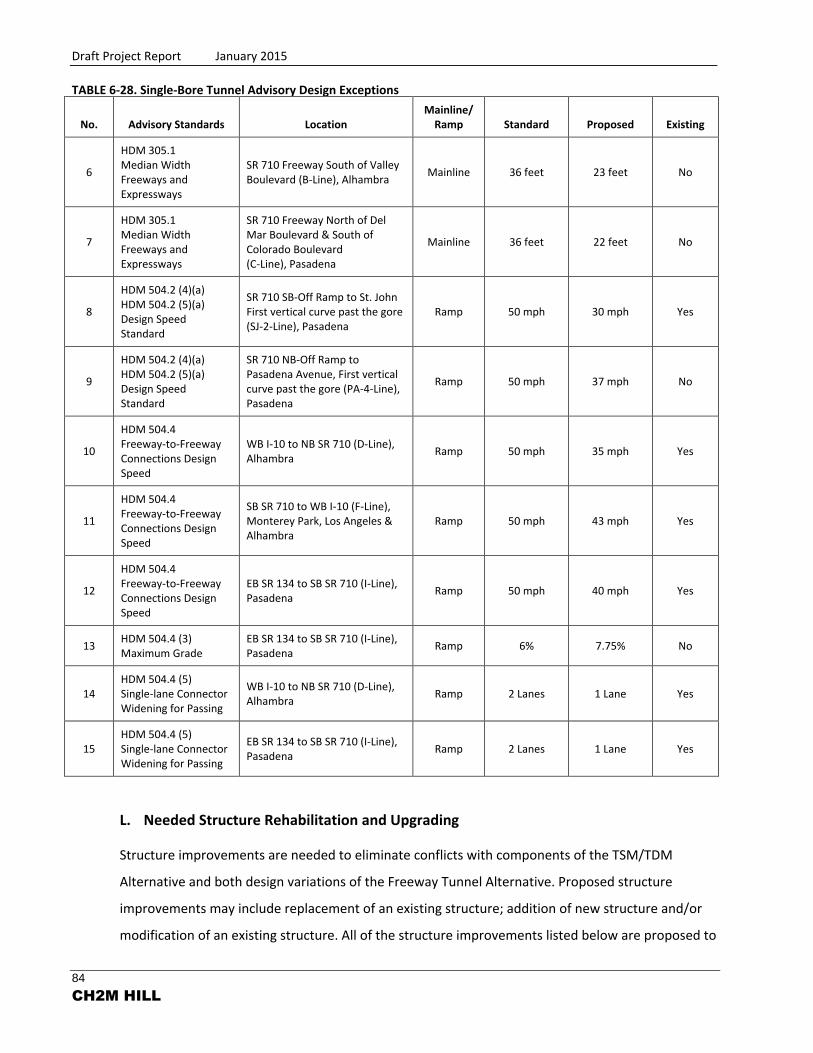
Draft Project Report January 2015
84
CH2M HILL
TABLE 6-28. Single-Bore Tunnel Advisory Design Exceptions
No. Advisory Standards Location Mainline/
Ramp Standard Proposed Existing
6
HDM 305.1 Median Width Freeways and Expressways
SR 710 Freeway South of Valley Boulevard (B-Line), Alhambra
Mainline 36 feet 23 feet No
7
HDM 305.1 Median Width Freeways and Expressways
SR 710 Freeway North of Del Mar Boulevard & South of Colorado Boulevard (C-Line), Pasadena
Mainline 36 feet 22 feet No
8
HDM 504.2 (4)(a) HDM 504.2 (5)(a) Design Speed Standard
SR 710 SB-Off Ramp to St. John First vertical curve past the gore (SJ-2-Line), Pasadena
Ramp 50 mph 30 mph Yes
9
HDM 504.2 (4)(a) HDM 504.2 (5)(a) Design Speed Standard
SR 710 NB-Off Ramp to Pasadena Avenue, First vertical curve past the gore (PA-4-Line), Pasadena
Ramp 50 mph 37 mph No
10
HDM 504.4 Freeway-to-Freeway Connections Design Speed
WB I-10 to NB SR 710 (D-Line), Alhambra
Ramp 50 mph 35 mph Yes
11
HDM 504.4 Freeway-to-Freeway Connections Design Speed
SB SR 710 to WB I-10 (F-Line), Monterey Park, Los Angeles & Alhambra
Ramp 50 mph 43 mph Yes
12
HDM 504.4 Freeway-to-Freeway Connections Design Speed
EB SR 134 to SB SR 710 (I-Line), Pasadena
Ramp 50 mph 40 mph Yes
13 HDM 504.4 (3) Maximum Grade
EB SR 134 to SB SR 710 (I-Line), Pasadena
Ramp 6% 7.75% No
14 HDM 504.4 (5) Single-lane Connector Widening for Passing
WB I-10 to NB SR 710 (D-Line), Alhambra
Ramp 2 Lanes 1 Lane Yes
15 HDM 504.4 (5) Single-lane Connector Widening for Passing
EB SR 134 to SB SR 710 (I-Line), Pasadena
Ramp 2 Lanes 1 Lane Yes
L. Needed Structure Rehabilitation and Upgrading
Structure improvements are needed to eliminate conflicts with components of the TSM/TDM
Alternative and both design variations of the Freeway Tunnel Alternative. Proposed structure
improvements may include replacement of an existing structure; addition of new structure and/or
modification of an existing structure. All of the structure improvements listed below are proposed to

Draft Project Report January 2015
85
CH2M HILL
meet the objective of the alternatives. Advance Planning Study (APS) reports were prepared for the
proposed structures (CH2M HILL, 2014f, 2014g, and 2014h) and included the preliminary construction
cost estimates. The APS reports are included in Attachment K of this DPR.
I. Transportation System Management/Transportation Demand Management (TSM/TDM)
Alternative
There are two structures included in the TSM/TDM Alternative:
SR 710 Connector Underpass (Attachment K-1a):
The proposed structure is located along the SR 710 Connector between Valley Boulevard and
Mission Road. This underpass allows the traffic to travel under the railroad bridge. This railroad
bridge is included in improvement T-1 in TSM/TDM Alternative.
Garfield Avenue Bridge (Widen) (Attachment K-1b):
This existing bridge crosses over a train trench with two railroad tracks and is located adjacent to
the intersection of Garfield Avenue and Mission Road in the City of Alhambra. The TSM/TDM
proposed improvement I-16 would add a dedicated right-turn lane in the northbound direction;
this would require the widening of the existing Garfield Avenue Bridge.
II. Freeway Tunnel Alternative – Dual-Bore Tunnel
There are six structures and two cut-and-cover tunnels associated with the Freeway Tunnel
Alternative dual-bore design variation. These structures from south to north are as follows:
Ramona Boulevard Undercrossing (Widen) (Attachment K-2a):
The existing Ramona Boulevard Undercrossing consists of two separate structures for
northbound (Right Bridge) and southbound (Left Bridge) traffic. Only the Left Bridge is proposed
to be widened on both sides of the structure.
Route 710/10 Separation (Widen) (Attachment K-2b):
The existing Route 710/10 Separation, where Route 10 crosses under Route 710, consists of
two separate structures for northbound (Right Bridge) and southbound (Left Bridge) traffic.
The Left Bridge is proposed to be widened on both sides of the structure.

Draft Project Report January 2015
86
CH2M HILL
Laguna Basin Bridge (Attachment K-2c):
Laguna Basin is parallel to the SR 710 Freeway at this location. A 900-foot-long nine-span
structure is proposed alongside the Laguna Basin. This bridge will prevent the new alignment
from encroaching on the Laguna Flood Control Basin.
Hellman Avenue OC (Attachment K-2d):
A 240-foot-long two-span structure over the SR 710 Freeway at Hellman Avenue is proposed to
replace the existing Hellman Avenue OC. The width of the proposed structure will remain the
same as the existing bridge (64 feet).
Valley Boulevard OC (Attachment K-2e):
At this location, Valley Boulevard crosses over the proposed SR 710 Freeway cut-and-cover
tunnels. A 232-foot-long single-span structure is proposed. Soil will be added beneath this OC to
cover the tunnel to a level where the bridge structure will maintain its integrity and bridge
inspections can be performed.
Cut-and-Cover Tunnel (South Portal) (Attachment K-2f):
The South Portal Cut-and-Cover Tunnel begins from north of Hellman Avenue and ends north of
Valley Boulevard. The main purpose of this cut-and-cover tunnel is to serve as the transition of
the SR 710 Freeway between the at-grade surface level and the full-bore tunnel level.
Cut-and-Cover Tunnel (North Portal) (Attachment K-2g):
The North Portal Cut-and-Cover Tunnel begins north of California Boulevard and ends north of
Del Mar Boulevard. The main purpose of this cut-and-cover tunnel is to serve as the transition of
the SR 710 Freeway between the at-grade surface level and the full-bore tunnel level.
Green Street OC (Attachment K-2h):
A 400-foot-long four-span structure over the SR 710 Freeway at Green Street is proposed to
replace the existing 354-foot-long two-span Green Street OC. The width of the structure will
remain the same as the existing bridge (66 feet).

Draft Project Report January 2015
87
CH2M HILL
III. Freeway Tunnel Alternative – Single-Bore Tunnel
There are four structures and two cut-and-cover tunnels associated with the Freeway Tunnel
Alternative single-bore design variation. These structures from south to north are as follows:
Laguna Basin Bridge (Attachment K-3a):
Laguna Basin is parallel to the SR 710 Freeway. A 900-foot-long nine-span structure is proposed
along the Laguna Basin. This bridge will prevent the new alignment from encroaching on the
Laguna Flood Control Basin.
Hellman Avenue OC (Attachment K-3b):
A 250-foot-long three-span structure over the SR 710 Freeway at Hellman Avenue is proposed to
replace the existing Hellman Avenue OC. The width of the proposed structure will remain the
same as the existing bridge (64 feet).
Valley Boulevard OC (Attachment K-3c):
At this location, Valley Boulevard crosses over the proposed SR 710 full-bored tunnel with the
accommodation of another full-bored tunnel on the west side in the future. A 232-foot-long
single-span structure is proposed. Soil will be added beneath this OC to cover the tunnel to a
level where the bridge structure will maintain its integrity and bridge inspections can be
performed.
Cut-and-Cover Tunnel (South Portal) (Attachment K-3d):
The South Portal Cut-and-Cover Tunnel begins north of Hellman Avenue and ends north of
Valley Boulevard. The main purpose of this cut-and-cover tunnel is to serve as the transition of
the SR 710 Freeway between the at-grade surface level and the full-bore tunnel level.
Cut-and-Cover Tunnel (North Portal) (Attachment K-3e):
The North Portal Cut-and-Cover Tunnel begins north of California Boulevard and ends north of
Del Mar Boulevard. The main purpose of this cut-and-cover tunnel is to serve as the transition of
the SR 710 Freeway between the at-grade surface level and the full-bore tunnel level.
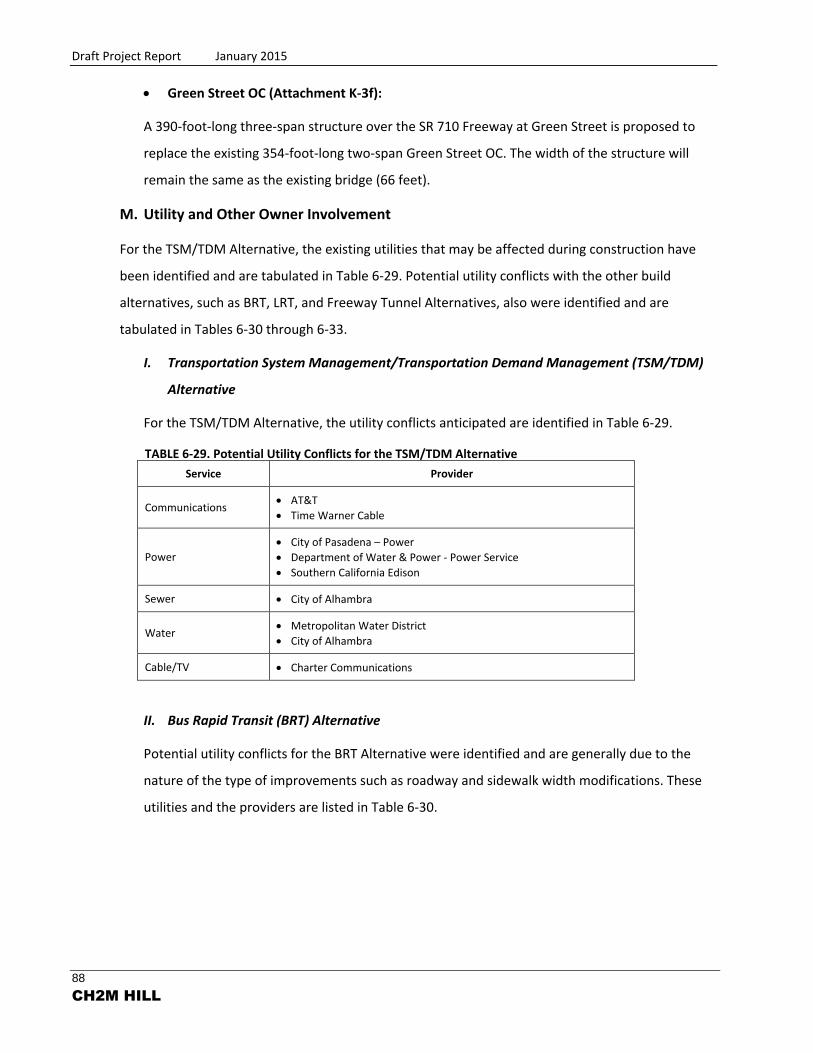
Draft Project Report January 2015
88
CH2M HILL
Green Street OC (Attachment K-3f):
A 390-foot-long three-span structure over the SR 710 Freeway at Green Street is proposed to
replace the existing 354-foot-long two-span Green Street OC. The width of the structure will
remain the same as the existing bridge (66 feet).
M. Utility and Other Owner Involvement
For the TSM/TDM Alternative, the existing utilities that may be affected during construction have
been identified and are tabulated in Table 6-29. Potential utility conflicts with the other build
alternatives, such as BRT, LRT, and Freeway Tunnel Alternatives, also were identified and are
tabulated in Tables 6-30 through 6-33.
I. Transportation System Management/Transportation Demand Management (TSM/TDM)
Alternative
For the TSM/TDM Alternative, the utility conflicts anticipated are identified in Table 6-29.
TABLE 6-29. Potential Utility Conflicts for the TSM/TDM Alternative
Service Provider
Communications AT&T
Time Warner Cable
Power City of Pasadena – Power
Department of Water & Power - Power Service
Southern California Edison
Sewer City of Alhambra
Water Metropolitan Water District
City of Alhambra
Cable/TV Charter Communications
II. Bus Rapid Transit (BRT) Alternative
Potential utility conflicts for the BRT Alternative were identified and are generally due to the
nature of the type of improvements such as roadway and sidewalk width modifications. These
utilities and the providers are listed in Table 6-30.
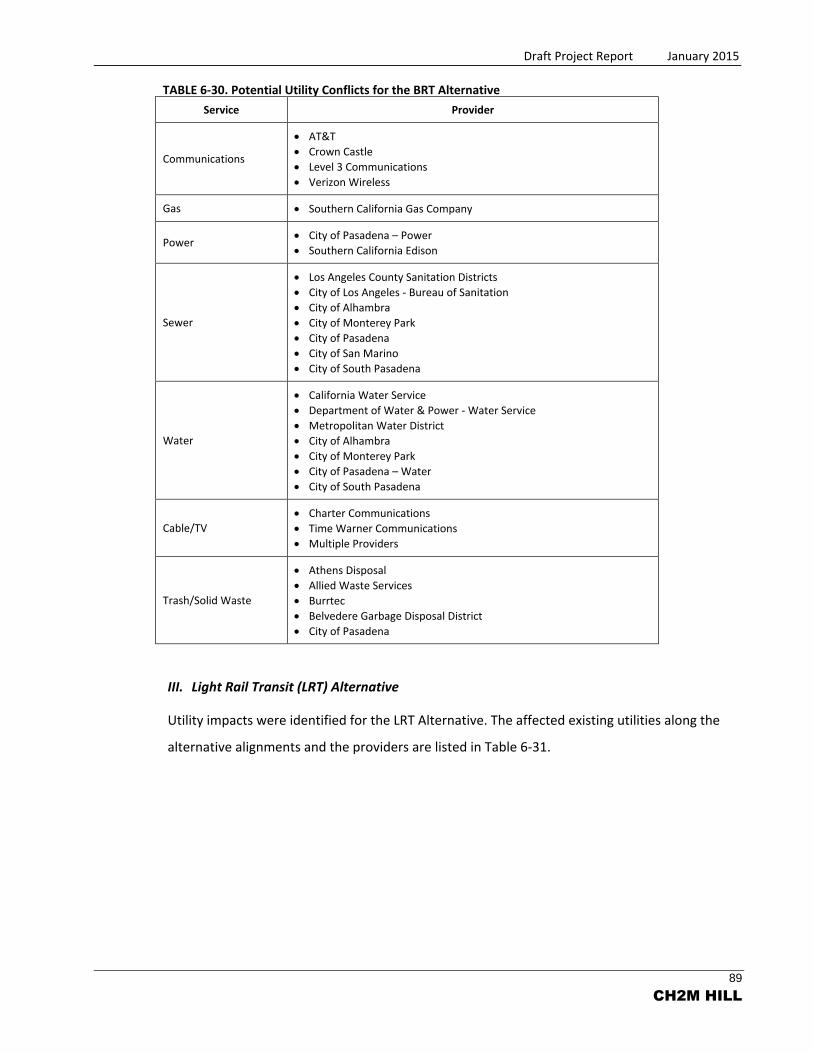
Draft Project Report January 2015
89
CH2M HILL
TABLE 6-30. Potential Utility Conflicts for the BRT Alternative
Service Provider
Communications
AT&T
Crown Castle
Level 3 Communications
Verizon Wireless
Gas Southern California Gas Company
Power City of Pasadena – Power
Southern California Edison
Sewer
Los Angeles County Sanitation Districts
City of Los Angeles - Bureau of Sanitation
City of Alhambra
City of Monterey Park
City of Pasadena
City of San Marino
City of South Pasadena
Water
California Water Service
Department of Water & Power - Water Service
Metropolitan Water District
City of Alhambra
City of Monterey Park
City of Pasadena – Water
City of South Pasadena
Cable/TV Charter Communications
Time Warner Communications
Multiple Providers
Trash/Solid Waste
Athens Disposal
Allied Waste Services
Burrtec
Belvedere Garbage Disposal District
City of Pasadena
III. Light Rail Transit (LRT) Alternative
Utility impacts were identified for the LRT Alternative. The affected existing utilities along the
alternative alignments and the providers are listed in Table 6-31.

Draft Project Report January 2015
90
CH2M HILL
TABLE 6-31. Potential Utility Conflicts for the LRT Alternative
Service Provider
Communications
AT&T
Crown Castle
Level 3 Communications
Verizon Wireless
Gas Southern California Gas Company
Power City of Pasadena – Power
Department of Water & Power - Power Service
Southern California Edison
Sewer
Los Angeles County Sanitation Districts
City of Los Angeles - Bureau of Sanitation
City of Alhambra
City of Monterey Park
City of Pasadena
City of South Pasadena
Water
California Water Service
Department of Water & Power - Water Service
Metropolitan Water District
City of Alhambra
City of Pasadena – Water
City of South Pasadena
Cable/TV Charter Communications
IV. Freeway Tunnel Alternative
For both the dual-bore and single-bore tunnel design variations of the Freeway Tunnel
Alternative, most of the utility conflicts are anticipated to be near the portals due to the nature
of the type of improvements. The affected existing utilities and the providers along the dual-
bore and single-bore alignments are listed in Tables 6-32 and 6-33, respectively.

Draft Project Report January 2015
91
CH2M HILL
TABLE 6-32. Potential Utility Conflicts for the Freeway Tunnel Alternative, Dual-Bore Design Variation
Service Provider
Communications AT&T
Gas Southern California Gas Company
Power
City of Pasadena – Power
Department of Water & Power - Power Service
Caltrans
Sewer
City of Los Angeles – Bureau of Sanitation
City of Alhambra
City of Pasadena
Water
Department of Water & Power - Water Service
Metropolitan Water District
City of Pasadena - Water
TABLE 6-33. Potential Utility Conflicts for the Freeway Tunnel Alternative, Single-Bore Design Variation
Service Provider
Communications AT&T
Gas Southern California Gas Company
Power City of Pasadena – Power
Department of Water & Power - Power Service
Caltrans
Sewer City of Los Angeles - Bureau of Sanitation
City of Alhambra
City of Pasadena
Water Department of Water & Power – Water Service
Metropolitan Water District
City of Pasadena – Water
7. OTHER CONSIDERATIONS
A. Public Hearing Process
It is recommended that the DEIR/EIS and DPR be made available to the public for review and
comment. It is also recommended that a public hearing be offered for the developed alternatives.
B. Route Matters
Several build alternatives are under consideration. Once the preferred alternative is selected, the
required agreements and documents will be discussed.

Draft Project Report January 2015
92
CH2M HILL
C. Permits
The following is a list of agency approvals and permits that are anticipated to be needed for the
proposed improvements (This list will be finalized in the Project Report when the preferred
alternative is selected):
State’s Encroachment Permit for Construction
National Pollutant Discharge Elimination System (NPDES) General Construction Activity
Stormwater Permit, and the Caltrans Statewide Permit
California Department of Fish and Wildlife Streambed Alteration 1601 Agreement
United States Army Corps of Engineers Clean Water Act Section 404 Permit
State Water Resources Control Board Clean Water Act Section 401 Water Quality
Certification
County of Los Angeles Flood Control Permit
Los Angeles County Municipal Separate Storm Sewer System (MS4) NPDES Permit
Los Angeles County Department of Public Works Construction Permit
D. Cooperative Agreements
A Design Cooperative Agreement is in development between the State of California and Metro to
define responsibilities for the design, funding, staffing, and ROW acquisition. A separate Cooperative
Agreement will be prepared for project construction.
E. Other Agreements
Maintenance Agreements, as well as any other needed agreements, will be prepared as required for
the proposed project.
F. Transportation Management Plan for Use During Construction
Transportation Management Plan (TMP) Data Sheets have been prepared for each build alternative
and are included in Attachment M. Once the preferred alternative is selected, a revised TMP Data
Sheet will be prepared. The objective of the TMP is to mitigate the impacts construction activities will
have on freeway and roadway users at various project locations. The TMP will be closely coordinated
with Caltrans, Metro, Cities, Los Angeles County, and the public to ensure that traffic at project
Draft Project Report January 2015
93
CH2M HILL
locations and the surrounding areas remain at an acceptable level of operation during construction.
The following strategies can be implemented in the alternative TMPs as needed:
Public awareness campaigns prior to and during construction
Real-time communication with motorists, including CMS and highway advisory radio
announcements to alert motorists of upcoming construction impacts, detours, and up-to-
date travel conditions
Promotion of ridesharing and public transit programs
Identification of TDM techniques on an alternative-specific basis
The cost of the TMP typically ranges from 1 to 2 percent of the total construction cost. However,
the amount might be less for some of the build alternatives in the SR 710 North Study because the
majority of the proposed projects are underground tunnels that do not interfere with surface traffic
(for example, the LRT and Freeway Tunnel Alternatives).
The Incentive and Disincentive strategy is also recommended to promote construction efficiency.
Due to insufficient data available at the current stage, the costs to apply this strategy are not
available in the TMP Data Sheets in this DPR (Attachment M). Once the preferred alternative is
selected, the overall cost of implementing the Incentive and Disincentive Strategy will be calculated
and included in the final TMP. The estimated TMP cost for each of the SR 710 North Study build
alternatives will be included in the preliminary cost estimate in Attachment L.
G. Stage Construction
At the estimated time of construction, coordination will be required to ensure that the proposed
closures and/or detours for this project are coordinated with all other roadway projects in the area
that may be impacted, and that potential traffic impacts as a result of this project are adequately
addressed. For the discussion on the previous topic, the staging of construction will be closely
coordinated with the development of the TMP.
H. Drainage
I. Surface Drainage
Existing systems will either need to be extended and/or augmented in order to contain the
required design flows within the project limits. These alternatives will impact several existing
Draft Project Report January 2015
94
CH2M HILL
drainage systems and drainage features by removing, blocking, paving over, or interfering with
these systems. These impacts may be minimized or avoided by the following:
Relocation and extension of systems as necessary
Additional catch basins, downdrains, or overside drains where required
Abandonment of systems that are no longer serviceable
Major drainage design concepts in this project are described below. Where feasible, the
drainage design would:
Maintain existing offsite drainage flow patterns, yet minimize the number of points at which
cross-culverts must be constructed.
Contain, collect, and treat 100 percent of onsite water quality runoff using appropriately
designed collection systems and best management practices (BMPs).
Modify existing drainage facilities to be capable of handling any increased design flows as
much as possible, given existing physical constraints.
Install pump stations to avoid flooding.
Treatment BMPs would be provided to treat onsite runoff before discharging to corresponding
receiving waters.
The regional Laguna Regulating Basin and Dorchester Channel are two major offsite drainage
systems that will be impacted by the dual-bore tunnel option. The proposed I-710 widening
would encroach horizontally into the west side of the basin. The extent of the encroachment
would be up to 20 feet wide and 700 feet long along the western boundary of the basin. The
encroachment would also affect the existing maintenance access road along the west side of the
basin.
The affected maintenance road for the basin will be replaced by a new entrance and pull-out
(maintenance vehicle pull-out) area from the I-10/I-710 connector. The encroaching portion of
the roadway will be placed on a bridge structure to avoid reducing the storage volume of the
basin.
Under the dual-bore tunnel option, the proposed I-710 on-ramp would encroach into the
Dorchester Channel. Including the new grading, it will affect about 728 feet at the southern end
and about 267 feet at the northern end of the reinforced concrete channel (RCC). The affected

Draft Project Report January 2015
95
CH2M HILL
RCC portion of Dorchester Channel will be changed into double-span reinforced concrete boxes
(RCBs) along the original channel alignment. The proposed channel layout is intended to
minimize the hydraulic impact to the existing condition.
The south portal includes the surface portion and the cut-and-cover tunnel. Due to adding new
lanes and the cut-and-cover construction, many inlets and pipes have to be removed to avoid
the conflict. New inlets are proposed at the low points, before the super reversals and beginning
of cut-and-cover locations. New crossing culverts are proposed to convey water from the east to
the west. No new connection is proposed on the Dorchester Channel. The onsite systems convey
all runoff from the high point near Hellman Avenue Bridge to the pump station near Valley
Boulevard. A pump station is proposed to pump water out to the Dorchester Channel.
Due to the tunnel construction, the existing pump station and storage chamber south of Del Mar
Boulevard are relocated to the north side of Del Mar Boulevard. All offsite flow (west of I-710
and south of Del Mar Boulevard) that drains to this sump area is collected in a proposed swale
and pipe, draining north to the trunk line (48-inch reinforced concrete pipe [RCP]) on Del Mar
Boulevard. An 84-inch RCP on the west side of I-710 is rerouted to the east side, and joins a
60-inch RCP at Station 1743+00. From the confluence point, a 96-inch RCP runs south to the
storage chamber of the relocated pump station. The pump station is designed to handle a
50-year storm event for the drainage area. An outlet pipe connects to an existing 48-inch RCP on
Del Mar Boulevard.
The single-bore tunnel option has a similar impact on existing drainage systems, but to a lesser
degree, because the project footprint is smaller than the dual-bore tunnel option. There will be
no impact to Dorchester Channel. New inlets and pipes are proposed as needed; the pump
station and storage chamber at Del Mar Boulevard will be relocated.
II. Tunnel Drainage
A pump station will be constructed at the tunnel low point. The pump station will pump water
that collects in a wet well to a local water storage system; then, the water will be treated offsite
before being discharged. Inlets located along the lower side of both the northbound and
southbound tunnel roadways will collect road runoff and convey it into a steel pipe running
beneath the lower roadway within the tunnel. Stormwater will be collected and conveyed to the
stormwater pump stations. Therefore, the tunnel roadways will normally generate little or no
runoff, except during periods of tunnel washing or tunnel fire. The tunnel drainpipe also will

Draft Project Report January 2015
96
CH2M HILL
convey the minor amounts of tunnel seepage (generated on a continuous basis), draining it to
the sump. Among the possible water sources, the design flow will be the fire sprinklers and fire
hydrant, based on the National Fire Protection Association (NFPA) Fire Protection Handbook
(NFPA, 20th edition).
The pump station layout is to place the wet well, electrical transformer, metering pad, and
backup generator at the low point recessed area in the middle of southbound and northbound
tunnels. The pump room will be constructed at the road surface elevation for maintenance
access to the pump station and appurtenance equipment. The wet well will include a recessed
area for a smaller sump pump to drain the wet well. Submersible pumps will be used as the basis
for the pump station design; however, other pump types may be feasible. A steel discharge pipe
is proposed between the wet well of the pump and a storage tank located under the parking lot
of the O&M Center, which is north of Valley Boulevard. More detailed analysis is provided in the
Preliminary Drainage Report (CH2M HILL, 2014d).
I. Stormwater Quality Management
Water quality and stormwater treatment are also considered in the SR 710 North Study. The
treatment BMP strategy for each alternative is to consider the site constraints and determine the
feasibility of BMP implementation at the site-specific location. The goal is for the BMPs to retain and
treat the paved area runoff to the maximum extent practicable. Each BMP is evaluated individually in
accordance with the guidelines provided in the Project Planning and Design Guide (Caltrans, 2010b),
and Standard Urban Stormwater Mitigation Plan (SUSMP) (City of Los Angeles, 2000) for the Los
Angeles River region. According to the current Caltrans NPDES permit, the strategy is to first evaluate
treatment BMPs that infiltrate, harvest, reuse, and/or evapotranspire the stormwater runoff,
followed by BMPs that capture and treat the runoff. Where the entire runoff volume from an
85th percentile 24-hour storm event cannot be infiltrated, harvested, and reused, or
evapotranspired, the excess volume may be treated by low-impact development (LID)-based
flow-through treatment devices. Where LID-based flow-through treatment devices are not feasible,
the excess volume may be treated through conventional volume-based or flow-based stormwater
treatment devices. More detailed analysis will be provided in the Stormwater Data Report (SWDR).
For freeway alternatives, only Caltrans-approved BMPs are considered. For other alternatives, tree
box filter (TBF) and the catch basin screen and curb inlet filter assembly (CB Screen and Insert) are
considered where feasible. The flow-through TBF treatment system has a demonstrated efficiency at
Draft Project Report January 2015
97
CH2M HILL
least equivalent to a sand filter. TBFs are proposed at new catch basins where the sidewalk is at least
7 feet wide. This criterion is required to maintain enough clearance to meet the standards of the
Americans with Disabilities Act (ADA).
J. Fire/Life Safety Measures
The tunnel segments of the LRT and Freeway Tunnel Alternatives would be regulated by authorities at
the federal, state, county, and city levels. Codes typically reference standards and guidelines that are
developed by independent organizations. Authorities with potential jurisdiction and codes related to
fire/life safety of the tunnels and related facilities may include, but are not limited to, Department of
Homeland Security, FHWA, U.S. Department of Justice, Caltrans, and California Building Standards
Commission (particularly the Building, Fire, Electrical, and Mechanical codes). Meetings were hosted
by the SR 710 North Study team with the Fire Marshal for these specific concerns.
The mechanical system requirements for fire safety in the tunnel segments of the alternatives would
be nearly identical. The recommended equipment and mechanical systems include a Fixed Fire
Fighting System (FFFS), standpipe and hose system, fire extinguishers, and a tunnel ventilation
system. The FFFS is a water-based extinguisher comprising two systems: deluge foam water sprinkler
system, and a standpipe and hose system. Fire extinguishers will be located in the hose valve
cabinets with a rating of 2-A:20-B:C and a 20-pound weight limit as required per NFPA 502. The main
purpose of the tunnel ventilation system is to reduce levels of carbon monoxide. In the case of a fire,
the ventilation system will reduce levels of smoke and harmful gases in the tunnel to allow for safe
evacuation of motorists and entry for firefighters. In the event that one of the ventilation fans is out
of service, the ventilation system will have redundancy to still deliver the required performance.
The ventilation system also will provide safe egress in the enclosed and pressurized walkways with
emergency exits. Supply fans in the ventilation will keep the emergency walkway area free of smoke
in the event of a fire.
K. Accommodation of Oversize Loads
The proposed build alternatives in this study are not expected to permanently affect the ability to
transport oversize loads on the state freeway. Among the build alternatives, the mainline vertical
clearance is not an issue for all the proposed underpasses and undercrossings. At all the OCs, bridges,
and separations, designs are proposed as a means to either improve or maintain the existing vertical
clearances.

Draft Project Report January 2015
98
CH2M HILL
L. Graffiti Control
Improvements of each alternative covers areas with different severities of graffiti issues. Standard
deterrent techniques would be used as part of the proposed design to limit access to bridges and
signs. These may include some physical devices, such as rat guards, sign hoods, razor wire, and glare
screen patches. For the ground-mounted traffic devices and signs, the approved protective coating
would be considered to apply and the graffiti should be removed immediately if there are safety
concerns. The viable graffiti control concepts and specific methods will be identified when the
preferred alternative is selected.
M. Visual Impact
The draft report of the Visual Impact Assessment assesses the visual impacts of the proposed
alternatives and proposes measures to avoid, minimize, and/or conceal any adverse visual impacts
associated with the construction of the proposed alternatives on the surrounding visual environment.
It includes evaluations on the reduction or avoidance of possible adverse visual impacts and proposes
possible levels of visual measures to alleviate those adverse impacts. More detailed analysis is
provided in the Draft Visual Impact Assessment report (Tatsumi and Partners, Inc., 2014).
8. FUNDING / PROGRAMMING
Funding for this project will come from a variety of sources such as Measure R, federal funding programs,
and some other funding strategies. The Preliminary Cost Estimates for each alternative are provided in
Attachment L. The total project costs range from $105,000,000 to $5,650,000,000. Of this total,
$780,000,000 will be funded by Measure R; the remaining costs may be provided through federal funding
and monies earned through tolling, in combination with other funding strategies to be identified.
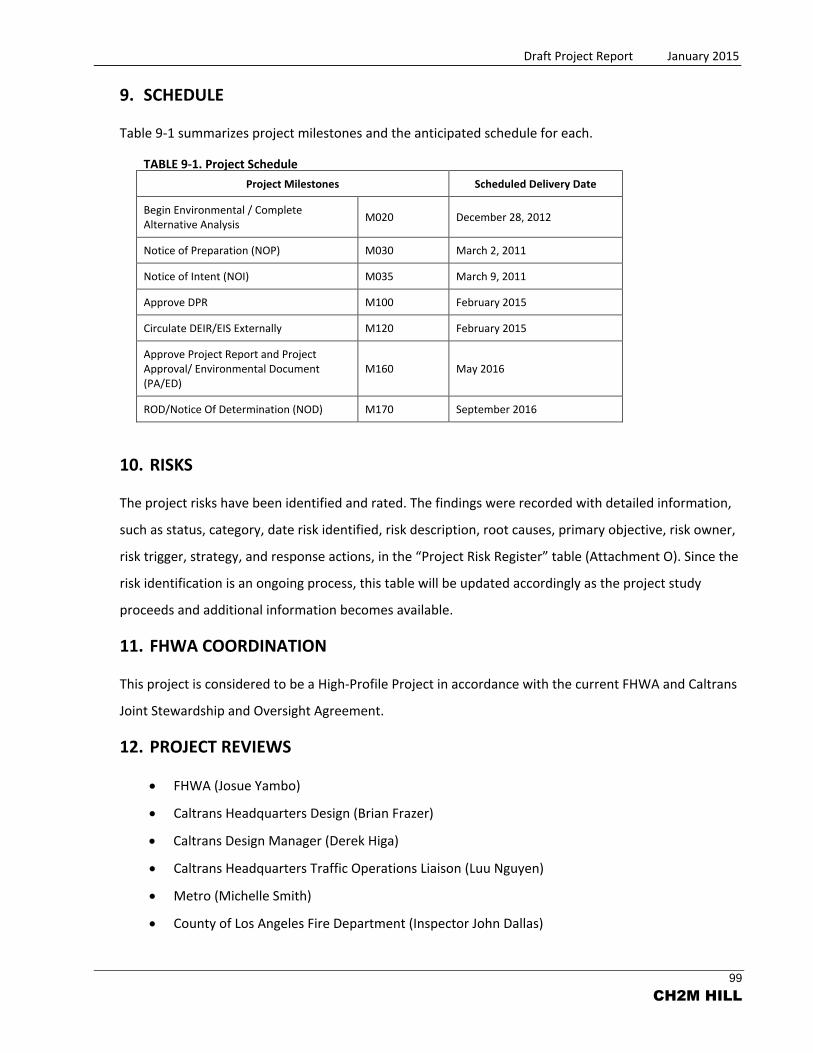
Draft Project Report January 2015
99
CH2M HILL
9. SCHEDULE
Table 9-1 summarizes project milestones and the anticipated schedule for each.
TABLE 9-1. Project Schedule
Project Milestones Scheduled Delivery Date
Begin Environmental / Complete Alternative Analysis
M020 December 28, 2012
Notice of Preparation (NOP) M030 March 2, 2011
Notice of Intent (NOI) M035 March 9, 2011
Approve DPR M100 February 2015
Circulate DEIR/EIS Externally M120 February 2015
Approve Project Report and Project Approval/ Environmental Document (PA/ED)
M160 May 2016
ROD/Notice Of Determination (NOD) M170 September 2016
10. RISKS
The project risks have been identified and rated. The findings were recorded with detailed information,
such as status, category, date risk identified, risk description, root causes, primary objective, risk owner,
risk trigger, strategy, and response actions, in the “Project Risk Register” table (Attachment O). Since the
risk identification is an ongoing process, this table will be updated accordingly as the project study
proceeds and additional information becomes available.
11. FHWA COORDINATION
This project is considered to be a High-Profile Project in accordance with the current FHWA and Caltrans
Joint Stewardship and Oversight Agreement.
12. PROJECT REVIEWS
FHWA (Josue Yambo)
Caltrans Headquarters Design (Brian Frazer)
Caltrans Design Manager (Derek Higa)
Caltrans Headquarters Traffic Operations Liaison (Luu Nguyen)
Metro (Michelle Smith)
County of Los Angeles Fire Department (Inspector John Dallas)

Draft Project Report January 2015
100
CH2M HILL
13. PROJECT PERSONNEL
The following individuals may be contacted for information pertaining to this DPR:
Metro
Metro Project Manager: Michelle Smith (213) 922-3057
Caltrans
Caltrans Corridor Manager: John Lee (213) 897-5623
Caltrans Design Manager: Derek Higa (213) 897-0394
Caltrans Environmental Manager: Garrett Damrath (213) 897-9016
Consultant – CH2M HILL
Project Manager: Yoga Chandran (714) 435-6111
Engineering Lead: Tom Ionta (714) 435-6238
Traffic Lead: Loren Bloomberg (714) 435-6020
Environmental Lead: Deborah Pracilio (949) 553-0666
Project Report Lead: Tom Ionta (714) 435-6238
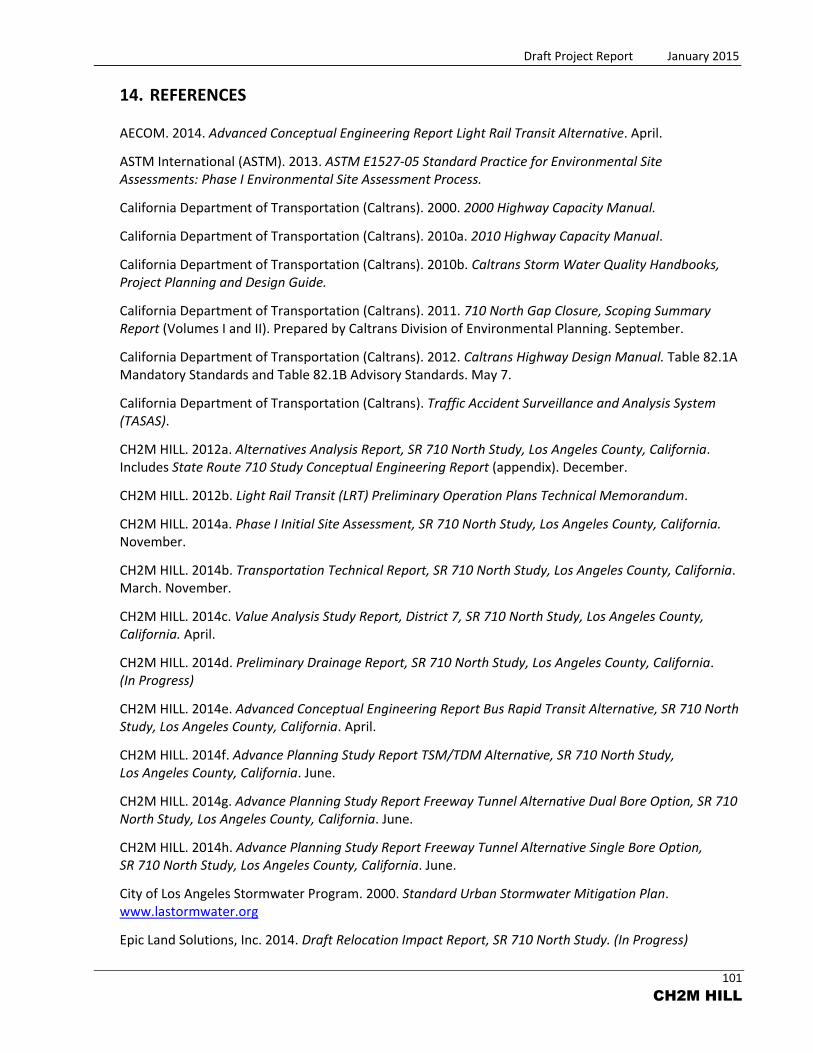
Draft Project Report January 2015
101
CH2M HILL
14. REFERENCES
AECOM. 2014. Advanced Conceptual Engineering Report Light Rail Transit Alternative. April.
ASTM International (ASTM). 2013. ASTM E1527-05 Standard Practice for Environmental Site Assessments: Phase I Environmental Site Assessment Process.
California Department of Transportation (Caltrans). 2000. 2000 Highway Capacity Manual.
California Department of Transportation (Caltrans). 2010a. 2010 Highway Capacity Manual.
California Department of Transportation (Caltrans). 2010b. Caltrans Storm Water Quality Handbooks, Project Planning and Design Guide.
California Department of Transportation (Caltrans). 2011. 710 North Gap Closure, Scoping Summary Report (Volumes I and II). Prepared by Caltrans Division of Environmental Planning. September.
California Department of Transportation (Caltrans). 2012. Caltrans Highway Design Manual. Table 82.1A Mandatory Standards and Table 82.1B Advisory Standards. May 7.
California Department of Transportation (Caltrans). Traffic Accident Surveillance and Analysis System (TASAS).
CH2M HILL. 2012a. Alternatives Analysis Report, SR 710 North Study, Los Angeles County, California. Includes State Route 710 Study Conceptual Engineering Report (appendix). December.
CH2M HILL. 2012b. Light Rail Transit (LRT) Preliminary Operation Plans Technical Memorandum.
CH2M HILL. 2014a. Phase I Initial Site Assessment, SR 710 North Study, Los Angeles County, California. November.
CH2M HILL. 2014b. Transportation Technical Report, SR 710 North Study, Los Angeles County, California. March. November.
CH2M HILL. 2014c. Value Analysis Study Report, District 7, SR 710 North Study, Los Angeles County, California. April.
CH2M HILL. 2014d. Preliminary Drainage Report, SR 710 North Study, Los Angeles County, California. (In Progress)
CH2M HILL. 2014e. Advanced Conceptual Engineering Report Bus Rapid Transit Alternative, SR 710 North Study, Los Angeles County, California. April.
CH2M HILL. 2014f. Advance Planning Study Report TSM/TDM Alternative, SR 710 North Study, Los Angeles County, California. June.
CH2M HILL. 2014g. Advance Planning Study Report Freeway Tunnel Alternative Dual Bore Option, SR 710 North Study, Los Angeles County, California. June.
CH2M HILL. 2014h. Advance Planning Study Report Freeway Tunnel Alternative Single Bore Option, SR 710 North Study, Los Angeles County, California. June.
City of Los Angeles Stormwater Program. 2000. Standard Urban Stormwater Mitigation Plan. www.lastormwater.org
Epic Land Solutions, Inc. 2014. Draft Relocation Impact Report, SR 710 North Study. (In Progress)

Draft Project Report January 2015
102
CH2M HILL
Federal Transit Administration (FTA). 2006. Transit Noise and Vibration Impact Assessment Manual. Prepared by U.S. Department of Transportation Federal Transit Administration Office of Planning and Environment, Report Number FTA-VA-90-1003-06. May. Available online at: http://www.fta.dot.gov/documents/FTA_Noise_and_Vibration_Manual.pdf
Los Angeles County Metropolitan Transportation Authority (Metro). 2009. Long-Range Transportation Plan.
LSA Associates, Inc. 2014a. Draft Noise Abatement Decision Report, SR 710 North Study. September.
LSA Associates, Inc. 2014b. Draft Noise Study Report, SR 710 North Study. October.
Southern California Association of Governments (SCAG). 2012. Regional Transportation Plan/ Sustainable Communities Strategy.
Southern California Association of Governments (SCAG). 2013. Federal Transportation Improvement Program (FTIP). Project ID: 18790 Route 710: Study to perform alternative analysis, engineering, and environmental studies to close 710 Freeway gap.
Tatsumi and Partners, Inc. 2014. Draft Visual Impact Assessment for SR 710 North Study. August. (In Progress)
15. LIST OF ATTACHMENTS (UNDER SEPARATE COVER)
A. Vicinity Map
B. Location Map
C. Traffic Volume Exhibits
C-1: Existing Conditions – Traffic Volumes (2012)
C-2: No Build Alternative – Traffic Volumes (2035)
C-3: TSM/TDM Alternative – Traffic Volumes (2035)
C-4: BRT Alternative – Traffic Volumes (2035)
C-5: LRT Alternative – Traffic Volumes (2035)
C-6a: Freeway Alternative – Dual Bore with No Toll – Traffic Volumes (2035)
C-6b: Freeway Alternative – Dual Bore with No Toll & No Trucks – Traffic Volumes (2035)
C-6c: Freeway Alternative – Dual Bore with Toll – Traffic Volumes (2035)
C-7a: Freeway Alternative – Single Bore with Toll – Traffic Volumes (2035)
C-7b: Freeway Alternative – Single Bore with Tolls & No Trucks – Traffic Volumes (2035)
C-7c: Freeway Alternative – Single Bore with Tolls & Express Bus – Traffic Volumes (2035)
D. Accident Data – TASAS Table B
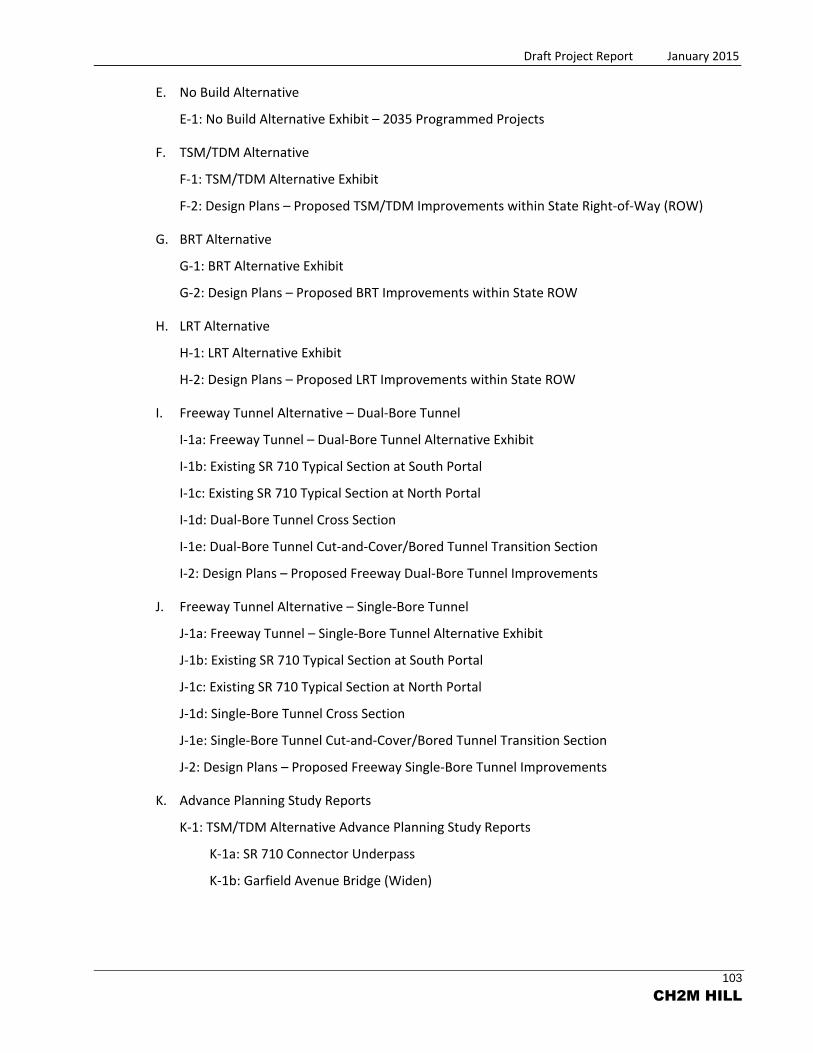
Draft Project Report January 2015
103
CH2M HILL
E. No Build Alternative
E-1: No Build Alternative Exhibit – 2035 Programmed Projects
F. TSM/TDM Alternative
F-1: TSM/TDM Alternative Exhibit
F-2: Design Plans – Proposed TSM/TDM Improvements within State Right-of-Way (ROW)
G. BRT Alternative
G-1: BRT Alternative Exhibit
G-2: Design Plans – Proposed BRT Improvements within State ROW
H. LRT Alternative
H-1: LRT Alternative Exhibit
H-2: Design Plans – Proposed LRT Improvements within State ROW
I. Freeway Tunnel Alternative – Dual-Bore Tunnel
I-1a: Freeway Tunnel – Dual-Bore Tunnel Alternative Exhibit
I-1b: Existing SR 710 Typical Section at South Portal
I-1c: Existing SR 710 Typical Section at North Portal
I-1d: Dual-Bore Tunnel Cross Section
I-1e: Dual-Bore Tunnel Cut-and-Cover/Bored Tunnel Transition Section
I-2: Design Plans – Proposed Freeway Dual-Bore Tunnel Improvements
J. Freeway Tunnel Alternative – Single-Bore Tunnel
J-1a: Freeway Tunnel – Single-Bore Tunnel Alternative Exhibit
J-1b: Existing SR 710 Typical Section at South Portal
J-1c: Existing SR 710 Typical Section at North Portal
J-1d: Single-Bore Tunnel Cross Section
J-1e: Single-Bore Tunnel Cut-and-Cover/Bored Tunnel Transition Section
J-2: Design Plans – Proposed Freeway Single-Bore Tunnel Improvements
K. Advance Planning Study Reports
K-1: TSM/TDM Alternative Advance Planning Study Reports
K-1a: SR 710 Connector Underpass
K-1b: Garfield Avenue Bridge (Widen)
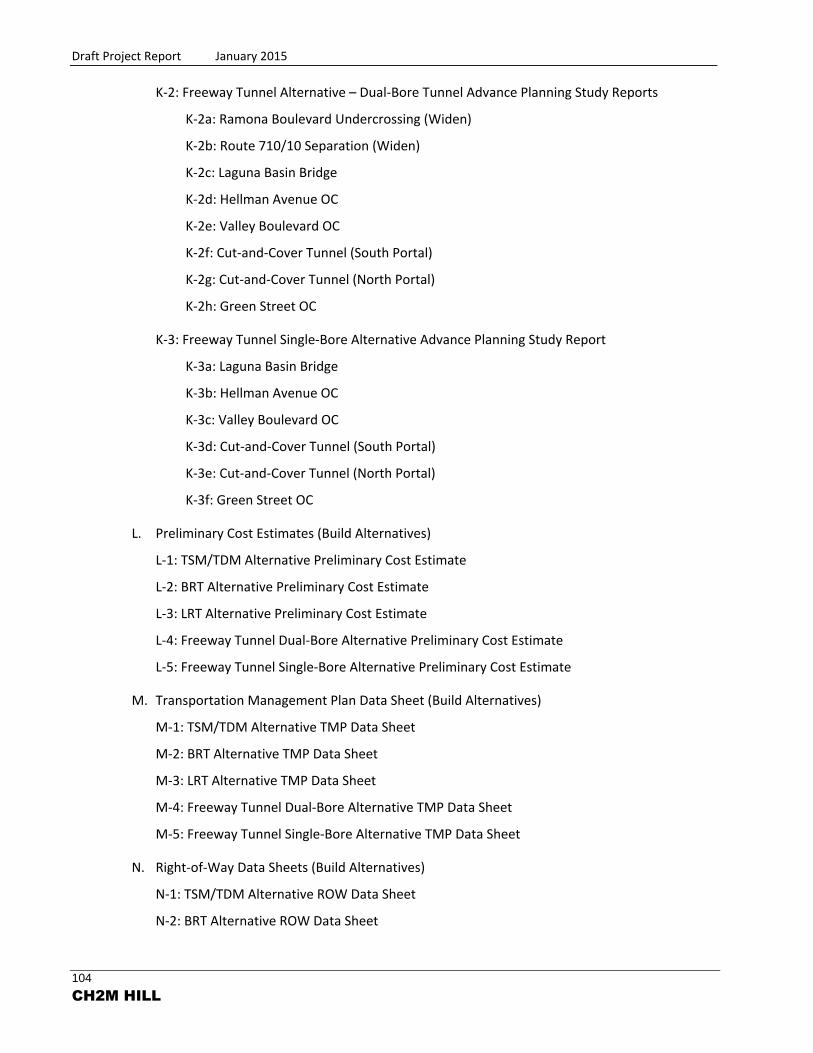
Draft Project Report January 2015
104
CH2M HILL
K-2: Freeway Tunnel Alternative – Dual-Bore Tunnel Advance Planning Study Reports
K-2a: Ramona Boulevard Undercrossing (Widen)
K-2b: Route 710/10 Separation (Widen)
K-2c: Laguna Basin Bridge
K-2d: Hellman Avenue OC
K-2e: Valley Boulevard OC
K-2f: Cut-and-Cover Tunnel (South Portal)
K-2g: Cut-and-Cover Tunnel (North Portal)
K-2h: Green Street OC
K-3: Freeway Tunnel Single-Bore Alternative Advance Planning Study Report
K-3a: Laguna Basin Bridge
K-3b: Hellman Avenue OC
K-3c: Valley Boulevard OC
K-3d: Cut-and-Cover Tunnel (South Portal)
K-3e: Cut-and-Cover Tunnel (North Portal)
K-3f: Green Street OC
L. Preliminary Cost Estimates (Build Alternatives)
L-1: TSM/TDM Alternative Preliminary Cost Estimate
L-2: BRT Alternative Preliminary Cost Estimate
L-3: LRT Alternative Preliminary Cost Estimate
L-4: Freeway Tunnel Dual-Bore Alternative Preliminary Cost Estimate
L-5: Freeway Tunnel Single-Bore Alternative Preliminary Cost Estimate
M. Transportation Management Plan Data Sheet (Build Alternatives)
M-1: TSM/TDM Alternative TMP Data Sheet
M-2: BRT Alternative TMP Data Sheet
M-3: LRT Alternative TMP Data Sheet
M-4: Freeway Tunnel Dual-Bore Alternative TMP Data Sheet
M-5: Freeway Tunnel Single-Bore Alternative TMP Data Sheet
N. Right-of-Way Data Sheets (Build Alternatives)
N-1: TSM/TDM Alternative ROW Data Sheet
N-2: BRT Alternative ROW Data Sheet
Draft Project Report January 2015
105
CH2M HILL
N-3: LRT Alternative ROW Data Sheet
N-4: Freeway Tunnel Dual-Bore Alternative ROW Data Sheet
N-5: Freeway Tunnel Single-Bore Alternative ROW Data Sheet
O. Project Risk Register (2014 – In Progress)
P. Stormwater Data Report – Appendix E
Q. Draft Environmental Document (under separate cover) – To be provided
