appendix h high resolution marine seismic reflection surveys · high resolution marine seismic...
TRANSCRIPT

Appendix H
High Resolution Marine Seismic Reflection Surveys
Shoreline Fault Zone Report, Appendix H Seis. Reflection Page H-1 of 8
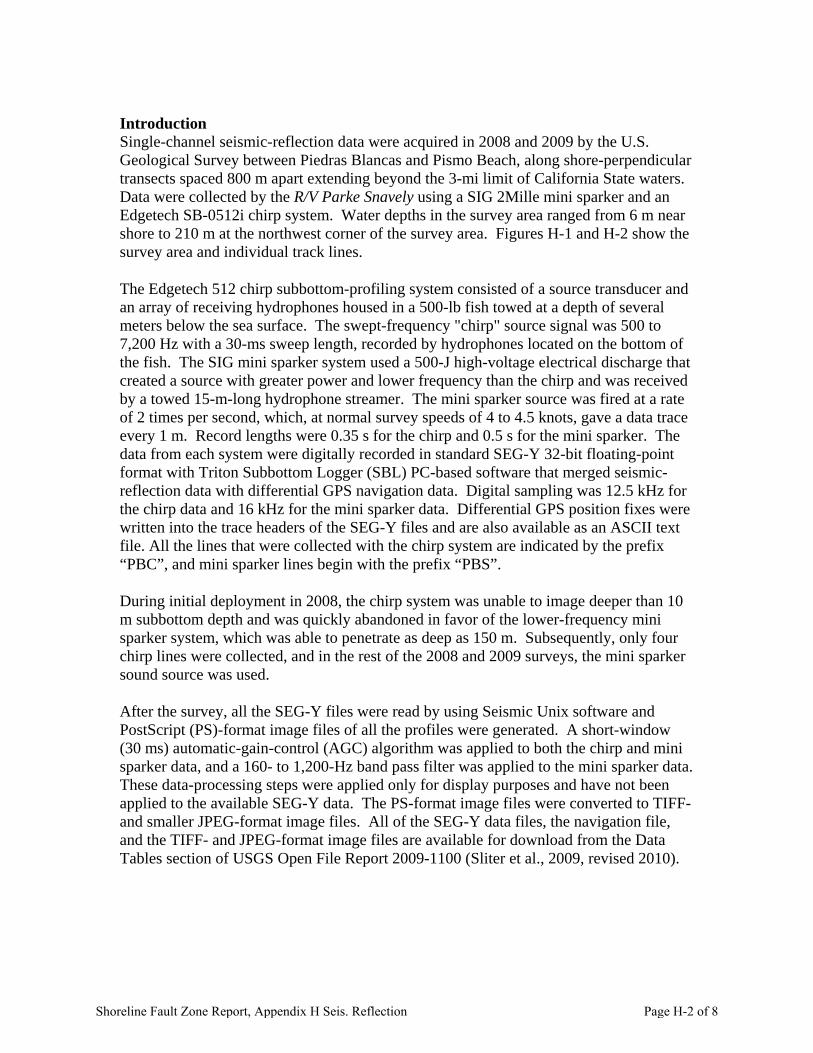
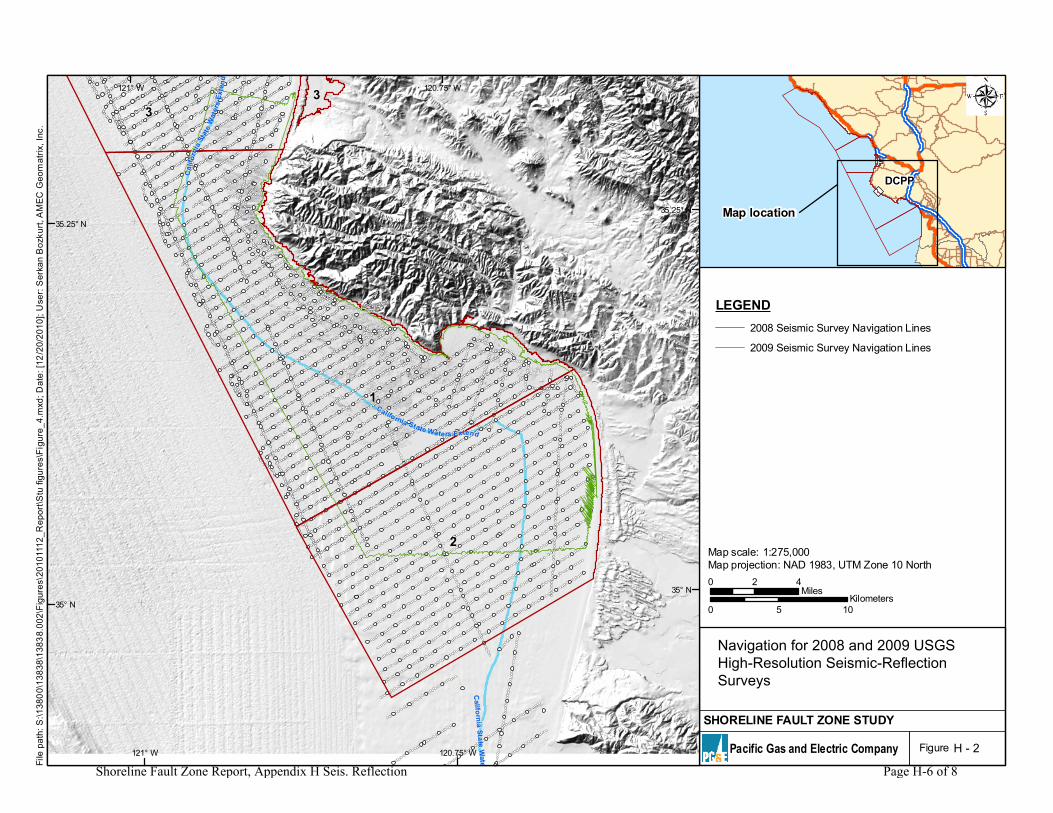
Introduction Single-channel seismic-reflection data were acquired in 2008 and 2009 by the U.S. Geological Survey between Piedras Blancas and Pismo Beach, along shore-perpendicular transects spaced 800 m apart extending beyond the 3-mi limit of California State waters. Data were collected by the R/V Parke Snavely using a SIG 2Mille mini sparker and an Edgetech SB-0512i chirp system. Water depths in the survey area ranged from 6 m near shore to 210 m at the northwest corner of the survey area. Figures H-1 and H-2 show the survey area and individual track lines.
The Edgetech 512 chirp subbottom-profiling system consisted of a source transducer and an array of receiving hydrophones housed in a 500-lb fish towed at a depth of several meters below the sea surface. The swept-frequency "chirp" source signal was 500 to 7,200 Hz with a 30-ms sweep length, recorded by hydrophones located on the bottom of the fish. The SIG mini sparker system used a 500-J high-voltage electrical discharge that created a source with greater power and lower frequency than the chirp and was received by a towed 15-m-long hydrophone streamer. The mini sparker source was fired at a rate of 2 times per second, which, at normal survey speeds of 4 to 4.5 knots, gave a data trace every 1 m. Record lengths were 0.35 s for the chirp and 0.5 s for the mini sparker. The data from each system were digitally recorded in standard SEG-Y 32-bit floating-point format with Triton Subbottom Logger (SBL) PC-based software that merged seismic-reflection data with differential GPS navigation data. Digital sampling was 12.5 kHz for the chirp data and 16 kHz for the mini sparker data. Differential GPS position fixes were written into the trace headers of the SEG-Y files and are also available as an ASCII text file. All the lines that were collected with the chirp system are indicated by the prefix “PBC”, and mini sparker lines begin with the prefix “PBS”.
During initial deployment in 2008, the chirp system was unable to image deeper than 10 m subbottom depth and was quickly abandoned in favor of the lower-frequency mini sparker system, which was able to penetrate as deep as 150 m. Subsequently, only four chirp lines were collected, and in the rest of the 2008 and 2009 surveys, the mini sparker sound source was used.
After the survey, all the SEG-Y files were read by using Seismic Unix software and PostScript (PS)-format image files of all the profiles were generated. A short-window (30 ms) automatic-gain-control (AGC) algorithm was applied to both the chirp and mini sparker data, and a 160- to 1,200-Hz band pass filter was applied to the mini sparker data. These data-processing steps were applied only for display purposes and have not been applied to the available SEG-Y data. The PS-format image files were converted to TIFF- and smaller JPEG-format image files. All of the SEG-Y data files, the navigation file, and the TIFF- and JPEG-format image files are available for download from the Data Tables section of USGS Open File Report 2009-1100 (Sliter et al., 2009, revised 2010).
Shoreline Fault Zone Report, Appendix H Seis. Reflection Page H-2 of 8

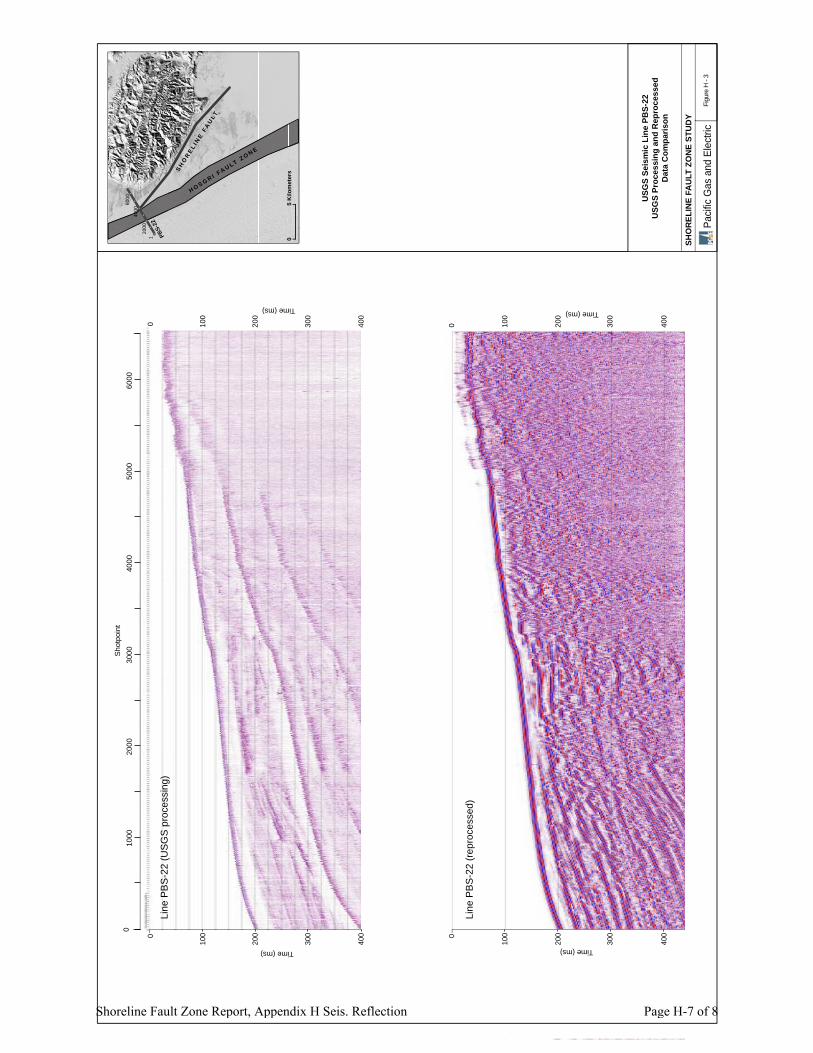
Specific attempts were made in 2009 to survey closer to shore in order to image portions of the Shoreline fault zone that had been identified from the MBES mapping. The USGS survey vessel, R/V Park Snavely, was not able to approach as close to shore as the CSU Monterey Bay vessel, R/V Ven Tresca due to the presence of shallow rocks and kelp. As a result, uniform seismic reflection profiling of nearshore areas was limited. Reprocessing Several of the USGS seismic reflection lines were reprocessed to improve signal quality and emphasize deeper seismic reflectors. Processing of the 2008 and 2009 USGS sparker data consisted of several steps to reduce noise that impaired resolution of primary reflected energy, particularly large-amplitude water-bottom multiple reflections. To ensure that all processing steps were based on surface-consistent information, reprocessing was only conducted along the portions of each line where high-resolution bathymetry data were available. Suppression or elimination of water bottom multiples in the data requires predicting the time and phase of the multiple arrivals. The basis for the multiple arrival-time predictions was a careful picking of the water-bottom reflection arrival time, and correction for arrival time irregularities along the lines based on arrival times predicted by high-resolution bathymetry. The first step to reduce arrival-time irregularities was to flatten on the primary water-bottom reflection by time shifting each trace according to the water depth and an acoustic sea-water velocity of 1493 m/s. Then several horizons were picked across the entire collection of traces within each line corresponding to the initial and later phases of the water-bottom reflection. These horizons were used to solve for surface-consistent static corrections that removed to first-order, the peculiar short-wavelength “wobble” or oscillation in water-bottom arrival time relative to the predicted arrival time based on high-resolution bathymetry. After statics corrections, the traces where shifted so that the water-bottom arrival time corresponded to observed bathymetry assuming an acoustic sea-water velocity of 1493 m/s. Experiments with varying bandpass filter operators were used to determine the passband with good signal-to-noise. The 2008 data were bandpass-filtered between 100-1200 Hz and the 2009 data were bandpass-filtered between 100-700 Hz. An AGC with a 15 ms operator was applied to provide balanced amplitudes throughout space and time in the seismic sections. With knowledge of water bottom primary time, local dip, source signature and water velocity it becomes possible to predict and remove several orders of multiple seismic energy with sufficient accuracy to uncover the primary signal (and noise) that is masked by the high amplitude water-bottom multiple reflections. This multiple processing approach is often described as SRME (Surface Related Multiple Elimination) or WEMR (Wave Equation Multiple Rejection). The final seismic line outputs represent the combination of all these surface-consistent static, filtering, amplitude balancing, and surface-consistent water-bottom multiple-reflection rejection processing steps. Figure H-3 shows a comparison of the original data seismic reflection data along line PBS-22 with the reprocessed data. Figure H-4 presents our preliminary interpretation of the reprocessed line PBS-22. Note that this reprocessing has defined a faulted limb of a fold that may represent the northern segment of the Shoreline fault zone. Earlier
Shoreline Fault Zone Report, Appendix H Seis. Reflection Page H-3 of 8

interpretations of unprocessed seismic reflection lines in this area (i.e., Figures 9a and 9b in PG&E, 2010) were not able to image this feature. Low energy (< 2 kJ) 3D seismic reflection surveys were conducted in this area during late 2010 to further resolve these features. These data will be available in the spring of 2011. References Pacific Gas and Electric Company (PG&E), 2010, Progress Report on the Analysis of the
Shoreline fault zone, central coast California, Enclosure 1, PG&E Letter DCL-10-003, January 2010.
Sliter, R.W., Triezenberg, P.J., Hart, P.E., Watt, J.T., Johnson, S.Y., and Scheirer, D.S., 2009, revised 2010, High-resolution seismic reflection and marine magnetic data along the Hosgri Fault Zone, Central California, USGS Open File Report 2009-1100, version 1.1 http://pubs.usgs.gov/of/2009/1100 /
Shoreline Fault Zone Report, Appendix H Seis. Reflection Page H-4 of 8

Pacific Gas and Electric Company
File
path
:S:\1
3800
\138
38\1
3838
.002
\Fig
ures
\201
0111
2_R
epor
t\Stu
figur
es\F
igur
e_3.
mxd
;Dat
e:[1
2/20
/201
0];U
ser:
Ser
kan
Boz
kurt,
AM
ECG
eom
atrix
,Inc
.
SHORELINE FAULT ZONE STUDY
DCPP
Map location
Figure
Cal
if orn
iaSt
ate
Wat
ers
Exte
n d
California State WatersExtend
Californ ia State Waters Extend
4
3
1
121° W
121° W
121.25° W
121.25° W
35.5° N35.5° N
35.25° N35.25° N
0 2 4Miles
0 5 10Kilometers
Map scale:Map projection: NAD 1983, UTM Zone 10 North
1:275,000
LEGEND2008 Seismic Survey Navigation Lines
2009 Seismic Survey Navigation Lines
H - 1
Navigation for 2008 and 2009 USGS High-Resolution Seismic-Reflection Surveys
Shoreline Fault Zone Report, Appendix H Seis. Reflection Page H-5 of 8
Pacific Gas and Electric Company
File
path
:S:\1
3800
\138
38\1
3838
.002
\Fig
ures
\201
0111
2_R
epor
t\Stu
figur
es\F
igur
e_4.
mxd
;Dat
e:[1
2/20
/201
0];U
ser:
Ser
kan
Boz
kurt,
AM
ECG
eom
atrix
,Inc
.
SHORELINE FAULT ZONE STUDY
DCPP
Map location
Figure
Olson HillNorth Olson fault
South Ol son faul t
Dee
r Cre
ek
Double Rock
California State Waters Extend
Cal
if orn
iaSt
a te
Wa t
ers
Exte
nd
1
2
33
California
StateW
ater
120.75° W
120.75° W
121° W
121° W
35.25° N
35.25° N
35° N
35° N0 2 4
Miles
0 5 10Kilometers
Map scale:Map projection: NAD 1983, UTM Zone 10 North
1:275,000
LEGEND2008 Seismic Survey Navigation Lines
2009 Seismic Survey Navigation Lines
H - 2
Navigation for 2008 and 2009 USGSHigh-Resolution Seismic-ReflectionSurveys
Shoreline Fault Zone Report, Appendix H Seis. Reflection Page H-6 of 8
0
100
200
300
400
Time (ms)
0
010
0020
0030
0040
0050
0060
00
100
200
300
400
Time (ms)
0 100
200
300
400
Time (ms)
0 100
200
300
400
Time (ms)
Line
PB
S-2
2 (U
SG
S p
roce
ssin
g)
Line
PB
S-2
2 (r
epro
cess
ed)
Sho
tpoi
nt
5 K
ilom
eter
s01
6000
4000
2000
PBS-
22
H O S G R I FA U LT Z O N E
SH
OR
EL I N
E F
AU
LT
Figu
re H
- 3
Paci
fic G
as a
nd E
lect
ric
SHO
REL
INE
FAU
LT Z
ON
EST
UD
Y
USG
S Se
ism
ic L
ine
PBS-
22U
SGS
Proc
essi
ng a
nd R
epro
cess
ed
Dat
a C
ompa
rison
Shoreline Fault Zone Report, Appendix H Seis. Reflection Page H-7 of 8

Figu
reH
- 4
Paci
fic G
as a
nd E
lect
ric
SHO
REL
INE
FAU
LT ZONE
STU
DY
Rep
roce
ssed
US
GS
Sei
smic
Lin
e P
BS
-22
Bed
rock
at
seaf
loor
Hos
gri f
ault
zone
Sho
relin
e se
ism
icity
trend
0
100
200
300
400
Time (ms)
0
010
0020
0030
0040
0050
0060
00
100
200
300
400
Time (ms)
0 100
200
300
400
Time (ms)
0 100
200
300
400
Time (ms)
Line
PB
S-2
2 (r
epro
cess
ed)
Line
PB
S-2
2 (r
epro
cess
ed)
with
pre
limin
ary
inte
rpre
tatio
ns
Faul
ted
limb
of fo
ld(p
ossi
ble
Sho
relin
e fa
ult)
Sho
tpoi
nt
5000
6000
4000
3000
2000
1000
1
PBS-
22
HOSGRISHORELINE -
NORTH
Shoreline Fault Zone Report, Appendix H Seis. Reflection Page H-8 of 8