appendix g tidal hydraulics study for colorado …
TRANSCRIPT
L S A A S S O C I A T E S , I N C . D R A F T E N V I R O N M E N T A L I M P A C T R E P O R T M A Y 2 0 0 8 C O L O R A D O L A G O O N R E S T O R A T I O N P R O J E C T C I T Y O F L O N G B E A C H
P:\CLB0702\DEIR\Appendices.doc (05/05/08)
APPENDIX G
TIDAL HYDRAULICS STUDY FOR COLORADO LAGOON RESTORATION PROJECT EIR
TIDAL HYDRAULICS STUDY
FOR COLORADO LAGOON RESTORATION PROJECT EIR
Prepared for
LSA Associates, Inc.
20 Executive Park, Suite 200
Irvine, CA 92614
Prepared by
Moffatt & Nichol
3780 Kilroy Airport Way, Suite 600
Long Beach, CA 90806
April 14, 2008
Hydraulic Report i M&N 6431
TABLE OF CONTENTS
1.0 Introduction ............................................................................................................... 1
2.0 Model Selection and Description .............................................................................. 1
3.0 Model Setup .............................................................................................................. 3
3.1 Model Area............................................................................................................ 3
3.2 Bathymetry ............................................................................................................ 4
3.3 Model Mesh........................................................................................................... 6
3.4 Boundary Conditions............................................................................................. 8
3.4.1 Ocean Tides ................................................................................................... 8
3.4.2 Parametric Mean Periodic (PMP) Tidal Series ............................................. 9
3.4.3 Tidal Epoch Analysis (TEA) Tidal Series..................................................... 9
3.5 Model Calibration................................................................................................ 10
4.0 Tidal Hydraulics Modeling Results......................................................................... 11
5.0 Residence Time Analysis ........................................................................................ 16
5.1 Methdology Description...................................................................................... 16
5.2 Residence Time Modeling Results...................................................................... 16
6.0 Summary ................................................................................................................. 17
7.0 References ............................................................................................................... 18
TABLES
Table 1. Recorded Water Levels at Los Angeles Outer Harbor (1983-2001 Tidal Epoch) 8
Table 2. Setup Values for Model Calibration..................................................................... 11
Table 3. Summaries of Spring Tide Range Comparisons - Proposed Project Phase 1 ...... 13
Table 4. Summaries of Spring Tide Range Comparisons - Proposed Project Phase 2 ...... 14
Table 5. Summaries of Spring Tide Range Comparisons - Alternatives ........................... 15
Table 6. Residence Time Summary.................................................................................... 17
FIGURES
Figure 1. Modeling Area ...................................................................................................... 4
Figure 2. Bathymetry of the Entire Modeling Area ............................................................. 5

Hydraulic Report ii M&N 6431
Figure 3. Bathymetry of the Colorado Lagoon .................................................................... 6
Figure 4. Entire Numerical Modeling Mesh......................................................................... 7
Figure 5. Numerical Modeling Mesh of the Colorado Lagoon ............................................ 8
Figure 6. Parametric Mean Periodic (PMP) Tidal Series ..................................................... 9
Figure 7. Tidal Epoch Analysis (TEA) Tidal Series .......................................................... 10
Figure 8. Modeling Output Gage Locations....................................................................... 12
Figure 9. Spring Tide Range Comparisons Proposed Project Phase 1............................ 13
Figure 10. Spring Tide Range Comparisons - Proposed Project Phase 2 .......................... 14
Figure 11. Spring Tide Range Comparisons - Alternatives ............................................... 15

Hydraulic Report 1 M&N 6431
1.0 INTRODUCTION
A tidal hydraulics study was performed in support of the Colorado Lagoon Restoration Project EIR. The EIR defines a proposed project and four alternatives. The hydraulics study was performed to analyze the changes to the existing condition resulting from the proposed project and alternatives. Finite element RMA2 and RMA4 numerical models were constructed.
The proposed project includes changes to the Lagoon s bathymetry resulting from dredging and short-term and long-term changes to the tidal connection between Colorado Lagoon and Marine Stadium. The short-term (Phase 1) change is to clean out the existing underground culvert and remove impedances to tidal exchange. The long-term (Phase 2) change is to replace the existing culvert with an open channel.
The four alternatives defined in the EIR are:
Alternative 1 No Project. The hydraulics of this alternative would be the same as for the existing condition.
Alternative 2 Reduced Project Alternative. This alternative does not include an open channel but does include changes to the Lagoon s bathymetry and cleaning of the existing culvert. The hydraulics of this alternative would be the same as for the proposed project s short-term change scenario.
Alternative 3
Recreation Alternative / No Open Channel, Develop a Parallel Culvert. This alternative is to retain and clean the existing culvert and construct a similar parallel underground culvert in order to increase tidal exchange. It does also include changes to the Lagoon s bathymetry.
Alternative 4
Alternative Channel Alignment. This alternative is similar to the proposed project long-term change, except that the alignment of the open channel is different and the channel is approximately 40 feet longer.
2.0 MODEL SELECTION AND DESCRIPTION
The numerical modeling systems used in this study are summarized in the following sections.
The TABS2 (McAnally and Thomas, 1985) modeling system was developed by the U.S. Army Corps of Engineers (USACE), and consists of two-dimensional, vertically averaged finite element hydrodynamics (RMA2), pollutant transport/water quality (RMA4) and sediment transport models (SED2D). TABS2 is a collection of generalized computer programs and pre- and post-processor utility codes integrated into a numerical modeling system for studying two-dimensional (2-D) depth-averaged hydrodynamics, transport and sedimentation problems in rivers, reservoirs, bays, and estuaries. The finite element method provides a means of obtaining an approximate solution to a system of governing equations by dividing the area of interest into smaller sub-areas called elements. Time-varying partial differential equations are transformed into finite element form and then solved in a global matrix system for the modeled area of interest. The solution is smooth across each element
Hydraulic Report 2 M&N 6431
and continuous over the computational area. This modeling system is capable of simulating tidal wetting and drying of marsh and intertidal areas of the estuarine system.
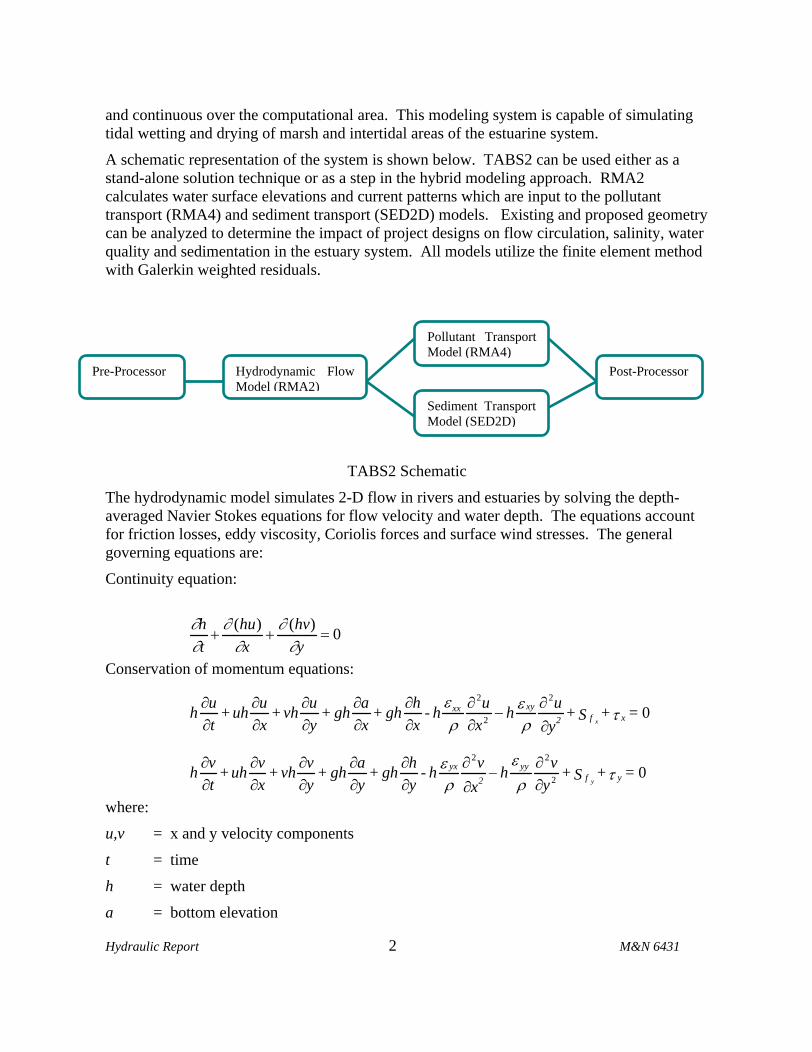
A schematic representation of the system is shown below. TABS2 can be used either as a stand-alone solution technique or as a step in the hybrid modeling approach. RMA2 calculates water surface elevations and current patterns which are input to the pollutant transport (RMA4) and sediment transport (SED2D) models. Existing and proposed geometry can be analyzed to determine the impact of project designs on flow circulation, salinity, water quality and sedimentation in the estuary system. All models utilize the finite element method with Galerkin weighted residuals.
TABS2 Schematic
The hydrodynamic model simulates 2-D flow in rivers and estuaries by solving the depth-averaged Navier Stokes equations for flow velocity and water depth. The equations account for friction losses, eddy viscosity, Coriolis forces and surface wind stresses. The general governing equations are:
Continuity equation:
Conservation of momentum equations:
where:
u,v = x and y velocity components
t = time
h = water depth
a = bottom elevation
Pollutant Transport Model (RMA4)
Sediment Transport Model (SED2D)
Pre-Processor
Hydrodynamic Flow Model (RMA2)
Post-Processor
0)()(
y
hv
x
hu
t
h
02
2
2
=+S+y
uh
x
uh-
x
hgh+
x
agh+
y
uvh+
x
uuh+
t
uh xf2
xyxxx
02
22
=+S+y
vh
x
vh-
y
hgh+
y
agh+
y
vvh+
x
vuh+
t
vh yf
yy
2
yx
y

Hydraulic Report 3 M&N 6431
Sfx = bottom friction loss term in x-direction
Sfy = bottom friction loss term in y-direction
x = wind and Coriolis stresses in x-direction
y = wind and Coriolis stresses in y-direction
xx = normal eddy viscosity in the x-direction on x-axis plane
xy = tangential eddy viscosity in the x-direction on y-axis plane
yx = tangential eddy viscosity in the y-direction on x-axis plane
yy = normal eddy viscosity in the y-direction on y-axis plane
For this project study, the RMA2 hydrodynamic model and RMA4 water quality model were applied.
3.0 MODEL SETUP
Setup for the tidal and flood hydraulic model for existing conditions included determination of the model area, bathymetry, mesh selection, and boundary conditions. The RMA2 model was originally set up for the Colorado Lagoon Feasibility Study (M&N, 2004). The model was updated to reflect the proposed dredged lagoon condition and the proposed tidal connections between the Lagoon and the Marine Stadium.
The purpose of this modeling study was primarily focused on comparisons of the proposed project and alternatives versus the existing condition. Pumping at two local power plants would affect the tidal conditions in the lagoon; however the pumping effects would be similar on the existing condition, proposed project and alternatives, and they are not included in the modeling. Storm flows were not modeled as this was not an objective of the study. However, flood control would not be adversely affected by the proposed project nor the alternatives and would probably even improve over the existing condition. The groundwater flow input into the lagoon was not considered in the modeling since the groundwater level in the vicinity is lower than that in the lagoon. The groundwater movement direction should be from the lagoon. Also, the groundwater movement compared to tidal exchange is negligible.
3.1 MODEL AREA The model area covers Alamitos Bay, Marine Stadium, Colorado Lagoon and nearshore ocean, as shown in Figure 1. The model mesh covers a relatively large area. The model s ocean boundary (at an average contour elevation of -45 feet relative to the NGVD29 vertical datum) is approximately one mile from the shoreline. The side boundaries are also approximately one mile northwest and southeast from the project site. Designating the open model boundaries far from the area of interest minimizes boundary effects.

Hydraulic Report 4 M&N 6431
Figure 1. Modeling Area
3.2 BATHYMETRY The Alamitos Bay and ocean bathymetry are based on data obtained from the National Oceanic and Atmospheric Administration (NOAA) chart 18749. The bathymetry of Colorado Lagoon and a portion of the Marine Stadium near the culvert connecting the Colorado Lagoon are based on a February 2004 survey by the Los Angeles County Department of Public Works (LACDPW). Design drawings and surveys of the culvert connecting Marine Stadium and the Colorado Lagoon were provided by the City of Long Beach. The flow through the culvert is simulated as a rating curve in the RMA2 model. The rating curve for the existing condition was calibrated during the model calibration (M&N 2004).
Figure 2 shows the bathymetry of the entire modeling domain. Figure 3 shows details of Colorado Lagoon for the proposed project and alternatives with bathymetry changes. The study uses the NAD 83 California Zone 6 horizontal coordinate system and the NGVD29 vertical datum. (NGVD29 is approximately 0.18 feet lower than Mean Sea Level of the latest tidal epoch for this area.) English units (feet, feet per second, etc.) are used throughout the model.

Hydraulic Report 5 M&N 6431
Figure 2. Bathymetry of the Entire Modeling Area

Hydraulic Report 6 M&N 6431
Figure 3. Bathymetry of the Colorado Lagoon
3.3 MODEL MESH The RMA2 model requires the estuarial system to be represented by a network of nodal points defined by coordinates in the horizontal plane and water depth, and elements created by connecting these adjacent points to form areas. Nodes can be connected to form 1- and 2-D elements, having from two to four nodes. The resulting nodal/element network is commonly called a finite element mesh and provides a computerized representation of the estuarial geometry and bathymetry. The results discussed herein correspond to 2-D analyses with the exception of the culverts leading to the Colorado Lagoon which are represented by 1-D elements.
The two most important aspects to consider when designing a finite element mesh are: (1) determining the level of detail necessary to adequately represent the estuary, and (2) determining the extent or coverage of the mesh. The model described in this section is numerically robust and capable of simulating tidal elevations, flows, and constituent transport

Hydraulic Report 7 M&N 6431
with reasonable resolution. Accordingly, the bathymetric features of the lagoon generally dictate the level of detail appropriate for the mesh.
There are several factors used to decide the aerial extent of a mesh. First, it is desirable to extend mesh open boundaries to areas which are sufficiently distant from the proposed areas of change so as to be unaffected by that change. Additionally, mesh boundaries must be located along sections where conditions can reasonably be measured and described to the model. Finally, mesh boundaries can be extended to an area where conditions have been previously collected to eliminate the need to interpolate between the boundary conditions from other locations.
The finite element mesh for the existing condition is shown in Figure 4. The mesh contains a section of ocean sufficiently large to eliminate potential model boundary effects. The lagoon portion of the mesh is bounded by the +5 foot contour relative to the vertical datum of NGVD29 considered to sufficiently contain the outermost extents of tidal and flood influence. The lagoon area mesh is shown in Figure 5.
The entire modeling area, approximately 5 square miles, is represented as a finite element mesh consisting of about 2,800 elements and 8,200 nodes.
Figure 4. Entire Numerical Modeling Mesh

Hydraulic Report 8 M&N 6431
Figure 5. Numerical Modeling Mesh of the Colorado Lagoon
3.4 BOUNDARY CONDITIONS 3.4.1 Ocean Tides Since there are no tide stations in Alamitos Bay, the Los Angeles Outer Harbor tide gage was used to define the ocean boundary tidal condition. These recorded water levels, relative to both MLLW and NGVD29 datums, are shown in Table 1. The diurnal tide range from Mean Lower Low Water (MLLW) to Mean Higher High Water (MHHW) is approximately 5.49 feet. Mean Sea Level (MSL) is at +2.82 feet relative to MLLW.
Table 1. Recorded Water Levels at Los Angeles Outer Harbor (1983-2001 Tidal Epoch)
Description Elevation (feet, MLLW)
Elevation (feet, NGVD29)
Extreme High Water (1/27/83) +7.82 +5.18
Mean Higher High Water (MHHW) +5.49 +2.85
Mean High Water (MHW) +4.75 +2.11
Mean Tidal Level (MTL) +2.85 0.21
Mean Sea Level (MSL) +2.82 0.18
National Geodetic Vertical Datum 1929 (NGVD29) +2.64 0.00
Mean Low Water (MLW) +0.94 -1.70
Mean Lower Low Water (MLLW) 0.00 -2.64
Extreme Low Water (12/17/33) -2.73 -5.37

Hydraulic Report 9 M&N 6431
Water level measurement data provide astronomical tides and other components including barometric pressure tide, wind setup, seiche, and the El Nino Southern Oscillation. Tidal variations can be resolved into a number of sinusoidal components having discrete periods. The longest significant periods, called tidal epochs, are approximately 19 years. In addition, seasonal variations in MSL can reach amplitudes of 0.5 feet in some areas, such as Los Angeles Outer Harbor. Superimposed on this cycle is a 4.4-year variation in the MSL that may increase the amplitude by as much as 0.25 feet in San Pedro Bay. Water level measurement data are typically analyzed over a tidal epoch to account for these variations and obtain statistical water level information (e.g., MLLW and MHHW).
3.4.2 Parametric Mean Periodic (PMP) Tidal Series A synthetic tidal series, referred to as a parametric mean periodic (PMP) tide developed by M&N (1994b), is used to simulate long-term average water levels for determining residence times (RMA4 analysis). The series matches the mean water levels (i.e., MHHW, MLLW, etc.) and phase differences of the existing tidal epoch. This provides short duration (days) tidal conditions similar to the 19-year tidal epoch as shown in Figure 6 to reduce modeling time while still generating accurate results.
-4
-3
-2
-1
0
1
2
3
4
0 6 12 18 24 30 36 42 48 54 60 66 72
Time (hours)
Tid
al E
leva
tions
(ft,
NG
VD
29)
Figure 6. Parametric Mean Periodic (PMP) Tidal Series
3.4.3 Tidal Epoch Analysis (TEA) Tidal Series The TEA tide is a synthetic 14-day tidal series developed statistically to match the cumulative distribution of water levels over a 19-year tidal epoch (1960-1978). The TEA tide includes both spring and neap tidal ranges shown in Figure 7. The largest 3-day spring tide period

Hydraulic Report 10 M&N 6431
inside the red rectangular box in Figure 7 was selected to evaluate tidal muting in the Colorado Lagoon under the existing, proposed and alternative project conditions (RMA2 analysis). This spring tide period represents the average spring tidal condition in the ocean. In this area, spring tide ranges in mid-summer (July/August) and mid-winter (December/January) are usually larger than the average spring tidal range.
-5.0
-4.0
-3.0
-2.0
-1.0
0.0
1.0
2.0
3.0
4.0
5.0
0 24 48 72 96 120 144 168 192 216 240 264 288 312 336 360
Time (hours)
Tid
al E
leva
tion
(ft,
NG
VD
27)
Figure 7. Tidal Epoch Analysis (TEA) Tidal Series
3.5 MODEL CALIBRATION RMA2 calibration involves matching model predictions with measured data by selecting appropriate input variable values to model [e.g., Manning s roughness coefficient (n), and turbulence exchange coefficients (eddy viscosity)].
The RMA2 User s Manual recommends ranges of values for Manning s roughness coefficient (n) and eddy viscosity to be used in the model (USACE WES, 1996b). The value of Manning s roughness coefficient (n) is a function of the characteristics of the hydraulic system and represents the roughness of the channel bed. As discussed in Chaudhry (1993), values can range from 0.011 to 0.075 or higher for natural rivers and estuaries. Relatively high values (0.04 to 0.05) are specified for rough surfaces, such as channels with cobbles or large boulders. Mid-range values (0.03) represent clean and straight natural streams. Low values (0.013 to 0.02) are specified for smooth surfaces, such as concrete, cement, wood, or gunite. Values of Manning s roughness coefficient (n) used for this analysis are in the middle range of the recommended values.

Hydraulic Report 11 M&N 6431
Eddy viscosity represents the degree of turbulence in the flow. In this application, the values range from 50 to 300 lb-sec/ft2. The modeling grid size depends on and is limited by the
Peclet number and eddy viscosity. The Peclet number is defined as ijE
XV, in which , V,
X, and Eij are the water density, velocity, grid size and eddy viscosity, respectively. In order for the solution to be stable, the Peclet number has to be less than 50. The Peclet number can be reduced by increasing the mesh density or by increasing the eddy viscosity. However, it is unrealistic and time-consuming to perform the modeling with a very fine grid. Therefore, a relatively high value of eddy viscosity is used in order to preserve numerical stability, and to streamline the modeling efforts.
The detailed model calibration was carried out in the feasibility study (M&N 2004). The RMA model is relative robust and is not very sensitive to the roughness and eddy viscosity parameters. The modeling parameters used in this study are presented in Table 2.
Table 2. Setup Values for Model Calibration
Model Area Manning s Roughness Coefficient (n)
Eddy Viscosity Coefficient (lb-sec/ft2)
Lagoon Intertidal Areas 0.037 300
Lagoon Subtidal Areas 0.035 150
Marine Stadium Intertidal Areas 0.035 120
Narrow Channels and Marinas 0.025 50
Marine Stadium Subtidal & Alamitos Bay Areas 0.025 150
Nearshore Surf Zone 0.025 250
Offshore from surf Zone 0.03 250
The time step is a very important parameter in the modeling. Sensitivity tests were conducted and results showed that the RMA2 model becomes unstable with an increasing time step if the wetting and drying processes are considered. A time step of 0.1 hour was used in order for the solution to be stable and to reflect the dynamic tidal fluctuations.
4.0 TIDAL HYDRAULICS MODELING RESULTS
The calibrated RMA2 numerical model was applied to evaluate tidal range under the average spring tidal condition for the existing, proposed and alternative project scenarios. The tidal series in the Colorado Lagoon south end, shown in Figure 8, under proposed project and alternative conditions are compared with that in the ocean. The gage locations shown in Figure 8, where modeling results were extracted, are fixed, although the connection between the lagoon and Marine Stadium varies from alternative to alternative. (Both the Colorado Lagoon South End and the Marine Stadium Northwest End gage locations were used for the residence time analysis).

Hydraulic Report 12 M&N 6431
Colorado Lagoon(South End)
Marine Stadium(Northwest End)
Figure 8. Modeling Output Gage Locations
The tidal range, high tide muting, low tide muting and low tide phase lag in the lagoon comparing with those in the ocean are summarized in tables and figures below. The high tide muting is calculated by subtracting the highest ocean tide by the highest lagoon tide, and a positive number indicates the lagoon high tide is muted. The low tide muting is calculated by subtracting the lowest ocean tide by the lowest lagoon tide, and a negative number indicates the lagoon tide is truncated. The low tide phase lag is the lag time of the low tide in the lagoon comparing with that in the ocean.
For the scenarios with the dredged Lagoon bathymetry (proposed project and all alternatives), the revised bathymetry creates a larger Lagoon tidal prism and thus tends to further mute the tidal range versus the existing condition tidal range. However, the relative effect of the revised bathymetry is probably small in proportion to the tidal condition changes resulting from the changes to the tidal connection.
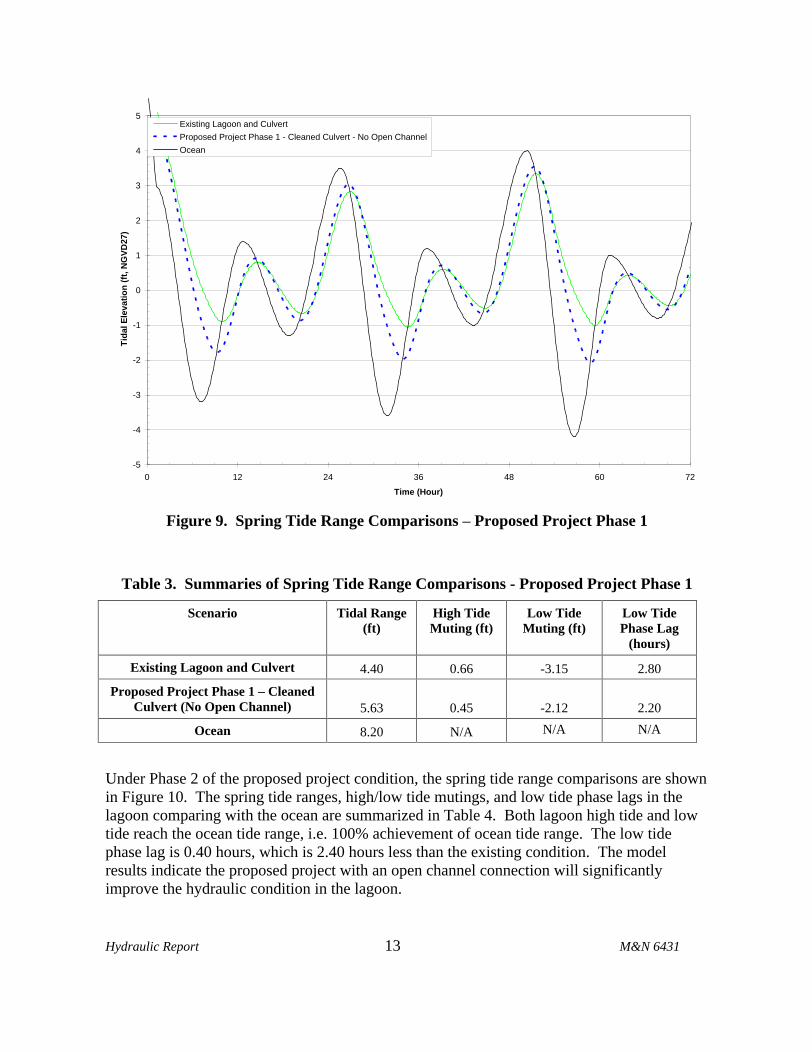
Under Phase 1 of the proposed project condition, the spring tide range comparisons are shown in Figure 9. Table 3 summarizes the spring tide ranges, high/low tide mutings and low tide phase lags in the lagoon compared with the ocean. Both high and low tides are muted under both the existing and proposed project Phase 1 conditions. Under the existing condition, the spring tide range is 4.4 ft, which is only about 54% of the ocean tide range. Under the proposed project Phase 1 condition, the muting is less than that under the existing condition (tide range of about 69% of the ocean tide range); however, it is still very significant with a low tide muting of 2.12 ft and a phase lag of 2.2 hours.
Hydraulic Report 13 M&N 6431
-5
-4
-3
-2
-1
0
1
2
3
4
5
0 12 24 36 48 60 72
Time (Hour)
Tid
al E
leva
tio
n (
ft, N
GV
D27
)Existing Lagoon and Culvert
Proposed Project Phase 1 - Cleaned Culvert - No Open Channel
Ocean
Figure 9. Spring Tide Range Comparisons Proposed Project Phase 1
Table 3. Summaries of Spring Tide Range Comparisons - Proposed Project Phase 1
Scenario Tidal Range (ft)
High Tide Muting (ft)
Low Tide Muting (ft)
Low Tide Phase Lag
(hours)
Existing Lagoon and Culvert 4.40 0.66 -3.15 2.80
Proposed Project Phase 1 Cleaned Culvert (No Open Channel) 5.63 0.45 -2.12 2.20
Ocean 8.20 N/A N/A N/A
Under Phase 2 of the proposed project condition, the spring tide range comparisons are shown in Figure 10. The spring tide ranges, high/low tide mutings, and low tide phase lags in the lagoon comparing with the ocean are summarized in Table 4. Both lagoon high tide and low tide reach the ocean tide range, i.e. 100% achievement of ocean tide range. The low tide phase lag is 0.40 hours, which is 2.40 hours less than the existing condition. The model results indicate the proposed project with an open channel connection will significantly improve the hydraulic condition in the lagoon.

Hydraulic Report 14 M&N 6431
-5
-4
-3
-2
-1
0
1
2
3
4
5
0 12 24 36 48 60 72
Time (Hour)
Tid
al E
leva
tio
n (
ft, M
SL
)Existing Lagoon and CulvertProposed Project Phase 1 - Cleaned Culvert - No Open ChannelProposed Project Phase 2 - With Open ChannelOcean
Figure 10. Spring Tide Range Comparisons - Proposed Project Phase 2
Table 4. Summaries of Spring Tide Range Comparisons - Proposed Project Phase 2
Scenario Tidal Range (ft)
High Tide Muting (ft)
Low Tide Muting (ft)
Low Tide Phase Lag
(hours)
Existing Lagoon and Culvert 4.40 0.66 -3.15 2.80
Proposed Project Phase 1 Cleaned Culvert (No Open Channel) 5.63 0.45 -2.12 2.20
Proposed Project Phase 2 With Open Channel 8.20 0.00 0.00 0.40
Ocean 8.20 N/A N/A N/A
Two hydraulically-different alternatives were analyzed. Figure 11 shows the tide range comparisons between the existing condition and proposed project and alternatives. The spring tide ranges, high/low tide mutings, and low tide phase lags in the lagoon comparing with the ocean are summarized in Table 5. The hydraulic performance of Alternative 4 is very similar to that of the proposed project Phase 2, and that of Alternative 3 is between Phase 1 and Phase 2 of the proposed project. The phase lag of Alternative 4 is very similar to that under the proposed project condition, or the difference is within the model time step of 0.1 hours.

Hydraulic Report 15 M&N 6431
-5
-4
-3
-2
-1
0
1
2
3
4
5
0 12 24 36 48 60 72Time (Hour)
Tid
al E
leva
tio
n (
ft, N
GV
D27
)Existing Lagoon and CulvertProposed Project Phase 1 - Cleaned Culvert - No Open ChannelProposed Project Phase 2 - With Open ChannelOceanAlt3 - Two Parallel CulvertsAlt4 - With Alternative Open Channel Alignment
Figure 11. Spring Tide Range Comparisons - Alternatives
Table 5. Summaries of Spring Tide Range Comparisons - Alternatives
Scenario Tidal Range (ft)
High Tide Muting (ft)
Low Tide Muting (ft)
Low Tide Phase Lag (hours)
Existing Lagoon and Culvert 4.40 0.66 -3.15 2.80
Proposed Project Phase 1 Cleaned Culvert (No Open Channel) 5.63 0.45 -2.12 2.20
Proposed Project Phase 2
With Open Channel 8.20 0.00 0.00 0.40
Alt3 Two Parallel Culverts 7.29 0.05 -0.87 1.40
Alt4 With Alternative Open Channel Alignment 8.20 0.00 0.00 0.40
Ocean 8.20 N/A N/A N/A

Hydraulic Report 16 M&N 6431
5.0 RESIDENCE TIME ANALYSIS
5.1 METHDOLOGY DESCRIPTION Constituent concentrations in a water body reflect a balance between the rate of constituent supply and the rate of constituent removal by tidal flushing. Residence time (i.e., average time a particle resides in a hydraulic system) provides a useful measure of the rate at which water in the hydraulic system is renewed. Accordingly, residence time provides a means for indirectly assessing the water quality of a hydraulic system.
Consider the reduction of a tracer concentration in a tidal embayment due to flushing after being released (Fischer et al., 1979), in which C0 is initial concentration, K is a reduction coefficient and C(t) is the concentration at time t.
KteCtC 0)(
The residence time of the tracer in the embayment is determined from
KdttC
dttCtTr
1
)(
)(
0
0 .
Since the concentration at t = Tr is
e
CeCTC r
010)(
Tr can be calculated from a regression analysis of the tracer concentration time series computed by the numerical model RMA4.
Based on the above methodology, the general procedure of computing the residence times for different parts of a tidal embayment is as follows:
Assign an initial tracer concentration of one over the entire embayment (entire bay for this study) and a value of zero at the open water boundaries to simulate an instantaneous release of a contaminant in an embayment;
Run the numerical model RMA4 for an adequate number of tidal cycles until substantial reductions of tracer concentrations have occurred due to tidal flushing at the locations of interest;
Analyze the computed concentration results by regression analysis to obtain the tracer reduction distributions at the locations of interest; and
Find the residence times for the locations of interest from the distribution curves.
5.2 RESIDENCE TIME MODELING RESULTS Water surface elevations and current patterns simulated by the RMA2 hydrodynamic model were input to the pollutant transport RMA4 model to estimate water residence times. As there are no data and budget available for RMA4 model calibration, the modeling parameters used were based on literature and past similar project experiences. Two power plants, namely the AES power plant and Haynes power plant, intake cooling water from Alamitos Bay and
Hydraulic Report 17 M&N 6431
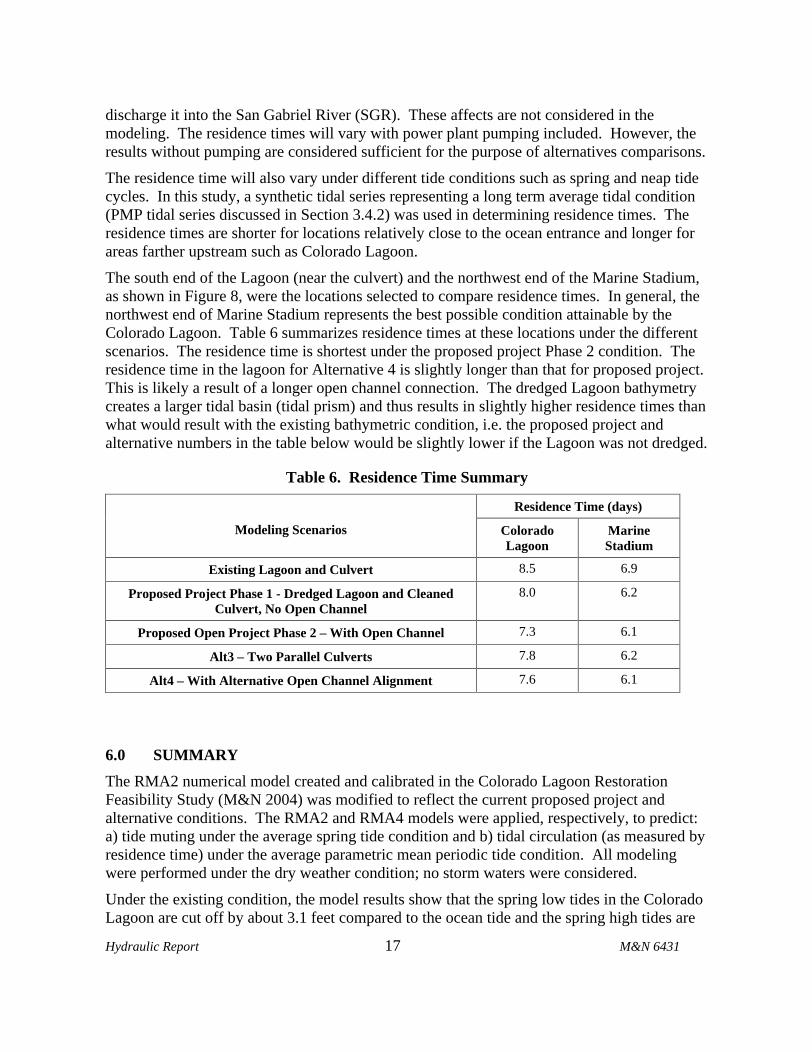
discharge it into the San Gabriel River (SGR). These affects are not considered in the modeling. The residence times will vary with power plant pumping included. However, the results without pumping are considered sufficient for the purpose of alternatives comparisons.
The residence time will also vary under different tide conditions such as spring and neap tide cycles. In this study, a synthetic tidal series representing a long term average tidal condition (PMP tidal series discussed in Section 3.4.2) was used in determining residence times. The residence times are shorter for locations relatively close to the ocean entrance and longer for areas farther upstream such as Colorado Lagoon.
The south end of the Lagoon (near the culvert) and the northwest end of the Marine Stadium, as shown in Figure 8, were the locations selected to compare residence times. In general, the northwest end of Marine Stadium represents the best possible condition attainable by the Colorado Lagoon. Table 6 summarizes residence times at these locations under the different scenarios. The residence time is shortest under the proposed project Phase 2 condition. The residence time in the lagoon for Alternative 4 is slightly longer than that for proposed project. This is likely a result of a longer open channel connection. The dredged Lagoon bathymetry creates a larger tidal basin (tidal prism) and thus results in slightly higher residence times than what would result with the existing bathymetric condition, i.e. the proposed project and alternative numbers in the table below would be slightly lower if the Lagoon was not dredged.
Table 6. Residence Time Summary
Residence Time (days)
Modeling Scenarios Colorado Lagoon
Marine Stadium
Existing Lagoon and Culvert 8.5 6.9
Proposed Project Phase 1 - Dredged Lagoon and Cleaned Culvert, No Open Channel
8.0 6.2
Proposed Open Project Phase 2 With Open Channel 7.3 6.1
Alt3 Two Parallel Culverts 7.8 6.2
Alt4 With Alternative Open Channel Alignment 7.6 6.1
6.0 SUMMARY
The RMA2 numerical model created and calibrated in the Colorado Lagoon Restoration Feasibility Study (M&N 2004) was modified to reflect the current proposed project and alternative conditions. The RMA2 and RMA4 models were applied, respectively, to predict: a) tide muting under the average spring tide condition and b) tidal circulation (as measured by residence time) under the average parametric mean periodic tide condition. All modeling were performed under the dry weather condition; no storm waters were considered.
Under the existing condition, the model results show that the spring low tides in the Colorado Lagoon are cut off by about 3.1 feet compared to the ocean tide and the spring high tides are
Hydraulic Report 18 M&N 6431
muted about 0.7 feet. The existing residence time in the lagoon, for the model conditions, is approximately 1.6 days longer than that at the northwest end of the Marine Stadium. The tidal fluctuations at Marine Stadium are very similar to the ocean, thus indicating the culvert is the restriction on lagoon circulation.
Under the proposed project Phase 1 (Lagoon dredged plus cleaned culvert), the spring low tide is cut off by approximately 2.1 feet compared to the ocean tide, i.e. about one foot less muting than that under the existing condition. The spring high tide elevation in the lagoon is also muted less. The Lagoon residence time for the phase 1 proposed project is approximately 0.5 days shorter than for the existing condition. Residence time in the Marine Stadium is also improved under this scenario.
Under the proposed project Phase 2 (Lagoon dredged plus open channel connection), both spring high and low tides in the lagoon reach the ocean tide range. The Lagoon residence time is approximately 1.2 days shorter than for the existing condition. Residence time in the Marine Stadium is also improved.
Under the alternative conditions, both the tidal circulation and residence time fall between the proposed project Phase 1 and Phase 2. The lagoon s residence time in Alternative 4 is slightly longer than that under the proposed project Phase 2 condition since the Alternative 4 open channel alignment is about 40 feet longer than that of the proposed project.
7.0 REFERENCES
Edwards, Jeff, City of Long Beach, Dept. of Parks and Recreation & Marine, Marine Maintenance Superintendent, personal communication with K. Garvey, June & July 2004.
Johnson, George, Moffatt & Nichol, former City of Long Beach employee, personal communication with W. Jin, July 2004.
Los Angeles County Department of Public Works (LACDPW), Final Initial Study and Responses to Comments In Determination of a Mitigated Negative Declaration - Termino Avenue Drain Project, County of Los Angeles, February 2001,
LACDPW, Termino Avenue Drain (Project No. 5152)
Hydrology Phase 2 , Reza Izadi, Water Resources Division, County of Los Angeles, March 3, 2003.
McAnally, W.H. and Thomas, W.A., Shear Stress Computations in a Numerical Model for Estuarine Sediment Transport, Memorandum for Record, U.S. Army Corps of Engineers Waterways Experiment Station, Vicksburg, MS, 1980.
Moffatt & Nichol Engineers, Tidal Hydraulics, Flood Flow Hydraulics and Water Quality Assessment for the Proposed Wetlands Restoration Plan at Bolsa Chica, Prepared for the Koll Real Estate Group, January 1994b.

Hydraulic Report 19 M&N 6431
Moffatt & Nichol, Colorado Lagoon Restoration Physical Study, Prepared for the City of Long Beach, 2004.
National Oceanic and Atmospheric Administration (NOAA), Oceanographic Products and Service Diversion, Web site: http://www.co-ops.nos.noaa.gov/tide_pred.html, 2004.
NOAA Chart 18749, U.S. West Coast California, San Pedro Bay, 37th Edition, November 18, 2000.

L S A A S S O C I A T E S , I N C . D R A F T E N V I R O N M E N T A L I M P A C T R E P O R T M A Y 2 0 0 8 C O L O R A D O L A G O O N R E S T O R A T I O N P R O J E C T C I T Y O F L O N G B E A C H
P:\CLB0702\DEIR\Appendices.doc (05/05/08)
APPENDIX H
NOISE IMPACT ANALYSIS

NO I S E I M P ACT A N A L Y S I S
COLORADO LAGOON RESTORATION PROJECT
LONG BEACH, CALIFORNIA
May 2008

NO I S E I M P ACT A N A L Y S I S
COLORADO LAGOON RESTORATION PROJECT
LONG BEACH, CALIFORNIA
Prepared by:
LSA Associates, Inc.
20 Executive Park, Suite 200
Irvine, California 92614-4731
(949) 553-0666
LSA Project No. CLB0702
May 2008

P:\CLB0702\Air and Noise Tech Studies\Noise1.doc «05/09/08» i
TABLE OF CONTENTS
INTRODUCTION.................................................................................................................................. 1 PROJECT LOCATION ............................................................................................................... 1 PROJECT OBJECTIVES ............................................................................................................ 3 PROJECT COMPONENTS......................................................................................................... 4 PROJECT PHASING ................................................................................................................ 17 METHODOLOGY RELATED TO NOISE IMPACT ASSESSMENT.................................... 18 CHARACTERISTICS OF SOUND .......................................................................................... 18
SETTING ............................................................................................................................................. 23 SENSITIVE LAND USES IN THE PROJECT VICINITY...................................................... 23 OVERVIEW OF THE EXISTING NOISE ENVIRONMENT ................................................. 23 THRESHOLDS OF SIGNIFICANCE....................................................................................... 23
IMPACTS AND MITIGATION MEASURES.................................................................................... 25 SHORT-TERM CONSTRUCTION-RELATED IMPACTS..................................................... 25 LONG-TERM NOISE IMPACTS............................................................................................. 28 MITIGATION MEASURES ..................................................................................................... 28
REFERENCES..................................................................................................................................... 30
FIGURES
Figure 1: Project Location...................................................................................................................... 2 Figure 2: Existing Conditions................................................................................................................. 6 Figure 3: Water and Sediment Quality Improvements......................................................................... 11 Figure 4: Habitat Improvements........................................................................................................... 13 Figure 5: Recreational Improvements .................................................................................................. 14
TABLES
Table A: Definitions of Acoustical Terms ........................................................................................... 20 Table B: Common Sound Levels and Their Noise Sources ................................................................. 21 Table C: Land Use Compatibility for Exterior Community Noise....................................................... 22 Table D: Exterior Noise Limits, LN (dBA) ........................................................................................... 24 Table E: Maximum Interior Sound Levels, LN (dBA).......................................................................... 24 Table F: Typical Construction Equipment Noise Levels ..................................................................... 26
L S A A S S O C I A T E S , I N C .L S A A S S O C I A T E S , I N C .L S A A S S O C I A T E S , I N C .L S A A S S O C I A T E S , I N C . N O I S E I M P A C TN O I S E I M P A C TN O I S E I M P A C TN O I S E I M P A C T A N A L Y S I S A N A L Y S I S A N A L Y S I S A N A L Y S I S M A Y M A Y M A Y M A Y 2 0 0 82 0 0 82 0 0 82 0 0 8 C O L O R A D O L A GO ON R E S TC O L O R A D O L A GO ON R E S TC O L O R A D O L A GO ON R E S TC O L O R A D O L A GO ON R E S T O R A T I O N P R O J E C TO R A T I O N P R O J E C TO R A T I O N P R O J E C TO R A T I O N P R O J E C T
P:\CLB0702\Air and Noise Tech Studies\Noise1.doc «05/09/08» 1
INTRODUCTION
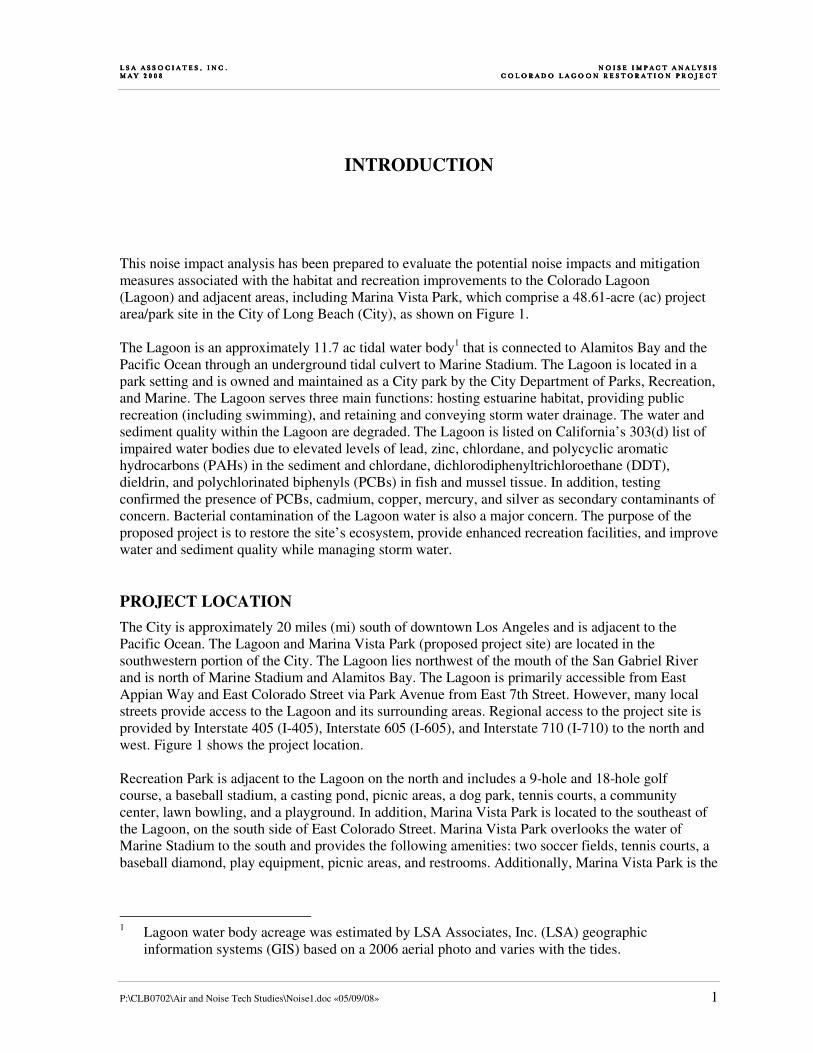
This noise impact analysis has been prepared to evaluate the potential noise impacts and mitigation
measures associated with the habitat and recreation improvements to the Colorado Lagoon
(Lagoon) and adjacent areas, including Marina Vista Park, which comprise a 48.61-acre (ac) project
area/park site in the City of Long Beach (City), as shown on Figure 1.
The Lagoon is an approximately 11.7 ac tidal water body1 that is connected to Alamitos Bay and the
Pacific Ocean through an underground tidal culvert to Marine Stadium. The Lagoon is located in a
park setting and is owned and maintained as a City park by the City Department of Parks, Recreation,
and Marine. The Lagoon serves three main functions: hosting estuarine habitat, providing public
recreation (including swimming), and retaining and conveying storm water drainage. The water and
sediment quality within the Lagoon are degraded. The Lagoon is listed on California’s 303(d) list of
impaired water bodies due to elevated levels of lead, zinc, chlordane, and polycyclic aromatic
hydrocarbons (PAHs) in the sediment and chlordane, dichlorodiphenyltrichloroethane (DDT),
dieldrin, and polychlorinated biphenyls (PCBs) in fish and mussel tissue. In addition, testing
confirmed the presence of PCBs, cadmium, copper, mercury, and silver as secondary contaminants of
concern. Bacterial contamination of the Lagoon water is also a major concern. The purpose of the
proposed project is to restore the site’s ecosystem, provide enhanced recreation facilities, and improve
water and sediment quality while managing storm water.
PROJECT LOCATION
The City is approximately 20 miles (mi) south of downtown Los Angeles and is adjacent to the
Pacific Ocean. The Lagoon and Marina Vista Park (proposed project site) are located in the
southwestern portion of the City. The Lagoon lies northwest of the mouth of the San Gabriel River
and is north of Marine Stadium and Alamitos Bay. The Lagoon is primarily accessible from East
Appian Way and East Colorado Street via Park Avenue from East 7th Street. However, many local
streets provide access to the Lagoon and its surrounding areas. Regional access to the project site is
provided by Interstate 405 (I-405), Interstate 605 (I-605), and Interstate 710 (I-710) to the north and
west. Figure 1 shows the project location.
Recreation Park is adjacent to the Lagoon on the north and includes a 9-hole and 18-hole golf
course, a baseball stadium, a casting pond, picnic areas, a dog park, tennis courts, a community
center, lawn bowling, and a playground. In addition, Marina Vista Park is located to the southeast of
the Lagoon, on the south side of East Colorado Street. Marina Vista Park overlooks the water of
Marine Stadium to the south and provides the following amenities: two soccer fields, tennis courts, a
baseball diamond, play equipment, picnic areas, and restrooms. Additionally, Marina Vista Park is the
1 Lagoon water body acreage was estimated by LSA Associates, Inc. (LSA) geographic
information systems (GIS) based on a 2006 aerial photo and varies with the tides.

I:\CLB0702\G\Location2 fig1.cdr (4/7/08)
N
FEET
FIGURE 1
Project Location
PROJECT AREA
Colorado Lagoon Restoration Project200010000
SOURCE: Thomas Guide, 2007
105
Los AngelesCounty
OrangeCounty
710
1
5
605
91
22
405
405
COLORADO AVENUECOLORADO AVENUE
7TH STREET7TH STREET
PA
RK
AV
EN
UE
PA
RK
AV
EN
UE
PROJECT
LOCATION
COLORADO
LAGOON
COLORADO
LAGOON
MARINA VISTA
PARK
MARINA VISTA
PARK
BIXBY
VILLAGE
GOLF COURSE
BIXBY
VILLAGE
GOLF COURSE
EL OI T ST.EL OI T ST.

L S A A S S O C I A T E S , I N C .L S A A S S O C I A T E S , I N C .L S A A S S O C I A T E S , I N C .L S A A S S O C I A T E S , I N C . N O I S E I M P A C TN O I S E I M P A C TN O I S E I M P A C TN O I S E I M P A C T A N A L Y S I S A N A L Y S I S A N A L Y S I S A N A L Y S I S M A Y M A Y M A Y M A Y 2 0 0 82 0 0 82 0 0 82 0 0 8 C O L O R A D O L A GO ON R E S TC O L O R A D O L A GO ON R E S TC O L O R A D O L A GO ON R E S TC O L O R A D O L A GO ON R E S T O R A T I O N P R O J E C TO R A T I O N P R O J E C TO R A T I O N P R O J E C TO R A T I O N P R O J E C T
P:\CLB0702\Air and Noise Tech Studies\Noise1.doc «05/09/08» 3
site of municipal band concerts in the summer. Both Recreation Park and Marina Vista Park are
owned and operated by the City Department of Parks, Recreation, and Marine. Residences and public
schools surround the other portions of the Lagoon. The proposed project includes improvements
within Marina Vista Park.
The Colorado Lagoon Playgroup Preschool, which is a program for three- to five-year-old children,
and a model boat shop are located on the south side of the Lagoon. Other on-site facilities include the
City’s Colorado Lagoon Marine Science Center, which is staffed by the City and Friends of the
Lagoon (FOCL), restrooms, parking, a pedestrian bridge, a lifeguard station, sandy shoreline areas,
play equipment, picnic areas, and grassy open-space areas.
PROJECT OBJECTIVES
Pursuant to Section 15124 of the California Environmental Quality Act (CEQA) Guidelines, the
description of the proposed project contains a statement of the objectives sought for development of
the proposed project.
The Lagoon Restoration Project is a comprehensive plan for enhancement of the Lagoon, which is
owned and maintained by the City Department of Parks, Recreation, and Marine. The City is
committed to preserving and improving the open space, recreational resource, and biodiversity that
this area provides. The primary goals of the proposed project are to: (1) create habitat that can
successfully establish and support native plant and animal communities in the long term,
(2) implement long-term water quality control measures, and (3) enhance the Lagoon’s value as a
recreational resource. The proposed project provides a framework to coordinate these various and
potentially competing interests.
Specifically, the objectives of the proposed project are to:
• Reduce and treat storm and dry weather runoff to minimize contamination of water and sediment
in the Lagoon.
• Improve water quality by increasing the Lagoon’s circulation and enhancing the tidal connection
with Marine Stadium.
• Improve water quality by removing contaminated sediments.
• Restore and maintain the estuarine habitats.
• Balance flood control, water quality, and the recreation demands of the Lagoon.
• Enhance public enjoyment of the Lagoon.
The project objectives listed above are intended to implement the following goals, objectives, and
policies of the City’s Open Space and Recreation Element of the General Plan and the Long Beach
Department of Parks, Recreation, and Marine Strategic Plan:

L S A A S S O C I A T E S , I N C .L S A A S S O C I A T E S , I N C .L S A A S S O C I A T E S , I N C .L S A A S S O C I A T E S , I N C . N O I S E I M P A C TN O I S E I M P A C TN O I S E I M P A C TN O I S E I M P A C T A N A L Y S I S A N A L Y S I S A N A L Y S I S A N A L Y S I S M A Y M A Y M A Y M A Y 2 0 0 82 0 0 82 0 0 82 0 0 8 C O L O R A D O L A GO ON R E S TC O L O R A D O L A GO ON R E S TC O L O R A D O L A GO ON R E S TC O L O R A D O L A GO ON R E S T O R A T I O N P R O J E C TO R A T I O N P R O J E C TO R A T I O N P R O J E C TO R A T I O N P R O J E C T
P:\CLB0702\Air and Noise Tech Studies\Noise1.doc «05/09/08» 4
• Develop well-managed, viable ecosystems that support the preservation and enhancement of
natural and wildlife habitats (Open Space and Recreation Element, Goals/Objectives 1.1).
• Preserve, keep clean, and upgrade beaches, bluffs, water bodies and natural habitats (Open Space
and Recreation Element, Goals/Objectives 1.2).
• Design and manage natural habitats to achieve environmental sustainability (Open Space and
Recreation Element, Goals/Objectives 1.4).
• Promote the creation of new and reestablished natural habitats and ecological preserves, including
wetlands, woodlands, native plant communities, and artificial reefs (Open Space and Recreation
Element, Policy 1.1).
• Protect and improve the community’s natural resources, amenities, and scenic values, including
nature centers, beaches, bluffs, wetlands, and water bodies (Open Space and Recreation Element,
Policy 1.2).
• Promote and assist with the remediation of contaminated sites (Open Space and Recreation
Element, Policy 1.4).
• Restore Lagoon to serve as both a productive wetland habitat and recreational resource by
reducing pollutant discharges into the water, increasing water circulation with Alamitos Bay,
and/or restocking or planting appropriate biological species (Open Space and Recreation Element,
Program 1.6).
• Maintain a sufficient quantity and quality of open space in the City to produce and manage
natural resources (Open Space and Recreation Element, Goals/Objectives 2.1).
• Preserve, enhance, and manage open areas to sustain and support marine life habitats (Open
Space and Recreation Element, Policy 2.4).
• Make all recreation resources environmentally friendly and socially and economically sustainable
(Open Space and Recreation Element, Goals/Objectives 4.5).
• Establish lifetime use opportunities. Recreation programs and facilities will be designed to
develop and serve a lifetime user through active, passive, and educational experiences
(Department of Parks, Recreation, and Marine Strategic Plan, Strategy 9, page 62).
• The Department of Parks, Recreation, and Marine should be a steward for preserving the
environmental, cultural, and historical resources in the City (Department of Parks, Recreation,
and Marine Strategic Plan, Strategy 11, page 63).
• Support efforts to improve the water quality and cleanliness of City beach areas (Department of
Parks, Recreation, and Marine Strategic Plan, Strategy 13, page 66).
PROJECT COMPONENTS
Improvements Benefiting Water and Sediment Quality
Improved water and sediment quality would enhance recreational opportunities at the Lagoon, may
lead to a more diverse invertebrate and fish community, and would increase the potential for the
Lagoon to support a variety of plant and animal species.

L S A A S S O C I A T E S , I N C .L S A A S S O C I A T E S , I N C .L S A A S S O C I A T E S , I N C .L S A A S S O C I A T E S , I N C . N O I S E I M P A C TN O I S E I M P A C TN O I S E I M P A C TN O I S E I M P A C T A N A L Y S I S A N A L Y S I S A N A L Y S I S A N A L Y S I S M A Y M A Y M A Y M A Y 2 0 0 82 0 0 82 0 0 82 0 0 8 C O L O R A D O L A GO ON R E S TC O L O R A D O L A GO ON R E S TC O L O R A D O L A GO ON R E S TC O L O R A D O L A GO ON R E S T O R A T I O N P R O J E C TO R A T I O N P R O J E C TO R A T I O N P R O J E C TO R A T I O N P R O J E C T
P:\CLB0702\Air and Noise Tech Studies\Noise1.doc «05/09/08» 5
Clean Culvert and Remove Tidal Gates, Sill, and Other Structural Impedances. This is a short-
term project component that would be superseded by development of the open-channel component, as
described later in this Section.
Currently, the Lagoon is connected to Marine Stadium via an underground box culvert under Marina
Vista Park. The culvert is approximately 900 feet (ft) long and provides tidal exchange between the
Lagoon and Marine Stadium. The cross-section of the culvert is not constant throughout its
length. The opening on the Lagoon side is 14 ft wide by 7 ft high, and the opening on the marine
stadium side is 12 ft wide by 8 ft high. The existing culvert location and length are shown in Figure 2.
The existing culvert design and degraded condition is limiting the amount of tidal flushing between
Marine Stadium and the Lagoon, which contributes to the Lagoon’s water quality problem. Measured
tide data shows that spring low tides in the Lagoon are perched above those of Marine Stadium and
the ocean by approximately 3 ft. This indicates that something in the culvert restricts the low tide
elevation from dropping below a certain level. There is also a tidal time lag between the Marine
Stadium and the Lagoon, which further indicates a reduction in tidal exchange.
The existing culvert has not been cleaned since it was built in the 1960s. Because of this, the culvert
is impeded by sediment that has accumulated on the bottom, extensive marine growth that has
accumulated on the sides and ceiling, and debris that is trapped within the trash racks on the tide gate
screens at both ends of the culvert. The culvert was most recently inspected via a dive survey in 2005,
which covered the entire length of the culvert, and measurements were taken every 50 ft. The amount
of sediment buildup on the floor ranged from 9 to 30 inches (in) along the length of the culvert and
was mainly clam and mussel growth with some sand mixed in. The side walls had up to 3 in of soft
and hard barnacle and mussel growth on them. The top of the culvert had up to 4 in of soft and hard
mussel growth.
In addition, sills exist within the culvert. The sills perch the Lagoon’s low tide level, thus limiting the
Lagoon’s tidal range and tidal flushing. On the Marine Stadium side, there is a visible rock basin sill
at the entrance to the culvert that causes impedance of tidal flow. The 2005 dive survey noted that
rocks are 3.5 ft above the invert and “are impeding the flow out of the Lagoon.” A structural sill may
also be present within the culvert at the Lagoon end.
There are side-by-side motorized tide gates on the Lagoon end of the culvert that are in a degraded
condition. The gates were designed to be able to open 7 ft on the Lagoon side. However, lack of
maintenance has caused the gates to not operate to this design capability and to only open to
approximately 5.5 ft high.
Cleaning the existing culvert and removing impedances to flow is a short-term component of the
proposed project. To implement this component, the culvert would have to be plugged to prevent flow
through it. This would be done by removing the trash racks and installing “stop logs” (sheet pile or
timber panels) within the vertical slots found on both ends of the culvert. The remaining water would
be pumped out to the nearest water body. The culvert design includes removable access panels on the
top to allow for a small track-loader and cleaning equipment to be lowered into the culvert by crane.
The track-loader and hydroblasting equipment would scrape the bottom, sides, and ceiling to remove
sediments and marine growth. The sediment collected by the track-loader would be removed via
excavator (or a crane with a bucket) through an access opening and hauled off site. All of the

North Beach
South BeachWestArm
NorthArm
Parking Lot
Access Road
Central Lagoon
MarineStadium
Recreation ParkGolf Course
Marina VistaPark
TerminoAvenueDrain
E 6TH ST
E APPIAN WY
E COLORADO ST
ELIOT ST
PARK AV
ORLENA AV
HAINES AV
PAOLI WY
PANAMA AV
E VERMONT ST
NIETO AV
SANTIAGO AV
MONROVIA AV
FED
ERAT
ION
DR
E 4TH ST
3RD
ST
TERRAINE AV
E 7TH ST
E 5TH ST
BAY
SID
E D
R N
SAINT JOSEPH AV
E 4TH ST
Lifeguard Station
Marine Science Center
Preschool andModel BoatBuildings
FIGURE 2
Colorado Lagoon Restoration ProjectExisting Conditions
0 125 250 Feet
I:\CLB0702\GIS\ExistingConditions_Fig3.2.mxd (5/9/08)
SOURCE: Air Photo USA (2007), Moffat & Nichol (2007), Thomas Bros. (2007).
LEGEND
Project Boundary
Culvert
Sand Nourishment Areas
Existing Storm Drain Pipelines
Existing Restrooms
Major System Outfall
Local Drain
Baseball Field
Adult Soccer Field
Youth Soccer Field
Indicates Drain Diverted by Termino Project

L S A A S S O C I A T E S , I N C .L S A A S S O C I A T E S , I N C .L S A A S S O C I A T E S , I N C .L S A A S S O C I A T E S , I N C . N O I S E I M P A C TN O I S E I M P A C TN O I S E I M P A C TN O I S E I M P A C T A N A L Y S I S A N A L Y S I S A N A L Y S I S A N A L Y S I S M A Y M A Y M A Y M A Y 2 0 0 82 0 0 82 0 0 82 0 0 8 C O L O R A D O L A GO ON R E S TC O L O R A D O L A GO ON R E S TC O L O R A D O L A GO ON R E S TC O L O R A D O L A GO ON R E S T O R A T I O N P R O J E C TO R A T I O N P R O J E C TO R A T I O N P R O J E C TO R A T I O N P R O J E C T
P:\CLB0702\Air and Noise Tech Studies\Noise1.doc «05/09/08» 7
impedances would be removed from in and around the culvert, and the tide gates would be removed
to provide a maximum culvert opening size. It is estimated that up to 900 cubic yards (cy) of sediment
and trash and 130 tons of rock would be removed and hauled off site.
Cleaning the culvert and trash racks and removing the tidal gates, sill, and other structural impedances
would result in an increase in the tidal range and tidal flushing, which would in turn increase water
circulation throughout the Lagoon. Increased tidal ranges and tidal flushing are anticipated to result in
a notable improvement in water quality. As mentioned previously and further described below,
culvert cleaning and removing impedances is a near-term component. The ultimate improvement
would be replacement of the culvert with an open channel.
Build Open Channel between Lagoon and Marine Stadium. This is a long-term project
component that will supersede the previous component. This component consists of replacing the
existing concrete box culvert with an open channel that would run from the Lagoon through Marina
Vista Park to Marine Stadium in generally the same alignment as the existing culvert. Creating an
open channel would improve tidal flushing by increasing the tidal range and result in a corresponding
improvement in water and habitat quality. In addition, it would provide improved flood flow
conveyance.
The proposed open channel would run a meandering course from the Lagoon to Marine Stadium in
approximately the same alignment as the existing culvert. The channel would have curvilinear edges
to create a natural-looking feature. The open channel will be characterized by a soft bottom and
gently sloping banks and constructed with erosion-control blankets and riprap on the curves to
maintain the integrity of the channel design, native landscaping buffer areas along the banks, and a
walking trail along the eastern bank. The open channel would be 14 ft deep, have 3:1 (H:V) side
slopes, and would be approximately 100 ft across at the top. This design would provide an
aesthetically pleasing, natural-looking feature and also provide for biological enhancements such as
marsh areas and eelgrass beds.
The existing culvert will be daylighted and excavated further as part of the open channel construction.
The open channel design has a cross-sectional area large enough to provide unrestricted tidal flows
between the Lagoon and Marine Stadium, which would maximize tidal flushing of the Lagoon. The
channel would be deeper than the lowest predicted tidal water level and higher than the highest
predicted design flood levels. This would be at least as low as 7 ft below the mean sea level (msl) for
tides and as high as 2 ft aboveground (low dikes) along its banks to provide sufficient freeboard to
protect against a 50-year flooding event.
A landscaped buffer would be installed along the sides of the channel. The landscaped buffer would
contain a mixture of armor rock and native plantings that would also create a safety barrier where
necessary. A meandering walking trail would be installed on the eastern side of the channel. This
walking trail would connect to the proposed walking trail at the Lagoon, across East Colorado Street.
Two vehicular bridges with pedestrian and bicycle facilities would be built over the open channel at
East Colorado Street and East Eliot Street crossings, in order to maintain existing traffic circulation.
One bridge would be for East Colorado Street and one for East Eliot Street. In addition, two existing
public restrooms near the Marine Stadium end of the proposed open channel (one in Marina Vista

L S A A S S O C I A T E S , I N C .L S A A S S O C I A T E S , I N C .L S A A S S O C I A T E S , I N C .L S A A S S O C I A T E S , I N C . N O I S E I M P A C TN O I S E I M P A C TN O I S E I M P A C TN O I S E I M P A C T A N A L Y S I S A N A L Y S I S A N A L Y S I S A N A L Y S I S M A Y M A Y M A Y M A Y 2 0 0 82 0 0 82 0 0 82 0 0 8 C O L O R A D O L A GO ON R E S TC O L O R A D O L A GO ON R E S TC O L O R A D O L A GO ON R E S TC O L O R A D O L A GO ON R E S T O R A T I O N P R O J E C TO R A T I O N P R O J E C TO R A T I O N P R O J E C TO R A T I O N P R O J E C T
P:\CLB0702\Air and Noise Tech Studies\Noise1.doc «05/09/08» 8
Park and one south of East Eliot Street) will be demolished and replaced with the new public
restroom design that is recommended by the Long Beach Police Department.
Remove Contaminated Sediment in the Western Arm. The Lagoon is listed as impaired on
California’s 303(d) list of water quality limited segments, due to lead, zinc, chlordane, and PAHs in
the sediment and chlordane, DDT, dieldrin, and PCBs in tissues of marine organisms. These
contaminants were deposited over time from the particulates in the runoff brought to the Lagoon
through the existing storm drains. Sediment sampling was conducted in 2004 and 2006 to determine
the depths and spatial distribution of contamination within the Lagoon. Both surveys confirmed the
presence of the 303(d) list constituents and indicated a strong contamination gradient with high levels
of contaminants in the western arm of the Lagoon, transitioning to much lower levels toward the
central Lagoon area. Five metals, including cadmium, copper, lead, mercury, and zinc, exhibited this
distributional pattern. Among the organic contaminants, DDT compounds, chlordane, dieldrin, PCBs,
and PAHs also demonstrated this strong gradient. It is estimated that the layer of contaminated
sediment reaches 4 to 5 ft deep. Removal of sediment to a depth of 6 ft provides a safeguard that only
clean sediment remains. Hence, the excavation design is based on removing 6 ft of sediment at the
uppermost portion of the western arm, with the excavation depth gradually decreasing toward the
footbridge. The sediment assessments concluded that the existing pedestrian footbridge provides a
reasonable and conservative boundary for removal of the contaminated sediment. The depth of
excavation at the deepest point would be down to 19 ft below the msl point of 1929. The width of the
excavation footprint is intended to be as wide as possible to remove the maximum quantity of
sediment while still providing for stable side slopes around the Lagoon perimeter. Slopes are to be
dredged to create a smooth transition from the Lagoon floor up the side slopes. Approximately
16,000 cy of sediment would be removed from the western arm of the Lagoon.
There are two methods related to dredging and disposing of the contaminated sediment within the
western arm of the Lagoon. The dry dredge method would install a temporary cofferdam just west of
the footbridge to isolate the west arm of the Lagoon. The dredge areas would be drained of water, and
the bottom sediment would be dewatered. An excavator would be used to remove the dry sediment,
which would be temporarily stockpiled in the parking lot along the Lagoon’s north shore. Plastic tarps
and containment structures would be placed under and around the stockpile area to minimize runoff
back into the Lagoon and surrounding areas. Due to the contamination levels within the western arm
of the Lagoon, the dredge materials from this Lagoon location would be hauled to a Class 1
hazardous waste disposal facility or an approved Port of Long Beach site via truck.
The second method, which is the wet dredge method, would not dewater the west arm of the Lagoon
prior to dredging. The dredge areas would be isolated by a silt curtain to maintain water quality.
Clamshell/bucket-type dredging equipment would be used and temporary shore-perpendicular berms
or piers would be built into the Lagoon to allow the dredger to access depths not within reach from
the Lagoon’s shores. Similar to the first method, the dredged material would be temporarily stock-
piled in the parking lot along the northern shore until it was drained and loaded onto trucks. Plastic
tarps and containment structures would be placed under and around the stockpile areas to minimize
runoff back into the Lagoon and surrounding areas.

L S A A S S O C I A T E S , I N C .L S A A S S O C I A T E S , I N C .L S A A S S O C I A T E S , I N C .L S A A S S O C I A T E S , I N C . N O I S E I M P A C TN O I S E I M P A C TN O I S E I M P A C TN O I S E I M P A C T A N A L Y S I S A N A L Y S I S A N A L Y S I S A N A L Y S I S M A Y M A Y M A Y M A Y 2 0 0 82 0 0 82 0 0 82 0 0 8 C O L O R A D O L A GO ON R E S TC O L O R A D O L A GO ON R E S TC O L O R A D O L A GO ON R E S TC O L O R A D O L A GO ON R E S T O R A T I O N P R O J E C TO R A T I O N P R O J E C TO R A T I O N P R O J E C TO R A T I O N P R O J E C T
P:\CLB0702\Air and Noise Tech Studies\Noise1.doc «05/09/08» 9
Remove Sediment in the Central Lagoon. The sediments in the central region of the Lagoon
contain levels of lead, mercury, silver, DDT, and chlordane that are not hazardous per State standards.
This project component would remove sediment and sand that has eroded and been deposited into the
Lagoon waters over the years and create a larger subtidal area. Approximately 5,500 cy of sediment
would be removed from the central Lagoon utilizing the wet dredge method discussed previously.
Storm Drain Upgrades. There are 11 storm drains that currently discharge into the Lagoon, as
identified on Figure 2. Four of these are major system outfalls, serving large areas of the watershed.
One of the major system outfall structures entering the Lagoon is called the Termino Avenue Drain
and is currently proposed by the County of Los Angeles to be modified to no longer discharge into
the Lagoon. Instead, the drain would bypass the Lagoon and discharge storm water flows into Marine
Stadium and dry weather flows into the sanitary sewer system. This project would also redirect flows
from three other storm drains located on the south shore of the Lagoon that currently discharge into
the Lagoon. The drains that would be diverted by the County Termino Avenue Drain Project
(TADP) are shown on Figure 2. The purpose of the TADP is to construct a storm drain that would
alleviate flooding problems in the area and accommodate a 50-year storm event.
The implementation of the County project affects the proposed improvements to the Lagoon because
one major storm drain and three local storm drains would no longer discharge into the Lagoon. In
addition, the TADP would abandon in place the four existing drain discharge structures at the
Lagoon. The proposed Lagoon project would close off the ends of these drains and remove the outlet
structures. For the purposes of the proposed project and environmental documentation, it is assumed
that the TADP will be implemented.
The storm drain upgrade components of the Lagoon Restoration Project would upgrade the seven
remaining storm drains (three major system outfalls and four local drains) that discharge into the
Lagoon. These components would redirect or treat storm and low flows from these drains to minimize
contamination of water and sediment. Specifically, this project component consists of:
(1) development of vegetated bioswales to treat discharge from the four local drains along the north
shore of the Lagoon (discussed further below under a separate project component); (2) construction of
low-flow and storm first-flush diversions to a water storage area (wet well) that would discharge into
the sanitary sewer system from the three remaining major system outfall drains; and (3) installation of
trash separation devices on the same three remaining major system outfall drains.
The trash separation devices would trap trash and debris prior to entering the wet well for the diverted
runoff and/or discharge into the Lagoon during storm events. These filtration devices would be
installed within the pipe just upstream of the diversion structure. These filtration devices would need
to be cleaned on a periodic basis. The storm drain locations and the proposed upgrades are shown in
Figure 3.
To divert dry weather flow and the first storm flows, diversion structures/mechanisms would be
installed a short distance upstream of the discharge ends of the three major system outfalls. The
diversion system would be designed so that storm flows would bypass the diversion and discharge
directly into the Lagoon, whereas the dry weather runoff and storm first-flush discharges would be
diverted to a wet well. The diversion system would include flow meters and valve control devices
such that during a large storm event, the control device would shut off when the meter indicated that

L S A A S S O C I A T E S , I N C .L S A A S S O C I A T E S , I N C .L S A A S S O C I A T E S , I N C .L S A A S S O C I A T E S , I N C . N O I S E I M P A C TN O I S E I M P A C TN O I S E I M P A C TN O I S E I M P A C T A N A L Y S I S A N A L Y S I S A N A L Y S I S A N A L Y S I S M A Y M A Y M A Y M A Y 2 0 0 82 0 0 82 0 0 82 0 0 8 C O L O R A D O L A GO ON R E S TC O L O R A D O L A GO ON R E S TC O L O R A D O L A GO ON R E S TC O L O R A D O L A GO ON R E S T O R A T I O N P R O J E C TO R A T I O N P R O J E C TO R A T I O N P R O J E C TO R A T I O N P R O J E C T
P:\CLB0702\Air and Noise Tech Studies\Noise1.doc «05/09/08» 10
the flow had reached the upset limit of the available storage within the wet well. One-way flap gates
would be installed at the end of these storm drain pipes so as to preclude tidal saltwater from entering
into the storm drain (and, thus, potentially the sanitary sewer diversion system) while allowing storm
flows to freely discharge into the Lagoon.
New diversion pipes would be installed underground to carry the diverted storm water from the storm
drain outlet locations to the underground wet well. The underground wet well and aboveground pump
station would be built on the golf course at the corner of East 6th Street and Park Avenue. The size of
the underground wet well would be approximately 40 ft by 40 ft and 12 ft deep. The locations of the
new diversion pipes and wet well are shown on Figure 3. The runoff collected in the wet well would
be pumped via the County sewer line located on East 6th Street near the intersection of Park Avenue
to the Los Angeles County Sanitation Districts treatment plant. Due to a County-imposed restriction,
pumping operations would be limited to only certain times of day (midnight to 5:00 a.m.).
Replace Local Hard Drain Outlets in the Lagoon with Vegetated Bioswales. As discussed above,
4 of the 11 storm drains that discharge into the Lagoon would be diverted to Marine Stadium as part
of the TADP, and this project would upgrade the remaining three major outfall drains with end-of-
pipe diversion systems and trash separation devices. The flows from the remaining four local storm
drains would be treated via vegetated bioswales. Bioswales would also be developed on the north
shore between the Lagoon and Recreation Park Golf Course. These vegetated bioswales would treat
storm water and dry weather runoff through filtration to remove sediment and pollutants prior to
discharge into the Lagoon. The bioswales would treat the discharge from the local drains and any
runoff from the golf course. The swales are designed to be 3 ft deep and 15 ft wide at the top. The
swales would have a V-shaped cross-section with sides sloping at a 2:1 ratio down to the channel
centerline.
Approximately 2,500 cy of sediment would be removed as a result of the development of the
bioswales. The sediment from the proposed bioswale areas is not considered hazardous and will be
disposed of at an appropriate undesignated landfill.
Habitat Improvements
Remove North Parking Lot and Access Road and Create Side Slope Recontouring and Revegetation.
This component would remove the existing access road from East 6th Street and the parking lot on
the north shore of the Lagoon and create native upland, marsh, and intertidal habitat areas around the
Lagoon. Habitat areas would be created through native vegetation planting and Lagoon bank
recontouring that would promote the establishment of salt marsh habitat, including intertidal zones.
The objective of this component is to restore and improve the estuarine habitat. This component also
includes demolishing the existing restroom on the north shore of the Lagoon. The existing recreation
improvements (e.g., barbeques and picnic tables) will remain on the north shore of the Lagoon.
The north parking lot and access road would be removed to provide more space for native vegetation
planting and habitat restoration. The existing access road from East 6th Street is a private road on
City property that is open to the public. The road functions as a driveway to the north parking lot.

North Beach
South BeachWestArm
NorthArm
Parking Lot
Access Road
Central Lagoon
Recreation ParkGolf Course
Marina VistaPark
E 6TH ST
E COLORADO ST
E APPIAN WY
E 4TH ST
ORLENA AV
ELIOT ST
PARK AV
HAINES AV
PANAMA AV
PAOLI WY
E VERMONT ST
SANTIAGO AV
E 7TH ST
MONRO
VIA AVFED
ER
ATIO
N D
R
NIETO AV
TERRAINE AV
E 5TH ST
3RD
ST
SAINT JOSEPH AV
N TRIMBLE CTE 4TH ST
FIGURE 3
Colorado Lagoon Restoration ProjectProposed Water and Sediment Quality Improvements
0 100 200 Feet
I:\CLB0702\GIS\Noise_Fig3_WaterSedimentImprovements.mxd (5/9/08)
SOURCE: Air Photo USA (2007), Moffat & Nichol (2007), Thomas Bros. (2007).
LEGEND
Project Boundary
Major System Outfallwith Trash Separation Device
Proposed Bioswale
Proposed Open Channel(Top of Channel 100’)
Proposed Stormwater Diversion Pipes
Proposed Wetwell
Existing Storm Drain Pipelines
Dredge Area
Shrubs
Vegetated Buffer/Berm

L S A A S S O C I A T E S , I N C .L S A A S S O C I A T E S , I N C .L S A A S S O C I A T E S , I N C .L S A A S S O C I A T E S , I N C . N O I S E I M P A C TN O I S E I M P A C TN O I S E I M P A C TN O I S E I M P A C T A N A L Y S I S A N A L Y S I S A N A L Y S I S A N A L Y S I S M A Y M A Y M A Y M A Y 2 0 0 82 0 0 82 0 0 82 0 0 8 C O L O R A D O L A GO ON R E S TC O L O R A D O L A GO ON R E S TC O L O R A D O L A GO ON R E S TC O L O R A D O L A GO ON R E S T O R A T I O N P R O J E C TO R A T I O N P R O J E C TO R A T I O N P R O J E C TO R A T I O N P R O J E C T
P:\CLB0702\Air and Noise Tech Studies\Noise1.doc «05/09/08» 12
In many areas of the Lagoon, the existing banks are steep and intertidal habitat area is limited. In
addition, no substantial native upland habitat exists at the Lagoon. Most of the shoreline areas of the
Lagoon are composed of ornamental landscaping and nonnative vegetation.
The slopes of several areas of the Lagoon shoreline would be recontoured to create areas for the
establishment of salt marsh habitat. The approach to designing the area of intertidal habitat is to
flatten the entire intertidal slope by installing a bench-type of feature between elevations of -1.75 ft
and +1.5 ft above mean sea level (amsl). The bench represents a longer, flatter, sandy-bottomed slope
that is exposed at low tide and inundated at high tide and where cordgrass (Spartina foliosa) and
mudflat habitat would colonize. The new side slope profiles would be designed to maximize the area
within this elevation range. Pickleweed (Salicornia spp.) habitat will colonize elevations between
+1.5 and +2.75 ft amsl (mid-marsh). High marsh/upland habitat will be established at elevations
between +2.75 ft and +5.0 ft amsl. Any existing exotic vegetation in this area would be removed.
Native salt marsh species would be planted in the appropriate elevation ranges and maintained until
the habitats are established and self-sustaining (Figure 4).
Vegetated biological buffer strips consisting of aesthetically appealing native shrubs and grasses
would be installed in various areas. The buffer strip species would be selected and located according
to the desired viewsheds throughout the buffer alignment to allow for a combination of visual
screening using taller species and to allow for viewsheds through the use of low-growing species and
species that can be selectively pruned. Additionally, a dune would be constructed on the north shore
to provide a buffer area between the golf course and Lagoon. Soils from the central Lagoon dredge
area would be used to construct the dune.
Recontouring of the side slopes would be done concurrently with sediment removal of the western
arm and central Lagoon areas. The recontouring component would generate approximately 5,100 cy
of material. Some of this material is presumed to be contaminated. Therefore, the excess recontouring
sediment would be disposed of with the dredge material from the western arm.
A meandering trail (as also discussed under recreational improvements and shown in Figure
5) composed of compacted decomposed granite would course the perimeter of the Lagoon, with the
exception of the western arm. The trail would be generally 8 ft wide, except along the north shore
where the access trail from Sixth Street would be 12 ft wide to provide emergency access along the
western shore of the northern arm.
The removal of nonnative vegetation and installation of native vegetation would include the following
areas:
• Western Arm/Western Shore. The existing exotic vegetation (grass) would be removed,
existing native saltgrass (Distichlis spicata) would be salvaged for transplantation in appropriate
areas, and native vegetation (including an area with upland habitat) would be installed.
• Western Arm/Eastern Shore. The existing exotic vegetation (shrubbery and grass) would be
removed, and native vegetation would be installed.
• Northern Arm/Northwestern Corner. The existing exotic vegetation, Mexican fan palms
(Washingtonia robusta), would be removed, and native vegetation would be installed.
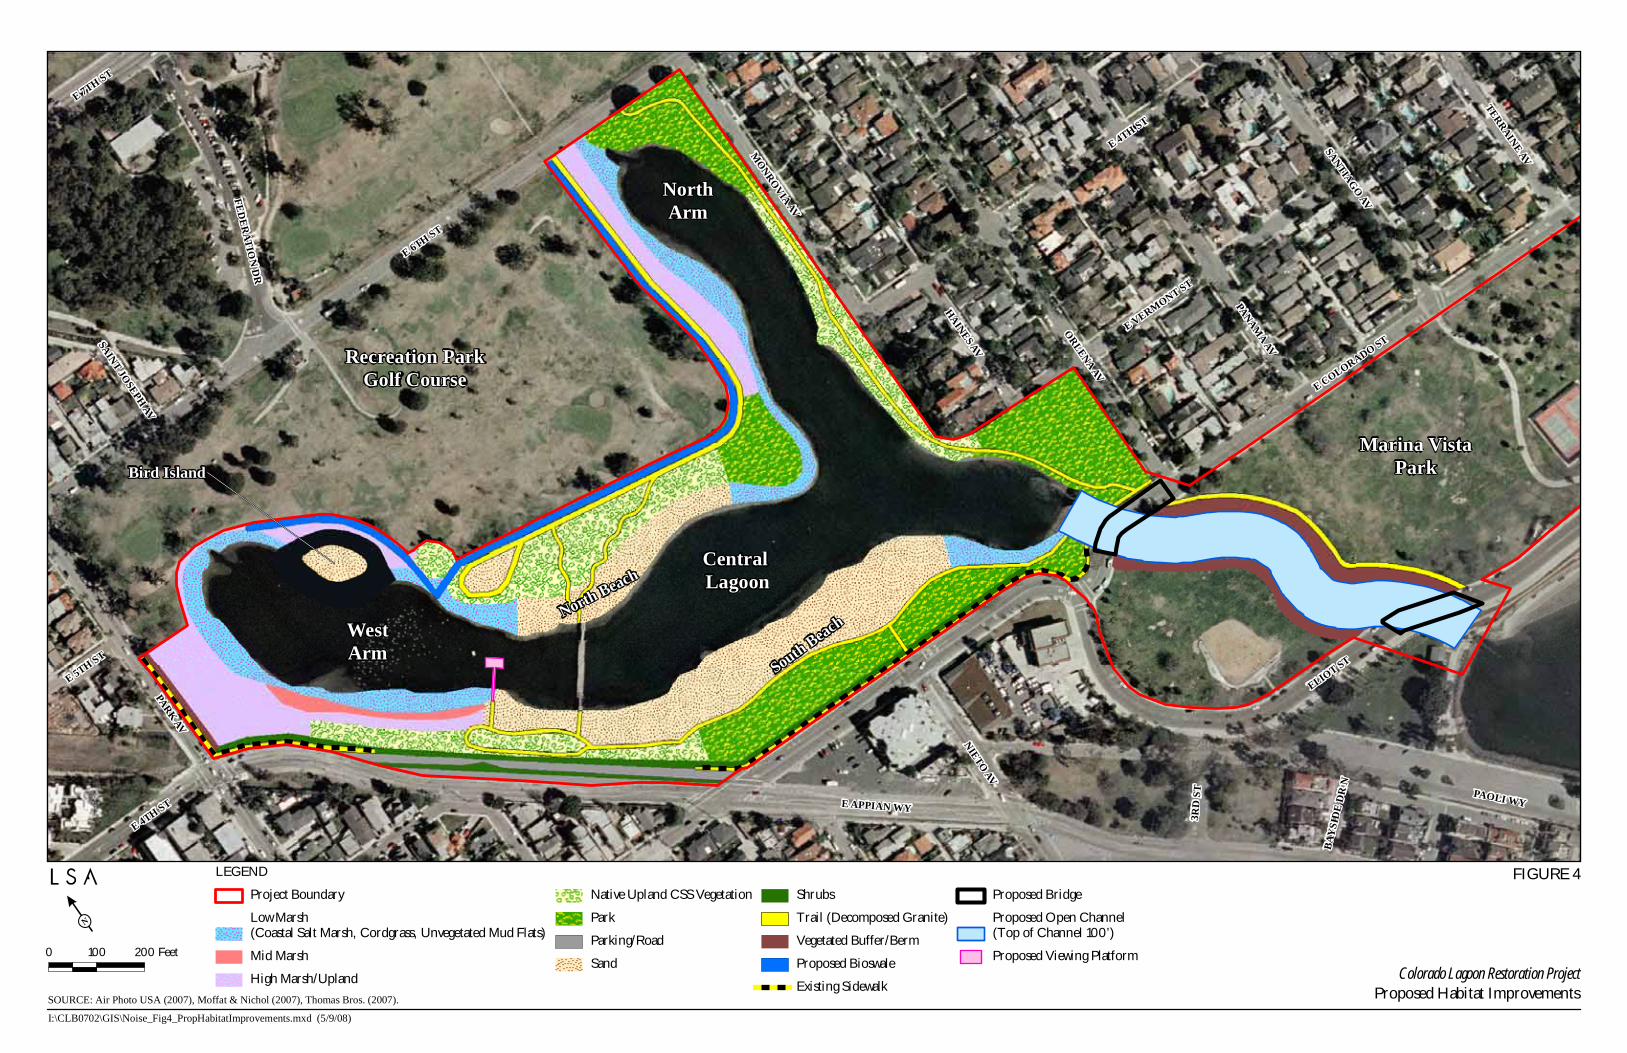
North Beach
South BeachWestArm
NorthArm
Central Lagoon
Recreation ParkGolf Course
Marina VistaParkBird Island
E 6TH ST
E APPIAN WY
E COLORADO ST
ELIOT ST
PARK AV
ORLENA AV
HAINES AV
PAOLI WY
PANAMA AV
E VERMONT ST
NIETO AV
SANTIAGO AV
MONRO
VIA AV
FED
ER
ATIO
N D
R
E 4TH ST
3RD
ST
TERRAINE AVE 7TH ST
E 5TH ST
BAY
SID
E D
R N
SAINT JOSEPH AV
E 4TH ST
FIGURE 4
Colorado Lagoon Restoration ProjectProposed Habitat Improvements
0 100 200 Feet
I:\CLB0702\GIS\Noise_Fig4_PropHabitatImprovements.mxd (5/9/08)
SOURCE: Air Photo USA (2007), Moffat & Nichol (2007), Thomas Bros. (2007).
LEGEND
Project Boundary
Low Marsh(Coastal Salt Marsh, Cordgrass, Unvegetated Mud Flats)
Mid Marsh
High Marsh/Upland
Native Upland CSS Vegetation
Park
Parking/Road
Sand
Shrubs
Trail (Decomposed Granite)
Vegetated Buffer/Berm
Proposed Bioswale
Existing Sidewalk
Proposed Bridge
Proposed Open Channel(Top of Channel 100’)
Proposed Viewing Platform

North Beach
South BeachWestArm
NorthArm
Central Lagoon
MarineStadium
Recreation ParkGolf Course
Marina VistaPark
Bird Island
E 6TH ST
E APPIAN WY
E COLORADO ST
ELIOT ST
PARK AV
ORLENA AV
HAINES AV
PAOLI WY
PANAMA AV
E VERMONT ST
NIETO AV
SANTIAGO AV
MONROVIA AV
FED
ERAT
ION
DR
E 4TH ST
3RD
ST
TERRAINE AV
E 7TH ST
E 5TH ST
BAY
SID
E D
R N
SAINT JOSEPH AV
E 4TH ST
FIGURE 5
Colorado Lagoon Restoration ProjectProposed Recreation Components
0 125 250 Feet
I:\CLB0702\GIS\Noise_Fig5_PropRecreation.mxd ( 5/6/2008 )
SOURCE: Air Photo USA (2007), Moffat & Nichol (2007), Thomas Bros. (2007).
Project Boundary
Swimming Area
Sand Nourishment Area
Existing Sidewalk
Proposed Bioswale
Bird Island
Proposed Trail (Decomposed Granite)
Vegetated Buffer/Berm
Proposed Bridge
Proposed Open Channel(Top of Channel 100’)
Proposed Viewing Platform
Baseball Field (New Location)
Adult Soccer Field (Existing Location)
Youth Soccer Field (New Location)
Access Road and Parking Lotto be removed with proposed project

L S A A S S O C I A T E S , I N C .L S A A S S O C I A T E S , I N C .L S A A S S O C I A T E S , I N C .L S A A S S O C I A T E S , I N C . N O I S E I M P A C TN O I S E I M P A C TN O I S E I M P A C TN O I S E I M P A C T A N A L Y S I S A N A L Y S I S A N A L Y S I S A N A L Y S I S M A Y M A Y M A Y M A Y 2 0 0 82 0 0 82 0 0 82 0 0 8 C O L O R A D O L A GO ON R E S TC O L O R A D O L A GO ON R E S TC O L O R A D O L A GO ON R E S TC O L O R A D O L A GO ON R E S T O R A T I O N P R O J E C TO R A T I O N P R O J E C TO R A T I O N P R O J E C TO R A T I O N P R O J E C T
P:\CLB0702\Air and Noise Tech Studies\Noise1.doc «05/09/08» 15
• Northern Arm/Northeastern Corner. This area would remain in the existing condition. The
park setting will be retained to allow for ongoing existing public recreational uses.
• Eastern Shore. The existing exotic vegetation (iceplant) would be removed, and a native
vegetation buffer consisting of selected coastal sage scrub components would be installed.
• Southern Shore. Low shrubs would be installed between the concrete walk path and the sand
(near the playground equipment), along the street-side sidewalks of East Colorado Street and East
Appian Way, along the East Appian Way parallel parking strip (near the lifeguard station), and
along the edge of the sand. In addition, the asphalt strip that currently exists between East Appian
Way and the Lagoon access road parking area would be removed and planted with native trees
and shrubs. The type and spacing of the trees and shrubs would be designed to minimize
obstruction of the view from the homes to the southwest. This portion of the component would
involve some demolition of pavement. Pavement debris would be hauled off site. New topsoil
would be imported as necessary for the areas to be replanted. Irrigation lines and new plants
would be installed. In addition, along the southwestern shore, a berm would be installed along
Park Avenue. Both the shrubs and the berm would reduce the storm water sheet flow that
currently enters the Lagoon from these areas during storm events.
A conceptual planting plan showing the proposed new vegetation communities is shown on Figure 4.
These habitats would support a diversity of native plant species that would be used by native birds,
primarily for foraging and resting. The restored habitat is expected to increase the abundance and
diversity of birds using the Lagoon and would provide viewing and educational opportunities for the
public.
Import and Plant Eelgrass in the Lagoon. There are small patches of eelgrass currently existing in
the Lagoon that would be supplemented by planting additional eelgrass and creating eelgrass beds.
Eelgrass beds are nutrient-rich and extremely productive, providing food and shelter for a variety of
marine invertebrates and fishes.
Eelgrass (Zostera) is a marine flowering plant that grows in soft sediments in coastal bays and
estuaries, and occasionally offshore to depths of 50 ft. Eelgrass canopies are approximately 2 to 3 ft
long (consisting of shoots and leaves). This vegetation enhances the abundance and diversity of the
habitat by attracting many marine invertebrates, fishes, and marine life. Diverse communities of
bottom-dwelling invertebrates (i.e., clams, crabs, and worms) live on eelgrass or within the soft
sediments that cover the root and rhizome mass system. The vegetation also serves a nursery function
for many juvenile fishes, including species of commercial and/or sports fish value (California halibut
[Paralichthys californicus] and barred sand bass [Paralabrax nebulifer]). Eelgrass beds are critical
foraging centers for seabirds (such as the endangered California least tern [Sternula antillarum
brownii]) that seek out baitfish (i.e., juvenile topsmelt) attracted to the eelgrass cover. Last, eelgrass is
an important contributor to the detrital (decaying organic) food web of bays, as the decaying plant
material is consumed by many benthic invertebrates (such as polychaete worms) and reduced to
primary nutrients by bacteria.
The newly introduced eelgrass beds would be located in the north arm of the Lagoon and in the newly
developed open channel, and would be located below the lowest tidal elevation. The eelgrass plants
would be hand-planted via scuba diver on the bottom of the Lagoon and channel.

L S A A S S O C I A T E S , I N C .L S A A S S O C I A T E S , I N C .L S A A S S O C I A T E S , I N C .L S A A S S O C I A T E S , I N C . N O I S E I M P A C TN O I S E I M P A C TN O I S E I M P A C TN O I S E I M P A C T A N A L Y S I S A N A L Y S I S A N A L Y S I S A N A L Y S I S M A Y M A Y M A Y M A Y 2 0 0 82 0 0 82 0 0 82 0 0 8 C O L O R A D O L A GO ON R E S TC O L O R A D O L A GO ON R E S TC O L O R A D O L A GO ON R E S TC O L O R A D O L A GO ON R E S T O R A T I O N P R O J E C TO R A T I O N P R O J E C TO R A T I O N P R O J E C TO R A T I O N P R O J E C T
P:\CLB0702\Air and Noise Tech Studies\Noise1.doc «05/09/08» 16
Develop a Bird Island. A bird island to provide a safe refuge for roosting birds will be developed by
excavating (approximately 6,600 cy of soils) an area adjacent to the north shoreline in the western
arm of the Lagoon. Maintenance requirements are assumed to be minimal, consisting of periodic
cleaning, inspection, and repairs as needed.
Recreational Improvements
Construct a Walking Trail around the Lagoon and Open Channel. This component would
provide additional public recreation amenities at the Lagoon through improved pedestrian access and
learning opportunities. A walking trail would be extended around portions of the perimeter of the
Lagoon and the eastern side of proposed open channel, extending through areas that currently provide
no public access. As shown on Figure 5, the trail would not extend around the western arm of the
Lagoon. A viewing platform will be located at the end of the trail toward the western arm. The trail
would connect to the existing footbridge on both the north and south shores of the Lagoon. As
mentioned previously, the existing recreation improvements (e.g., barbeques and picnic tables) will
remain on the north shore of the Lagoon.
The trail would be generally 8 ft wide, except along the north shore where the access trail from Sixth
Street would be 12 ft wide to provide emergency access along the western shore of the northern arm.
The trail would be constructed of decomposed granite in the new areas, which would connect to the
existing sidewalk. Interpretive kiosks, seating benches, picnic tables, and shade structures would be
installed along the trail. The kiosks would provide educational information about the Lagoon.
Reconfigure Sports Fields in Marina Vista Park. Due to the location of the proposed open channel,
the baseball diamond in Marina Vista Park would be moved slightly north. The new location would
provide an area large enough to maintain functionality for league sports and provide for a youth
soccer field overlay (as currently provided). The adult-sized soccer field would remain in its current
location. In summary, the proposed project would reconfigure the existing fields, but continue to
provide the same number of fields and the same functionality that is currently provided in the park.
Operational Components
These are operational features that could be implemented without additional CEQA clearance and that
complement the water quality strategies described above.
Implement Trash Management Protocols. More frequent and effective trash management would
reduce refuse in the water and adjacent areas, especially during summer months, when the Lagoon is
utilized most by picnickers. Proposed trash management protocols include ensuring that all trash
containers are covered, disallowing trash trucks to drive on the sand areas, providing additional trash
containers at key locations, educating Lagoon users on litter control and its effect on the environment,
and enforcing littering laws. The use of landscaping as barriers to prevent trash from blowing across
the site and into the Lagoon will also be considered.
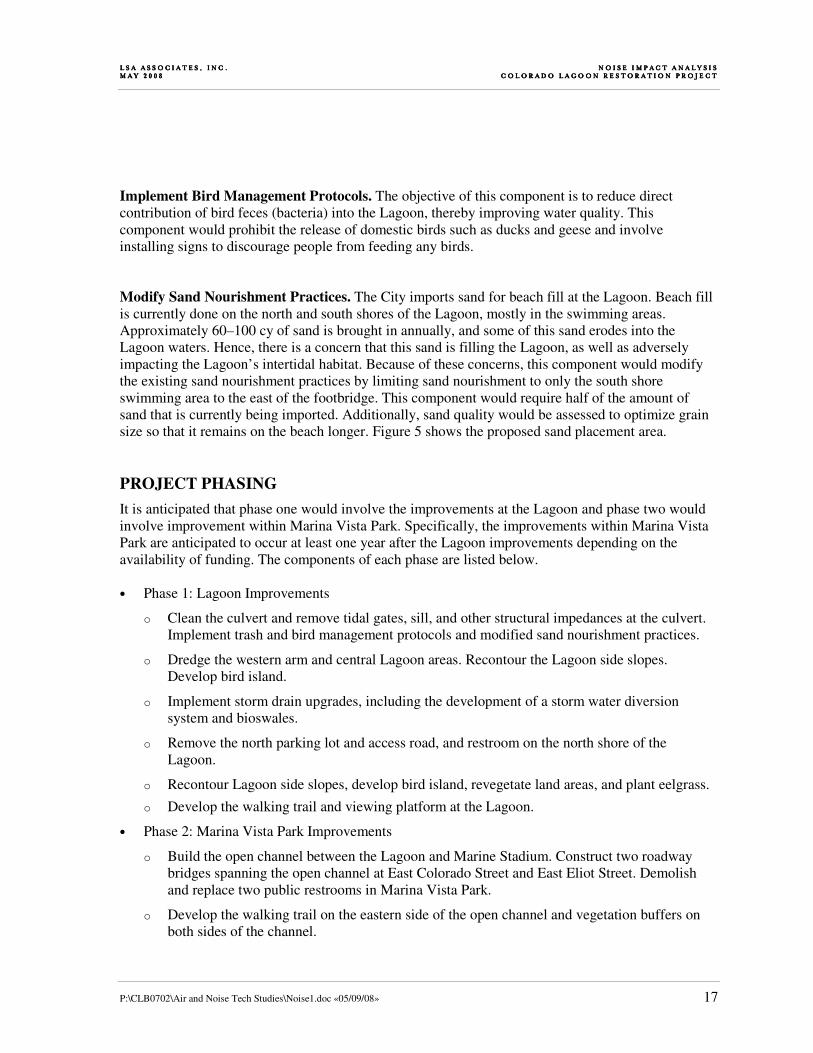
L S A A S S O C I A T E S , I N C .L S A A S S O C I A T E S , I N C .L S A A S S O C I A T E S , I N C .L S A A S S O C I A T E S , I N C . N O I S E I M P A C TN O I S E I M P A C TN O I S E I M P A C TN O I S E I M P A C T A N A L Y S I S A N A L Y S I S A N A L Y S I S A N A L Y S I S M A Y M A Y M A Y M A Y 2 0 0 82 0 0 82 0 0 82 0 0 8 C O L O R A D O L A GO ON R E S TC O L O R A D O L A GO ON R E S TC O L O R A D O L A GO ON R E S TC O L O R A D O L A GO ON R E S T O R A T I O N P R O J E C TO R A T I O N P R O J E C TO R A T I O N P R O J E C TO R A T I O N P R O J E C T
P:\CLB0702\Air and Noise Tech Studies\Noise1.doc «05/09/08» 17
Implement Bird Management Protocols. The objective of this component is to reduce direct
contribution of bird feces (bacteria) into the Lagoon, thereby improving water quality. This
component would prohibit the release of domestic birds such as ducks and geese and involve
installing signs to discourage people from feeding any birds.
Modify Sand Nourishment Practices. The City imports sand for beach fill at the Lagoon. Beach fill
is currently done on the north and south shores of the Lagoon, mostly in the swimming areas.
Approximately 60–100 cy of sand is brought in annually, and some of this sand erodes into the
Lagoon waters. Hence, there is a concern that this sand is filling the Lagoon, as well as adversely
impacting the Lagoon’s intertidal habitat. Because of these concerns, this component would modify
the existing sand nourishment practices by limiting sand nourishment to only the south shore
swimming area to the east of the footbridge. This component would require half of the amount of
sand that is currently being imported. Additionally, sand quality would be assessed to optimize grain
size so that it remains on the beach longer. Figure 5 shows the proposed sand placement area.
PROJECT PHASING
It is anticipated that phase one would involve the improvements at the Lagoon and phase two would
involve improvement within Marina Vista Park. Specifically, the improvements within Marina Vista
Park are anticipated to occur at least one year after the Lagoon improvements depending on the
availability of funding. The components of each phase are listed below.
• Phase 1: Lagoon Improvements
o Clean the culvert and remove tidal gates, sill, and other structural impedances at the culvert.
Implement trash and bird management protocols and modified sand nourishment practices.
o Dredge the western arm and central Lagoon areas. Recontour the Lagoon side slopes.
Develop bird island.
o Implement storm drain upgrades, including the development of a storm water diversion
system and bioswales.
o Remove the north parking lot and access road, and restroom on the north shore of the
Lagoon.
o Recontour Lagoon side slopes, develop bird island, revegetate land areas, and plant eelgrass.
o Develop the walking trail and viewing platform at the Lagoon.
• Phase 2: Marina Vista Park Improvements
o Build the open channel between the Lagoon and Marine Stadium. Construct two roadway
bridges spanning the open channel at East Colorado Street and East Eliot Street. Demolish
and replace two public restrooms in Marina Vista Park.
o Develop the walking trail on the eastern side of the open channel and vegetation buffers on
both sides of the channel.

L S A A S S O C I A T E S , I N C .L S A A S S O C I A T E S , I N C .L S A A S S O C I A T E S , I N C .L S A A S S O C I A T E S , I N C . N O I S E I M P A C TN O I S E I M P A C TN O I S E I M P A C TN O I S E I M P A C T A N A L Y S I S A N A L Y S I S A N A L Y S I S A N A L Y S I S M A Y M A Y M A Y M A Y 2 0 0 82 0 0 82 0 0 82 0 0 8 C O L O R A D O L A GO ON R E S TC O L O R A D O L A GO ON R E S TC O L O R A D O L A GO ON R E S TC O L O R A D O L A GO ON R E S T O R A T I O N P R O J E C TO R A T I O N P R O J E C TO R A T I O N P R O J E C TO R A T I O N P R O J E C T
P:\CLB0702\Air and Noise Tech Studies\Noise1.doc «05/09/08» 18
METHODOLOGY RELATED TO NOISE IMPACT ASSESSMENT
Evaluation of noise impacts associated with a proposed project typically includes the following:
• Determine the short-term construction noise impacts on on-site and off-site noise-sensitive uses
with industry-recognized noise emission levels for construction equipment
• Determine the long-term operational noise impacts, including vehicular traffic and aircraft
activities, on on-site and off-site noise-sensitive uses
• Determine the required mitigation measures to reduce short-term and long-term noise impacts
from all sources
CHARACTERISTICS OF SOUND
Sound is increasing to such disagreeable levels in our environment that it can threaten our quality of
life. Noise is usually defined as unwanted sound. Noise consists of any sound that may produce
physiological or psychological damage and/or interfere with communication, work, rest, recreation,
and sleep. To the human ear, sound has two significant characteristics: pitch and loudness. Pitch is
generally an annoyance, while loudness can affect our ability to hear. Pitch is the number of
complete vibrations or cycles per second of a wave that result in the tone’s range from high to low.
Loudness is the strength of a sound that describes a noisy or quiet environment and is measured by
the amplitude of the sound wave. Loudness is determined by the intensity of the sound waves
combined with the reception characteristics of the human ear. Sound intensity refers to how hard the
sound wave strikes an object, which in turn produces the sound’s effect. This characteristic of sound
can be precisely measured with instruments. The analysis of a project defines the noise environment
of the project area in terms of sound intensity and its effect on adjacent sensitive land uses.
Measurement of Sound
Sound intensity is measured through the A-weighted scale (i.e., dBA) to correct for the relative
frequency response of the human ear. That is, an A-weighted noise level de-emphasizes low and very
high frequencies of sound similar to the human ear’s de-emphasis of these frequencies. Unlike linear
units such as inches or pounds, decibels are measured on a logarithmic scale, representing points on a
sharply rising curve. For example, 10 decibels (dB) are 10 times more intense than 1 dB, 20 dB are
100 times more intense, and 30 dB are 1,000 times more intense. Thirty decibels (30 dB) represent
1,000 times as much acoustic energy as 1 dB. A sound as soft as human breathing is about 10 times
greater than 0 dB. The decibel system of measuring sound gives a rough connection between the
physical intensity of sound and its perceived loudness to the human ear. A 10 dB increase in sound
level is perceived by the human ear as only a doubling of the loudness of the sound. Ambient sounds
generally range from 30 dBA (very quiet) to 100 dBA (very loud).
Sound levels are generated from a source, and their decibel level decreases as the distance from that
source increases. Sound dissipates exponentially with distance from the noise source. For a single
point source, sound levels decrease approximately 6 dB for each doubling of distance from the
source. This drop-off rate is appropriate for noise generated by stationary equipment. If noise is
produced by a line source such as highway traffic or railroad operations, the sound decreases 3 dB for

L S A A S S O C I A T E S , I N C .L S A A S S O C I A T E S , I N C .L S A A S S O C I A T E S , I N C .L S A A S S O C I A T E S , I N C . N O I S E I M P A C TN O I S E I M P A C TN O I S E I M P A C TN O I S E I M P A C T A N A L Y S I S A N A L Y S I S A N A L Y S I S A N A L Y S I S M A Y M A Y M A Y M A Y 2 0 0 82 0 0 82 0 0 82 0 0 8 C O L O R A D O L A GO ON R E S TC O L O R A D O L A GO ON R E S TC O L O R A D O L A GO ON R E S TC O L O R A D O L A GO ON R E S T O R A T I O N P R O J E C TO R A T I O N P R O J E C TO R A T I O N P R O J E C TO R A T I O N P R O J E C T
P:\CLB0702\Air and Noise Tech Studies\Noise1.doc «05/09/08» 19
each doubling of distance in a hard site environment. Line source noise in a relatively flat
environment with absorptive vegetation decreases 4.5 dB for each doubling of distance.
There are many ways to rate noise for various time periods, but an appropriate rating of ambient noise
affecting humans also accounts for the annoying effects of sound. However, the predominant rating
scales for human communities in the State of California are the Equivalent-Continuous sound level
(Leq) and Community Noise Equivalent (CNEL) based on A-weighted decibels (dBA). Leq is the total
sound energy of time-varying noise over a sample period. CNEL is the time-varying noise over a
24-hour period, with a weighting factor of 5 dBA applied to the hourly Leq for noises occurring from
7:00 p.m. to 10:00 p.m. (defined as relaxation hours) and with a weighting factor of 10 dBA from
10:00 p.m. to 7:00 a.m. (defined as sleeping hours). The noise adjustments are added to the noise
events occurring during the more sensitive hours. Day-night average noise (Ldn) is similar to the
CNEL but without the adjustment for nighttime noise events. CNEL and Ldn are normally
exchangeable and within 1 dB of each other. Other noise-rating scales of importance when assessing
annoyance factor include the maximum noise level, or Lmax, and percentile noise exceedance levels,
or LN. Lmax is the highest exponential time-averaged sound level that occurs during a stated time
period. It reflects peak operating conditions and addresses the annoying aspects of intermittent noise.
LN is the noise level that is exceeded “N” percent of the time during a specified time period. For
example, the L10 noise level represents the noise level exceeded 10 percent of the time during a stated
period. The L50 noise level represents the median noise level. Half the time the noise level exceeds
this level and half the time it is less than this level. The L90 noise level represents the noise level
exceeded 90 percent of the time and is considered the lowest noise level experienced during a
monitoring period. It is normally referred to as the background noise level.
Physiological Effects of Noise
Physical damage to human hearing begins at prolonged exposure to noise levels higher than 85 dBA.
Exposure to high noise levels affects our entire system, with prolonged noise exposure in excess of
75 dBA increasing body tensions and thereby affecting blood pressure, functions of the heart, and the
nervous system. In comparison, extended periods of noise exposure above 90 dBA would result in
permanent cell damage. When the noise level reaches 120 dBA, a tickling sensation occurs in the
human ear even with short-term exposure. This level of noise is called the threshold of feeling. As
the sound reaches 140 dBA, the tickling sensation is replaced by the feeling of pain in the ear. This is
called the threshold of pain. Dizziness and loss of equilibrium may occur between 160 and 165 dBA.
The ambient or background noise problem is widespread and generally more concentrated in urban
areas than in outlying less developed areas.
Table A lists “Definitions of Acoustical Terms.” Table B shows “Common Sound Levels and Their
Sources.” Table C shows “Land Use Compatibility for Exterior Community Noise” recommended by
the California Department of Health, Office of Noise Control.

L S A A S S O C I A T E S , I N C .L S A A S S O C I A T E S , I N C .L S A A S S O C I A T E S , I N C .L S A A S S O C I A T E S , I N C . N O I S E I M P A C TN O I S E I M P A C TN O I S E I M P A C TN O I S E I M P A C T A N A L Y S I S A N A L Y S I S A N A L Y S I S A N A L Y S I S M A Y M A Y M A Y M A Y 2 0 0 82 0 0 82 0 0 82 0 0 8 C O L O R A D O L A GO ON R E S TC O L O R A D O L A GO ON R E S TC O L O R A D O L A GO ON R E S TC O L O R A D O L A GO ON R E S T O R A T I O N P R O J E C TO R A T I O N P R O J E C TO R A T I O N P R O J E C TO R A T I O N P R O J E C T
P:\CLB0702\Air and Noise Tech Studies\Noise1.doc «05/09/08» 20
Table A: Definitions of Acoustical Terms
Term Definitions Decibel, dB A unit of level that denotes the ratio between two quantities that are
proportional to power; the number of decibels is 10 times the logarithm (to the
base 10) of this ratio. Frequency, Hz Of a function periodic in time, the number of times that the quantity repeats
itself in one second (i.e., number of cycles per second). A-Weighted Sound
Level, dBA The sound level obtained by use of A-weighting. The A-weighting filter
de-emphasizes the very low and very high frequency components of the sound
in a manner similar to the frequency response of the human ear and correlates
well with subjective reactions to noise. All sound levels in this report are A-
weighted, unless reported otherwise. L01, L10, L50, L90 The fast A-weighted noise levels that are equaled or exceeded by a fluctuating
sound level 1 percent, 10 percent, 50 percent, and 90 percent of a stated time
period. Equivalent
Continuous Noise
Level, Leq
The level of a steady sound that, in a stated time period and at a stated
location, has the same A-weighted sound energy as the time-varying sound.
Community Noise
Equivalent Level,
CNEL
The 24-hour A-weighted average sound level from midnight to midnight,
obtained after the addition of 5 dBA to sound levels occurring in the evening
from 7:00 p.m. to 10:00 p.m. and after the addition of 10 dBA to sound levels
occurring in the night between 10:00 p.m. and 7:00 a.m. Day/Night Noise
Level, Ldn The 24-hour A-weighted average sound level from midnight to midnight,
obtained after the addition of 10 dBA to sound levels occurring in the night
between 10:00 p.m. and 7:00 a.m. Lmax, Lmin The maximum and minimum A-weighted sound levels measured on a sound
level meter, during a designated time interval, using fast time averaging. Ambient Noise Level The all encompassing noise associated with a given environment at a
specified time, usually a composite of sound from many sources at many
directions, near and far; no particular sound is dominant. Intrusive The noise that intrudes over and above the existing ambient noise at a given
location. The relative intrusiveness of a sound depends upon its amplitude,
duration, frequency, and time of occurrence and tonal or informational content
as well as the prevailing ambient noise level. Source: Handbook of Acoustical Measurements and Noise Control, 1991.

L S A A S S O C I A T E S , I N C .L S A A S S O C I A T E S , I N C .L S A A S S O C I A T E S , I N C .L S A A S S O C I A T E S , I N C . N O I S E I M P A C TN O I S E I M P A C TN O I S E I M P A C TN O I S E I M P A C T A N A L Y S I S A N A L Y S I S A N A L Y S I S A N A L Y S I S M A Y M A Y M A Y M A Y 2 0 0 82 0 0 82 0 0 82 0 0 8 C O L O R A D O L A GO ON R E S TC O L O R A D O L A GO ON R E S TC O L O R A D O L A GO ON R E S TC O L O R A D O L A GO ON R E S T O R A T I O N P R O J E C TO R A T I O N P R O J E C TO R A T I O N P R O J E C TO R A T I O N P R O J E C T
P:\CLB0702\Air and Noise Tech Studies\Noise1.doc «05/09/08» 21
Table B: Common Sound Levels and Their Noise Sources
Noise Source
A-Weighted Sound
Level in Decibels
Noise
Environment
Subjective
Evaluation
Near Jet Engine 140 Deafening 128 times as loud
Civil Defense Siren 130 Threshold of Pain 64 times as loud
Hard Rock Band 120 Threshold of
Feeling
32 times as loud
Accelerating Motorcycle at a
Few Feet Away
110 Very Loud 16 times as loud
Pile Driver; Noisy Urban
Street/Heavy City Traffic
100 Very Loud 8 times as loud
Ambulance Siren; Food Blender 95 Very Loud
Garbage Disposal 90 Very Loud 4 times as loud
Freight Cars; Living Room
Music
85 Loud
Pneumatic Drill; Vacuum
Cleaner
80 Loud 2 times as loud
Busy Restaurant 75 Moderately Loud
Near Freeway Auto Traffic 70 Moderately Loud Baseline
Average Office 60 Quiet One-half as loud
Suburban Street 55 Quiet
Light Traffic; Soft Radio
Music in Apartment
50 Quiet One-quarter as loud
Large Transformer 45 Quiet
Average Residence without
Stereo Playing
40 Faint One-eighth as loud
Soft Whisper 30 Faint
Rustling Leaves 20 Very Faint
Human Breathing 10 Very Faint Threshold of
Hearing
0 Very Faint
Source: Compiled by LSA Associates, Inc., 1998.

L S A A S S O C I A T E S , I N C .L S A A S S O C I A T E S , I N C .L S A A S S O C I A T E S , I N C .L S A A S S O C I A T E S , I N C . N O I S E I M P A C TN O I S E I M P A C TN O I S E I M P A C TN O I S E I M P A C T A N A L Y S I S A N A L Y S I S A N A L Y S I S A N A L Y S I S M A Y M A Y M A Y M A Y 2 0 0 82 0 0 82 0 0 82 0 0 8 C O L O R A D O L A GO ON R E S TC O L O R A D O L A GO ON R E S TC O L O R A D O L A GO ON R E S TC O L O R A D O L A GO ON R E S T O R A T I O N P R O J E C TO R A T I O N P R O J E C TO R A T I O N P R O J E C TO R A T I O N P R O J E C T
P:\CLB0702\Air and Noise Tech Studies\Noise1.doc «05/09/08» 22
Table C: Land Use Compatibility for Exterior Community Noise
Noise Range (Ldn or CNEL), dB
Land Use Category I II III IV
Passively-used open spaces 50 50–55 55–70 70+
Auditoriums, concert halls, amphitheaters 45–50 50–65 65–70 70+
Residential: low-density single-family, duplex,
mobile homes
50–55 55–70 70–75 75+
Residential: multifamily 50–60 60–70 70–75 75+
Transient lodging: motels, hotels 50–60 60–70 70–80 80+
Schools, libraries, churches, hospitals, nursing
homes
50–60 60–70 70–80 80+
Actively used open spaces: playgrounds,
neighborhood parks
50–67 — 67–73 73+
Golf courses, riding stables, water recreation,
cemeteries
50–70 — 70–80 80+
Office buildings, business commercial and
professional
50–67 67–75 75+ —
Industrial, manufacturing, utilities, agriculture 50–70 70–75 75+ —
Source: Office of Noise Control, California Department of Health, 1976.
Noise Range I—Normally Acceptable: Specified land use is satisfactory, based upon the assumption that any buildings
involved are of normal conventional construction, without any special noise insulation requirements.
Noise Range II—Conditionally Acceptable: New construction or development should be undertaken only after a detailed
analysis of the noise reduction requirements is made and needed noise insulation features are included in the design.
Conventional construction, but with closed windows and fresh air supply systems or air conditioning, will normally suffice.
Noise Range III—Normally Unacceptable: New construction or development should generally be discouraged. If new
construction or development does proceed, a detailed analysis of the noise reduction requirements must be made and needed
noise insulation features included in the design.
Noise Range IV—Clearly Unacceptable: New construction or development should generally not be undertaken.
CNEL = community noise equivalent level
dB = decibels
Ldn = day-night average noise level

L S A A S S O C I A T E S , I N C .L S A A S S O C I A T E S , I N C .L S A A S S O C I A T E S , I N C .L S A A S S O C I A T E S , I N C . N O I S E I M P A C TN O I S E I M P A C TN O I S E I M P A C TN O I S E I M P A C T A N A L Y S I S A N A L Y S I S A N A L Y S I S A N A L Y S I S M A Y M A Y M A Y M A Y 2 0 0 82 0 0 82 0 0 82 0 0 8 C O L O R A D O L A GO ON R E S TC O L O R A D O L A GO ON R E S TC O L O R A D O L A GO ON R E S TC O L O R A D O L A GO ON R E S T O R A T I O N P R O J E C TO R A T I O N P R O J E C TO R A T I O N P R O J E C TO R A T I O N P R O J E C T
P:\CLB0702\Air and Noise Tech Studies\Noise1.doc «05/09/08» 23
SETTING
SENSITIVE LAND USES IN THE PROJECT VICINITY
Certain land uses are considered more sensitive to noise than others. Examples of these include
residential areas, educational facilities, hospitals, childcare facilities, and senior housing. The
sensitive land uses within the vicinity of the proposed project include the existing residences to the
west, south, and northeast, Marina Vista Park to the east, the north and south Lagoon beaches, an on-
site preschool, and a recreational park golf course. These land uses are located within 50 to 100 ft of
the on-site construction areas.
OVERVIEW OF THE EXISTING NOISE ENVIRONMENT
The primary existing noise sources in the project area are transportation facilities. Traffic on Park
Avenue and East Appian Way is the dominant source contributing to area ambient noise levels at the
residences to the west. Noise from motor vehicles is generated by engine vibrations, the interaction
between the tires and the road, and the exhaust system.
THRESHOLDS OF SIGNIFICANCE
A project will normally have a significant effect on the environment related to noise if it will
substantially increase the ambient noise levels for adjoining areas or conflict with adopted
environmental plans and goals of the community in which it is located. The applicable noise
standards governing the project site are the criteria in the City’s Noise Element of the General Plan
and Municipal Code.
City of Long Beach Noise Standards
Noise Element of the General Plan. The Noise Element of the General Plan contains noise standards
for mobile noise sources. These standards address the impacts of noise from adjacent roadways and
airports. The City specifies outdoor and indoor noise limits for residential uses, places of worship,
educational facilities, hospitals, hotels/motels, and commercial and other land uses. The noise
standard for exterior living areas is 65 dBA CNEL. The indoor noise standard is 45 dBA CNEL,
which is consistent with the standard in the California Noise Insulation Standard.
Municipal Code. The City has adopted a quantitative Noise Control Ordinance, No. C-5371, Long
Beach 1978 (Municipal Code, Chapter 8.80). The ordinance establishes maximum permissible hourly
noise levels (L50) for different districts throughout the City. Tables D and E list exterior noise and
interior noise limits for various land uses. For the purposes of the proposed project, the exterior noise
standard of 70 dBA Lmax has been applied to all of the sensitive land uses, the residences, the
preschool, and the open space located within the vicinity of the project construction areas.

L S A A S S O C I A T E S , I N C .L S A A S S O C I A T E S , I N C .L S A A S S O C I A T E S , I N C .L S A A S S O C I A T E S , I N C . N O I S E I M P A C TN O I S E I M P A C TN O I S E I M P A C TN O I S E I M P A C T A N A L Y S I S A N A L Y S I S A N A L Y S I S A N A L Y S I S M A Y M A Y M A Y M A Y 2 0 0 82 0 0 82 0 0 82 0 0 8 C O L O R A D O L A GO ON R E S TC O L O R A D O L A GO ON R E S TC O L O R A D O L A GO ON R E S TC O L O R A D O L A GO ON R E S T O R A T I O N P R O J E C TO R A T I O N P R O J E C TO R A T I O N P R O J E C TO R A T I O N P R O J E C T
P:\CLB0702\Air and Noise Tech Studies\Noise1.doc «05/09/08» 24
Table D: Exterior Noise Limits, LN (dBA)
Receiving Land Use Time Period L50 L25 L8 L2 Lmax
Night: 10:00 p.m.–7:00 a.m. 45 50 55 60 65 Residential (District One)
Day: 7:00 a.m.–10:00 p.m. 50 55 60 65 70
Night: 10:00 p.m.–7:00 a.m. 55 60 65 70 75 Commercial (District Two)
Day: 7:00 a.m.–10:00 p.m. 60 65 70 75 80
Industrial (District Three) Anytime1 65 70 75 80 85
1 For use at boundaries rather than for noise control within industrial districts.
dBA = A-weighted decibels
LN = percentile noise exceedance level
Table E: Maximum Interior Sound Levels, LN (dBA)
Receiving Land Use Time Interval L8 L2 Lmax
10:00 p.m.–7:00 a.m. 35 40 45 Residential
7:00 a.m.–10:00 p.m. 45 50 55
School 7:00 a.m.–10:00 p.m.
(while school is in session)
45 50 55
Hospital and other noise-
sensitive zones
Anytime 40 45 50
dBA = A-weighted decibels
LN = percentile noise exceedance level
The City’s Noise Control Ordinance also governs the time of day that construction work can be
performed. The Noise Ordinance prohibits construction, drilling, repair, alteration, or demolition
work between the hours of 7:00 p.m. and 7:00 a.m. on weekdays or at any time on Sundays or federal
holidays if the noise would create a disturbance across a residential or commercial property line or
violate the quantitative provisions of the ordinance.
Vibration. Vibration energy propagates from a source through intervening soil and rock layers, to the
foundations of nearby buildings. The vibration then propagates from the foundation throughout the
remainder of the structure. Building vibration may be perceived by the occupants as motion of
building surfaces, rattling of items on shelves or hanging on walls, or a low-frequency rumbling
noise. The rumble noise is caused by the vibrating walls, floors, and ceilings radiating sound waves.
Ground-borne vibration is usually measured in terms of vibration velocity, either the root-mean-
square (rms) velocity or peak particle velocity (PPV). Rms is best for characterizing human response
to building vibration and PPV is used to characterize potential for damage. Ground vibrations from
construction activities do not often reach the levels that can damage structures, but they can achieve
the audible and feelable ranges in buildings very close to the site. Problems with ground-borne
vibration from construction sources are usually localized to areas within about 100 ft from the
vibration source.

L S A A S S O C I A T E S , I N C .L S A A S S O C I A T E S , I N C .L S A A S S O C I A T E S , I N C .L S A A S S O C I A T E S , I N C . N O I S E I M P A C TN O I S E I M P A C TN O I S E I M P A C TN O I S E I M P A C T A N A L Y S I S A N A L Y S I S A N A L Y S I S A N A L Y S I S M A Y M A Y M A Y M A Y 2 0 0 82 0 0 82 0 0 82 0 0 8 C O L O R A D O L A GO ON R E S TC O L O R A D O L A GO ON R E S TC O L O R A D O L A GO ON R E S TC O L O R A D O L A GO ON R E S T O R A T I O N P R O J E C TO R A T I O N P R O J E C TO R A T I O N P R O J E C TO R A T I O N P R O J E C T
P:\CLB0702\Air and Noise Tech Studies\Noise1.doc «05/09/08» 25
IMPACTS AND MITIGATION MEASURES
SHORT-TERM CONSTRUCTION-RELATED IMPACTS
Short-Term Construction-Related Noise Impacts
Two types of short-term noise impacts would occur during project construction. The first is the
increase in traffic flow on local streets, associated with the transport of workers, equipment, and
materials to and from the project site. The pieces of heavy equipment to be utilized during
construction will be moved to the site and remain for the duration of each construction phase. The
increase in traffic flow on the surrounding roads due to construction traffic is expected to be small.
The associated increase in long-term traffic noise will not be perceptible. However, there will be
short-term intermittent high noise levels associated with trucks passing by from the project site.
The second type of short-term noise impact is related to the noise generated by heavy equipment
operating within the project area. The proposed Lagoon restoration project will be divided into
multiple phases throughout project area. Each phase of construction will consist of multiple tasks.
The activities that will occur during these tasks will include:
• Existing Culvert Improvements
• Western Arm Sediment Removal
• Central Area Sediment Removal
• Storm Drain Treatments
• Bio-Swales
• North Parking Lot, Access Road, and Restroom Demolition
• Side Slope Recontouring
• Trail and Viewing Platform Construction
• Open Channel Construction
The following construction equipment will be required to complete the above tasks:
• Bulldozers
• Loaders
• Backhoes
• Excavators
• Graders
• Cranes
• Pile Driver

L S A A S S O C I A T E S , I N C .L S A A S S O C I A T E S , I N C .L S A A S S O C I A T E S , I N C .L S A A S S O C I A T E S , I N C . N O I S E I M P A C TN O I S E I M P A C TN O I S E I M P A C TN O I S E I M P A C T A N A L Y S I S A N A L Y S I S A N A L Y S I S A N A L Y S I S M A Y M A Y M A Y M A Y 2 0 0 82 0 0 82 0 0 82 0 0 8 C O L O R A D O L A GO ON R E S TC O L O R A D O L A GO ON R E S TC O L O R A D O L A GO ON R E S TC O L O R A D O L A GO ON R E S T O R A T I O N P R O J E C TO R A T I O N P R O J E C TO R A T I O N P R O J E C TO R A T I O N P R O J E C T
P:\CLB0702\Air and Noise Tech Studies\Noise1.doc «05/09/08» 26
• Paving Equipment
• Pumps
• Generators
• Dredge Tender Boat
Despite the variety in the type and size of construction equipment, similarities in the dominant noise
sources and patterns of operation allow construction-related noise ranges to be categorized by work
phase. Table F lists typical construction equipment noise levels recommended for noise impact
assessments, based on a distance of 50 ft between the equipment and a noise receptor.
Table F: Typical Construction Equipment Noise Levels
Type of Equipment
Range of
Maximum Sound
Levels Measured
(dBA at 50 feet)
Suggested
Maximum Sound
Levels for Analysis
(dBA at 50 feet)
Pile Drivers, 12,000 to 18,000 ft-lb/blow 81–96 93
Rock Drills 83–99 96
Jackhammers 75–85 82
Pneumatic Tools 78–88 85
Pumps 74–84 80
Scrapers 83–91 87
Haul Trucks 83–94 88
Cranes 79–86 82
Portable Generators 71–87 80
Rollers 75–82 80
Dozers 77–90 85
Tractors 77–82 80
Front-End Loaders 77–90 86
Hydraulic Backhoe 81–90 86
Hydraulic Excavators 81–90 86
Graders 79–89 86
Air Compressors 76–89 86
Trucks 81–87 86
Source: Noise Control for Buildings and Manufacturing Plants, Bolt, Beranek & Newman, 1987.
dBA = A-weighted decibels
ft-lb/blow = foot-pounds per below
Pile driving will be the noisiest activity on-site generating up to 93 dBA Lmax at a distance of 50 ft.
Other construction equipment used on-site, such as loaders and backhoes, would generate up to 86
dBA Lmax at a distance of 50 ft.
The following sensitive land uses are located within the vicinity of the proposed construction
activities.

L S A A S S O C I A T E S , I N C .L S A A S S O C I A T E S , I N C .L S A A S S O C I A T E S , I N C .L S A A S S O C I A T E S , I N C . N O I S E I M P A C TN O I S E I M P A C TN O I S E I M P A C TN O I S E I M P A C T A N A L Y S I S A N A L Y S I S A N A L Y S I S A N A L Y S I S M A Y M A Y M A Y M A Y 2 0 0 82 0 0 82 0 0 82 0 0 8 C O L O R A D O L A GO ON R E S TC O L O R A D O L A GO ON R E S TC O L O R A D O L A GO ON R E S TC O L O R A D O L A GO ON R E S T O R A T I O N P R O J E C TO R A T I O N P R O J E C TO R A T I O N P R O J E C TO R A T I O N P R O J E C T
P:\CLB0702\Air and Noise Tech Studies\Noise1.doc «05/09/08» 27
On-site Preschool. The on-site preschool is located within the vicinity of the central Lagoon dredge
area and the open channel construction area. Standard construction equipment that would generate up
to 86 dBA Lmax at a distance of 50 ft would be required for the central Lagoon dredging. Pile driving
equipment that would generate up to 93 dBA Lmax at a distance of 50 ft would be required for the
construction of the open channel and the viewing platform. Standard construction activities that occur
within 315 ft and pile driving that occurs within 706 ft of the preschool would generate noise levels in
excess of the City’s daytime exterior noise standard of 70 dBA Lmax. The preschool shall be closed
whenever construction or pile driving would occur within 315 and 706 feet, respectively.
Residential Developments. Residential developments are located within close proximity of each of
the proposed project’s construction phases. The highest noise levels would be generated by the pile
driving required to construct the open channel through Marina Vista Park. The existing homes in this
area are located within 150 ft of the active construction areas and would be exposed to pile driving
noise levels of up to 81 dBA Lmax. Homes located within 315 ft of the standard construction
equipment and 706 ft of the pile driving would be exposed to noise levels in excess of the City’s
daytime exterior noise standard of 70 dBA Lmax.
Open Space Land Uses. Open space land uses, such as the Marina Vista Park, the north and south
Lagoon beaches, and the recreational park golf course, are located within close proximity of each of
the proposed project’s construction phases. The highest noise levels within these uses would be
generated by the pile driving required to construct the open channel and the viewing platform.
Sensitive open space land uses located within 315 ft of the standard construction equipment and 706
ft of the pile driving would be exposed to noise levels in excess of the City’s daytime exterior noise
standard of 70 dBA Lmax.
Sensitive Land Uses Along the Haul Truck Routes. Sensitive land uses located along the proposed
haul truck routes, such as residences, parks, and schools, would be exposed to noise levels of up to 86
dBA Lmax at a distance of 50 ft. However, the increase in traffic flow on roads due to construction
traffic is expected to be small. Therefore, the associated increase in long-term traffic noise will not be
perceptible.
Due to the distance between construction activities and the existing sensitive receptors, project
construction activities would result in a significant noise impact; however, the noise impact would be
intermittent and temporary. The City’s regulations allow these noise sources between permitted hours
during construction because the noise sources are temporary. Adherence to the City’s noise
regulations and implementation of the mitigation measures listed below would reduce construction
impacts; however, the construction period noise impacts would remain significant and unavoidable.
Construction-related short-term noise levels would be higher than existing ambient noise levels in the
project area today but would no longer occur once construction of the project is completed.
Short-Term Construction-Related Vibration Impacts
The primary source of vibration during construction would be generated by the proposed pile driving.
The closest pile driving activities to a sensitive receptor would occur at a distance of 112 ft from the

L S A A S S O C I A T E S , I N C .L S A A S S O C I A T E S , I N C .L S A A S S O C I A T E S , I N C .L S A A S S O C I A T E S , I N C . N O I S E I M P A C TN O I S E I M P A C TN O I S E I M P A C TN O I S E I M P A C T A N A L Y S I S A N A L Y S I S A N A L Y S I S A N A L Y S I S M A Y M A Y M A Y M A Y 2 0 0 82 0 0 82 0 0 82 0 0 8 C O L O R A D O L A GO ON R E S TC O L O R A D O L A GO ON R E S TC O L O R A D O L A GO ON R E S TC O L O R A D O L A GO ON R E S T O R A T I O N P R O J E C TO R A T I O N P R O J E C TO R A T I O N P R O J E C TO R A T I O N P R O J E C T
P:\CLB0702\Air and Noise Tech Studies\Noise1.doc «05/09/08» 28
residential uses in the project vicinity. Using Equation 9 and Table 17 from the Caltrans
Transportation and Construction-Induced Vibration Guidance Manual (Jones & Stokes, June 2004) it
was estimated that the vibration level at this structure would be 0.07 inches per second (in/sec).
Although perceptible, this level would not exceed the 0.1 in/sec threshold below which there is
virtually no risk of resulting in architectural damage to normal buildings. Therefore, the proposed
project would not result in any significant vibration impacts.
LONG-TERM NOISE IMPACTS
Long-Term Operational Noise Impacts. The primary existing noise sources in the project area are
transportation facilities. Traffic on streets adjacent to the project site is the dominant source
contributing to ambient noise levels in the project vicinity. Noise from motor vehicles is generated by
engine vibrations, the interaction between the tires and the road, and the exhaust system.
The proposed project would implement habitat and recreation improvements to the existing project
area. The proposed project would retain the existing recreation and open space uses of the project site,
and any change in park attendance and patterns of use is expected to be negligible as a result of
project implementation. Likewise, the proposed project would not result in additional traffic and
traffic-related noise sources. In addition, the proposed project does not involve the use of on-site
noise-generating equipment, with the exception of the pumps for the stormwater diversion system.
The pumps would be below ground and in the bottom of the wet well. The noise generated by the
pumps would be very minimal. Therefore, the proposed project would not result in a substantial
permanent increase in ambient noise levels in the project vicinity, and impacts related to long-term
operational noise sources are less than significant.
Airport Noise Impacts. The Long Beach Municipal Airport is located approximately 3 miles north
of the project site. Based on the aircraft noise contours produced by the airports, the project site does
not lie within the 60 dBA CNEL contour of the airport. Therefore, the potential for a significant
impact from airport-related activities is small, and a single-event noise impact analysis is not
warranted for this site.
MITIGATION MEASURES
Construction Impacts
The City of Long Beach (City) Noise Control Officer shall ensure that the construction contractor
limits construction activity, which produces loud or unusual noise that annoys or disturbs a reasonable
person of normal sensitivity to between the hours of 7:00 p.m. and 7:00 a.m. Monday through Friday
and 9:00 a.m. and 6:00 p.m. on Saturdays and no construction activities on Sundays and federal
holidays in accordance with City standards.
The following measures can be implemented to reduce potential construction noise impacts on nearby
sensitive receptors:

L S A A S S O C I A T E S , I N C .L S A A S S O C I A T E S , I N C .L S A A S S O C I A T E S , I N C .L S A A S S O C I A T E S , I N C . N O I S E I M P A C TN O I S E I M P A C TN O I S E I M P A C TN O I S E I M P A C T A N A L Y S I S A N A L Y S I S A N A L Y S I S A N A L Y S I S M A Y M A Y M A Y M A Y 2 0 0 82 0 0 82 0 0 82 0 0 8 C O L O R A D O L A GO ON R E S TC O L O R A D O L A GO ON R E S TC O L O R A D O L A GO ON R E S TC O L O R A D O L A GO ON R E S T O R A T I O N P R O J E C TO R A T I O N P R O J E C TO R A T I O N P R O J E C TO R A T I O N P R O J E C T
P:\CLB0702\Air and Noise Tech Studies\Noise1.doc «05/09/08» 29
1. During all site excavation and grading, the project contractors shall equip all construction
equipment, fixed or mobile, with properly operating and maintained mufflers consistent with
manufacturers’ standards.
2. The project contractor shall place all stationary construction equipment so that emitted noise is
directed away from sensitive receptors nearest the project site.
3. The construction contractor shall locate equipment staging in areas that will create the greatest
distance between construction-related noise sources and noise-sensitive receptors nearest the
project site during all project construction.
4. Prior to issuance of a grading permit, the construction contractor shall provide evidence to the
City of Long Beach Building Official (or designee) that on-site sensitive land uses, such as the
on-site preschool and the beaches, shall be closed or relocated when construction activities occur
within 315 feet or pile driving occurs within 706 feet.
Level of Significance after Mitigation
The mitigation measures identified above would reduce temporary construction-related noise impacts;
however, the impacts would remain significant and unavoidable.

L S A A S S O C I A T E S , I N C .L S A A S S O C I A T E S , I N C .L S A A S S O C I A T E S , I N C .L S A A S S O C I A T E S , I N C . N O I S E I M P A C TN O I S E I M P A C TN O I S E I M P A C TN O I S E I M P A C T A N A L Y S I S A N A L Y S I S A N A L Y S I S A N A L Y S I S M A Y M A Y M A Y M A Y 2 0 0 82 0 0 82 0 0 82 0 0 8 C O L O R A D O L A GO ON R E S TC O L O R A D O L A GO ON R E S TC O L O R A D O L A GO ON R E S TC O L O R A D O L A GO ON R E S T O R A T I O N P R O J E C TO R A T I O N P R O J E C TO R A T I O N P R O J E C TO R A T I O N P R O J E C T
P:\CLB0702\Air and Noise Tech Studies\Noise1.doc «05/09/08» 30
REFERENCES
Bolt, Beranek & Newman. 1987. Noise Control for Buildings and Manufacturing Plants.
City of Long Beach. 1975. Noise Element of the General Plan.
City of Long Beach. 1988. Municipal Code.
Federal Highway Administration. 1977. Highway Traffic Noise Prediction Model, FHWA
RD-77-108.
United States Environmental Protection Agency (EPA). 1978. Protective Noise Levels: Condensed
Version of EPA Levels Document.