appendix e cost engineering - united states army
TRANSCRIPT
APPENDIX E
COST ENGINEERING
C-1
COST ENGINEERING APPENDIX
C-2
COST ENGINEERING APPENDIX
TABLE OF CONTENTS
Basis of Estimate
1. Background......................................................................................................C-3
2. Approach......................................................................................................... C-3
3. Key Assumptions............................................................................................. C-6
4. Results
MII TSP Cost Estimate...................................................................................................C-9
Total Project Schedule (Including Construction).........................................................C-12
Total Project Cost............................................................................................................C-14

C-3
Basis of Estimate
1. Background:
The Delta Islands Feasibility Study began as a multi-purpose (FRM and ER) study. However, due to the nature of how communities were generally distributed on the islands exterior near the existing levee footprints, FRM alone was eventually screened out due to low benefit cost ratios.
Refocused on ER alone, many potential sites were screened out due to the without project assumptions and the need for expensive, new setback levee construction required for most ER alternatives. When the concept of pumping suitable material over land to shallow flooded island locations in order to develop habitat was introduced, the parametric cost estimates identified the TSP as those elements utilizing pumping. Additionally, the proximity to the San Joaquin River created the opportunity to cost share and re-direct O&M dredging outflows directly to the ER project site.
2. Approach:
a. Cost Estimates In developing the feasibility level cost estimates of the various increments of the Delta
Islands Feasibility Report, the Cost Engineering team utilized a parametric methodology incorporating MII (MCACES, 2nd generation) generated unit costs. Costs for relocations and construction throughout initial screening through TSP selection were compiled based on 1) historical costs - past levee projects in the vicinity of the Legal Delta, 2) estimating software MII and 3) Parametric Cost Estimating Tool (PCET) developed by URS and successfully used on the Sutter Basin Feasibility Pilot Study.
During the screening process, the parametric spreadsheets utilized unit costs of certain typical levee design parameters including, for example, stripping vegetation, earthwork, cutoff walls, etc. The spreadsheet is essentially a collection/database of unit cost data from public bid results and projects that URS worked on for the California Department of Water Resources and other various public agencies. The parametric spreadsheet is thus believed to produce an effective and reliable estimate. URS developed the spreadsheet following typical levee designs provided by the Sacramento District (SPK) Geotech/Civil Design sections and computed the corresponding construction cost. The estimate is based on the manual inputs and output is based solely on the input. The project delivery team (PDT) collectively compiled the input parameters, based on best available Hydraulic and representative Geotechnical data to come up with recommended repairs (or new levee design) by reach. For each individual reach and cross section, the input parameters such as the levee height, crest width, levee slopes, cutoff wall
C-4
depths, etc., were quantified and used to generate the parametric portion of the estimate. The unit prices used were reviewed by SPK Cost Estimating Section and updated to reflect present day costs. In some cases, these unit costs were updated based on cost developed in MII.
Other major cost categories including cultural resources, PED (Preconstruction Engineering & Design), and Construction Management had to be considered separately. A percentage of the construction cost was used to compute costs for the remaining cost categories.
The cost estimates for each alternative for the purposes of screening and TSP selection, is the summation of the costs from the parametric spreadsheet output and the costs of the other major cost categories.
The Screening Level Estimates were developed based on the initial measures and these were combined to reflect the alternatives developed by the PDT. The estimates were continuously updated to match the current design refinements and the latest information available at the time of the revisions. The costs do not account for life cycle costs.
The estimates follow the Civil Works Work Breakdown Structure (CWWBS) code of accounts. Feature Codes typically involved in this estimate are 01- Lands and Damages, 06-Fish and Wildlife Facilities, 18-Cultural Resource Preservation, 30-Preconstruction Engineering and Design, and 31-Construction Management. The 30 and 31 accounts involve any costs associated with USACE staffing on the project. The amounts are based on historical data adjusted downward based upon the simple nature of the features of work.
b. Cost Uncertainties There are inherent uncertainties in the costs at the feasibility level of design since there is
no detailed design, plans or specs. However, the simplicity of the TSP’s features of work significantly reduced the potential uncertainty. There are additional uncertainties as the construction contractor(s) are responsible for obtaining most construction materials, accomplishing the work in a timely manner as per the project due date, using of overtime and/or multiple crews to accomplish the same, etc. There are also some cost uncertainties captured relative to risk analysis (see below).
For this project, more than 50% of the TSP’s costs are directly related to the cost to pump the previously dredged material to its placement site which has a low uncertainty due to the availability of data for this area.
During the screening process, the high uncertainty in suitable material availability, the need to acquire numerous tracts of land, and the condition/winding nature of haul routes within the Delta, translated into high material costs for the hauling alternatives that were quickly screened out for the previously dredged material storage sites. Alternatively, barging material to the sites is considered highly uncertain due to barge draft requirements related to the shallow depths of the nearby channels and placement sites. However, even with the unreasonable assumption that a barge could traverse to the sites, the material unit costs were more than 50% higher versus pumping.

C-5
c. OMRR&R Costs A brief investigation of OMRR&R costs was done by the PDT and determined to be
unnecessary due to the success of the nearby and similar case study, Donlon Island which resulted in the decision not to include any OMRR&R costs. This decision incorporates the fact that there is a 2 year period of monitoring included for each site in the base cost estimate.
d. Total Project Schedule (including Construction) Once the TSP was selected and the sequence of construction was determined, the Cost
Engineering Section’s master scheduler created the Total Project Schedule. The schedule has subsequently been revised twice following DQC comments. The assumption has been made that the PED portion of the project will occur in FY 16 thru FY 17 with the construction portion commencing FY 18. Construction is assumed to take 5 years, with 2 years of subsequent monitoring. e. Cost and Schedule Risk Analysis
An initial Abbreviated Cost Risk Analysis (ACRA) was performed for the project. The risk analysis process used is intended to determine the probability of various cost outcomes and quantify the required contingency needed in the cost estimate. Risk analysis results are intended to provide project leadership with contingency information in order to support decision making and risk management as the project progresses from planning through implementation. To fully recognize its benefits, cost and schedule risk analysis should be considered as an ongoing process conducted concurrent to, and iteratively with, other important project processes such as scope and execution plan development, resource planning, procurement planning, budgeting and scheduling.
A meeting was held 19 December with the project manager and most PDT members. The meeting focused primarily on risk factor identification using brainstorming techniques, but also included some discussions based on risk factors common to many civil works projects. The meeting included risk factor assessment and quantification and did result in some revisions to the estimate. Project risks were identified and a risk register developed as a spreadsheet (using Microsoft Excel). After the meeting, the draft risk register was forwarded to the PDT for review.
The quantitative impacts of each risk element on costs and schedule were analyzed using a combination of professional judgment, empirical data and analytical techniques. Risks that were not immediately agreed upon by the PDT were discussed at length and agreed upon in the form of inputs into the probability density functions. Quantification involved multiple project team disciplines and functions. The resulting product risk model therefore reflects the risk register parameters as developed by the PDT.
In simple terms, contingency is an amount added to an estimate and/or schedule that allows for items, conditions or events for which the occurrence or impact is uncertain and that experience suggests will likely result in additional costs being incurred or additional time being required.
C-6
The amount of contingency used for a project depends, at least in part, on the project leadership’s willingness to accept risk of project overruns.
f. Review
The TSP level cost estimate has been reviewed by senior estimators at the Sacramento District.
g. Screening Level Results
The tables at the conclusion of this section, Table 1, show a brief summary of the screening level results.
h. Final Array Results
The tables at the conclusion of this section, Table 2, show a brief summary of the final array cost estimates and the subsequent results from the environmental model output.
3. Key Assumptions: a. Parametric Estimates
- Cross Sections for the various levee improvements or new levees are representative of the levee reach (during screening).
- Unit Costs utilized are fair and reasonable and utilized an MCACES unit cost foundation whenever possible.
- 400 CY of material pumped per hour within a slurry mix of 90% water. - 50% of slurry outflow material settles into final position reducing which reduces the
amount of material needed to be handled following discharge.
b. Haul Distances – Levee Fill Borrow will come from within 30 miles (one-way haul) of the various disposal areas. The lack of a detailed borrow site study of the Delta, and the prevalence of peat (unsuitable for in-water placement or levee construction) within the Delta footprint, will significantly increase haul costs. Barging material into Big Break, Frank’s Tract and Little Frank’s Tract for open water ER placement is not feasible due to typically loaded barge draft depths exceeding the available depth by at least four feet of MSL at all three sites. Attempting to work in high tide and reduce available working hours or operate partially loaded barges was found to lose too great a level of transport efficiency to compete with the pumping based TSP alternatives.
c. Real Estate - Real Estate Costs used for screening and final array analysis are reasonable. Real Estate estimate errors will affect the alternatives evenly and/or not affect the ranked order of alternatives. Alternatively, the lack of adequate borrow material for both in water placement and levee construction (during screening), significantly increases non-dredge material sourcing costs due to the need to acquire and transport suitable material. The pipe crossing of HWY 160

C-7
necessary to pump from Decker Island south to Big Break is considered mobilization costs as opposed to relocation costs after it was determined to be reasonably constructible. Judy (530.741.4403) at the California Department of Transportation encroachment permitting department responsible for this specific stretch of road (region 3) stated that this was an acceptable permit application because of the classification of HWY 160 where encroachment permits are under much less scrutiny than HWY 5 for example, where this would be an unacceptable permit application.
d. Parametric Cost Estimates are sufficient for screening and evaluating the final array of alternatives in order to determine the TSP.
e. Quantity Uncertainty – Previously dredged material storage site quantities are based upon the deposits made since 2000. Correspondence with the controlling agencies indicates that the dredge material storage sites for the TSP have not removed a significant quantity of this material, if any, and is thus considered to be a conservative number. These figures were considered adequate to screen alternatives to the point of determining a tentatively selected plan because they are not expected to decrease which would only have a negative impact on per acre costs. The estimated expected quantity of yearly O&M material available is based upon the most recent placement figures (2006 to present) and the assumption that on most years, our expected amount should exceed the available amount to prevent mid operation shut down.
f. Project Schedule - PED portion of the project will occur from FY 16 thru FY 17 with the construction portion commencing FY 18. Construction is assumed to take 5 years followed by 2 years of monitoring. Real estate actions will be generally conducted the year prior to use.
g. Cultural Resources – Costs will be approximately 1% of the Federal Construction Costs
h. PED Costs – the assumed 15% of Construction Costs used in recent years by the Sacramento District is fair and reasonable due to the simplistic nature of the TSP’s features of work.
i. Construction Management Costs – assumed 8.5% of Construction Costs used in recent years by the Sacramento District is fair and reasonable due to the simplistic nature of the TSP’s features of work.
J. Constructability (In water earthwork) – Although there are concerns about the constructability of the in water earthwork due to depth of water and shapability of the material, this concern has been captured in the cost risk analysis and determined to be low risk of increasing cost or lengthening the schedule. Alternatively, a viable alternative of replacing the in water work with additional labor hours to physically move the discharge pipe outflow location at a higher rate is a cheaper, but less precise option. The lower precision of material placement is not a prohibitive consequence and ultimately is considered an acceptable alternative method of construction.
k. Constructability (Sacrificial Hay bales) – It is assumed that the sacrificial hay bale containment wall will be able to withstand the tidal forces applied to it over the course of the construction season. A robust design was used to ensure stability during the most dynamic
C-8
situation where tidal outflow is combined with pipe discharge. Additionally, the use of 120 degree sectors for the sacrificial hay bale wall arc maintains a modest flow rate assuming evenly distributed across the arc.
4. Results:

C-9
MII Cost Estimate
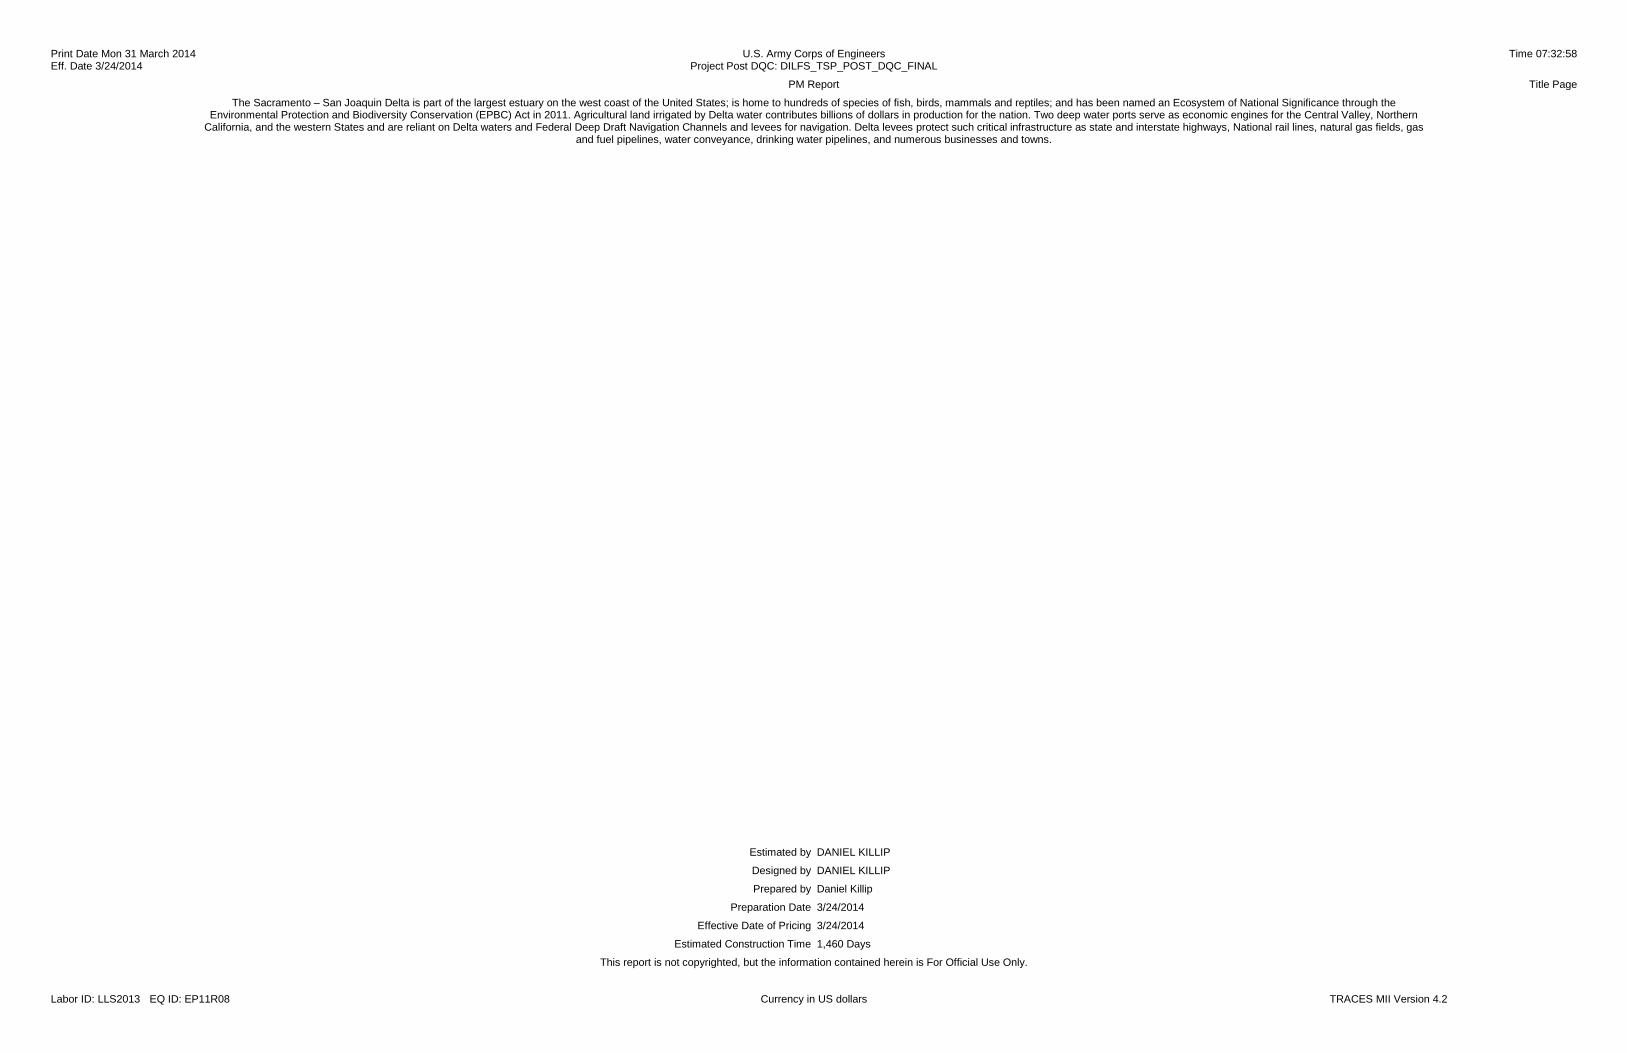
Estimated by DANIEL KILLIP Designed by DANIEL KILLIP Prepared by Daniel Killip Preparation Date 3/24/2014 Effective Date of Pricing 3/24/2014 Estimated Construction Time 1,460 Days This report is not copyrighted, but the information contained herein is For Official Use Only. Labor ID: LLS2013 EQ ID: EP11R08 Currency in US dollars TRACES MII Version 4.2
Print Date Mon 31 March 2014 U.S. Army Corps of Engineers Time 07:32:58 Eff. Date 3/24/2014 Project Post DQC: DILFS_TSP_POST_DQC_FINAL PM Report Title Page The Sacramento – San Joaquin Delta is part of the largest estuary on the west coast of the United States; is home to hundreds of species of fish, birds, mammals and reptiles; and has been named an Ecosystem of National Significance through the
Environmental Protection and Biodiversity Conservation (EPBC) Act in 2011. Agricultural land irrigated by Delta water contributes billions of dollars in production for the nation. Two deep water ports serve as economic engines for the Central Valley, Northern California, and the western States and are reliant on Delta waters and Federal Deep Draft Navigation Channels and levees for navigation. Delta levees protect such critical infrastructure as state and interstate highways, National rail lines, natural gas fields, gas
and fuel pipelines, water conveyance, drinking water pipelines, and numerous businesses and towns.

Print Date Mon 31 March 2014 U.S. Army Corps of Engineers Time 07:32:58 Eff. Date 3/24/2014 Project Post DQC: DILFS_TSP_POST_DQC_FINAL PM Report PM Report Page 1
Description UOM ProjectCost
Labor ID: LLS2013 EQ ID: EP11R08 Currency in US dollars TRACES MII Version 4.2
PM Report 17,554,416.62 BB1 - O&M DIRECT PLACEMENT (CONSTRUCTION YEARS 1-5) CY 3,275,584.19 23.0409 BB2 - MCCORMACK (CONSTRUCTION YEAR 1) CY 2,857,604.63 25.3215 BB3 - SCOUR (CONSTRUCTION YEAR 2) CY 5,317,321.48 26.8200 BB4 - DECKER ISLAND (CONSTRUCTION YEAR 3) CY 3,339,093.48 18.0571 LFT1 - BRADFORD (CONSTRUCTION YEAR 4) CY 2,764,812.83

C-12
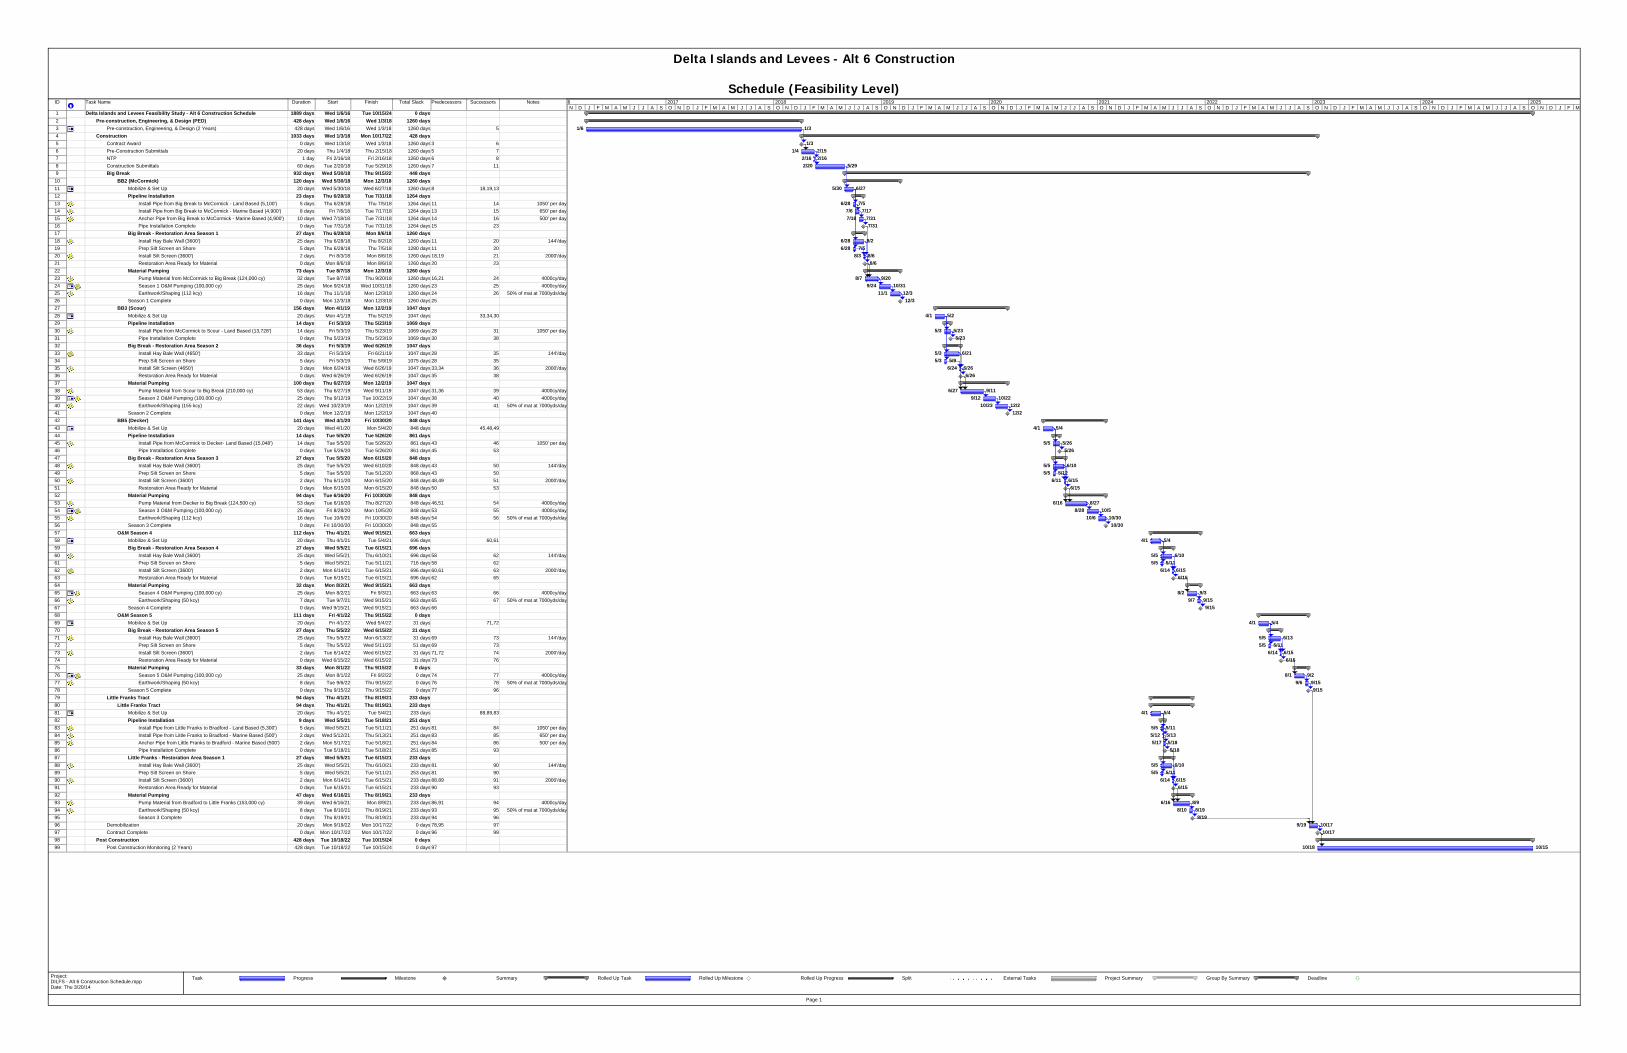
Construction Schedule
ID Task Name Duration Start Finish Total Slack Predecessors Successors Notes
1 Delta Islands and Levees Feasibility Study - Alt 6 Construction Schedule 1889 days Wed 1/6/16 Tue 10/15/24 0 days2 Pre-construction, Engineering, & Design (PED) 428 days Wed 1/6/16 Wed 1/3/18 1260 days3 Pre-construction, Engineering, & Design (2 Years) 428 days Wed 1/6/16 Wed 1/3/18 1260 days 54 Construction 1033 days Wed 1/3/18 Mon 10/17/22 428 days5 Contract Award 0 days Wed 1/3/18 Wed 1/3/18 1260 days 3 66 Pre-Construction Submittals 20 days Thu 1/4/18 Thu 2/15/18 1260 days 5 77 NTP 1 day Fri 2/16/18 Fri 2/16/18 1260 days 6 88 Construction Submittals 60 days Tue 2/20/18 Tue 5/29/18 1260 days 7 119 Big Break 932 days Wed 5/30/18 Thu 9/15/22 448 days10 BB2 (McCormick) 120 days Wed 5/30/18 Mon 12/3/18 1260 days11 Mobilize & Set Up 20 days Wed 5/30/18 Wed 6/27/18 1260 days 8 18,19,1312 Pipeline Installation 23 days Thu 6/28/18 Tue 7/31/18 1264 days13 Install Pipe from Big Break to McCormick - Land Based (5,100') 5 days Thu 6/28/18 Thu 7/5/18 1264 days 11 14 1050' per day14 Install Pipe from Big Break to McCormick - Marine Based (4,900') 8 days Fri 7/6/18 Tue 7/17/18 1264 days 13 15 650' per day15 Anchor Pipe from Big Break to McCormick - Marine Based (4,900') 10 days Wed 7/18/18 Tue 7/31/18 1264 days 14 16 500' per day16 Pipe Installation Complete 0 days Tue 7/31/18 Tue 7/31/18 1264 days 15 2317 Big Break - Restoration Area Season 1 27 days Thu 6/28/18 Mon 8/6/18 1260 days18 Install Hay Bale Wall (3600') 25 days Thu 6/28/18 Thu 8/2/18 1260 days 11 20 144'/day19 Prep Silt Screen on Shore 5 days Thu 6/28/18 Thu 7/5/18 1280 days 11 2020 Install Silt Screen (3600') 2 days Fri 8/3/18 Mon 8/6/18 1260 days 18,19 21 2000'/day21 Restoration Area Ready for Material 0 days Mon 8/6/18 Mon 8/6/18 1260 days 20 2322 Material Pumping 73 days Tue 8/7/18 Mon 12/3/18 1260 days23 Pump Material from McCormick to Big Break (124,000 cy) 32 days Tue 8/7/18 Thu 9/20/18 1260 days 16,21 24 4000cy/day24 Season 1 O&M Pumping (100,000 cy) 25 days Mon 9/24/18 Wed 10/31/18 1260 days 23 25 4000cy/day25 Earthwork/Shaping (112 kcy) 16 days Thu 11/1/18 Mon 12/3/18 1260 days 24 26 50% of mat at 7000yds/day26 Season 1 Complete 0 days Mon 12/3/18 Mon 12/3/18 1260 days 2527 BB3 (Scour) 156 days Mon 4/1/19 Mon 12/2/19 1047 days28 Mobilize & Set Up 20 days Mon 4/1/19 Thu 5/2/19 1047 days 33,34,3029 Pipeline Installation 14 days Fri 5/3/19 Thu 5/23/19 1069 days30 Install Pipe from McCormick to Scour - Land Based (13,728') 14 days Fri 5/3/19 Thu 5/23/19 1069 days 28 31 1050' per day31 Pipe Installation Complete 0 days Thu 5/23/19 Thu 5/23/19 1069 days 30 3832 Big Break - Restoration Area Season 2 36 days Fri 5/3/19 Wed 6/26/19 1047 days33 Install Hay Bale Wall (4650') 33 days Fri 5/3/19 Fri 6/21/19 1047 days 28 35 144'/day34 Prep Silt Screen on Shore 5 days Fri 5/3/19 Thu 5/9/19 1075 days 28 3535 Install Silt Screen (4650') 3 days Mon 6/24/19 Wed 6/26/19 1047 days 33,34 36 2000'/day36 Restoration Area Ready for Material 0 days Wed 6/26/19 Wed 6/26/19 1047 days 35 3837 Material Pumping 100 days Thu 6/27/19 Mon 12/2/19 1047 days38 Pump Material from Scour to Big Break (210,000 cy) 53 days Thu 6/27/19 Wed 9/11/19 1047 days 31,36 39 4000cy/day39 Season 2 O&M Pumping (100,000 cy) 25 days Thu 9/12/19 Tue 10/22/19 1047 days 38 40 4000cy/day40 Earthwork/Shaping (155 kcy) 22 days Wed 10/23/19 Mon 12/2/19 1047 days 39 41 50% of mat at 7000yds/day41 Season 2 Complete 0 days Mon 12/2/19 Mon 12/2/19 1047 days 4042 BB5 (Decker) 141 days Wed 4/1/20 Fri 10/30/20 848 days43 Mobilize & Set Up 20 days Wed 4/1/20 Mon 5/4/20 848 days 45,48,4944 Pipeline Installation 14 days Tue 5/5/20 Tue 5/26/20 861 days45 Install Pipe from McCormick to Decker- Land Based (15,048') 14 days Tue 5/5/20 Tue 5/26/20 861 days 43 46 1050' per day46 Pipe Installation Complete 0 days Tue 5/26/20 Tue 5/26/20 861 days 45 5347 Big Break - Restoration Area Season 3 27 days Tue 5/5/20 Mon 6/15/20 848 days48 Install Hay Bale Wall (3600') 25 days Tue 5/5/20 Wed 6/10/20 848 days 43 50 144'/day49 Prep Silt Screen on Shore 5 days Tue 5/5/20 Tue 5/12/20 868 days 43 5050 Install Silt Screen (3600') 2 days Thu 6/11/20 Mon 6/15/20 848 days 48,49 51 2000'/day51 Restoration Area Ready for Material 0 days Mon 6/15/20 Mon 6/15/20 848 days 50 5352 Material Pumping 94 days Tue 6/16/20 Fri 10/30/20 848 days53 Pump Material from Decker to Big Break (124,500 cy) 53 days Tue 6/16/20 Thu 8/27/20 848 days 46,51 54 4000cy/day54 Season 3 O&M Pumping (100,000 cy) 25 days Fri 8/28/20 Mon 10/5/20 848 days 53 55 4000cy/day55 Earthwork/Shaping (112 kcy) 16 days Tue 10/6/20 Fri 10/30/20 848 days 54 56 50% of mat at 7000yds/day56 Season 3 Complete 0 days Fri 10/30/20 Fri 10/30/20 848 days 5557 O&M Season 4 112 days Thu 4/1/21 Wed 9/15/21 663 days58 Mobilize & Set Up 20 days Thu 4/1/21 Tue 5/4/21 696 days 60,6159 Big Break - Restoration Area Season 4 27 days Wed 5/5/21 Tue 6/15/21 696 days60 Install Hay Bale Wall (3600') 25 days Wed 5/5/21 Thu 6/10/21 696 days 58 62 144'/day61 Prep Silt Screen on Shore 5 days Wed 5/5/21 Tue 5/11/21 716 days 58 6262 Install Silt Screen (3600') 2 days Mon 6/14/21 Tue 6/15/21 696 days 60,61 63 2000'/day63 Restoration Area Ready for Material 0 days Tue 6/15/21 Tue 6/15/21 696 days 62 6564 Material Pumping 32 days Mon 8/2/21 Wed 9/15/21 663 days65 Season 4 O&M Pumping (100,000 cy) 25 days Mon 8/2/21 Fri 9/3/21 663 days 63 66 4000cy/day66 Earthwork/Shaping (50 kcy) 7 days Tue 9/7/21 Wed 9/15/21 663 days 65 67 50% of mat at 7000yds/day67 Season 4 Complete 0 days Wed 9/15/21 Wed 9/15/21 663 days 6668 O&M Season 5 111 days Fri 4/1/22 Thu 9/15/22 0 days69 Mobilize & Set Up 20 days Fri 4/1/22 Wed 5/4/22 31 days 71,7270 Big Break - Restoration Area Season 5 27 days Thu 5/5/22 Wed 6/15/22 31 days71 Install Hay Bale Wall (3600') 25 days Thu 5/5/22 Mon 6/13/22 31 days 69 73 144'/day72 Prep Silt Screen on Shore 5 days Thu 5/5/22 Wed 5/11/22 51 days 69 7373 Install Silt Screen (3600') 2 days Tue 6/14/22 Wed 6/15/22 31 days 71,72 74 2000'/day74 Restoration Area Ready for Material 0 days Wed 6/15/22 Wed 6/15/22 31 days 73 7675 Material Pumping 33 days Mon 8/1/22 Thu 9/15/22 0 days76 Season 5 O&M Pumping (100,000 cy) 25 days Mon 8/1/22 Fri 9/2/22 0 days 74 77 4000cy/day77 Earthwork/Shaping (50 kcy) 8 days Tue 9/6/22 Thu 9/15/22 0 days 76 78 50% of mat at 7000yds/day78 Season 5 Complete 0 days Thu 9/15/22 Thu 9/15/22 0 days 77 9679 Little Franks Tract 94 days Thu 4/1/21 Thu 8/19/21 233 days80 Little Franks Tract 94 days Thu 4/1/21 Thu 8/19/21 233 days81 Mobilize & Set Up 20 days Thu 4/1/21 Tue 5/4/21 233 days 88,89,8382 Pipeline Installation 9 days Wed 5/5/21 Tue 5/18/21 251 days83 Install Pipe from Little Franks to Bradford - Land Based (5,300') 5 days Wed 5/5/21 Tue 5/11/21 251 days 81 84 1050' per day84 Install Pipe from Little Franks to Bradford - Marine Based (500') 2 days Wed 5/12/21 Thu 5/13/21 251 days 83 85 650' per day85 Anchor Pipe from Little Franks to Bradford - Marine Based (500') 2 days Mon 5/17/21 Tue 5/18/21 251 days 84 86 500' per day86 Pipe Installation Complete 0 days Tue 5/18/21 Tue 5/18/21 251 days 85 9387 Little Franks - Restoration Area Season 1 27 days Wed 5/5/21 Tue 6/15/21 233 days88 Install Hay Bale Wall (3600') 25 days Wed 5/5/21 Thu 6/10/21 233 days 81 90 144'/day89 Prep Silt Screen on Shore 5 days Wed 5/5/21 Tue 5/11/21 253 days 81 9090 Install Silt Screen (3600') 2 days Mon 6/14/21 Tue 6/15/21 233 days 88,89 91 2000'/day91 Restoration Area Ready for Material 0 days Tue 6/15/21 Tue 6/15/21 233 days 90 9392 Material Pumping 47 days Wed 6/16/21 Thu 8/19/21 233 days93 Pump Material from Bradford to Little Franks (153,000 cy) 39 days Wed 6/16/21 Mon 8/9/21 233 days 86,91 94 4000cy/day94 Earthwork/Shaping (50 kcy) 8 days Tue 8/10/21 Thu 8/19/21 233 days 93 95 50% of mat at 7000yds/day95 Season 3 Complete 0 days Thu 8/19/21 Thu 8/19/21 233 days 94 9696 Demobilization 20 days Mon 9/19/22 Mon 10/17/22 0 days 78,95 9797 Contract Complete 0 days Mon 10/17/22 Mon 10/17/22 0 days 96 9998 Post Construction 428 days Tue 10/18/22 Tue 10/15/24 0 days99 Post Construction Monitoring (2 Years) 428 days Tue 10/18/22 Tue 10/15/24 0 days 97
1/6 1/3
1/31/4 2/15
2/16 2/162/20 5/29
5/30 6/27
6/28 7/57/6 7/177/18 7/31
7/31
6/28 8/26/28 7/5
8/3 8/68/6
8/7 9/209/24 10/31
11/1 12/312/3
4/1 5/2
5/3 5/235/23
5/3 6/215/3 5/9
6/24 6/266/26
6/27 9/119/12 10/22
10/23 12/212/2
4/1 5/4
5/5 5/265/26
5/5 6/105/5 5/12
6/11 6/156/15
6/16 8/278/28 10/5
10/6 10/3010/30
4/1 5/4
5/5 6/105/5 5/11
6/14 6/156/15
8/2 9/39/7 9/15
9/15
4/1 5/4
5/5 6/135/5 5/11
6/14 6/156/15
8/1 9/29/6 9/15
9/15
4/1 5/4
5/5 5/115/12 5/135/17 5/18
5/18
5/5 6/105/5 5/11
6/14 6/156/15
6/16 8/98/10 8/19
8/199/19 10/17
10/17
10/18 10/15
N D J F M A M J J A S O N D J F M A M J J A S O N D J F M A M J J A S O N D J F M A M J J A S O N D J F M A M J J A S O N D J F M A M J J A S O N D J F M A M J J A S O N D J F M A M J J A S O N D J F M A M J J A S O N D J F M6 2017 2018 2019 2020 2021 2022 2023 2024 2025
Task Progress Milestone Summary Rolled Up Task Rolled Up Milestone Rolled Up Progress Split External Tasks Project Summary Group By Summary Deadline
Delta Islands and Levees - Alt 6 Construction
Schedule (Feasibility Level)
Page 1
Project: DILFS - Alt 6 Construction Schedule.mppDate: Thu 3/20/14
C-14
Total Project Cost, Tentatively Selected Plan

PROJECT: Delta Islands Feasibility Study DISTRICT: SPK Sacramento PREPARED: 3/19/2014
LOCATION: Delta Islands, CA POC: CHIEF, COST ENGINEERING, Jerry Frost
This Estimate reflects the scope and schedule in report; Delta Islands Feasibility Study
Program Year (Budget EC): 2015
Effective Price Level Date: 1 OCT 14 FULLY FUNDED PROJECT ESTIMATE
BASE COST FIRST COST Spent Thru:
WBS Civil Works COST CNTG CNTG TOTAL ESC COST CNTG TOTAL 1-Oct-13 COST CNTG FULL
NUMBER Feature & Sub-Feature Description ($K) ($K) (%) ($K) (%) ($K) ($K) ($K) ($K) ($K) ($K) ($K)
A B C D E F G H I J K L M N O
06 FISH & WILDLIFE FACILITIES $17,554 $2,993 17% $20,547 1.7% $17,853 $3,044 $20,897 $19,595 $3,341 $22,936
18 CULTURAL RESOURCE PRESERVATION $176 $30 17% $205 1.7% $179 $30 $209 $196 $33 $229
__________ __________ ___________ _________ _________ ___________ _________ _________ ____________
CONSTRUCTION ESTIMATE TOTALS: $17,730 $3,023 $20,753 1.7% $18,031 $3,074 $21,106 $19,791 $3,374 $23,166
01 LANDS AND DAMAGES $2,883 $577 20% $3,460 1.7% $2,932 $586 $3,519 $3,202 $640 $3,842
30 PLANNING, ENGINEERING & DESIGN $2,641 $450 17% $3,091 3.9% $2,743 $468 $3,211 $2,983 $509 $3,491
31 CONSTRUCTION MANAGEMENT $1,464 $250 17% $1,714 3.9% $1,521 $259 $1,780 $1,822 $311 $2,133
__________ __________ ___________ _________ _________ ___________ ___________ _________ _________ ____________
PROJECT COST TOTALS: $24,718 $4,300 17% $29,018 2.1% $25,227 $4,388 $29,615 $27,798 $4,834 $32,632
CHIEF, COST ENGINEERING, Jerry Frost
ESTIMATED FEDERAL COST: 65% $21,211 PROJECT MANAGER, xxx ESTIMATED NON-FEDERAL COST: 35% $11,421
CHIEF, REAL ESTATE, xxx ESTIMATED TOTAL PROJECT COST: $32,632
CHIEF, PLANNING,xxx
CHIEF, ENGINEERING, xxx THIS TPCS REFLECTS A PROJECT COST CHANGE OF ======>
CHIEF, OPERATIONS, xxx THE 902 COST LIMIT IS ===============================>
CHIEF, CONSTRUCTION, xxx
CHIEF, CONTRACTING,xxx
O&M OUTSIDE OF TOTAL PROJECT COST: CHIEF, PM-PB, xxxx
CHIEF, DPM, xxx
Appendix D - Sample TPCSPage 1 of 7
Printed:3/26/2014