appendix d : transportation infrastructure
TRANSCRIPT

Appendix D : Transportation Infrastructure
TABLE OF CONTENTS
D.1 Infrastructure of the Rice Market.......................................................... D - 1D.1.1 Infrastructure of the Rice Market .............................................. D - 1D.1.2 Means of Transportation ............................................................ D - 2D.1.3 Transportation Law and Checkpoints ........................................ D - 3
D.2 Present Conditions of Infrastructure ..................................................... D - 4D.2.1 Road Conditions ........................................................................ D - 4D.2.2 Railway Conditions ................................................................... D - 7D.2.3 Waterways and Ports.................................................................. D - 8
D.3 Problems of Transportation and Traffic ................................................ D - 9D.3.1 Road .................................................................................... D - 9D.3.2 Railway .................................................................................... D - 10D.3.3 Waterways and Ports.................................................................. D - 10
D.4 Direction of Development of Transportation Network.......................... D - 11D.4.1 Road .................................................................................... D - 11D.4.2 Railway .................................................................................... D - 11D.4.3 Waterways and Ports.................................................................. D - 12
Tables and Figures .................................................................................... D - 14

D - 1
Appendix D : Transportation Infrastructure D.1 Infrastructure of the Rice Market
D.1.1 Infrastructure of the Rice Market
The physical facilities and social systems required for distribution of goods are called marketinfrastructure. The former are named hard-infrastructures and the later soft-infrastructures. With rice,it takes time and money to transport and store it, and to distribute it from the farmer to consumer; andits quality and quantity also changes during this process; from paddy to white rice. Infrastructurerelevant to the rice market can be listed as follows:
1) Hard-infrastructure: Facilities for transportation, storage, rice mill, market,information facility
a) Transportation facility: Truck, Road, Railway and Vessel.b) Storage facility: Government / GTC & Rice miller warehouse,
Wholesaler warehouse and Farmer house.c) Rice mill facility: Rice mill, Power supply facilityd) Market facilities: Public market, Wholesaler shop and Retail shope) Information facility:
2) Soft-infrastructures: Regulations and Laws on Transport, Organizationsystem, Check system, Network of Transport
Rice distribution flow would be stemmed or halted if transportation and storage facilities were poor;or if restrictions such as severe check system or taxation systems are imposed. Disrupted distributionflows could cause higher prices and lower quality of rice.The rice distribution flow in Cambodia is shown in Figure-1 below.
Figure-1 Rice distribution flow chart
Middleman(Collector)
Farmer Rice Miller Seller(Market)
Consumer
Middleman(Checkpoint)
Export toVietnam & Thailand

D - 2
This flow is activated by the private sector, which transports rice by truck. Poor road conditions andcheckpoints, at which legal/illegal money is collected, hinder the flow of rice distribution.Warehouses and rice mill facilities owned by government are not significant at present.
D.1.2 Means of Transportation
Before 1993, shipping vessels and railways played a more important role than trucks in transportinggoods. However, since then inland transportation by trucks has become the major mode of transportation.The volume of 3.2 million tons by inland transportation in 1999 was 85 times that of 1993 and is 66 percentof all transportation as shown in Table-1 below. Inland transportation volume by road is increasing withthe help of up-graded road conditions. Transportation by vessels is increasing (except 1999), through portrehabilitation for imports and exports. Volume at Sihanoukville port is exceeding that of Phnom Penh port.Transportation volume by railway is also gaining gradually, but its share is relatively smaller than that oftruck or vessel. Old rail works, poor train maintenance and inefficient loading/unloading facilities restrictthe expansion of railway transportation.
Table-1 Annual Transportation VolumeMeans Unit 1993 1994 1995 1996 1997 1998 1999
1,000 ton 38 1、246 2、115 2、563 2、823 2,685 3,214Road
1,000 ton-km 3,930 133,070 214,672 269,164 293,450 284,180 308,1581,000 ton 130 61 48 76 169 294 270
Railway1,000 ton-km 34,000 14,100 7,797 9,700 36,095 75,785 77,3861,000 ton 991 1,118 1,273 1,326 1,452 1,505 1,391Phnom Penh 517 571 566 585 658 620 459VesselSihanoukville 474 547 707 741 794 885 932
Notes: Transportation volume of inland river ports is not included.Source: (1) Report on Annual Transportation 1999, Ministry of Public Works and Transport
(2) Phnom Penh Port Yearly Operation Statement, Ministry of Public Works and Transport
Rice volume by railway and vessels are shown in Table-2 below. In the case of railway, transportationvolume on the North line, which runs from Phnom Penh to Bat Dambang, was more than that on theSouth line except in 1998. South line from Phnom Penh to Sihanoukville became prosperous afterrehabilitation of National Road RN-4. This has increasingly been used for transportation of importedand exported goods, when roads trucks become an important means of transportation fromSihanoukville to Phnom Penh
Before 1995, both the import and export of rice was conducted from Phnom Penh port andSihanoukville port. Statistical data in Table –2 show that rice had been exported up to 1996. Recently,rice importation is increasing; this data also include rice supplied by WFP.
However, rice is legally and illegally exported by traders at the eastern border to Vietnam and at the

D - 3
western border to Thailand. More paddy rice is exported than imported to other countries at bothborders. Although the total volume exported is comparatively small, it is not favorable to the supplyand demand required by this country.
Table-2 Transportation by Railway: and the Volume of Rice Imports and Exports (Unit: tons)
Description 1992 1993 1994 1995 1996 1997 1998 1999North 160 9,930 1,105 4,602 21,296 8,513 320 7,780
RailwaySouth - 235 - 520 1,500 1,040 7,040 305
Phnom Penh Export 21,014 18,640 11,622 6,573 - - - -Import 5,970 10,449 18,867 36,685 23,540 6,952 16,615 10,889
SihanoukvilleExport - - - - 2,611 - - -
Source: (1) Historical Background of the Royal Cambodian Railway, Feb. 2000; International Relation Office(2) Phnom Penh Port Yearly Operation Statement, Ministry of Public Works and Transport
D.1.3 Transportation Law and Checkpoints
(1) Decree/declaration on Transport
A Law on Transport is under preparation for submission to Parliament at the end of this year.Currently transport is regulated according to the following decrees:
Ministry of Public Works and Transport- Sub decree on Maximum Limitation of Vehicle Weight on National Routes- Declaration on Maximum Limitation of Vehicle Weight on National Routes
Ministry of the Interior- Declaration on Money Fine of Over-loaded Truck Weight on Route
Many checkpoints are established at borders by the Army, Army Police, Police, Customs, Commerce,Provincial Offices to monitor movement of goods and human beings. Payment is requested byofficers at each checkpoint or joint checkpoints.
(2) Check Points
Sub-Decree Concerned with Demobilization and Creation of Posts Inspection along Border CheckPoint established various kinds of checkpoints. The Decree states: “The creation of post inspection tocontrol entry and exit along border check points by roads such as roads, ships, railways and airlines inthe Kingdom of Cambodia are under administration at the central level”.The Agencies responsible are: National Police Armies, CAMCONTROL Agent, Customs and ExciseAgents, Sanitary Vegetation Agents, Armies and Police Agents and Medical Inspection Agents.

D - 4
Table-3 Type and Number of Check Points
Type Nature of Transport TotalNumbers Study Area
National road 5 3Waterway 4 3Railway 5 2
1.Check point
By sea 5 02.International border gates Port, river, road 7 53.Entry and exit border Gate Road 5 24. Border gate area Waterway, sea, transport 44 20
Source: Check Points by Sub-decree Concerned on Demobilization and Creation of Post Inspection a long border Check
Point
D.2 Present Conditions of Infrastructure
D.2.1 Road Conditions
(1) Road Class and Length
The roads in Cambodia are classified as: National roads, Other National roads, Provincial roads andRural roads including farm roads. National road works are the responsibility of the Ministry ofPublic Works and Transport (whose organization chart is shown in Appendix Figure-1). Some ofthese are designated as Asian highways: National roads RN-1 and RN-2 run to Vietnam, RN-5 toThailand and RN-7 to Laos. (See Appendix Figure-2 Road Network). The total length of theNational roads is 4,165 km and its density is 22.9 m/sq.km; and the total length of roads includingprovincial roads is 12,220 km and its density is 67.3 m/sq.km. The average density of Nationalroads including Provincial roads in the Study Area is 632.8 m/sq.km and maximum density is 126.3m/sq.km in Takaev except Phnom Penh and minimum 28.4 m/sq.km in Bat Dambang
Table-4 Number and Length of each Road (Country Area=181,035 sq.km)
Road Class O.M Agency Nos. Length(km) Density Asian
HighwayNational road 7 1,988 A-1, 11,13Other National R.
Ministry ofPublic Works 37 2,177
22.9 m/sq.km
Provincial Road Province 124 3,555 19.6 m/sq.kmRural road Province 4,500 24.8 m/sq.kmTotal: 168 12,220 67.3 m/sq.km
Source: Ministry of Public Works and Transport--- Cambodian Road Network

D - 5
Table-5 Length of Road in the Study Area
Province Area(sq.km)
NationalRoad (km)
Other Ntl.Road (km)
Prov. Road(km)
Total(km)
Density(m/sq.km)
Kandal 3,669 188.987 143.464 47.083 379,534 103.4Prey Veaeng 4,847 42.505 55.254 200.622 298,381 61.6Kampong Cham 6,538 235.620 137.636 158.176 531.432 83.6Svay Rieng 4,847 69.606 37.684 332.636 439.926 90.8Takaov 3,430 297.384 14.423 121.245 433.052 126.3Kampong Spueu 6,756 264.765 131.381 313.996 710,142 105.1K. Chhnang 5,278 94.259 34.963 146.813 276.035 52.3Bat Dambang 12,501 114,043 83.943 156.496 354.482 28.4Siem Reab 15,726 132.967 204.238 160.990 498.195 31.7Phnom Penh 402 70.186 3.262 15.513 88.961 221.3Total 63,814 1,510.322 846.248 1,653.570 4,010.14 62.8
Source: Ministry of Public Works and Transport--- Cambodian Road Network
Provincial capitals in the Study Area are connected with National roads from RN-1 to RN-7 andlocations are convenient for transportation of goods. Most of the National roads are paved withasphalt-concrete or laterite; however they are damaged or broken in numerous sections of the road,with big and small potholes. Most of the roads were reconstructed in 1994 as shown in Table-5. But atpresent, the average driving speed of cars is only 20 to 50 km/hour, excluding RN-4 and someportions of RN-6 & RN-7. Most of the Other National roads and Provincial roads paved with lateriteare often not drivable after heavy rains.
Table-6 Road Projects 1993 - present
Route From To Length Fund Year Restoration
RN-1 Phnom Penh Neak Loeangg 56km ADB 1995Neak Loeangg Vietnam Border 106km ADB 1996
RN-2 Phnom Penh Takaev 63km ADB 1995RN-3 Phnom Penh Aeu 63km ADB 1995
Kampot Veal Rinh 63km W. Bank 1995RN-4 Phnom Penh Sihanoukville 217km USA 1996RN-5 Poipet Sisophon 49km Thai 1994
Sisophon Bat Dambang 80km UNTAC 1993Bat Dambang Pousat 105km UNDP 1993Phnom Penh Sisophon 360km ADB/UNDP 1995
RN-6 RN-5 Skun 30km ADB 1995Skun Tang Kouk 30km ADB 1994Phnom Penh 44km Japan 1995Skun 28km Japan 1999
RN-7 Skun Kampong Cham 45km Japan 1999Mekong River Bridge Constructing
RN-11 RN-1 RN-7 90km ADB 1995Source: Ministry of Foreign Affairs in Japan

D - 6
(2) Volume of Transportation on each National Road
A traffic counting survey on the National roads was carried out by ADB in 1994. Results of thatsurvey on volume of transportation is shown as Table-6 below. RN-4, which runs from Phnom Penhto Sihanoukville, has the highest share and RN-5 the next. Major goods transported were,construction materials such as cement, steel bars, (26%); agro-products (25%); petrol (16%) andtimber (10%).
Table-7 Transportation Volumes on National Roads Unit: 1,000 ton
National Route Length (km) Provinces VolumeRN-1 166.85 Prey Veaeng, Svay Rieng, Bavel 119.0RN-2 120.70 Kandal,Takaov 89.6RN-3 201.74 Kamport, 101.3RN-4 214.18 Sihanoukville, K.Spueu, Koh Kong 828.8RN-5 407.45 K.Chhnang, Pursat, Bat Dambang,
h i784.1
RN-6 416.40 K.Theum, Siem Reab, 123.6RN-7 460.83 K.Cham 117.3
P.P. – P.P. Phnom Penhhhh 24.7Total 1988.15 2188.4
Note: Bold characters are Study Areas.Source: Ministry of Public Works and Transport
(3) Number of Vehicles Registered
The number of vehicles registered with the Ministry of Public Works and Transport was 297,700 in1999. This number consisted of 223,200 passenger cars and 74,500 other vehicles such as buses,trucks and light vehicles for the transportation of passengers and goods. Phnom Penh has the mostnumber of vehicles registered, with 60,700 vehicles, which is 81.5% of the total. Kandal andKampong Cham are second and third respectively. Persons per vehicle is 154 persons for the wholecountry, 16 persons in Phnom Penh, 446 persons in Kandal and 1,438 persons in Prey Veng.
Many motorcycles equipped with carriers are not included. Motorcycle registration is conducted ineach Province and is rather slow.
Table-8 Number of Vehicles Registered Unit: Numbers
Type of Car -- 1993 1994 1995 1996 1997 1998 1999 Total
Passenger 120,152 12,818 19,080 18,422 10,794 21,756 20,147 223,169Others 24,964 6,818 7,652 8,986 10,086 5,951 10,043 74,498Total 145,116 19,634 26,732 27,408 20,880 27,707 30,190 297,667
Source: Report on Annual Transportation 1999, Ministry of Public Works and Transport

D - 7
Table-9 Number of Vehicles Registered for Transportation Unit: Numbers
Type of Car Unit --1994 1995 1996 1997 1998 1999
Trucks Sets 17,477 6,758 8,224 10,216 11,118 12,059Light Vehicles Sets 69,182 32,385 39,650 47,679 52,679 61,724
Source: Report on Annual Transportation 1999, Ministry of Public Works and Transport
Table-10 Total number of Vehicles Registered in each Province
Province Population Nos. of Vehicles Unit Popul./set
Kandal 1,075,125 2,411 Sets 446Prey Veng 946,042 658 Sets 1,438Kampong Cham 1,608914 2,366 Sets 680Svay Rieng 478,252 418 Sets 1,144Takaov 790,168 693 Sets 1,140Kampong Spueu 569,060 1,130 Sets 504Kampong Chhnang 417,693 329 Sets 1,270Bat Dambang 793,129 1,621 Sets 489Siem Reab 696,164 520 Sets 1,339Phnom Penh 999,894 60.694 Sets 16Other Province 3,063,305 3,658 Sets 837Total 11,437,658 74,498 Sets 154
Source: Report on Annual Transportation 1999, Ministry of Public Works and Transport
D.2.2 Railway Conditions
(1) Royal Railway
The Royal Railway of Cambodia belongs to the Ministry of Public Works and Transport.The railway in Cambodia with a total length of 648 km consists of the Northern line and the Southernline, both originating in Phnom Penh. The Northern line has a longer history and runs to the Thaiborder. The Southern line leads to Sihanoukville and the international seaport. Both of them aresingle-tracked-railroads and operated by diesel locomotives. Railroad structures such asembankments and bridges have been damaged by civil war. They are aged and in poor condition dueto lack of maintenance. At present, the state and quality of railway transportation is unsatisfactory dueto lack of train and track maintenance and limited speed. Restoration programs are planned and areseeking supporting budgets. If the current railroad could be connected to the Thai railway, thisrailroad would contribute to the economy of many Asian countries.

D - 8
Table-11 Name of Railway Line and Length
Line Established Origin to destination Length (km)
Northern Line 1929 Phnom Penh to Sisophon 385kmSouthern Line 1960 Phnom Penh to Sihanoukville 263km
Source: Royal Railway of Cambodia
Revenues and the number of employees of Royal Railway of Cambodia are as follows:a) Most of the revenue is earned through freight:
1997: Freight; 1,929,350,000 R Passenger; 1,017,384,000 R1998: Freight; 3,795,172,000 R Passenger; 801,775,000 R
b) Major goods: Construction materials, miscellaneous goods, fuel and ricec) Transportation fee: Passenger: 1 category; Freight: 3 categoriesd) Number of employees: 1,708 person in 1999; 14 percent of expenditure is onsumed.e) Present speed of trains: limited to 25 – 30 km/h.
(2) Transportation volume
From 1993 to 1999, the Northern line transported more goods and passengers than the Southern line,as shown in Table-11. Transportation volume of goods is gradually increasing from 1995, while thenumber of passengers is decreasing in the Southern line.
Table-12 Transport Totals Unit: 1,000 tons; 1,000 persons
Item 1993 1994 1995 1996 1997 1998 1999 Average
Northern Goods 114.2 48.2 33.3 50.2 102.2 208.0 189.3 106.5 Passenger 611.0 294.0 236.2 200.2 383.2 219.5 301.9 335.1 Luggage 12.0 7.6 7.2 12.5 10,996.8 6.6 3,472.7 2,73.6Southern Goods 15.6 12.6 16.5 25.8 67.1 86.4 80.3 43.5 Passenger 270.0 220.0 287.5 396.0 147.1 118.1 127.2 223.7 Luggage 1.8 4.6 5.9 5.4 4.3 1.8 0.7 3.5
Source: Royal Railway of Cambodia
D.2.3 Waterways and Ports
(1) Waterways and International Ports
The Mekong and Bassak rivers as well as the Tonle Sap Lake are located at the center of Cambodia,and theirs tributaries have been used for inland transportation for many years. Downstream of theMekong and Bassak Rivers is the border to Vietnam, where boats at large and small river ports/piers

D - 9
have transported many goods. Vietnamese boats are found at some ports/piers near the border.Vietnamese small boats with a capacity of 10 to 30 tons transport rice from small river ports toVietnam. Checkpoints for boat transportation are established same as for land transportation.
Both Phnom Penh and Sihanoukville ports, which are major international seaports, are active for theimport and export of goods. Renovation works of Phnom Penh port was conducted with the assistanceof the Japanese government, and Sihanoukville port renovations are underway.
Table-13 Outline of Major Seaports
Kind Name of port Location Sea/River Remarks
Inland/Interntl. Phnom Penh Phnom Penh Mekong RiverInternational Sihanoukville Sihanoukville Gulf of SiamInland/Interntl. Kaoh Kong Kao Kong Gulf of Siam
Ministry of publicWorks & Transport
Source: Ministry of Public Works and Transport
(2) Number of Inland Vessels Registered
The number of big vessels registered for inland transportation is as follows. Number of annualregistrations for other boats has been decreasing recently.
Table-14 Numbers of Inland Vessels RegisteredType of Car 1993 1994 1995 1996 1997 1998 1999-- Total
Passenger 30 39 66 16 28 12 26 217Others 124 79 96 76 79 51 43 548Total 154 118 162 92 107 63 69 765
Source: Ministry of Public Works and Transport
D.3 Problems of Transportation and Traffic
D.3.1 Road
Inland transportation of goods faces many limitations due to the poor condition of roads and bridges.The following are the main problems:
- Although main National roads are concrete paved, there are many portions heavily damaged andwith potholes. This slows the speed of vehicles and makes road transport ineffective during therains. It cuts down the number of vehicles using road transport,
- Road shoulders should be damaged easy during flood rain due to the canals/borrow pits collapseconstructed at both sides and they are dangerous for vehicles to move. Therefore, they cause:

D - 10
- More losses in quantity and quality of rice through damaged roads,- Higher traffic accidents, damages and maintenance costs,- Ignorance of traffic rules, signals, illegal turning and parking cause traffic jams and blockages,- Generally, cargo trucks are over loaded,- Non-licensed vehicles are using roads,- Therefore, they cause heavier road damage and result in higher transportation fees.
There are many illegal checkpoints at the gates of main cities, especially Phnom Penh, which causealso higher fees.
Rice transportation cost on the RN-5 in the Western area is estimated at 2,000 Riels/bag/30 km in thedry season and 3,000 Riels in the rainy season. This cost difference is equivalent to about 10 percentof the paddy-selling price by traders. The price of gasoline is 0.58 US$ per liter and diesel oil 0.38US$/liter in Phnom Penh.
Provincial roads are usually unpaved. Roads are damaged easily by the flood rains. Wheel tracesprevent vehicles from moving, when the vehicle has lower clearance to the ground. Provincial roaddensity is only 19.6 m/sq.km in average, and restricts resident to act effectively as well as to obtain thenecessary information.
Village / farm road are very poor in quantity and quality. Farm roads are not found in the paddy fields,even in irrigated areas. Paddy transportation is conducted manually or by bullock carts from field tofield. There are many restrictive factors, such as lack of labor, long distances for transporting, andinadequate access to paddy fields.Recently, there have been requests for the construction and rehabilitation of farm roads, due to theincrease of farm machines, such as small tractors and harvesters. Proper farm roads contribute tobetter transportation of paddy and assist farmers to increase rice production and better their standardof living.
D.3.2 Railway
Railway problems are longer transportation time and un-punctual time schedules. This is caused bypoor maintenance of old railway facilities, railway lines, bridges, wagons, locomotives, etc., whichlower train speeds. Trains are operated only twice a day for both lines and the number of wagons andcoaches are few. Moreover, as private companies own 70% of coaches, fees are higher.
D.3.3 Waterways and Ports
Regulations and monitoring for the waterways and ports used by many small vessels and ships overthe years, have not been conducted regularly. Illegal vessels and ships pass through keeping away

D - 11
from the checkpoints. Although the Cambodian government sets regulations for licensing andregistering, illegal vessels and ships belonging to domestic as well as foreign owners sail aroundconducting paddy trade at the border of Vietnam. Moreover, poor operating technology of vessels andships equipped with the marine engine is one of the overcoming problems.
D.4 Direction of Development of the Transportation Network
D.4.1 Road
Rehabilitation works are planned or being implemented with the assistance of ADB, World Bank andthe Japanese government. ADB will take charge of National Road RN-5, 6 and 7 which are calledAsian high way A-1, 11 and A-13 with high quality standard having a 12.5-meter road width.
Rehabilitation Programs are shown in Table-15 below:
Table-15 Rehabilitation ProgramsRoute From To Present Length Implementation Fund
P. Penh Mekong River 56km Planning ADBMekong River Ferry Planning SeekingRN-1Mekong River Vietnam Border Constructing 106km Started ADB
RN-2 Takaev Vietnam Border Constructing 53km Constructing LocalRN-3 Kampot RN-4 21.5km This year W. Bank
P. Penh Pousat 229km Planning ADBRN-5
Pousat Sisophon 105km This year ADBSkun Kapong Thom 48km This year ADBKapong Thom Province border 70km This year ADBProvince border Roluos This year W. BankRoluos Siam Reap 17.5km This year JapanSiam Reap Air port This year W. Bank
RN-6
Siam Reap Sisophn Planning SeekingMekong River Bridge Ferry Constructing JapanK. Cham RN-11 Planning JapanRN-11 Krache Planning ADB
RN-7
Krache Vien Kham Planning SeekingRN-11 RN-1 RN-7 70km Planning Seeking
Source: Planning and Statistics; Ministry of Public Works and Transport
D.4.2 Railway
As the Royal Railway of Cambodia acknowledges the present situations of railroads, there are plans

D - 12
of rehabilitation of the Southern line, Northern line, rolling stock, track maintenance & equipment,signaling & communication and building stations. Considering the effectiveness of railwaytransportation for large volume handling at low cost, railway transportation would be more importantin the future as economic activities become more aggressive. Programs and projects planned by theRoyal Railway of Cambodia are shown as below:
Table-16 Programs for Rehabilitation of Cambodian RailwayNo Description Contents Est. Cost
1 Southern Line Track rehabilitation,Bridges and culvert boxes US$ 16.4 million
2 Northern Line Track rehabilitation,Bridges and culvert boxes US$ 12.6 million
3 Rolling Stock Procurement of wagons and coaches US$ 20.2 million
4 Track maintenance and Equipment US$ 4.0 million
5 Signaling & Communication, others US$ 4.0 million
Total US$ 57.2 million
Source: Royal Railway of Cambodia
Table-17 Projects for Cambodian Railway
No Description Contents Est. Cost
1 Rehabilitation of Northern LineTo repair and restore the formation,To operate safely at more than35km/h
US$ 32.4 million
2 Restoration of Rail Link to ThailandTo reinstate the formation track,To operate between Thailand &Cambodia
US$ 12.4 million
3 Provision of Track Maintenance Equipment To ensure the formation, structure. US$ 4.9 million
4 Reinstatement of CFC De-MiningUnit To start de-mining operations Not estimated
5 Rolling Stock Provision &Maintenance I To restore the rolling stock fleet US$ 4.1 million
6 Rolling Stock Provision & Maintenance II To restore the rolling stock fleet Not estimated
7 Signaling Interlocking and Block Working
To enable the railway to increasespeeds US$ 15.0 million
Source: Royal Railway of Cambodia
D.4.3 Waterways and Ports
Rehabilitation of the Phnom Penh and Sihanoukville international seaports, where transportationvolumes would increase in the near future, are on going, funded by the Japanese Government. Otherrehabilitation plans for inland waterways are not planned. As the volume of vessels and ships in

D - 13
inland waterways are comparatively small, it is considered that the rehabilitation of waterways andports is not urgent. However, it is proposed the strengthening of controls and operation of existingports, the setting-up of inland waterway regulations, strengthening of vessel & ship registrations, andthe improvement of operations technology such as software strengthening scheme.

Appendix D : Transportation Infrastructure
Figures and Tables
Table D.1 Vehicles Registered Pertain Vehicles & Volume of Goods and Passengers TransportedTable D.2 Number of Vehicle Registered by Type, by YearTable D.3 Number of Vehicles by Province and CityTable D.4 Origin-Destination Matrix for Goods (all commodities) (1/2)Table D.5 Origin-Destination Matrix for Goods (all commodities) (2/2)Table D.6 Results of TRS Road Traffic ForecastsTable D.7 Traffic Forecasts per Road Section (1/4, 2/4, 3/4, 4/4)Table D.8 Transport Results in Railway (1/2)Table D.9 Transport Results in Railway (2/2)Table D.10 Railway ConditionsTable D.11 Number and Conditions of Locomotives & WagonsTable D.12 Railway FareTable D.13 Program & Project for Royal Railway of CambodiaTable D.14 Statistics of Ship Cargo (1/3, 2/3, 3/3)Table D.15 Circulation of Vessel RegistrationTable D.16 Statistics of Registered Vessels at Department of Inland Waterway Transport
Fig. D.1 Organization Chart of Ministry of Public Works and TransportFig. D.2 Road NetworkFig. D.3 Organization Chart of Royal Railway of CambodiaFig. D.4 Road Rehabilitation Program

Table D.1 Vehicles Registered - Pertain Vehicles & Volume of Goods and Passengers Transported
Year Total on the Vehicles registered Total on the Operating Vehicles authorized
Trucks Buses Light Passenger Vehicles P.Transported In Passenger km T. Transported In Tonne-km
Vehicles Buses Mini buses Trucks Pick-up (000) P (000) km (000) ton (000) ton-km
1990 1,537 104 4,076 104 85 427 0 611 78,699 377 40,3851991 2,599 104 4,076 104 104 473 6 422 45,879 81 6,2831992 3,607 146 14,632 133 43 469 22 290 27,855 32 4,0871993 4,354 248 20,362 102 15 208 15 153 15,973 38 3,9901994 5,347 394 26,036 80 137 1,435 613 599 62,981 1,246 133,0701995 6,578 469 32,385 111 385 2,582 1,487 1,052 105,133 2,115 214,6721996 8,224 544 39,650 123 253 2,656 1,610 1,194 123,885 2,563 269,1641997 10,216 609 47,679 66 354 3,183 2,164 1,534 162,374 2,823 293,4501998 11,116 660 52,679 73 243 2,198 1,502 1,254 141,144 2,685 284,1801999 12,059 716 61,724 86 343 2,715 2,171 1,719 201,227 3,214 308,158
Source: Ministry of Public Works and Transport, General Direction of TransportReport on Annual Transportation 1999 Proposal for 2,000 on Transportation Field
Volume of passengers Volume of goods
Good Vehicles
D - 14

Table D.2 Number of Vehicle Registered : by Type, by Year
No.No.No.No. Type of VehicleType of VehicleType of VehicleType of Vehicle UnitUnitUnitUnit 1990199019901990 1991199119911991 1992199219921992 1993199319931993 1994199419941994 1995199519951995 1996199619961996 1997199719971997 1998199819981998 1999199919991999 TotalTotalTotalTotal
1 Passenger Car unit 43,733 27,432 36,443 12,544 12,818 19,080 18,422 10,794 21,756 20,147 223,169223,169223,169223,169
2 Turist Bus unit 2,310 3,994 4,149 4,582 4,537 4,672 4,613 5,560 3,269 4,580 42,26642,26642,26642,2663 Taxi unit 85 19 42 102 182 468 422 513 349 1,008 3,1903,1903,1903,1904 Pickup Car unit 104 0 42 102 146 75 75 65 51 56 7167167167165 NGO Car unit 559 394 307 218 220 220 668 436 393 323 3,7383,7383,7383,7386 Government Car unit 2,100 495 242 220 216 223 807 642 244 262 5,4515,4515,4515,4517 Construction Car unit 0 0 3 14 16 27 37 199 21 36 353353353353
8 Light Truck unit 372 506 555 678 591 836 1,034 1,023 790 2,889 9,2749,2749,2749,2749 Heavy Truck unit 187 987 933 663 908 1,131 1,211 1,569 799 857 9,2459,2459,2459,245
10 Truck with Trailer unit 0 0 0 0 0 0 119 79 35 32 265265265265
TotalTotalTotalTotal 49,45049,45049,45049,450 33,82733,82733,82733,827 42,71642,71642,71642,716 19,12319,12319,12319,123 19,63419,63419,63419,634 26,73226,73226,73226,732 27,40827,40827,40827,408 20,88020,88020,88020,880 27,70727,70727,70727,707 30,19030,19030,19030,190 297,667297,667297,667297,667
Data source: Ministry of Public Works and TransportReport on Annaul Transportation 1999Proposal for 2,000 on Transportation Field
D - 15

Table D.3 Number of Vehicles by Province and City
No.No.No.No. Province/CityProvince/CityProvince/CityProvince/City PopulationPopulationPopulationPopulation UnitUnitUnitUnit 1990199019901990 1991199119911991 1992199219921992 1993199319931993 1994199419941994 1995199519951995 1996199619961996 1997199719971997 1998199819981998 1999199919991999 TotalTotalTotalTotal RemarksRemarksRemarksRemarks
Passenger/set
1 Kandal 1,075,125 unit - - - - 444 542 252 468 277 428 2,4112,4112,4112,411 4464464464462 Prey Veng 946,042 unit - - - - 73 156 47 95 117 170 658658658658 1,4381,4381,4381,4383 Kampong Cham 1,608,914 unit - - - - 361 585 297 369 324 430 2,3662,3662,3662,366 6806806806804 Svay Rieng 478,252 unit - - - - 86 142 58 37 52 43 418418418418 1,1441,1441,1441,1445 Takeo 790,168 unit - - - - 92 206 58 126 82 129 693693693693 1,1401,1401,1401,1406 Kampong Spue 569,060 unit - - - - 167 251 95 212 182 223 1,1301,1301,1301,130 5045045045047 Kampong Chhnang 417,693 unit - - - - 73 98 10 47 36 65 329329329329 1,2701,2701,2701,2708 Bat Dambang 793,129 unit - - - - 290 562 208 182 44 335 1,6211,6211,6211,621 4894894894899 Siem Reap 696,164 unit - - - - 36 169 73 128 7 107 520520520520 1,3391,3391,3391,339
Sub-total 7,374,547 unit - - - - 1,622 2,711 1,098 1,664 1,121 1,930 10,146 727727727727
10 Phnom Penh 999,804 unit 5,717 6,395 6,273 6,579 4,755 3,851 7,485 7,908 4,443 7,288 60,69460,69460,69460,694 16161616
11 Other Provices 3,063,305 unit - - - - 439 1,090 403 514 387 825 3,6583,6583,6583,658 837837837837
TotalTotalTotalTotal 11,437,65611,437,65611,437,65611,437,656 unitunitunitunit 5,7175,7175,7175,717 6,3956,3956,3956,395 6,2736,2736,2736,273 6,5796,5796,5796,579 6,8166,8166,8166,816 7,6527,6527,6527,652 8,9868,9868,9868,986 10,08610,08610,08610,086 5,9515,9515,9515,951 10,04310,04310,04310,043 74,49874,49874,49874,498 154154154154
Data source: (1) Pupulation: General Population Census of Cambodia, 1998(2) Nr of vehicle: Ministry of Public Works and Transport
Report on Annaul Transportation 1999Proposal for 2,000 on Transportation Field
D - 16

Table D.4 Origin-Destination Matrix for Goods (all commodities) (1/2) '000 tonnes per year to zone
Study Area
No. Name 1 2 3 4 5 6 7 8 9 10 11 12 13 14 15 16 22 23 TotalP.P Kandal K.Cham S.Rieng P.Veng Takeo K..Theu S.Reap B.Bang B.M.C Pursat K.ChhnaSiha.Vil Kampot K.Kong K.Spoe Balet Foipet from
1 Phom Penh 24.7 5.6 61.0 24.0 16.3 19.7 24.6 48.9 122.6 33.5 38.6 30.0 185.3 7.8 50.7 5.8 0.0 0.0 699.12 Kandal 0.0 0.0 1.4 0.0 0.0 0.3 1.1 1.0 1.6 0.0 0.0 3.7 0.0 0.0 0.0 0.0 0.0 0.0 9.13 K.Cham 45.6 0.0 0.0 0.0 0.0 0.0 0.0 0.0 1.1 9.1 0.0 0.0 0.5 0.0 0.0 0.0 0.0 0.0 56.34 Svey Rieng 39.2 0.0 0.0 0.0 0.0 0.0 0.0 0.0 0.0 0.0 0.0 0.0 0.0 0.0 0.0 0.0 0.0 0.0 39.25 Prey Veaeng 15.6 7.2 0.0 0.0 0.4 0.0 0.0 0.0 0.0 0.0 0.0 0.0 0.0 0.0 0.0 0.0 0.0 0.0 23.26 Takeo 18.5 4.4 0.0 0.0 0.0 27.3 0.0 0.0 0.0 0.0 0.0 0.0 0.0 3.6 0.0 1.4 0.0 0.0 55.27 K.Theum 27.7 0.0 0.0 0.0 0.0 0.0 0.0 0.0 0.0 0.0 0.0 0.0 0.0 0.0 0.0 0.0 0.0 0.0 27.78 Siem Reab 0.0 0.0 0.0 0.0 0.0 0.0 0.0 0.0 0.0 22.4 0.0 0.0 0.0 0.0 0.0 0.0 0.0 0.0 22.49 Bat Dambang 90.1 0.0 0.0 0.0 0.0 0.0 0.0 0.0 0.0 43.0 0.0 0.8 0.0 0.0 0.0 0.0 0.0 0.0 133.9
10 B.Mean Chey(1) 43.9 0.0 0.2 0.0 0.0 0.0 0.0 44.4 83.9 99.4 13.5 0.0 0.0 0.0 0.0 0.0 0.0 0.0 285.311 Poursat 72.8 0.0 0.0 0.0 0.0 0.0 0.0 0.0 0.0 0.0 0.0 3.0 0.0 0.0 0.0 0.0 0.0 0.0 75.812 K. Chhnang 17.0 0.0 0.9 0.8 2.9 0.0 0.0 0.0 0.0 8.1 1.8 11.5 0.0 0.0 0.0 0.0 0.0 0.0 43.013 Sihanoukville(2) 392.2 0.0 0.0 0.0 30.0 0.0 0.0 0.0 0.0 0.0 0.0 0.0 0.0 0.0 0.0 0.0 0.0 0.0 422.214 Kampot 22.9 0.0 0.0 0.0 0.0 1.4 0.0 0.0 0.0 0.0 0.0 0.0 0.0 0.0 0.0 0.0 0.0 0.0 24.315 Koh Kong(3) 59.7 0.0 0.0 0.0 9.5 0.0 0.0 0.0 0.0 0.0 0.0 0.0 0.0 0.0 0.0 0.0 0.0 0.0 69.216 K.Speeu 123.6 0.0 0.0 9.1 19.7 0.3 0.0 0.0 0.0 0.0 0.0 0.0 0.0 0.0 0.0 11.9 0.0 0.0 164.6
22 Bavet(4) 16.3 0.0 0.0 0.0 0.0 0.0 0.0 0.0 0.0 0.0 0.0 0.0 0.0 0.0 0.0 0.0 0.0 0.0 16.323 Poipet(5) 21.2 0.0 0.0 0.0 0.0 0.0 0.0 0.0 0.0 0.0 0.0 0.0 0.0 0.0 0.0 0.0 0.0 0.0 21.224 thailand 0.2 0.0 0.0 0.0 0.0 0.0 0.0 0.0 0.0 0.0 0.0 0.0 0.0 0.0 0.0 0.0 0.0 0.0 0.2
Total to: 1031.2 17.2 63.5 33.9 78.8 49.0 25.7 94.3 209.2 215.5 53.9 49.0 185.8 11.4 50.7 19.1 0.0 0.0 2188.2
Notes: Study Area(1) Including most of the Traffic to/from Poipet, through a cocingmistske. See also note 5 below.(2) Most of this traffic is probably to or from the port(3) Most of this trafic is probsbly to or from the port in Sre Ambel(4) Most or all of the goods to/from Bavet probaqbly has destination or origin in Vietnam(5) Most of the goods to/from Poipet and Banteay Mean Chey Province probably has deistination or origin in Thailand.(6) C.f.note(5) above. Most goods to/from Thailand is Transshipped in Poipet.
Data source: Cambodian Transport Rehabilitation StudyDrat Final Report Appendix Volume A: The Existing Situation 1994 November
D - 17
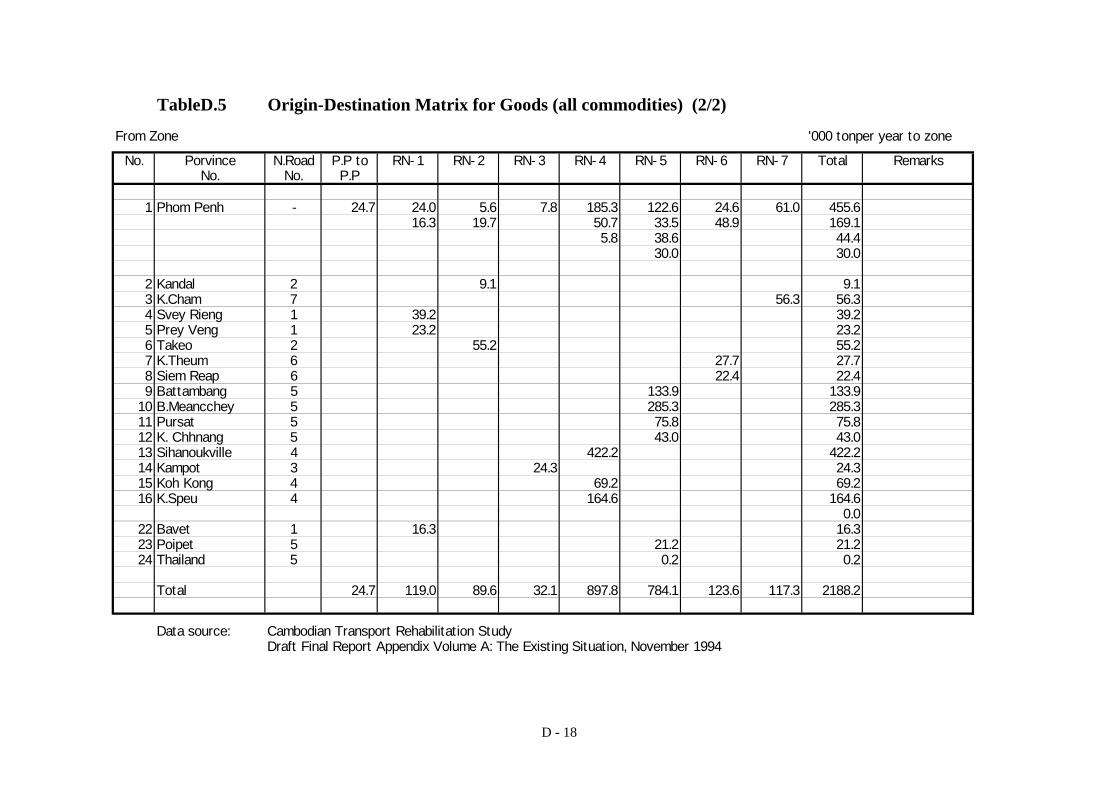
TableD.5 Origin-Destination Matrix for Goods (all commodities) (2/2)
From Zone '000 tonper year to zone
No. Porvince N.Road P.P to RN-1 RN-2 RN-3 RN-4 RN-5 RN-6 RN-7 Total RemarksNo. No. P.P
1 Phom Penh - 24.7 24.0 5.6 7.8 185.3 122.6 24.6 61.0 455.616.3 19.7 50.7 33.5 48.9 169.1
5.8 38.6 44.430.0 30.0
2 Kandal 2 9.1 9.13 K.Cham 7 56.3 56.34 Svey Rieng 1 39.2 39.25 Prey Veng 1 23.2 23.26 Takeo 2 55.2 55.27 K.Theum 6 27.7 27.78 Siem Reap 6 22.4 22.49 Battambang 5 133.9 133.9
10 B.Meancchey 5 285.3 285.311 Pursat 5 75.8 75.812 K. Chhnang 5 43.0 43.013 Sihanoukville 4 422.2 422.214 Kampot 3 24.3 24.315 Koh Kong 4 69.2 69.216 K.Speu 4 164.6 164.6
0.022 Bavet 1 16.3 16.323 Poipet 5 21.2 21.224 Thailand 5 0.2 0.2
Total 24.7 119.0 89.6 32.1 897.8 784.1 123.6 117.3 2188.2
Data source: Cambodian Transport Rehabilitation StudyDraft Final Report Appendix Volume A: The Existing Situation, November 1994
D - 18

Table D.6 Results of TRS Road Traffic Forecasts
Section No.Section No.Section No.Section No. Road No.Road No.Road No.Road No. FromFromFromFrom ToToToTo Km-KmKm-KmKm-KmKm-Km Length (km)Length (km)Length (km)Length (km)1.1 1 P. Penh N. Luang 5-61 561.2 1 N. Luang Vietnam boarder 61-167 10611.1 11 N. Luang Prey Veng 0-30 3011.2 11 Prey Veng Junction Rd. 7 30-90 602.1 2 Takhmau Takeo 10-74 642.2 2 Takeo Vietnam boarder 74-121 4722 22 Takeo Ang Tasaom 0-10 103.1 3 P.Penh Km12 Ang Tasaom 12-75 633.2 3 A. Tasaom Kampot 75-146 713.3 3 Kampot Junction Rd. 4 146-198 5248.1 48 Junction Rd. 4 Sre Ambel 0-18 1848.2 48 Sre Ambel Koh Kong 18-171 15348.3 48 Koh Kong Thai boarder 171-184 135.1 5 Outside P. Penh Odong 5-40 355.2 5 Oudong K. Chhnang 40-91 515.3 5 K. Chhnang Pursat 91-185 945.4 5 Pursat Battambang 185-291 1065.5 5 Battambang Sisophon 291-359 685.6 5 Sisophon Poipet 359-407 4851 51 Odong Junction Rd. 4 0-39 396.1 6 Junction Rd. 61 Skun 45-75 286.2 6 Skun K. Thom 75-166 916.3 6 K. Thom S. Reap 166-307 1416.4 6 S. Reap Sisophon 307-412 10564 64 K. Thom T. Meanchey 0-157 1577.1 7 Skun K. Cham 0-45 457.2 7 K. Cham P. Krek 45-98 537.3 7 P. Krek Kratie 98-259 1617.4 7 Kratie Lao boarder 259-461 20273.1 73 Junction rd 7 Chhlong 0-57 5773.2 73 Chhlong Kratie 57-90 3376 76 Junction Rd. 7 Senmonorom 0-130 130
78.1 78 Junction Rd. 7 Rattanakiri 0-142 14278.2 78 Junction7/78 Vietnam boarder 142-203 61
Note: At present, Senario B are applied for road plannin by MoPWT.
Source: Department of Planning, Ministry of Public Works and Transportation
D - 19

Table D.7 Traffic Forecasts per Road Section (1/4)
Scenario AScenario AScenario AScenario A (1) Existing Road Network(1) Existing Road Network(1) Existing Road Network(1) Existing Road NetworkSec.Sec.Sec.Sec.No.No.No.No. MCMCMCMC Veh.Veh.Veh.Veh. 1995199519951995 1997199719971997 2000200020002000 2005200520052005 2010201020102010 2015201520152015 1995199519951995 1997199719971997 2000200020002000 2005200520052005 2010201020102010 2015201520152015 1995199519951995 1997199719971997 2000200020002000 2005200520052005 2010201020102010 2015201520152015
1.1 1,820 1,420 1,947 2,261 2,928 4,302 6,321 8,866 3,141 3,684 4,523 7,182 10,601 14,939 303 363 459 731 1,084 1,5211.2 1,220 780 1,305 1,516 1,963 2,554 4,237 5,943 1,726 2,033 2,675 3,997 5,399 8,313 271 326 442 662 982 1,378
11.1 800 340 856 994 1,257 1,891 2,779 3,897 564 624 312 1,205 1,776 2,506 218 247 320 470 594 97311.2 1,250 290 1,336 1,553 2,011 2,955 4,342 6,089 468 497 647 959 1,416 1,995 199 235 303 446 653 9232.1 3,000 570 3,210 3,727 4,826 7,091 10,420 14,614 1,095 1,279 1,664 2,467 3,642 5,132 200 232 300 441 651 9132.2 1,600 65 1,605 1,901 2,511 3,763 5,529 7,754 91 106 138 205 303 427 34 40 51 75 111 15622 2,160 500 2,311 2,663 3,475 5,108 7,502 10,522 918 1,070 1,392 2,065 3,046 4,295 165 191 247 363 536 7523.1 3,370 1,270 3,605 4,135 5,422 7,966 11,705 15,417 2,376 2,771 3,605 5,346 7,892 11,121 341 401 519 762 1,125 1,5793.2 950 300 1,017 1,180 1,523 2,246 3,300 4,628 526 634 835 1,248 1,842 2,596 139 181 244 366 543 752
48.1 1,110 495 1,188 1,513 1,959 2,878 4,229 5,932 824 984 1,260 1,898 2,602 3,948 317 378 456 717 1,059 1,48548.2 100 15 107 155 201 295 434 609 18 27 35 51 76 107 10 12 15 22 33 4648.3 550 50 589 654 1,106 1,625 2,388 3,349 114 156 215 319 471 664 20 24 31 45 66 935.1 5,480 2,320 5,864 6,808 8,816 12,954 19,033 26,695 4,506 5,422 7,104 10,585 15,675 22,087 629 739 976 1,443 2,131 2,9335.2 1,420 1,150 1,519 1,764 2,284 3,357 4,932 6,917 1,995 2,377 3,143 4,711 7,004 9,870 535 631 835 1,277 1,885 2,6445.3 980 450 1,049 1,217 1,677 2,317 3,404 4,774 804 989 1,335 2,030 3,047 4,293 189 230 317 455 716 1,0055.4 3,000 860 3,210 3,727 4,826 7,091 10,420 14,614 1,528 1,832 2,334 3,659 5,451 7,651 341 405 544 820 1,210 1,6975.5 2,760 920 2,953 3,429 4,440 6,524 9,586 13,445 1,556 1,865 2,477 3,723 5,546 7,814 412 486 650 975 1,440 2,0195.6 4,050 685 4,334 5,031 6,516 9,573 14,067 19,759 1,304 1,021 2,209 3,326 4,960 6,939 235 286 397 803 891 1,24951 550 100 589 683 885 1,300 1,910 2,679 55 64 83 123 182 256 150 174 225 331 489 6856.1 2,120 470 2,268 3,773 4,886 7,180 10,549 14,796 647 812 1,057 1,557 2,313 3,259 349 434 561 825 1,218 1,7056.2 1,110 135 1,188 2,518 3,264 4,792 7,041 9,376 241 344 458 699 1,062 1,536 37 78 110 182 299 4596.3 710 25 760 2,022 2,616 3,847 5,552 9,727 39 108 150 243 356 537 19 57 84 144 242 3806.4 1,160 180 1,241 1,441 1,868 2,742 4,029 5,651 300 370 521 823 1,215 1,712 101 137 217 369 545 76564 110 0 118 342 442 650 955 1,340 0 0 0 0 0 0 0 0 0 0 0 07.1 1,800 430 1,928 3,071 3,977 5,843 8,585 12,041 596 750 976 1,447 2,136 3,010 386 500 646 949 1,401 1,9657.2 1,200 240 1,284 2,325 3,011 4,425 6,501 9,118 337 448 583 864 1,275 1,797 217 316 419 620 916 1,2847.3 800 70 856 1,828 2,368 3,479 5,112 7,170 73 156 203 302 445 527 67 147 190 280 413 5797.4 600 50 642 1,580 2,048 3,006 4,417 6,196 55 135 176 261 365 542 48 125 161 237 350 491
73.1 50 0 54 81 105 154 226 317 0 0 0 0 0 0 0 0 0 0 0 073.2 50 0 54 62 80 116 174 244 0 0 0 0 0 0 0 0 0 0 0 0
76 50 0 54 93 121 177 260 365 0 0 0 0 0 0 0 0 0 0 0 078.1 100 20 107 174 225 331 486 682 39 63 82 121 179 252 10 16 26 43 68 9578.2 100 65 107 143 204 299 439 616 75 96 125 186 274 386 67 117 151 246 374 524
Dta source: Department of Planning, Ministry of Public Works
Motor cylces per dayMotor cylces per dayMotor cylces per dayMotor cylces per day Passengers (excl. MC), '000/yearPassengers (excl. MC), '000/yearPassengers (excl. MC), '000/yearPassengers (excl. MC), '000/year Goods (excl. MC), '000tonnes/yearGoods (excl. MC), '000tonnes/yearGoods (excl. MC), '000tonnes/yearGoods (excl. MC), '000tonnes/yearADT-94ADT-94ADT-94ADT-94
D - 20

Table D.7 Traffic Forecasts per Road Section (2/4)
Scenario AScenario AScenario AScenario A (2) Fully Rehabilitated Road Network(2) Fully Rehabilitated Road Network(2) Fully Rehabilitated Road Network(2) Fully Rehabilitated Road NetworkSec.Sec.Sec.Sec.No.No.No.No. MCMCMCMC Veh.Veh.Veh.Veh. 1995199519951995 1997199719971997 2000200020002000 2005200520052005 2010201020102010 2015201520152015 1995199519951995 1997199719971997 2000200020002000 2005200520052005 2010201020102010 2015201520152015 1995199519951995 1997199719971997 2000200020002000 2005200520052005 2010201020102010 2015201520152015
1.1 1,820 1,420 1,947 2,713 3,514 5,163 7,536 10,639 3,141 4,960 6,453 9,570 14,127 19,906 303 514 664 976 1,440 2,0201.2 1,220 780 1,305 1,970 2,552 3,749 5,509 7,726 1,726 2,743 3,569 5,292 7,512 11,009 271 465 601 863 1,303 1,828
11.1 800 340 856 1,292 1,673 2,458 3,612 5,066 564 850 1,106 1,840 2,420 3,411 218 335 433 636 938 1,31611.2 1,250 290 1,336 2,019 2,614 3,841 5,644 7,916 468 813 1,057 1,568 2,315 3,262 199 338 436 641 947 1,3262.1 3,000 570 3,210 4,659 6,033 8,854 13,025 18,258 1,095 2,272 2,955 4,383 5,470 9,117 200 373 482 708 1,045 1,4652.2 1,600 65 1,605 2,661 3,446 5,063 7,440 10,434 91 248 322 476 705 994 34 103 133 196 290 40622 2,160 500 2,311 2,952 3,822 5,616 8,252 11,574 918 1,254 1,630 2,419 3,571 5,032 165 224 290 426 629 8823.1 3,370 1,270 3,605 3,768 4,879 7,169 10,534 14,775 2,376 3,246 4,223 6,263 9,245 13,028 341 536 695 1,022 1,506 2,1153.2 950 300 1,017 1,534 1,987 2,919 4,289 6,015 526 792 1,030 1,526 2,255 3,176 139 236 305 449 662 929
48.1 1,110 495 1,188 1,966 2,547 3,742 5,498 7,711 824 1,066 1,387 2,057 3,036 4,278 317 409 529 778 1,148 1,61048.2 100 15 107 455 589 856 1,272 1,784 18 102 132 196 289 407 10 41 53 78 115 16248.3 550 50 589 1,110 1,438 2,113 3,104 4,354 114 221 267 425 629 887 20 40 52 76 112 1575.1 5,480 2,320 5,864 7,146 9,257 13,601 19,985 28,030 4,506 6,363 8,278 12,276 18,122 25,536 629 565 1,144 1,631 2,481 3,4805.2 1,420 1,150 1,519 1,940 2,513 3,692 5,425 7,609 1,995 3,006 3,911 5,800 9,561 12,064 535 778 1,005 1,477 2,180 3,0585.3 980 450 1,049 1,522 1,971 2,896 4,255 5,967 804 1,259 1,638 2,429 3,588 5,053 189 307 397 584 882 1,2095.4 3,000 860 3,210 4,547 5,666 8,652 12,712 17,829 1,528 2,320 3,019 4,477 6,609 9,312 341 514 664 976 1,440 2,3235.5 2,760 920 2,953 4,183 5,417 7,959 11,695 16,403 1,556 2,362 3,073 4,556 6,728 9,450 412 610 788 1,159 1,710 2,3995.6 4,050 685 4,334 5,263 6,541 10,052 14,770 20,716 1,304 1,923 2,513 3,727 5,502 7,753 235 415 536 796 1,183 1,63251 550 100 589 1,296 1,631 2,470 3,630 5,091 55 2,359 3,719 5,515 8,141 11,472 150 654 846 1,242 1,834 2,5726.1 2,120 470 2,268 4,528 5,964 8,615 12,559 17,755 647 1,071 1,393 2,066 3,050 4,298 349 509 787 1,156 1,707 2,3946.2 1,110 135 1,188 4,030 5,216 7,665 11,286 15,801 241 1,309 1,703 2,526 3,729 5,254 37 262 339 498 735 1,0306.3 710 25 760 2,729 3,534 5,193 7,630 10,702 39 427 555 823 1,215 1,712 19 179 232 340 502 7056.4 1,160 180 1,241 1,945 2,519 3,702 5,439 7,629 300 931 1,211 1,796 2,651 3,736 101 340 439 645 952 1,33664 110 0 118 615 796 1,170 1,719 2,411 0 105 137 203 299 421 0 25 32 47 70 987.1 1,800 430 1,928 3,900 5,050 7,421 10,903 15,292 596 988 1,286 1,907 2,815 3,966 386 654 845 1,242 1,834 2,6727.2 1,200 240 1,284 3,000 3,885 5,706 8,367 11,763 337 828 1,077 1,597 2,358 3,322 217 403 521 765 1,130 1,5857.3 800 70 856 2,267 2,936 4,314 6,339 5,591 73 502 653 958 1,430 2,014 67 202 262 384 567 7967.4 600 50 642 1,912 2,476 3,638 5,345 7,497 55 397 517 766 1,131 1,593 48 190 245 361 532 747
73.1 50 0 54 153 199 292 429 602 0 95 124 183 270 381 0 77 100 146 216 30373.2 50 0 54 118 153 225 330 463 0 86 112 167 246 346 0 70 91 133 197 276
76 50 0 54 196 253 372 547 767 0 33 42 63 93 131 0 16 21 30 44 8278.1 100 20 107 296 383 563 827 1,159 39 92 120 178 263 370 10 26 33 49 72 10178.2 100 65 107 229 296 436 639 896 75 160 209 310 457 644 67 156 202 297 436 615
Data source: Department of Planning, Ministry of Public Works
ADT-94ADT-94ADT-94ADT-94 Motor cylces per dayMotor cylces per dayMotor cylces per dayMotor cylces per day Passengers (excl. MC), '000/yearPassengers (excl. MC), '000/yearPassengers (excl. MC), '000/yearPassengers (excl. MC), '000/year Goods (excl. MC), '000tonnes/yearGoods (excl. MC), '000tonnes/yearGoods (excl. MC), '000tonnes/yearGoods (excl. MC), '000tonnes/year
D - 21

Table D.7 Traffic Forecasts per Road Section (3/4)
Scenario BScenario BScenario BScenario B (1) Existing Road Network(1) Existing Road Network(1) Existing Road Network(1) Existing Road NetworkSec.Sec.Sec.Sec.No.No.No.No. MCMCMCMC Veh.Veh.Veh.Veh. 1995199519951995 1997199719971997 2000200020002000 2005200520052005 2010201020102010 2015201520152015 1995199519951995 1997199719971997 2000200020002000 2005200520052005 2010201020102010 2015201520152015 1995199519951995 1997199719971997 2000200020002000 2005200520052005 2010201020102010 2015201520152015
1.1 1,820 1,420 1,893 2,067 2,404 3,372 4,512 5,759 3,141 3,447 4,057 5,791 7,642 10,105 303 327 392 560 749 9331.2 1,220 780 1,269 1,388 1,512 2,260 3,025 3,860 1,726 1,894 2,233 3,197 4,328 5,577 271 293 353 506 677 843
11.1 800 340 832 909 1,057 1,482 1,983 2,531 564 587 690 981 1,325 1,708 218 233 269 374 493 61411.2 1,250 290 1,300 1,420 1,651 2,316 3,099 3,955 468 458 549 761 1,055 1,359 199 217 250 347 458 5712.1 3,000 570 3,120 3,407 3,963 5,558 7,438 9,493 1,098 1,203 1,413 2,009 2,714 3,497 200 217 250 347 458 5702.2 1,600 65 1,560 1,704 2,021 2,891 3,869 4,938 91 100 118 157 226 291 34 36 41 58 76 9522 2,160 500 2,245 2,453 2,853 4,002 5,355 6,835 918 1,007 1,182 1,682 2,272 2,927 165 176 206 286 377 4703.1 3,370 1,270 3,505 3,827 4,452 6,244 8,355 10,664 2,376 2,607 3,051 4,354 5,681 7,578 341 373 430 597 787 9813.2 950 300 988 1,079 1,256 1,760 2,355 3,006 526 578 635 989 1,336 1,721 139 150 183 259 342 426
48.1 1,110 495 1,154 1,261 1,570 2,202 2,947 3,762 824 904 1,084 1,542 2,083 2,684 317 363 407 565 746 93048.2 100 15 104 114 236 331 443 566 18 20 42 59 80 103 10 11 13 18 23 2948.3 550 50 572 625 727 1,019 1,364 1,740 114 125 176 250 337 434 20 22 25 35 47 585.1 5,480 2,320 5,699 6,224 7,239 10,153 13,587 17,341 4,606 5,058 6,960 8,507 11,522 14,345 629 691 311 1,141 1,516 1,9995.2 1,420 1,150 1,477 1,613 1,876 2,631 3,521 4,493 1,995 2,195 2,597 3,724 5,060 6,520 535 589 589 967 1,281 1,5965.3 980 450 1,019 1,113 1,295 1,916 2,430 3,101 804 887 1,052 1,506 2,045 2,634 189 215 256 368 490 6115.4 3,000 860 3,120 3,407 3,963 5,558 7,438 9,493 1,528 1,681 1,974 2,818 3,817 4,918 341 379 447 631 837 1,0435.5 2,760 920 2,870 3,134 3,646 5,113 6,843 8,734 1,556 1,713 2,021 2,895 3,920 5,051 412 456 535 753 1,004 1,2515.6 4,050 685 4,212 4,600 5,350 7,503 10,041 12,816 1,304 1,441 1,712 2,465 3,380 4,355 235 270 326 462 620 77351 550 100 572 625 727 1,019 1,364 1,740 55 60 71 100 136 175 150 151 174 242 319 3986.1 2,120 470 2,205 2,405 3,908 5,481 7,335 9,362 647 710 891 1,267 1,712 2,206 349 377 464 645 850 1,0606.2 1,110 135 1,154 1,261 2,574 3,610 4,831 6,166 241 285 369 534 732 983 37 40 35 157 237 2986.3 710 25 738 806 2,045 2,869 3,839 4,900 39 105 181 265 371 519 19 26 69 106 149 1866.4 1,160 180 1,206 1,317 1,532 2,149 2,876 3,871 300 329 417 512 627 1,066 101 129 189 313 413 51464 110 0 114 312 363 509 682 870 0 0 0 0 0 0 0 0 0 0 0 07.1 1,800 430 1,872 2,666 3,104 4,353 5,825 7,434 596 654 823 1,170 1,581 2,037 386 441 537 746 984 1,2277.2 1,200 240 1,248 1,675 22,500 3,170 4,242 5,414 337 370 489 695 939 1,210 217 238 343 482 536 7927.3 800 70 832 1,033 1,701 2,386 3,193 4,075 73 80 165 235 317 409 67 73 153 213 281 3507.4 600 50 624 581 1,417 1,987 2,659 3,393 55 60 142 202 272 351 45 52 129 179 236 295
73.1 50 0 52 74 86 120 161 206 0 0 0 0 0 0 0 0 0 0 0 073.2 50 0 52 57 66 93 124 156 0 0 0 0 0 0 0 0 0 0 0 0
76 50 0 52 57 99 139 186 237 0 0 0 0 0 0 0 0 0 0 0 078.1 100 20 104 125 153 214 286 385 39 42 60 85 114 147 10 11 14 24 37 4678.2 100 65 104 119 146 204 273 349 75 82 106 151 204 263 67 80 111 165 227 283
Data source: Department of Planning, Ministry of Public Works
ADT-94ADT-94ADT-94ADT-94 Motor cylces per dayMotor cylces per dayMotor cylces per dayMotor cylces per day Passengers (excl. MC), '000/yearPassengers (excl. MC), '000/yearPassengers (excl. MC), '000/yearPassengers (excl. MC), '000/year Goods (excl. MC), '000tonnes/yearGoods (excl. MC), '000tonnes/yearGoods (excl. MC), '000tonnes/yearGoods (excl. MC), '000tonnes/year
D - 22

Table D.7 Traffic Forecasts per Road Section (4/4)
Scenario BScenario BScenario BScenario B (2) Fully rehabilitated Road Network(2) Fully rehabilitated Road Network(2) Fully rehabilitated Road Network(2) Fully rehabilitated Road NetworkSec.Sec.Sec.Sec.No.No.No.No. MCMCMCMC Veh.Veh.Veh.Veh. 1995199519951995 1997199719971997 2000200020002000 2005200520052005 2010201020102010 2015201520152015 1995199519951995 1997199719971997 2000200020002000 2005200520052005 2010201020102010 2015201520152015 1995199519951995 1997199719971997 2000200020002000 2005200520052005 2010201020102010 2015201520152015
1.1 1,820 1,420 1,893 2,480 2,885 4,046 5,415 6,911 3,141 4,207 5,446 7,746 10,464 13,483 303 406 520 723 953 1,1881.2 1,220 780 1,269 1,801 2,095 2,936 3,932 5,019 1,726 2,320 3,008 4,278 5,780 7,447 271 364 467 649 857 1,087
11.1 800 340 832 1,181 1,374 1,327 2,579 3,291 564 723 939 1,335 1,804 2,324 218 285 364 506 567 83111.2 1,250 290 1,300 1,845 2,147 3,011 4,029 5,142 468 669 898 1,277 1,725 2,223 199 286 362 502 663 8262.1 3,000 570 3,120 4,259 4,954 6,948 9,298 11,886 1,096 1,988 2,509 3,569 4,821 6,212 200 321 402 558 736 9182.2 1,600 65 1,560 2,385 2,774 3,891 5,207 6,645 91 173 251 358 483 623 34 52 89 124 163 20322 2,160 500 2,245 2,698 3,139 4,402 5,891 7,516 915 1,117 1,385 1,970 2,661 3,429 165 194 242 336 443 5523.1 3,370 1,270 3,505 3,445 4,005 5,619 7,520 9,697 2,376 2,892 3,586 5,100 8,890 8,877 341 455 575 804 1,061 1,3223.2 950 300 988 1,403 1,631 2,288 3,062 3,906 526 672 653 1,213 1,638 2,111 139 183 233 324 428 533
48.1 1,110 495 1,154 1,639 1,906 2,673 3,578 4,566 824 953 1,152 1,639 2,214 2,853 317 372 442 614 810 1,00948.2 100 15 104 455 529 742 993 1,265 18 60 94 134 181 233 10 29 39 54 72 8948.3 550 50 572 912 944 1,325 1,773 2,262 114 155 202 287 388 500 20 29 39 54 71 895.1 5,480 2,320 5,699 6,535 7,601 10,660 14,266 18,206 4,606 5,623 6,979 9,927 13,410 17,279 629 772 944 1,312 1,730 2,1565.2 1,420 1,150 1,477 1,774 2,083 2,894 3,873 4,943 1,995 2,566 3,260 4,637 6,264 8,071 536 659 907 1,121 1,479 1,9435.3 980 450 1,019 1,391 1,618 2,270 3,037 3,876 804 1,044 1,330 1,892 2,558 3,294 189 244 300 417 550 6855.4 3,000 860 3,120 4,157 4,835 6,761 9,074 11,581 1,528 1,965 2,503 3,580 4,809 5,196 341 426 522 726 957 1,1935.5 2,760 920 2,870 3,824 4,448 6,236 8,348 10,655 1,558 2,005 2,549 3,625 4,897 6,310 412 511 626 870 1,147 1,4305.6 4,050 685 4,212 4,829 5,617 7,879 10,543 13,458 1,304 1,515 2,013 2,863 3,668 4,984 235 328 417 579 754 95251 550 100 572 1,187 1,380 1,936 2,591 3,307 55 2,628 3,111 4,425 5,977 7,702 150 557 651 947 1,249 1,5576.1 2,120 470 2,205 2,889 3,361 4,713 6,307 8,050 647 865 1,119 1,592 2,150 2,770 349 482 625 889 1,146 1,4286.2 1,110 135 1,154 2,017 2,346 3,290 4,403 5,620 241 544 1,377 1,958 2,845 3,409 37 150 247 343 453 5646.3 710 25 738 1,089 1,266 1,776 2,376 3,033 39 300 476 677 914 1,178 19 95 160 222 292 3646.4 1,160 180 1,206 1,778 2,069 2,901 3,883 4,955 300 698 1,000 1,422 1,921 2,475 101 258 370 514 678 64564 110 0 114 562 654 917 1,227 1,566 0 57 105 149 202 280 0 15 27 38 50 627.1 1,800 430 1,872 3,389 3,941 5,528 7,396 9,442 596 797 1,031 1,457 1,981 2,553 386 534 677 940 1,241 1,5467.2 1,200 240 1,248 2,161 2,513 3,525 4,717 6,020 337 562 789 1,120 1,513 1,950 217 320 404 561 740 9237.3 800 70 832 1,281 1,490 2,090 2,797 3,570 73 260 457 650 878 1,131 67 106 142 198 261 3257.4 600 50 624 825 959 1,345 1,900 2,297 55 196 311 442 598 770 49 98 125 174 229 286
73.1 50 0 52 140 163 229 306 391 0 77 90 128 173 223 0 77 89 123 163 20373.2 50 0 52 108 125 176 236 301 0 70 87 123 166 214 0 63 125 173 228 285
76 50 0 52 119 139 195 260 332 0 15 26 37 50 65 0 8 57 79 104 13078.1 100 20 104 212 247 346 464 592 39 60 80 114 154 198 10 16 54 75 96 12378.2 100 65 104 191 222 311 417 532 75 126 166 236 318 410 67 103 150 209 275 343
Data source: Department of Planning, Ministry of Public Works
ADT-94ADT-94ADT-94ADT-94 Motor cylces per dayMotor cylces per dayMotor cylces per dayMotor cylces per day Passengers (excl. MC), '000/yearPassengers (excl. MC), '000/yearPassengers (excl. MC), '000/yearPassengers (excl. MC), '000/year Goods (excl. MC), '000tonnes/yearGoods (excl. MC), '000tonnes/yearGoods (excl. MC), '000tonnes/yearGoods (excl. MC), '000tonnes/year
D - 23

Table D.8 Transport Results in Railway (1/2)
Transport Unit / Year 1,961 1,962 1,963 1,968 1,969 Average 1,993 1,994 1,995 1,996 1,997 1,998 1,999 Average
Northern LineGoods ton 114,200 48,200 33,290 50,180 102,234 208,010 189,268 106,483
1000ton-km 30,100 11,400 5,307 6,303 24,620 65,109 60,284 29,018
Passenger Persons 611,000 294,000 236,200 200,000 383,175 319,539 301,940 335,1221000 P-km 58,000 18,300 17,399 14,500 34,684 33,212 38,215 30,616
Luggage's ton 12,000 7,600 7,200 12,500 10,996,780 6,540 3,472,730 2,073,6211000ton-km 1,700 810 693 1,365 1,225 765 510,427 73,855
Southern LineGoods ton 15,600 12,600 16,500 25,807 67,149 86,441 80,272 43,481
1000ton-km 3,900.0 2,700.0 2,490.0 3,396.5 11,474.1 10,675.8 17,101.1 7,391
Passenger Persons 270,000 220,000 287,500 396,000 147,084 118,065 127,171 223,6891000 P-km 22,300 20,300 21,045 26,753 18,452 10,645 11,994 18,784
Luggage's ton 1,800 4,600 5,900 5,400 4,265 1,836 669 3,4961000ton-km 170 550 589 590 599 203 62,675 9,339
TotalGoods ton 264,000 192,000 282,000 347,000 354,000 287,800 129,800 60,800 49,790 75,987 169,383 294,451 269,540
1000ton-km 61,368 46,020 69,300 81,544 74,172 66,481 34,000 14,100 7,797 9,700 36,095 75,785 77,386
Passenger Persons 1,308,000 1,260,000 1,314,000 2,394,700 2,376,430 1,730,626 881,000 514,000 523,700 596,000 530,259 437,604 429,1111000 P-km 77,518 72,516 78,108 167,345 180,531 115,204 80,300 38,600 38,444 41,253 53,136 43,857 50,209
Luggage's ton 5,040 5,400 5,400 11,546 15,660 8,609 13,800 12,200 13,100 17,900 11,001,045 8,376 3,473,3991000ton-km 264 252 258 991 1,425 638 1,870 1,360 1,282 1,955 1,825 968 573,103
Data source: Historical Background of the Royal Cambodian Railway, February, 2000
D - 24

Table D.9 Transport Results in Railway (2/2)
GOODS TRANPORT BY RAIL 1990-1999
North Line: Phnom Penh - Bat Dambang - SisophonNorth Line: Phnom Penh - Bat Dambang - SisophonNorth Line: Phnom Penh - Bat Dambang - SisophonNorth Line: Phnom Penh - Bat Dambang - SisophonCategories 1990 1991 1992 1993 1994 1995 1996 1997 1998 1999
1 Paddy and Rice 15,967 3,702 160 9,930 1,105 4,602 21,296 8,513 320 7,7802 Chemical fertilizer - 2,694 - - 25,389 7,599 2,789 3,5003 Const Mat, Machinery 450 2,784 - 49,108 3,250 1,838 6,408 3,089 2,120 4,8234 Agricultural product 35,935 14,300 78,770 44,387 - 19,800 838 - - -5 Cement - - - - - - 4,320 75,785 184,065 157,0806 Petroleum 6,198 4,000 2,400 1,531 6,000 2,285 5,038 10,050 18,785 12,9507 Containers - - - - - - - - - -8 Others and Service 6,350 10,530 9,470 9,217 12,456 5,765 1,681 2,108 2,720 3,135
Total 64,900 38,010 90,800 114,173 48,200 34,290 47,180 102,334 208,010 189,268
Southern Line: Phnom Penh - SihanoukvilleSouthern Line: Phnom Penh - SihanoukvilleSouthern Line: Phnom Penh - SihanoukvilleSouthern Line: Phnom Penh - SihanoukvilleCategories 1990 1991 1992 1993 1994 1995 1996 1997 1998 1999
1 Paddy and Rice 4,895 5,300 235 520 1,500 1,040 7,040 3052 Chemical fertilizer 16,226 205 600 1,4753 Const Mat, Machinery 20,991 1,955 945 12,831 1,040 8,084 2,710 4,6124 Agricultural product 9,997 15,806 3,008 9,0405 Cement 4,458 42,865 40,746 52,3606 Petroleum 6,198 4,103 2,438 1,800 6,981 1,365 5,600 10,280 20,080 14,0007 Containers 976 1,899 579 9,0708 Others and Service 2,690 4,898 3,400 440 4,579 1,145 600 6,400 8,030 8,995
Total 51,000 26,253 22,589 15,511 12,600 15,098 25,807 61,764 86,441 80,272
Both LineBoth LineBoth LineBoth LineYear 1990 1991 1992 1993 1994 1995 1996 1997 1998 1999
Grand Total 115,900 64,263 113,389 129,684 60,800 49,388 72,987 164,098 294,451 269,540
Data source: Historical Background of the Royal Cambodian Railway, February 2000International Relation Office
D - 25

Table D.10 Railway Conditions
Northern Line (Old line)Northern Line (Old line)Northern Line (Old line)Northern Line (Old line) Southern Line (New line)Southern Line (New line)Southern Line (New line)Southern Line (New line)Constructed 1929-1942 1960-1969From Phnom Penh Phnom PenhTo Poipet SihanoukvilleDistance 385km 236kmBorder gap to Thailand 15km, established in 1961From P.P. To Bangkok 655kmCapacity 30kg/m 43kg/mAccommodate axle lads 15 tonnes 20 tonnesBridges 167 94 steel 96 places; 2,272m 7 places; 461m concrete 82 places; 1,354m 87 places; 2,672m culvert boxes and pipes 242 474Minimum curvature radius 300m 650mruding gradient 5% 7%Max. spped 70km/h 90kmTrafic condition1st 1929-1931 1960-1966
Phnom Penh- Pursat, 166km Phnom Penh- Takeo, 75km2nd 1931-1932 1966-1967
Pursat-Battambang, 107.6km Takeo-Kompot, 92km3rd 1932-1933 1967-1969
Battambang-Sisophon, 57.1km Kompot-Sihanoukville4th 1933-1942
Sisophon-Poipet, 48kmStations Gars Stations HaltsOther Lines
Km6 Kompong Track; 131kmPhnom Basset ballast quarries; 26km Kompot cement plant; 14kmPhnom Thipadei; 245kmPhnom Thom; 320kmnear Mongko Borey; 331km
Problems very poor many spike fasteners are missing.necessary temporary repairs worse formation problems46 bridges are damaged, speed 5-10km/h embankment is very poor, speed 35-40km/hpassing roops are very short, not exceeding 250m earth absorbed moisture leads to problems.ruding grad many parts are restricted to 20km/h
Locomotive 14 diesel locomotieves, 8 steam engines (mid 1993), 7 shunting locomotivespoor conditions due to maintenance and mine damages.lack of fund to obtain spare partsno general overhalu from 1980 till 1994
Railcars and Passenger Coaches 2 railcars of Germany origin (since 1979)11 passenger trainers22 passenger coarchesall old and need to repair
Freight Wagon Box wagons 91, 10 ton capac.15 new steek box wagon from India in 1994Five-wheel wagons for salt transportGondola Wagons (26 gondola), capacity 20tLow sided wagonns for ballst transport
Source: Royal Railway of Cambodia Historical Background of the Royal Cambodian Railway Prepared by International Relation Office, February, 2000
141938
D - 26

Table D.11 Number and Conditions of Locomotives & Wagons
Unit: NumberDescription Model Conditions
In use Awaiting repair TotalLocomotives
1 Locomotives2 Diesel3 Locomotive BB1200 CV 11 3 144 Shunting Locomotive Bde 450 CV 6 1 75 Shunting Locomotive Bde 200 CV - - -6 Automotrice power 850 CV - 1 17 Draisine 80 CV 7 - 78 Wickam 40 CV - - -9 Matisa 114 CV - - -
10 Micado Steam Locomotive 1250 CV - - -11 Pacific Steam Locomotive 1150 CV - 4 4
sub-total 24 9 33
Wagons1 Cover wagons GGv.60T 65 9 74
GGv.40T 20 20GGv.30T 0GGv.25T 2 12 14GGv.20T 3 3 6GGv.12T 0GGv.10T 0
2 Lowside wagons HHv.60T 19 2 21HHv.40T 10 10HHv.25T 11 2 13HvFF.20T 2 6 8HC.10T 0
3 Flat wagons MMv.70T 1 1MMv.60T 24 2 26MMv.40T 2 2MMv.25T 5 5MMv.20T 9 9MC.10T 0
4 Hopper wagons Auto-unload NNvLL46T 11 11NNvLL25T 7 7NNvLL20T 2 2NC10T 0
5 Service wagons KVF 06 Tank wagons WWcvFF720 39 39
Wcv200-395HL 15 157 Cash wagons YvFF10T 08 Passenger coarches CvFF25T 8 1 99 Crane laoding wagons WS20T 1 17 18
10 Crane laoding wagons WGM70T 1 1sub-total 202 109 311
Total 226 118 344
Data source: Royal Railway of Cambodia Historical Background of the Royal Cambodian Railway Prepared by International Relations Office, February, 2000
D - 27

Table D.12 Railway Fare
1111 Base Fare by Sub DecreeBase Fare by Sub DecreeBase Fare by Sub DecreeBase Fare by Sub DecreeNorthern line Southern line
Year 2000 (March 21, 2000)1 Passenger Passenger PP - BTB: R15/km/p PP - Sihanoukville: R15/km/p
BTB - Sisophon: R20/km/p2 Commodity (R/ton)
Category I II III I II III0 - 100km 85 79 74 71 66 61101 - 200km 78 72 68 66 59 56over 200km 74 69 65 61 56 53
Year 19941 Passenger Passenger PP - BTB: PP - Sihanoukville:
BTB - Sisophon:2 Commodity (R/ton)
Category I II III I II III0 - 100km 67 62 58 67 62 58101 - 200km 62 56 53 62 56 53over 200km 58 69 50 58 53 50Category I: Fuel, petrol, beer, radio, TV, refrigirator, acid, medicine, egg, grall, plate, etc.Category II: Machinery, iron, steel, cement, rubber, sand, salt, fertilizer, etc.Category III. Rice, paddy, agricultural products, bagaged product, seedling, seed, etc.
Remarks: not mentioned comocidy shall be applied the Category II.
2222 Freight Time Schedule & DistanceFreight Time Schedule & DistanceFreight Time Schedule & DistanceFreight Time Schedule & DistanceNorthern line Southern line
P.P. Pursat BTB BTB Sisophon Poipet P.P. Takeo Kampot Sihanoukville1 Freight train 5:42 11:04 15:38 6:30 9:18 5:00 7:38 10:40 14:352 Mixed train 6:20 12:18 17:43 7:00 9:59 6:53 9:35 12:55 16:57
Distance(km+m 0 165+500 273+100 273+100 337+300 385 0 74+500 166+000 263+000
3333 Actual fare & base fareActual fare & base fareActual fare & base fareActual fare & base fareExample: Rice 1.0 ton transport; P.P. to BTB(1) Fee by sub decree(km) (R/km/ton) (2) Freight owner transport fee (R/ton) (3) Difference: (2) - (1) = 21,670
0-100km 100 74 7,400 1 P.P. to BTB 40,680101-200km 100 68 6,800 2 P.P. to Moung Rossei 30,510201-274 74 65 4,810total 274 19,010 * Remarks: 70-80% of wagons is owned by private companies.
Data source: Royal Railway of Cambodia
D - 28

Table D.13 Program & Project for Royal Railway of Cambodia
Program for Rehabilitation of Cambodian RailwayProgram for Rehabilitation of Cambodian RailwayProgram for Rehabilitation of Cambodian RailwayProgram for Rehabilitation of Cambodian RailwayNo.No.No.No. DescriptionDescriptionDescriptionDescription Est. costEst. costEst. costEst. cost
2000200020002000 2001200120012001 2002200220022002 2003200320032003 (m. US$)(m. US$)(m. US$)(m. US$)1 The Southern Line: Phnom Penh - Sihanoukville
A. Track1 Track rehabilitation (Rails + Switches) 2 1.000 - - 2.5002 Wooden sleeper and fastening supply 3 3.000 1.500 - 7.5003 Ballast supply 0 0.130 0.140 - 0.4004 Formation upgrading 1 1.400 1.400 0.700 4.9005 Drainage and channel ditch 0 0.050 0.050 0.050 0.2006 Welding equipment 0 0.015 0.015 0.015 0.060
B. Bridges and culvert boxes 1 0.360 - - 0.860sub-total 7 5.955 3.105 0.765 16.420
2 The Northern Line: Phnom Penh - BattanbangA. Track
1 Track rehabilitation (Rails + Switches) 2 2.000 1.000 - 5.0002 Ballast supply 0 0.140 0.140 0.140 0.5603 Formation upgrading 1 1.400 1.400 0.700 4.9004 Drainage and channel ditch 0 0.040 0.040 0.040 0.160
B. Bridges and culvert boxes 0 0.495 0.495 0.495 1.980sub-total 4 4.075 3.075 1.375 12.600
3 Rolling Stock1 Wagons of all types 0 0.140 - - 0.2802 to supply new wagons and coarches 6 3.430 2.450 - 12.2503 to supply four new locomotives 3 3.000 - - 6.0004 to buy force lift and flat truck 2 - - - 1.700
sub-total 11 6.570 2.450 0.000 20.2304 Track maintenance and Equipment 1 1.000 1.000 1.000 4.0005 Signaling & Communications, Building Station 1 1.000 1.000 1.000 4.000
Total 24 18.600 10.630 4.140 57.250
ProjectsProjectsProjectsProjectsNo.No.No.No. Est. costEst. costEst. costEst. cost
(m. US$)(m. US$)(m. US$)(m. US$)1 Rehabilitation of the Northern Railway Line -to repair and restore the formation 32.4
-to operate safaly at more than 35km/hTime span: after southern lineFinancing: no action yet
2 Restoration of Rail Link to Thailand -to reinstate the formation track 12.4-to operate between Thailand & CambodiaTime span: after southern lineFinancing: no action yet
3 Provision of Track Mainenance Equipment -to ensure the formation, structures 4.9Time span: if recurrent budgets exist.Financing: none as yet
4 Rainstatement of CFC De-Mining Unit -to start demeaning operations not estimatedTime span: First priorityFinanceing: none as yet
5 Rolling Stock Provision and Maintenance I -to restore the rolling stock fleet 4.1Time span: Urgent (detailed UNDP/OPS studies in Apr. '94)Financing: WB 1.85 m(half of 3.7mUS$) already budgeted ADB's SRAP loan if not for telecommunication
6 Rolling Stock Provision and Maintenance II -to provide rolling stock not estimatedTime span: under continous reviewFinancing: none as yet
7 Signaling Interlocking ad Block Working -to enable the railway to increase speeds 15Time span: depending on traffic (Southern line) depending on link with Thailand (Northern line)Financing: no action yet
Data source: Royal Railway of Cambodia
Main projectsMain projectsMain projectsMain projects
DescriptionDescriptionDescriptionDescription ObjectivesObjectivesObjectivesObjectives
D - 29

Table D.14 Statistics of Ship Cargo (1/3) Phnom Penh & Sihanoukville PortPhnom Penh & Sihanoukville PortPhnom Penh & Sihanoukville PortPhnom Penh & Sihanoukville PortUnit: ton
Port Items 1990 1991 1992 1993 1994 1995 1996 1997 1998 1999 Remarks
Phnom Penh Vessel International 501 533 1426 1019 1420 1323 1190 1074 964 780 Local 49 19 29 6 120 33 106 139 105 70Total 550 552 1455 1025 1540 1356 1296 1213 1069 850
Import Cargo 57,224 89,387 260,891 140,528 136,181 92,660 89,476 62,662 55,093 48,047import Container 1,560 2,810 816 68 163 129 7 - - 50Import Fuel 194,096 240,617 246,291 321,462 333,562 387,194 426,639 422,638 365,239 342,454
Sub Total 252,880 332,814 507,998 462,058 469,906 479,983 516,122 485,300 420,332 390,551Export Cargo 79,719 70,888 46,226 41,250 74,098 60,194 40,365 151,148 181,026 57,683Local 37,961 28,108 17,746 13,509 27,346 25,523 28,181 21,946 18,233 10,513
Total 370,560 431,810 571,970 516,817 571,350 565,700 584,668 658,394 619,591 458,747
Sihanoukville Vessel International 264 144 229 337 411 615 686 784 650 599
Import Cargo 182,303 44,582 171,071 209,530 271,983 273,204 272,443 235,587 203,496 273,403Import Container 0 0 30,459 89,546 126,659 208,833 273,623 270,960 318,239 329,220Import Fuel 17,766 1,095 5,112 23,119 41,096 72,242 90,516 146,254 223,774 221,618
Sub Total 200,069 45,677 206,642 322,195 439,738 554,278 636,582 652,802 745,509 824,240Export Cargo 83,659 86,874 77,138 116,040 95,236 133,633 68,053 54,821 40,037 18,794Export Container - - 212 36,151 12,338 19,804 36,368 86,663 99,405 88,607
Total 283,728 132,551 283,992 474,386 547,312 707,715 741,003 794,286 884,950 931,642
Data source: (1) Phnom Penh Port Yearly Operation Statement; Ministry of Public Works and Transportation(2) The Statistic of Cargo; Port Authority of Sihanoukville
D - 30

Table D.14 Statistics of Ship Cargo (2/3) Phnom Penh PortPhnom Penh PortPhnom Penh PortPhnom Penh PortUnit: ton
Port Items 1990 1991 1992 1993 1994 1995 1996 1997 1998 1999 RemarksPhnom Penh Import Cargo 57,224 89,387 260,891 140,528 136,181 92,660 89,476 62,662 55,093 48,047
White Rice 17,288 13,094 21,014 18,640 11,622 6,573 - - - -Other Food - - 2,027 9,010 18,944 13,679 8,600 - 21,332 21,156Machinery & Materials 7,782 3,251 96,800 8,814 6596 27,598 46,427 2,988 9,847 13,087Miscellaneous - - 2,452 8,803 13,217 1,149 4,177 1,750 1,180 2,791Fertilizer 62 335 8,033 10,954 - 245 - - - -General Cargo 32,092 72,707 130,565 84,307 85,802 43,416 30,272 57,924 22,734 11,013
Import Container 1,560 2,810 816 68 163 129 7 - - 50Import Fuel 194,096 240,617 246,291 321,462 333,562 387,194 426,639 422,638 365,239 342,454
Total 252,880 332,814 507,998 462,058 469,906 479,983 516,122 485,300 420,332 390,551
Export Cargo 79,719 70,888 46,226 41,250 74,098 60,194 40,365 151,148 181,026 57,683Paddy 1,057 - - - - - - - - -Other Food 25,136 27,974 9,744 8,992 11,300 2,705 2,769 - - 1,310Rubber 27,741 25,447 24,590 25,853 47,333 25,802 22,084 4,700 7,464 3,892Machinery & Materials 6,912 727 1,554 3,526 9,830 21,077 14,132 - 410 52,365Miscellaneous 7,302 747 3,125 2,067 2,542 140 500 146,420 173,152 116Fertilizer - - - 21 - - 880 - - -General Cargo 11,571 15,993 7,213 791 3,093 10,470 - 28 - -Fuel - - - - - - - - - -
Data source: Phnom Penh Port Yearly Operation Statement; Ministry of Public Work and Transportation
Remarks: item Import ExportOther Food Soya beam, Sugar, Wheat, Flour Corn, Cashew nut, Lotus nut, SesameMachinery & Materials Cement, Steel, Clue, Truck Lumber, Plywood, Rattan, Log, VeneerMiscellaneous Pottery, Tile, Sack, Beer, Paper, Soup, Cigarette Scrap metal, Cow hide, Kapok,Jute, Bran
D - 31
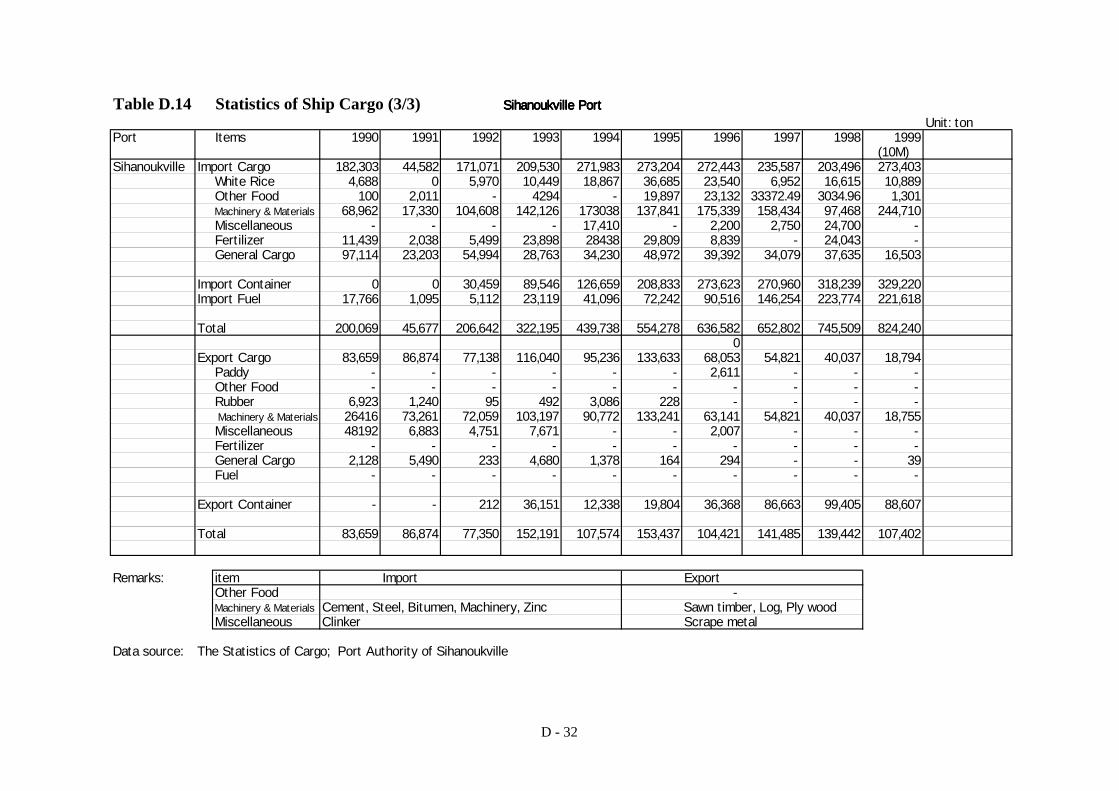
Table D.14 Statistics of Ship Cargo (3/3) Sihanoukville PortSihanoukville PortSihanoukville PortSihanoukville Port
Unit: tonPort Items 1990 1991 1992 1993 1994 1995 1996 1997 1998 1999
(10M)Sihanoukville Import Cargo 182,303 44,582 171,071 209,530 271,983 273,204 272,443 235,587 203,496 273,403
White Rice 4,688 0 5,970 10,449 18,867 36,685 23,540 6,952 16,615 10,889Other Food 100 2,011 - 4294 - 19,897 23,132 33372.49 3034.96 1,301Machinery & Materials 68,962 17,330 104,608 142,126 173038 137,841 175,339 158,434 97,468 244,710Miscellaneous - - - - 17,410 - 2,200 2,750 24,700 -Fertilizer 11,439 2,038 5,499 23,898 28438 29,809 8,839 - 24,043 -General Cargo 97,114 23,203 54,994 28,763 34,230 48,972 39,392 34,079 37,635 16,503
Import Container 0 0 30,459 89,546 126,659 208,833 273,623 270,960 318,239 329,220Import Fuel 17,766 1,095 5,112 23,119 41,096 72,242 90,516 146,254 223,774 221,618
Total 200,069 45,677 206,642 322,195 439,738 554,278 636,582 652,802 745,509 824,2400
Export Cargo 83,659 86,874 77,138 116,040 95,236 133,633 68,053 54,821 40,037 18,794Paddy - - - - - - 2,611 - - -Other Food - - - - - - - - - -Rubber 6,923 1,240 95 492 3,086 228 - - - - Machinery & Materials 26416 73,261 72,059 103,197 90,772 133,241 63,141 54,821 40,037 18,755Miscellaneous 48192 6,883 4,751 7,671 - - 2,007 - - -Fertilizer - - - - - - - - - -General Cargo 2,128 5,490 233 4,680 1,378 164 294 - - 39Fuel - - - - - - - - - -
Export Container - - 212 36,151 12,338 19,804 36,368 86,663 99,405 88,607
Total 83,659 86,874 77,350 152,191 107,574 153,437 104,421 141,485 139,442 107,402
Remarks: item Import ExportOther Food -Machinery & Materials Cement, Steel, Bitumen, Machinery, Zinc Sawn timber, Log, Ply woodMiscellaneous Clinker Scrape metal
Data source: The Statistics of Cargo; Port Authority of Sihanoukville
D - 32

Table D.15 Circulation of Vessel Registration
1111 Vessel RegistrationVessel RegistrationVessel RegistrationVessel Registration(Circulation, No.003 SRNNSK on 27th June, 2000)
1 Inland Water Way Transport Management
2 Boat's Card: over 500kg should be obtained the boat's card from Ministry of Public Works and Transport
3 Transport General Secretariat (Inlandwater Way Transport Department)1 All boat: over 40ton or over 90 HP of machine,2 All kinds of fuel loading boat,3 Passenger boats: over 50 seats,4 All kinds of tourist boats,5 Ferry boats,6 All kinds of boat by inlandwater way stransport from provincial to provincial,7 Trailer bosts over 90 HP of machine,8 All kinds of fishing boats,9 All kinds of foreign boats,
10 Power poats and non-power boats.
4 Provincial Department of Public Works and Transport1 All kinds of boats: less than 40 ton or 90 HP2 Passenger boats: less than 50 seats
5 Boat Serries No.1 Series No. 1: Dry boat2 Series No. 2: Passenger boat3 Series No. 3: Tanker4 Series No. 4: Tug boat5 Series No. 5: Barged pontoon, NOM MORTORISE6 Series No. 6: Ferry boat, dredger, crane boat,
staked boat, gravel and sand boat7 Series No. 7: Service boat8 Series No. 8: Fishing boat9 Series No. 9: Foreign boat
10 Series No. 10: Tourist boat and power boat11 Series No. 11: Emergency boat:
Source: Department of Inland Waterway Transportation, Ministry of Public Works and Transportation
D - 33

Table D.16 Statistics of Registered Vessels at Department of Inland Waterway Transport
No. Code Designation Type 1993 1994 1995 1996 1997 1998 1999 30 Jun, 2000 Total1 P.P1 Dry Cargo 2 18 33 26 26 4 7 5 1212 P.P2 Passenger and cargo 30 39 66 16 28 12 13 13 217
Express boat & Tourism boat 03 P.P3 Tanker na. 3 9 1 4 1 na. 1 194 P.P4 Tug boat 15 6 23 7 19 5 15 2 925 P.P5 Barged pontoon, 20 12 13 7 11 18 5 2 88
NOM MOTORISE 06 P.P6 Ferry boat 1 1 2 2 2 na. na. 87 P.P7 Service boat 3 2 5 na. 2 9 4 258 P.P8 Fishing boat na. na. na. na. na. na. 1 19 P.P9 Foreign boat 83 37 11 33 15 14 1 194
Total 154 118 162 92 107 63 46 23 765
Note: 1. Foreign boat (P.P9) is a small fishing boat in the river.2. Express boat (P.P5) is a passenger boat from Malaise 18 form V.N 2.3. Destination express boat: P.PS.Reap 12 P.P K.T = 84. Tourism: a small boat river Phnom Penh City = 2
Data source: Department of Inland Waterway Transportation, Ministry of Public Works and Transport
D - 34

Senior MinisterSecretary of State
Under Secretary of State
Advisors
Peblic WorksDivision
General DirectorateAdministrative Services
General Directorateof Transport
General Directorateof Construction
GeneralInspection
22 PublicEnterprises
Finance AuditControl
Multiple & ProvincialPublic Works Dep.
Department ofAdministration
Department of LandTransport
Deprtment ofRoads
Dept. of Personnel &Human Resources
Department of WaterTransport
Heavy EquipmentCenter
Dept. of Accounting& Finance
Department ofMerchant Marine
Public WorksResearch Center
Department ofPlanning
Department of BuildingConstruction
Dept. of Inland &Water Ways
Dept. of AirportConstruction
Fig. D.1 Organization Chart of Ministry of Public Works and Transport
1. Royal Railway of Cambodia2. Sihanoukville Port3. Phnom Penh Port4. Dept. of Cambodian Shipping Agency & Brokers5. Company of Land Transport6. Company of Passenger7. Department of Materials8. Enterprise of Construction of Phnom Penh9. Enterprise of Construction of Equipment10. Enterprise of Building Design11. Enterprise of Construction of Kampong Cham12. Enterprise of Materials Transport13. Enterprise of Laterite & Send Construction14. Bridge Construction Company15. Factory of Colored Brick16. Drving School17. Factory of Saawmill18. Factory of Brick19. Factory of Cement-fibro20. Factory of Vehicle Repair 7 January21. Cambodian River Transport22. Laboratory of Public Works and Building
D - 35


Ministry of PublicWorks & Transport
DirectorCFRC
General Inspection
Deputy DirectorAdmin & Finance
Deputy Directorof Exploitation
AdministrationOffice
Traffic CommercialSub-division
Network for theSouthern
Network for theNorthwest
ProductionWorkshop
PrincipleWorkshop
Phnom PenhRegion
PersonnelOffice
TrafficMovement
TakeoDistrict
Phnom PenhDistrict
Worksho ElectroMechanical
Diesel LocomotiveMovement
PursatRegion
Planning andStatistics Office
SectionTelecommunication
KampotDistrict
PursatDistrict
Workshop forLocomotive Repairs
Diesel LocomotiveMaintenance
BattanbangRegion
Accounting andFinance Office
SihanoukvilleDistrict
BattambangDistrict
Steam LocomotiveMaintenance
KampotRegion
WarehouseOffice
Mongkol BoreiDistrict
WorkshopAnnex
SihanoukvilleRegion
InternationalRelation Office
Infirmary
Mechanical Engine District
Fig. D.3 Organizarion Chart of Royal Railway of Cambodia
Deputy Director ofRolling Stock
Deputy Director ofPermanent Way
Artisan and New Practices
Wagon Workshop
Wood Workshop
Methal Workshop
Network T.N.O.A.
Bridge District
Building District
D - 37
