appendix-b1 -rsl strand literature review report
TRANSCRIPT

7/29/2019 Appendix-B1 -RSL Strand Literature Review Report
http://slidepdf.com/reader/full/appendix-b1-rsl-strand-literature-review-report 1/45
Appendix – B1: A summary of the State-of-the-art Residual Service Life methods
Appendix – B1: A summary of State-of-the-art Residual Service
Life methods / models
Report 2003-026-C-03
The research described in this report was carried out by
Project Leader A/Prof. Jay Yang (QUT)
Team members Prof. Arun Kumar (QUT)
A/Prof. Sujeeva Setunge and Srikanth Venkatesan (RMIT)
A/Prof. Graham Miller and Dr. Mary Hardie, Dr. Shahed Khan (UWS)
Mr. Selwyn Clark (QDPW)
Mr. Bruce Carlyle (John Holland)
Mr. Stuart Grierson (QDPW)
Research Program C:
Delivery and Management o f Buil t Assets
Project 2003-026-C
Decision Support Tools for Concrete Infrastructure rehabilitation
1
7/29/2019 Appendix-B1 -RSL Strand Literature Review Report
http://slidepdf.com/reader/full/appendix-b1-rsl-strand-literature-review-report 2/45
Appendix – B1: A summary of the State-of-the-art Residual Service Life methods
Content Summary
LIST OF TABLES ........................................................................................... 4
LIST OF FIGURES..........................................................................................5
EXECUTIVE SUMMARY................................................................................. 6
1 OVERVIEW.............................................................................................. 7
1.1 Introduction ................................................................................................... 7
1.2 Background ................................................................................................... 8
2 PREDICTION OF RESIDUAL SERVICE LIFE....................................... 10
2.1 Existing Models ........................................................................................... 10
2.2 EPIQR method (Energy Performance and Indoor environmental QualityRetrofit) ..................................................................................................................... 11
2.2.1 Modell ing building deterioration ....................................................................12
2.2.2 Modell ing Energy consumpt ions....................................................................16
2.2.3 Modell ing Indoor Environmental Quality .......................................................17
2.3 MEDIC method (Method d Evaluation de sc’nearious de Degradationprobables d’Invessissements Correspondants) ........................................................ 18
2.4 Determinist ic Method of diagnosing building degradation and modelling refurb costs ............................................................................................................. 21
2.4.1 Classif ication of works: ...................................................................................22
2.4.2 Type of data: .....................................................................................................23
2.4.3 Source of data: .................................................................................................23
2.4.4 Form of data:.....................................................................................................23
2.5 Elaboration of retrofit scenarios ................................................................ 24 2.5.1 The first intui tive scenario ...............................................................................24
2.5.2 Refining the scenario .......................................................................................25
2.5.3 Checking linked actions ..................................................................................25
2.5.4 Synthetic graphs ..............................................................................................25
2.5.5 A construct iv ist and interactive approach ....................................................27
2.5.6 Multicriteria approach to office building retrofit strategies.........................27 2.5.6.1 Mult icri teria assessment methodology .....................................................27 2.5.6.2 Case study results .......................................................................................28
2.5.7 Additional multi cr iterion studies ...................................................................28 2.6 Normal Distribution Model or ISO factorial model ................................... 28
2

7/29/2019 Appendix-B1 -RSL Strand Literature Review Report
http://slidepdf.com/reader/full/appendix-b1-rsl-strand-literature-review-report 3/45
Appendix – B1: A summary of the State-of-the-art Residual Service Life methods
2.6.1 Methodology .....................................................................................................28
2.6.2 The ISO factorial model ...................................................................................29 2.6.2.1 Evaluat ion of the ISO model .......................................................................30 2.6.2.2 Further development of factor methods....................................................32
2.6.3 The Markov model ............................................................................................33
2.6.4 Other residual service li fe models..................................................................33
3 EVALUATION OF THE FUNCTIONAL OBSOLESCENCE OF BUILDINGS................................................................................................... 35
3.1 Obsolescence Criteria ................................................................................ 35
3.1.1 User needs ........................................................................................................36
3.1.2 Flexibil ity ...........................................................................................................36
3.1.3 Divisibility..........................................................................................................36
3.1.4 Maintainabil ity ..................................................................................................36 3.1.5 Compliance wi th regulations ..........................................................................36
3.2 Breakdown of Building ............................................................................... 37
3.3 Appl ication of Cri ter ia ................................................................................. 38
3.4 Diagnosis codes and descr ipt ions ............................................................ 39
3.5 Upgrading Works......................................................................................... 40
3.6 Review of the model.................................................................................... 41
4 INFLUENCE OF RESIDUAL SERVICE LIFE MODELS ON LIFE CYCLE COSTS OF A BUILDING .............................................................................. 41
5 REVIEW AND CLOSING REMARKS .................................................... 43
6 REFERENCES....................................................................................... 44
3

7/29/2019 Appendix-B1 -RSL Strand Literature Review Report
http://slidepdf.com/reader/full/appendix-b1-rsl-strand-literature-review-report 4/45
Appendix – B1: A summary of the State-of-the-art Residual Service Life methods
List of Tables
Table 2-1: Building Elements and corresponding Types (European Residential Building AuditsDatabase, ERBAD.) …………………………………………………………………………………………..16
Table 2-2: Extract from the list of typical building refurbishment work……………………………………22
Table 3-1: Representative section of the building objects and obsolescence criteria matrix …………39
4

7/29/2019 Appendix-B1 -RSL Strand Literature Review Report
http://slidepdf.com/reader/full/appendix-b1-rsl-strand-literature-review-report 5/45
Appendix – B1: A summary of the State-of-the-art Residual Service Life methods
List of Figures
Figure 2-1: Relationship between different types of service life predictionmethods………………………………………………………………………...………….. 10
Figure 2-2: Macro Elements of a building ….……………………………………………12
Figure 2-3: Example of a user interface for `Heating Energy’ balance …..…………..17
Figure 2-4: Probability curves for deterioration codes of the elements……………….19
Figure 2-5: Cumulative probabilities of deterioration codes………..………………….20
Figure 2-6: Visualization for an element found in subspace of [0, B] ………………...20
Figure 2-7:Typical Degradation chart and cost charts based on retrofit scenarios.............…………………………………………………………………………..26
Figure 2-8.Methodology for service life prediction of building components (From ISO15686 Part 2 {ISO 2001) …………………….……………………………………………29
Figure 2-9.Relationships to take into consideration in evaluation of the factor method
….…………………………………………………………………………………………….31
Figure 2-10.Serice Life Model for elements lacking historic data……….…………….33
Figure 2-11.Typical deterioration trend of building element……………………………34
Figure 3-1: Functional obsolescence criteria……………………………………………37
Figure 3-2:Typical Screen dump of software TOBUS to describe the functional obsolescence evaluation process…………………………………….…………………..40
Figure 4-1: Example of a cost breakdown tree………………………………………….42
Figure 4-2: Probable development of the refurbishment costs for an 18-year-old cladding in code a’ according to MEDIC method ………………...……………………42
5

7/29/2019 Appendix-B1 -RSL Strand Literature Review Report
http://slidepdf.com/reader/full/appendix-b1-rsl-strand-literature-review-report 6/45
Appendix – B1: A summary of the State-of-the-art Residual Service Life methods
EXECUTIVE SUMMARY
Successful management of the infrastructure facilities is an important issue even inwell developed nations. Billions of dollars are spent in the annual maintenance of these assets. Maintenance costs of these assets over the whole life cycle usuallyrequire an evaluation of the remaining useful service life.
This report summarises the state-of-the-art in the prediction of residual life of thebuilding and its components. Methods (or models) for estimating residual service lifeare described in detail. Significance of residual service life models on life cyclecosting has been described.
The review shows that the methods are mostly conceptual and their application toreal world problems is dependent on a number of issues. Significant forms of data
and an understanding of the method to be applied is required during the decisionmaking process. In this vein, this report investigates the suitability of these methodsto aging public asset buildings in Australia.
6

7/29/2019 Appendix-B1 -RSL Strand Literature Review Report
http://slidepdf.com/reader/full/appendix-b1-rsl-strand-literature-review-report 7/45
Appendix – B1: A summary of the State-of-the-art Residual Service Life methods
1 OVERVIEW
1.1 Introduction
The term infrastructure encompasses the well known facilities like transport systems,bridges, water supply and any other facility that is required for the general successfulfunctioning of the economies. The infrastructure of a nation thus supports the fabricof modern living, which is taken for granted until something fails or no longer providesthe expected service, (IIMM, 2002). Any failure of the infrastructure facilities causesconsiderable difficulties to the governments, agencies as well as the population. Inthis report, issues related to the infrastructure buildings have been addressed.
Most of the building assets in Australia have been built progressively over the past100 odd years. Buildings deteriorate with age and more importantly may not servethe purpose of original intent. It is thus apparent that buildings might need
refurbishment or renovation at some point in time. This is very similar to the recenttrends experienced in the European countries. For instance, most of 1.8 million flatsin some parts of European Union built some 30 odd years, were in need of greatrefurbishment since they were built using methods that do not meet today’srequirements in terms of the energy consumptions, indoor air quality andenvironmental standards. (Investimmo, 2001). There are higher expectations onliving standards as a result of recent technological advancements. Therefore, thechallenge is to properly retrofit buildings in a manner that will result in minimumenergy requirements; reduce pollution and waste generation; improve indoor airquality, lighting and standards of living – all at an affordable cost, over the entire lifeof the building. Therefore, new design guidelines, standards and managementpractices need to be developed for sustainable planning, design, operation,maintenance, refurbishment, rehabilitation, modernisation, reuse and recycling of thebuildings in an optimised way addressing the issues of all relevant parties to result ina cost effective and manageable solution.
Asset management is a process of delivering the required level of service in a mostcost effective way through the creation, acquisition, maintenance, operation,rehabilitation and disposal of assets to assist present and future customers. The keyelements of infrastructure asset management are:
• Life cycle approach• Developing cost-effective management strategies for the long term• Providing a defined level of service and monitoring performance
• Managing risks associated with asset failures• Sustainable use of physical resources• Continuos improvement in asset management practices
A formal approach to the management of infrastructure assets is essential in order toprovide services in a most cost-effective manner and to demonstrate this to thecustomers, investors and other stakeholders. (IIMM, 2002).
In the context of retrofitting projects of buildings adopting a life-cycle approach,architects and engineers need to consider different possible retrofit scenarios. Theresidual life prediction of a building is an essential component of these refurbishmentstrategies. This requires an understanding of residual life methodologies, relevantbackground and the issues that need further research – that are discussed in thisreport.
7

7/29/2019 Appendix-B1 -RSL Strand Literature Review Report
http://slidepdf.com/reader/full/appendix-b1-rsl-strand-literature-review-report 8/45
Appendix – B1: A summary of the State-of-the-art Residual Service Life methods
1.2 Background
As noted in the previous section, European Union evidenced the need to retrofit orrefurbish buildings, hotels and other assets. During the 1980’s and 1990’s buildingrefurbishment attracted a lot of attention and had gained an increasing importance in
the construction sector. It was observed that the social and functional life of acommercial building was much shorter than its physical life. Furthermore,refurbishment costs were much lesser (about half to one-third) in comparison withdemolition and reconstruction. (Balaras, et.al, 2002). Clearly, this involves the multi-disciplinary influence encompassing a time scale that often adds to the complexity of the problem. Sustained research undertaken has led to many new generationmethodologies and softwares. The European research project INVESTIMMO requires special mention in this connection.
“The goal of the INVESTIMMO European project is to develop a computer-based multimedia software giving assistance to decision makers to deliver strategic real estate plans tailored to suit either the company’s or individual’s needs and whether simple or complex in nature” (Investimmo web site, Newsletter 1, September 2003)
It is clear from the above statement that the project relates to the housing sector.Investment budgets for these types are limited and the general trend is to installthose measures, which offer the quickest payback period. INVESTIMMO advises thatthe planning should be made on a long term basis, based on the following criteria:
• Evaluation of the deterioration process of the building• Housing market• Tenant’s expectations• Upgrading potential of the building associated with aesthetic, historic values• Environmental impacts
• Economic factors (like rental income, operating expenses etc.,)
Based on the above criteria, the project work was delineated into 8 work packages(WP), each assigned with a single task. In the first of the work packages namely theWP 1, a series of buildings were proposed to be surveyed for data collection. InWP2, a degradation model of all the building elements associated with physical,technical, social, cultural, and management issues were proposed. WP 3 to WP 6corresponds to the works listed in the above criteria (Housing market, Tenant’sexpectations, financial indicators etc.,) WP 7 merges all of the above. WP8 relates tothe development of the software.
Since the 1980’s, many methods have been developed in France and later on inSwitzerland to evaluate the deteriorated state of existing apartment buildings. TheEPIQR European project (J OR3-CT96-0044) developed a decision-making tool forresidential building refurbishment. The tool assists the user to perform a systematicdiagnosis covering the building deterioration state, the energy saving and indoorenvironment quality improvement potential. It calculates the refurbishment costsusing a building audit within half a day. TOBUS (J OR3-CT98-0235) is a recentlycompleted European project that shares similar principles to that of EPIQR but it isdeveloped for office buildings. It has more in-depth building modelling and integratesother refurbishment aspects like functional obsolescence of technical installationsand services. SUREURO (EVK4-CT99-20002) is an on-going project in theframework of the City of Tomorrow European programme. Its goal is to develop
decision making tools that integrate environmental issues in the decision makingprocess and bring together all the concerned social representatives (EuropeanCommission Growth Program http:// investimmo.cstb.fr).
8

7/29/2019 Appendix-B1 -RSL Strand Literature Review Report
http://slidepdf.com/reader/full/appendix-b1-rsl-strand-literature-review-report 9/45
Appendix – B1: A summary of the State-of-the-art Residual Service Life methods
The existing decision-making tools answer the question what to improve in aparticular building, how to do it in a sustainable manner (SUREURO) and how muchit costs (EPIQR, TOBUS). INVESTIMMO will provide answers to critical questionslike where and when to invest in a large building stock. In other words, a manager oran owner of a large number of residential buildings will be able to decide which of his
buildings need improvement, which of them can wait and for how long, and which of them can be sold or demolished.
One gap identified in all these approaches is the inability to integrate the structuralstrengthening techniques and the residual life into decision making for buildingrefurbishment.
A new CRC-CI project aims to overcome the above deficiencies by developing a newtool that can integrate the important issues that assists in the decision makingprocess. Consequently, a review of the existing methodologies in modeling residuallife of buildings is warranted. The next section of this report presents thedevelopment and principles of some of the modeling methodologies.
9
7/29/2019 Appendix-B1 -RSL Strand Literature Review Report
http://slidepdf.com/reader/full/appendix-b1-rsl-strand-literature-review-report 10/45
Appendix – B1: A summary of the State-of-the-art Residual Service Life methods
2 PREDICTION OF RESIDUAL SERVICE LIFE
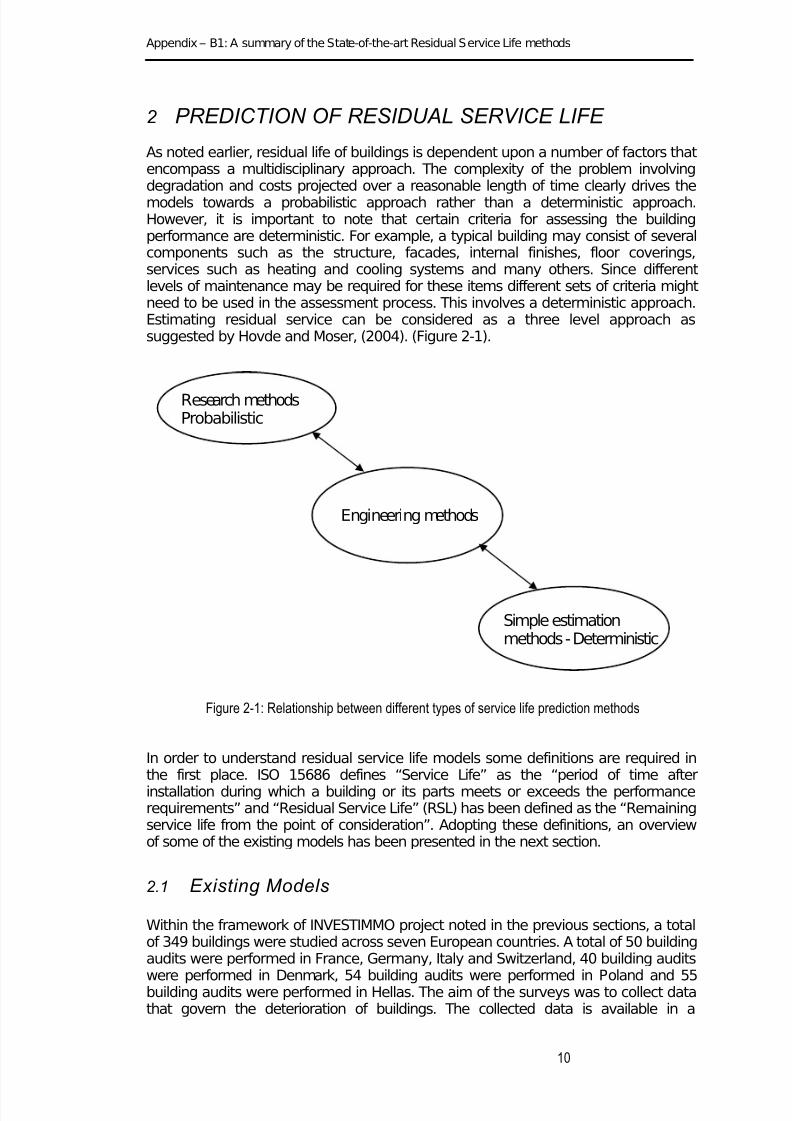
As noted earlier, residual life of buildings is dependent upon a number of factors thatencompass a multidisciplinary approach. The complexity of the problem involvingdegradation and costs projected over a reasonable length of time clearly drives themodels towards a probabilistic approach rather than a deterministic approach.However, it is important to note that certain criteria for assessing the buildingperformance are deterministic. For example, a typical building may consist of severalcomponents such as the structure, facades, internal finishes, floor coverings,services such as heating and cooling systems and many others. Since differentlevels of maintenance may be required for these items different sets of criteria mightneed to be used in the assessment process. This involves a deterministic approach.Estimating residual service can be considered as a three level approach assuggested by Hovde and Moser, (2004). (Figure 2-1).
Research methodsProbabilistic
Engineering methods
Simple estimationmethods - Deterministic
Figure 2-1: Relationship between different types of service life prediction methods
In order to understand residual service life models some definitions are required inthe first place. ISO 15686 defines “Service Life” as the “period of time afterinstallation during which a building or its parts meets or exceeds the performancerequirements” and “Residual Service Life” (RSL) has been defined as the “Remainingservice life from the point of consideration”. Adopting these definitions, an overviewof some of the existing models has been presented in the next section.
2.1 Existing Models
Within the framework of INVESTIMMO project noted in the previous sections, a totalof 349 buildings were studied across seven European countries. A total of 50 buildingaudits were performed in France, Germany, Italy and Switzerland, 40 building audits
were performed in Denmark, 54 building audits were performed in Poland and 55building audits were performed in Hellas. The aim of the surveys was to collect datathat govern the deterioration of buildings. The collected data is available in a
10

7/29/2019 Appendix-B1 -RSL Strand Literature Review Report
http://slidepdf.com/reader/full/appendix-b1-rsl-strand-literature-review-report 11/45
Appendix – B1: A summary of the State-of-the-art Residual Service Life methods
database called as European Residential Building Audits Database (ERBAD). Ademo version of ERBAD can be accessed from the INVESTIMMO web page.However, the demo version displays only limited information. Details of theinvestigation and modelling are available thru the purchase of CD’s.
The building audits were performed with a methodology known as EPIQR (Energy
lourentzou et al. 2000, proposed a theoretical work describing the functions for the
very similar method has been proposed by Caccavelli and Genre, 2000. The
amforth, 2003, proposed a probabilistic approach and an ISO factorial model to
he Markov model has been suggested in some literatures to model the residual
he aforementioned models somehow form the basis of the life cycle approach
EPIQR method (Energy Performance and Indoor
his methodology has been developed to assist architects, engineers and other
Performance and Indoor environmental Quality Retrofit). EP IQR typicallydecomposes the building into a number of elements and types. Codes are used forascertaining the level of deterioration. This methodology developed mainly forapartment buildings formed the backbone of other similar methodologies. Followingsimilar principles TOBUS (Tool for selecting Office Building Upgrading Solutions)was developed for office buildings and XENIOS (an audit tool for hotel buildings) wasdeveloped for hotels.
Fdescription of the development of each degradation state and the practical work done
for the “Swiss Federation Office for Economic Policy” in the PI BAT program:Me’thode d’Estimation de Bugents d’Investissement (MEBI) (Genre, 1995). MEBIbases its predictions on a large –scale survey among 30 building experts. It iscapable of calculating the residual life time of 50 building different elements andassessing the development of the refurbishment investment budget under thecondition that no refurbishment works would be undertaken in the meantime. MEDIC method developed by Flourentzou, et.al, 2000, is a method for predicting residualservice life and refurbishment investment budget.
Abuilding is divided into 50-60 elements but it uses more detailed condition ratingscheme. The list of refurbishment work will then be developed based on the rating.
Bpredict the residual life of a building component.
Tservice life of structures, although not explicitly on building deterioration.
Tadopted in countries like United Kingdom, Canada, Norway, US, J apan and evenNew Zealand. Therefore these models have been described in the following sectionsof this report.
2.2
environmental Quality Retrofit)
Tprofessionals during the refurbishment or retrofitting actions of apartment buildings. The method is based on complete concept formulation that starts with thecommencement of the refurb project and provides a complete strategy to the user.Modelling building deterioration, assessment of energy consumption and indoorenvironmental air quality are considered in this process as explained below:
11

7/29/2019 Appendix-B1 -RSL Strand Literature Review Report
http://slidepdf.com/reader/full/appendix-b1-rsl-strand-literature-review-report 12/45
Appendix – B1: A summary of the State-of-the-art Residual Service Life methods
2.2.1 Modelling building deterioration
In this methodology, the building is divided into 8 Macro elements (as shown inFigure 2-2) and then decomposed into discreet elements such as load bearingstructure, windows, facades, roof etc., as shown in Table 2-1.
Figure 2-2: Macro Elements of a building (European Residential Building Audits Database, ERBAD.)
12

7/29/2019 Appendix-B1 -RSL Strand Literature Review Report
http://slidepdf.com/reader/full/appendix-b1-rsl-strand-literature-review-report 13/45
Appendix – B1: A summary of the State-of-the-art Residual Service Life methods
13

7/29/2019 Appendix-B1 -RSL Strand Literature Review Report
http://slidepdf.com/reader/full/appendix-b1-rsl-strand-literature-review-report 14/45
Appendix – B1: A summary of the State-of-the-art Residual Service Life methods
14

7/29/2019 Appendix-B1 -RSL Strand Literature Review Report
http://slidepdf.com/reader/full/appendix-b1-rsl-strand-literature-review-report 15/45
Appendix – B1: A summary of the State-of-the-art Residual Service Life methods
15
7/29/2019 Appendix-B1 -RSL Strand Literature Review Report
http://slidepdf.com/reader/full/appendix-b1-rsl-strand-literature-review-report 16/45
Appendix – B1: A summary of the State-of-the-art Residual Service Life methods
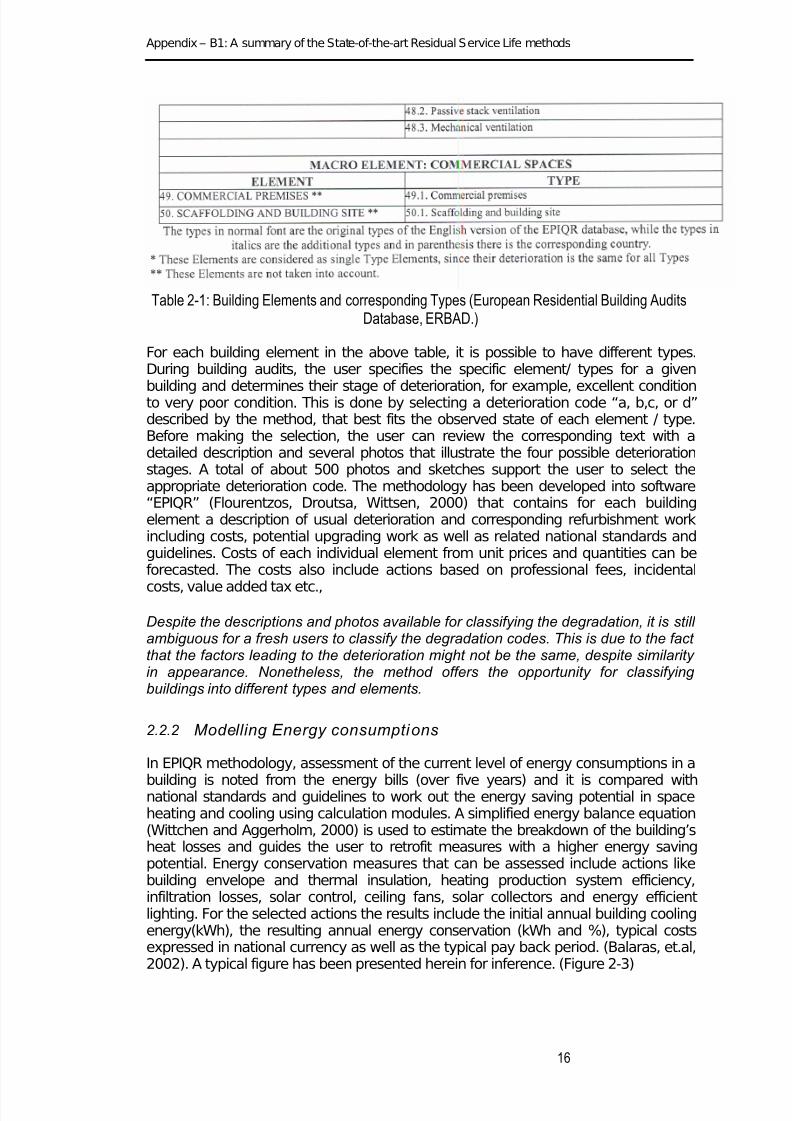
Table 2-1: Building Elements and corresponding Types (European Residential Building AuditsDatabase, ERBAD.)
For each building element in the above table, it is possible to have different types.During building audits, the user specifies the specific element/ types for a given
building and determines their stage of deterioration, for example, excellent conditionto very poor condition. This is done by selecting a deterioration code “a, b,c, or d”described by the method, that best fits the observed state of each element / type.Before making the selection, the user can review the corresponding text with adetailed description and several photos that illustrate the four possible deteriorationstages. A total of about 500 photos and sketches support the user to select theappropriate deterioration code. The methodology has been developed into software“EPIQR” (Flourentzos, Droutsa, Wittsen, 2000) that contains for each buildingelement a description of usual deterioration and corresponding refurbishment workincluding costs, potential upgrading work as well as related national standards andguidelines. Costs of each individual element from unit prices and quantities can beforecasted. The costs also include actions based on professional fees, incidental
costs, value added tax etc.,
Despite the descriptions and photos available for classifying the degradation, it is still ambiguous for a fresh users to classify the degradation codes. This is due to the fact that the factors leading to the deterioration might not be the same, despite similarity in appearance. Nonetheless, the method offers the opportunity for classifying buildings into different types and elements.
2.2.2 Modelling Energy consumptions
In EPIQR methodology, assessment of the current level of energy consumptions in a
building is noted from the energy bills (over five years) and it is compared withnational standards and guidelines to work out the energy saving potential in spaceheating and cooling using calculation modules. A simplified energy balance equation(Wittchen and Aggerholm, 2000) is used to estimate the breakdown of the building’sheat losses and guides the user to retrofit measures with a higher energy savingpotential. Energy conservation measures that can be assessed include actions likebuilding envelope and thermal insulation, heating production system efficiency,infiltration losses, solar control, ceiling fans, solar collectors and energy efficientlighting. For the selected actions the results include the initial annual building coolingenergy(kWh), the resulting annual energy conservation (kWh and %), typical costsexpressed in national currency as well as the typical pay back period. (Balaras, et.al,2002). A typical figure has been presented herein for inference. (Figure 2-3)
16

7/29/2019 Appendix-B1 -RSL Strand Literature Review Report
http://slidepdf.com/reader/full/appendix-b1-rsl-strand-literature-review-report 17/45
Appendix – B1: A summary of the State-of-the-art Residual Service Life methods
Figure 2-3: Example of a user interface for `Heating Energy’ balance
The main output of the above figure is that with some combination of refurbstrategies, the heat losses can be reduced to 200 kWh/sq.m from 314 kWh/sq.m. It
has been noted that the database used in the calculations, allows even a non-expert user to input values into the module. However, the program needs to be used to provide a valid appreciation or criticism.
2.2.3 Modelling Indoor Environmental Quality
For Indoor Environmental Quality (IEQ) in the EPIQR, questionnaires are used tocollect data on occupant complaints and after analysis different possible actions of improvement are selected. The software performs a statistical treatment of thequestionnaire and relates complaints with refurbishment work and energy retrofit
measures.
A clear distinction has been made between the diagnosis and decisions to be madewhich do not affect the diagnosis. The software allows the user to build differentscenarios and each scenario shows different levels of improvements to the officebuilding and all have variations in the proposed budget cost. A radar graphsummarises the building deterioration state and on the same graph the auditor canvisualise the refurbishment actions comparing which actions promote greatest energysavings, improve indoor air etc., the program also calculates the scenario cost andthe users can also modify this cost. The interface is programmed in Visual Basic andthe data bases in MS access.
As noted earlier the model does not consider the alterations in floor space andstrengthening techniques. In addition, risk assessments can not be made in great
17

7/29/2019 Appendix-B1 -RSL Strand Literature Review Report
http://slidepdf.com/reader/full/appendix-b1-rsl-strand-literature-review-report 18/45
Appendix – B1: A summary of the State-of-the-art Residual Service Life methods
detail. It can be noted that the above model is not completely a residual life cyclemodel but encompasses the principles. Consequently, the MEDIC method wasdeveloped to complement EPIQR.
2.3 MEDIC method (Method d Evaluation de sc’nearious deDegradation probables d’Invessissements Correspondants)
As noted earlier, the decision to retrofit depends on the remaining useful life of acomponent. For example, the time to replace an element is when it reaches the verybad state of existence. Knowing that a particular element would survive in areasonable condition for a certain length of time would allow the investor to plan forits refurb during next maintenance cycle. However, the authors suggest that thedecision to retrofit windows could be based on the availability of form work for façadeconstruction, even if this involves less energy saving potential. In such cases it isonly the cost benefit analysis that would drive the decision.
The MEDIC method is based on subdividing the building into 50 elements. Fourcodes {a, b, c, d}, are used to describe the deterioration state of an element. Code a’represents an element in good condition, Code `b’ an element with minordeterioration, Code `c’ an element with more serious deterioration and Code `d’ anelement that need replacement. The life of each element then summarised in fourprobability curves as shown in Figure 2-4. These curves show at anytime of element’s life time the probability for the deterioration codes of a, b, c or d,respectively.
The curves shown in Figure 2-4 are for illustrative purposes only. Consequently,users intending to employ MEDIC method need to develop these sorts of deterioration curves. It thus needs assimilated data or prior knowledge of thecomponents. Confidence limits need to be ensured for the volume of databaseconsidered.
18

7/29/2019 Appendix-B1 -RSL Strand Literature Review Report
http://slidepdf.com/reader/full/appendix-b1-rsl-strand-literature-review-report 19/45
Appendix – B1: A summary of the State-of-the-art Residual Service Life methods
10 20 30 40 50 60 700
1
0.5
0
P(a)
10 20 30 40 50 60 700
1
0.5
0
P(b)
10 20 30 40 50 60 700
1
0.5
0
P(c)
10 20 30 40 50 60 700
1
0.5
0
P(d)
Age of the building element [Years]
Figure 2-4: Probability curves for deterioration codes of the elements
The probability curves in Figure 2-4 can be also plotted as a cumulative curve shownin Figure 2-5. The sum of the deterioration properties for a certain element should be1 at every instant. It can be seen that a 10-year old element is certain to correspondto code a, while 17 years old element with 50% probability is code b. a 40 years oldelement has a 35% probability of being code c and 15% probability of being code d.A 80 years old element is, with 99% probability, need replacement.
19

7/29/2019 Appendix-B1 -RSL Strand Literature Review Report
http://slidepdf.com/reader/full/appendix-b1-rsl-strand-literature-review-report 20/45
Appendix – B1: A summary of the State-of-the-art Residual Service Life methods
P(a) P(b) P(c) P(d)
10 20 30 40 50 60 700
1
0
Q
Age of the building element [Years]
Figure 2-5: Cumulative probabilities of deterioration codes
The probability of a given building element to be classified into codes a, b, c, or d,can be read on the y-axis. The space Q = [0, 1] on the y-axis represents the universeof all probable building elements. The time of passage from one code to another can
be read, when the exact position of an element is known on the y-axis of the graph. The value q = 0 represents a good building with a long life span for all transitionsfrom code to code are taken place after a very long time. An element correspondingto the value of q = 1, in contrast represents the worst case. The space Q = [0, 1] canbe called the “Quality Space”. In practice, it is impossible to determine the position of specific element exactly in the space Q, but it is possible to define or assess a regionin which it is likely to be found. An element of poor quality or an element exposed torough weather conditions could be placed in space of [0.5, 1.0] while an element of good quality can be placed in space of [0, 0.5].
P(a) P(b) P(c) P(d)
10 20 30 40 50 60 700
1
0
BQ
Age of the building element [Years]
Figure 2-6: Visualization for an element found in subspace of [0, B]
Figure 2-6 shows effect of limiting the quality space from [0, 1] to [0, B]. The intervalof probable transition from code a to code b is then from 6th to 20th year, an interval of 14 years. Knowing that the quality space of [0, B] restrains the time of transition tothe interval from the 12th to the 20th, which is an interval of 8 yeas. The new probableperiod of transition from b to c is from the 24th to the 43rd year and the new probableperiod of transition from c to d is from the 45th to 80th yeas. As it appears, theknowledge of the quality space considerably restrains depression on the probableresidual service life.
The posteriors probability of having code a, b, c or, d for the years that follows
diagnosis may be determined after considering the present state and the qualitysubspace of an element. The Monte-Carlo procedure may then be used to calculate
20

7/29/2019 Appendix-B1 -RSL Strand Literature Review Report
http://slidepdf.com/reader/full/appendix-b1-rsl-strand-literature-review-report 21/45
Appendix – B1: A summary of the State-of-the-art Residual Service Life methods
the cost for the resulting code combination using number of random draws on theprobability curves for each of the 50 elements. The probability distribution of theglobal refurbishment cost can be then drawn.
The method is good in concepts, but the real time application needs the probability
curves of deterioration of the concerned element and also the knowledge of restraining the quality space. Quality as such is a comparative term and this could vary for different elements. Therefore the method can be tested initially for lesscomplex buildings and then can be applied for more complex buildings or elements.
2.4 Deterministic Method of diagnosing bui lding degradationand modelling refurb costs
The previous section had highlighted the necessity of developing a building databaseon degradation of elements. It is important to note that buildings vary on type, size,
site conditions and on many other factors that have a consequential influence uponthe construction costs. It thus becomes necessary to adopt a consistent procedure indeveloping the `costs’ database. In the initial stages of cost estimation this may notbe necessary, but might be required in the subsequent stages. In order to make thecost database consistent amongst the European countries contributing to the EPIQRproject, a methodology was developed by Caccavelli and Genre, (2000) and thesame has been presented below.
To make national refurbishment work databases consistent, the following basicguidelines were provided to the EPIQR project participants.
•
Each refurbishment work is deemed to be common practice within the scopeof usual refurbishment projects.• Refurbishment works must be consistent on the one hand with the state of
degradation of the building and, on the other hand, with the EPIQR softwarestructure. Therefore, when applicable, a list of work has to be produced, perelement, type and code. This list is empty when there is no scheduled workother than maintenance work i.e., outside the scope of application of theEPIQR method.
• Refurbishment works have been selected as being appropriate for low tomedium housing. Therefore, unnecessarily high cost actions have been leftoff the list
• There is no limit concerning the description of the works. However, it is of
importance to bear in mind that the EPIQR tool applies at an early stage inthe refurbishment process. Therefore, a brief and globalised description of refurbishment work is more adequate.
• When an installation or piece of equipment is too old or is insufficient (forinstance, not enough electric sockets), repairs will be either on the basis of current standards or using the best practices (three electric sockets per room,connection to ground, installation of a differential circuit breaker)
Table 2-2 shows a sample of the list of a typical building refurbishment work forelement 48 (ventilation) type 3 (mechanical ventilation). Note that this examplebelongs to the EPIQR category and represents the European conditions.
21

7/29/2019 Appendix-B1 -RSL Strand Literature Review Report
http://slidepdf.com/reader/full/appendix-b1-rsl-strand-literature-review-report 22/45
Appendix – B1: A summary of the State-of-the-art Residual Service Life methods
Table 2-2: Extract from the list of typical building refurbishment work
Degradation code Work code Work description
a (good state) 48-3-a-1
b (slight degradation) 48-3-b-1 Complete dismantling and installation of new air inlets
b 48-3-b-2 J oining using silicone sealant
b 48-3-b-3 Air balancing
c (medium degradation) 48-3-c-1 Complete dismantling and installation of new air inlets
c 48-3-c-2 J ointing using silicone sealant
c 48-3-c-3 Partial dismantling and installation of new exhaust vents
c 48-3-c-4 Dismantling extract fan unit and installation of new one
c 48-3-c-5 Air balancing
d (poor state) 48-3-d-1 Complete dismantling and installation of new air inlets
d 48-3-d-2 Electrical connection to rooftop fan unit
d 48-3-d-3Making good extract fan foundation block, including all roof waterproofing constrains
d 48-3-d-4 Dismantling extract fan unit and installation of new one
d 48-3-d-5 Cleaning duct network
d 48-3-d-6 Complete dismantling and installation of new exhaust vents
d 48-3-d-7 Air balancing
d 48-3-d-8 J oining using silicone sealant
2.4.1 Classification of works:
The methodology recommends classifying the works based on the different tradesinvolved in the building such as structural work, insulation, façade renderings,painting, plumbing etc., for the following reasons:
• Before announcing a figure to the customer, it is necessary to check whether
the cost estimation made using the EPIQR method is relevant or not. Buildingprofessionals generally have benchmarks or even thumb rules enabling themto establish very quickly whether the orders of magnitude of costing arecomplied with or not.
• The classification of the works according to various trades is a way of gainingtime when drafting the call for tenders.
• The change in prices from one year to another differs according to thebuilding trade involved.
Once the lists and classifications are finalised, different items can be priced up. Thefollowing sections describe the costing exercise.
22
7/29/2019 Appendix-B1 -RSL Strand Literature Review Report
http://slidepdf.com/reader/full/appendix-b1-rsl-strand-literature-review-report 23/45
Appendix – B1: A summary of the State-of-the-art Residual Service Life methods
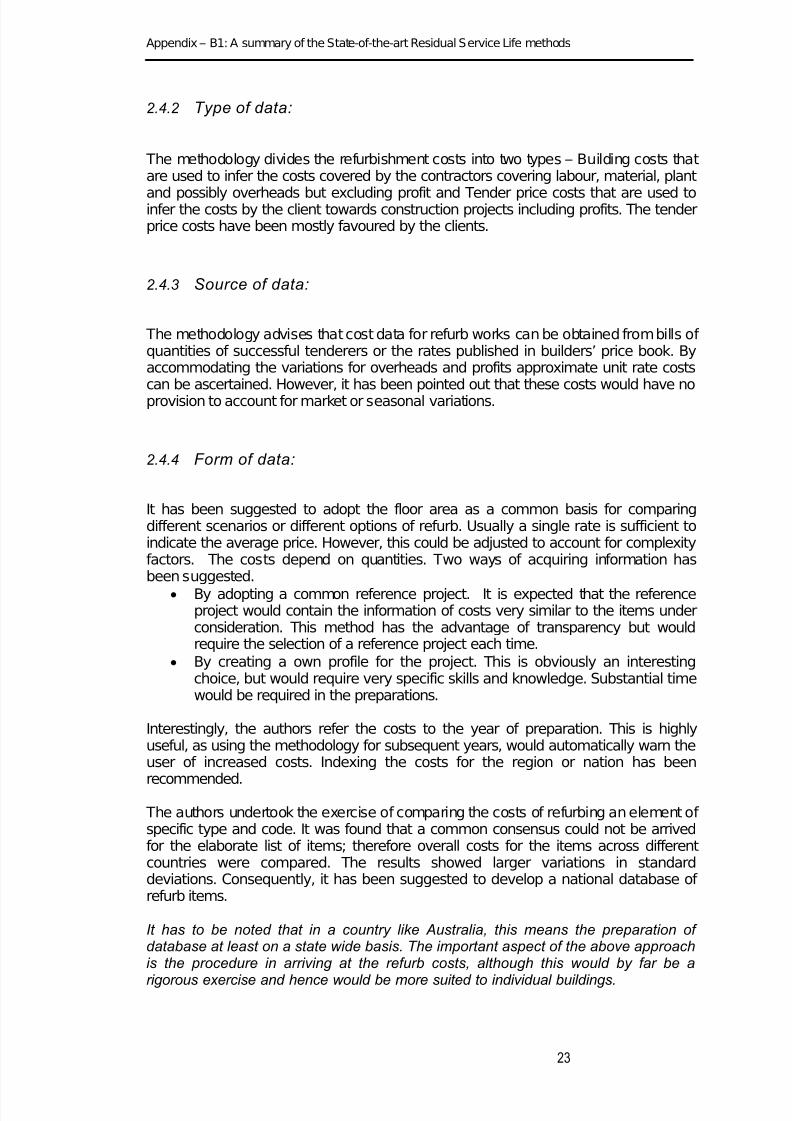
2.4.2 Type of data:
The methodology divides the refurbishment costs into two types – Building costs thatare used to infer the costs covered by the contractors covering labour, material, plant
and possibly overheads but excluding profit and Tender price costs that are used toinfer the costs by the client towards construction projects including profits. The tenderprice costs have been mostly favoured by the clients.
2.4.3 Source of data:
The methodology advises that cost data for refurb works can be obtained from bills of quantities of successful tenderers or the rates published in builders’ price book. Byaccommodating the variations for overheads and profits approximate unit rate costscan be ascertained. However, it has been pointed out that these costs would have noprovision to account for market or seasonal variations.
2.4.4 Form of data:
It has been suggested to adopt the floor area as a common basis for comparingdifferent scenarios or different options of refurb. Usually a single rate is sufficient toindicate the average price. However, this could be adjusted to account for complexityfactors. The costs depend on quantities. Two ways of acquiring information hasbeen suggested.
• By adopting a common reference project. It is expected that the referenceproject would contain the information of costs very similar to the items underconsideration. This method has the advantage of transparency but wouldrequire the selection of a reference project each time.
• By creating a own profile for the project. This is obviously an interestingchoice, but would require very specific skills and knowledge. Substantial timewould be required in the preparations.
Interestingly, the authors refer the costs to the year of preparation. This is highlyuseful, as using the methodology for subsequent years, would automatically warn theuser of increased costs. Indexing the costs for the region or nation has been
recommended.
The authors undertook the exercise of comparing the costs of refurbing an element of specific type and code. It was found that a common consensus could not be arrivedfor the elaborate list of items; therefore overall costs for the items across differentcountries were compared. The results showed larger variations in standarddeviations. Consequently, it has been suggested to develop a national database of refurb items.
It has to be noted that in a country like Australia, this means the preparation of database at least on a state wide basis. The important aspect of the above approachis the procedure in arriving at the refurb costs, although this would by far be a
rigorous exercise and hence would be more suited to individual buildings.
23
7/29/2019 Appendix-B1 -RSL Strand Literature Review Report
http://slidepdf.com/reader/full/appendix-b1-rsl-strand-literature-review-report 24/45
Appendix – B1: A summary of the State-of-the-art Residual Service Life methods
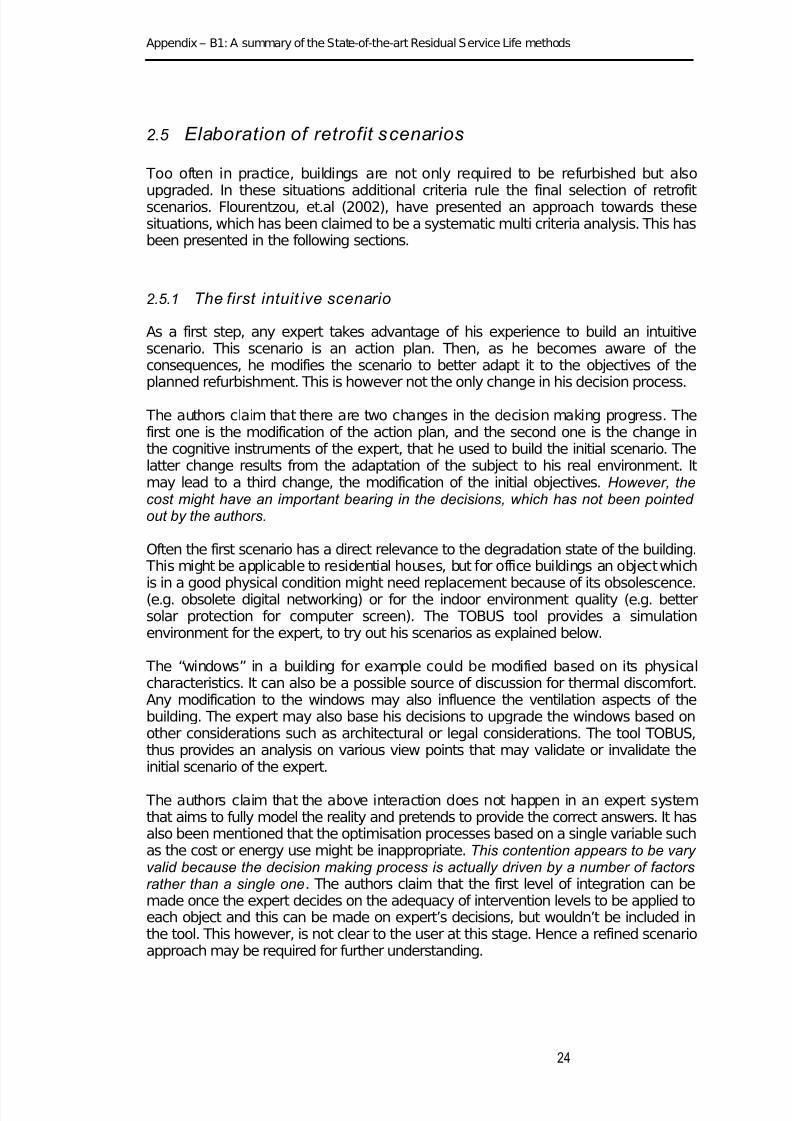
2.5 Elaboration of retrofit scenarios
Too often in practice, buildings are not only required to be refurbished but also
upgraded. In these situations additional criteria rule the final selection of retrofitscenarios. Flourentzou, et.al (2002), have presented an approach towards thesesituations, which has been claimed to be a systematic multi criteria analysis. This hasbeen presented in the following sections.
2.5.1 The first intuit ive scenario
As a first step, any expert takes advantage of his experience to build an intuitivescenario. This scenario is an action plan. Then, as he becomes aware of theconsequences, he modifies the scenario to better adapt it to the objectives of theplanned refurbishment. This is however not the only change in his decision process.
The authors claim that there are two changes in the decision making progress. Thefirst one is the modification of the action plan, and the second one is the change inthe cognitive instruments of the expert, that he used to build the initial scenario. Thelatter change results from the adaptation of the subject to his real environment. Itmay lead to a third change, the modification of the initial objectives. However, thecost might have an important bearing in the decisions, which has not been pointed out by the authors.
Often the first scenario has a direct relevance to the degradation state of the building. This might be applicable to residential houses, but for office buildings an object which
is in a good physical condition might need replacement because of its obsolescence.(e.g. obsolete digital networking) or for the indoor environment quality (e.g. bettersolar protection for computer screen). The TOBUS tool provides a simulationenvironment for the expert, to try out his scenarios as explained below.
The “windows” in a building for example could be modified based on its physicalcharacteristics. It can also be a possible source of discussion for thermal discomfort.Any modification to the windows may also influence the ventilation aspects of thebuilding. The expert may also base his decisions to upgrade the windows based onother considerations such as architectural or legal considerations. The tool TOBUS,thus provides an analysis on various view points that may validate or invalidate theinitial scenario of the expert.
The authors claim that the above interaction does not happen in an expert systemthat aims to fully model the reality and pretends to provide the correct answers. It hasalso been mentioned that the optimisation processes based on a single variable suchas the cost or energy use might be inappropriate. This contention appears to be vary valid because the decision making process is actually driven by a number of factorsrather than a single one. The authors claim that the first level of integration can bemade once the expert decides on the adequacy of intervention levels to be applied toeach object and this can be made on expert’s decisions, but wouldn’t be included inthe tool. This however, is not clear to the user at this stage. Hence a refined scenarioapproach may be required for further understanding.
24
7/29/2019 Appendix-B1 -RSL Strand Literature Review Report
http://slidepdf.com/reader/full/appendix-b1-rsl-strand-literature-review-report 25/45
Appendix – B1: A summary of the State-of-the-art Residual Service Life methods
2.5.2 Refining the scenario
In the second instance of the scenario, it is required to reefing the existing scenario. The example considered herein is the building heating system. If the expert decidesto add thermal insulation to the envelope of an uninsulated building then the boiler
becomes oversized, thus causing an efficiency drop. The action on one object (thebuilding envelope) from an energy point of view may require the replacement of theboiler even if it is still in good condition. Thus there may be numerous examples of interaction in a building. It is possible to model most of these but not all of these.However, the authors claim that this is not the reason to do nothing and adopt thefirst scenario that comes to the mind. Accordingly, the tool helps the expert toestablish coherent scenarios with good rational foundations.
2.5.3 Checking linked actions
The authors maintain that the tool TOBUS does not impose a decision, but tries toconfront it with the judgement of an expert and to protest when there is somediscordance. For example, TOBUS suggests replacing the sanitary appliances, whilstreplacing the sewerage system. However, the final decision is left to the expert. Thisapproach is reasonable considering that these sorts of tools really guide the user. By this approach possible oversights can be avoided.
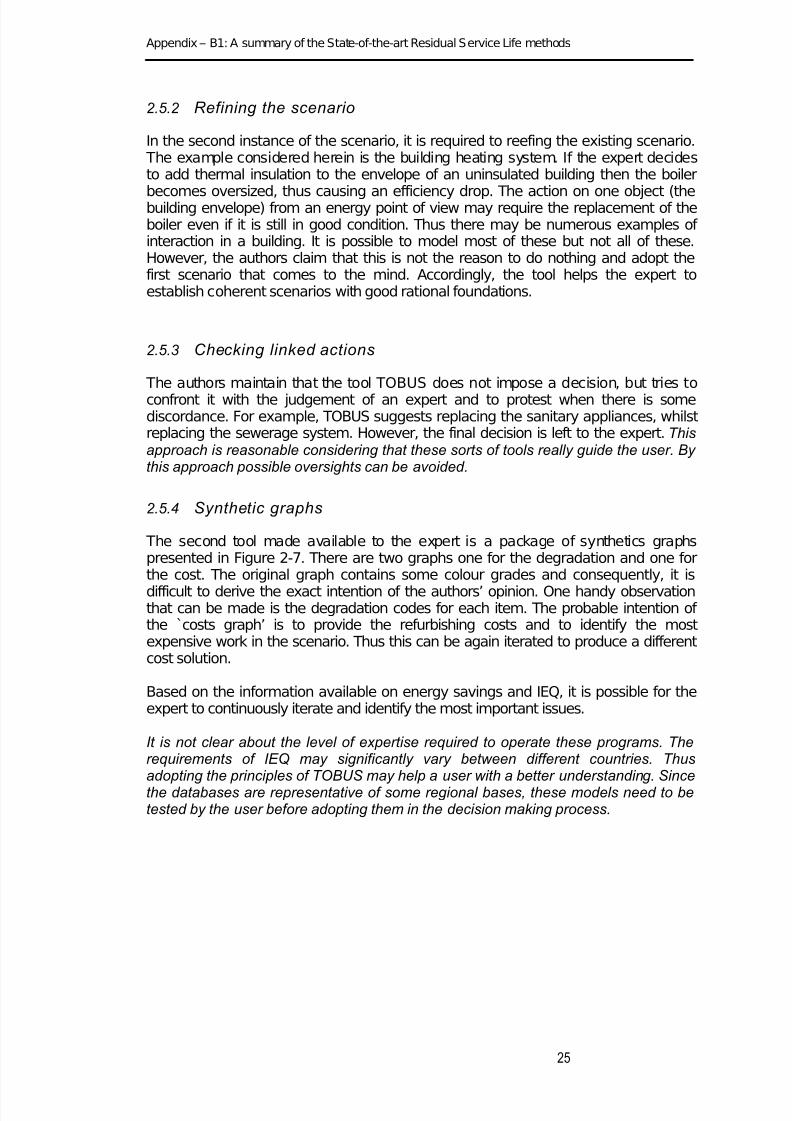
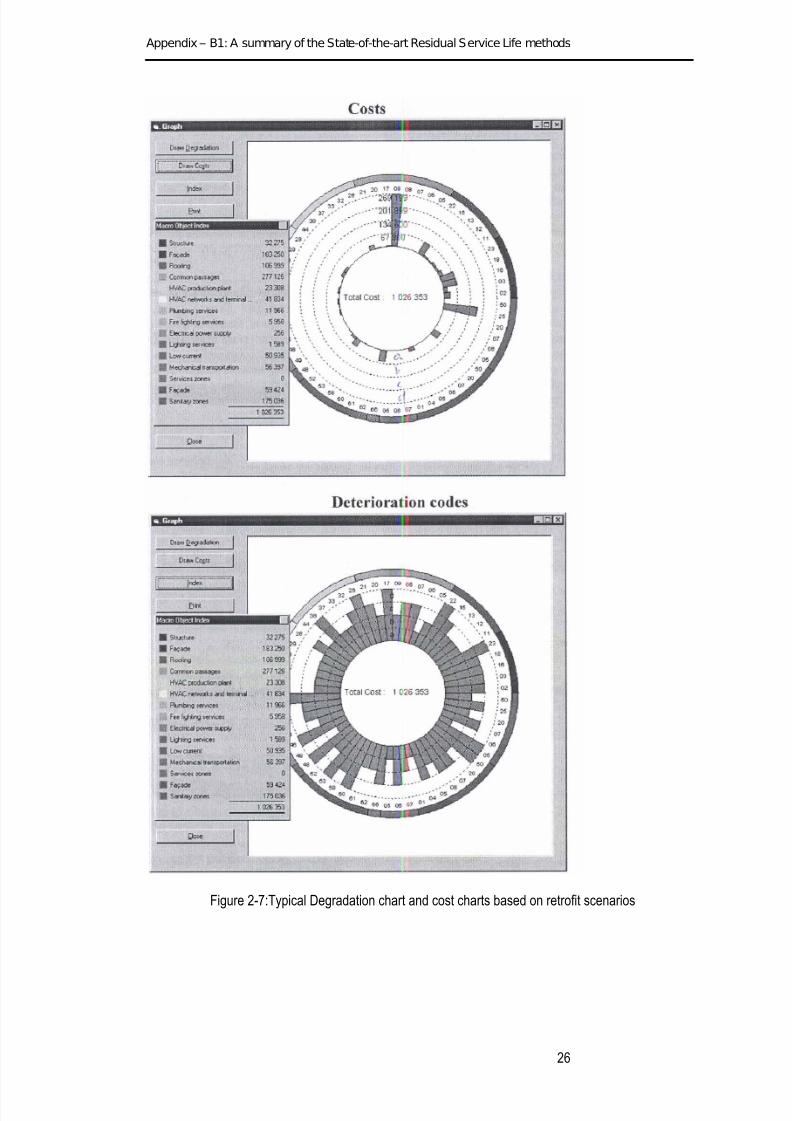
2.5.4 Synthetic graphs
The second tool made available to the expert is a package of synthetics graphspresented in Figure 2-7. There are two graphs one for the degradation and one forthe cost. The original graph contains some colour grades and consequently, it is
difficult to derive the exact intention of the authors’ opinion. One handy observationthat can be made is the degradation codes for each item. The probable intention of the `costs graph’ is to provide the refurbishing costs and to identify the mostexpensive work in the scenario. Thus this can be again iterated to produce a differentcost solution.
Based on the information available on energy savings and IEQ, it is possible for theexpert to continuously iterate and identify the most important issues.
It is not clear about the level of expertise required to operate these programs. Therequirements of IEQ may significantly vary between different countries. Thusadopting the principles of TOBUS may help a user with a better understanding. Sincethe databases are representative of some regional bases, these models need to betested by the user before adopting them in the decision making process.
25
7/29/2019 Appendix-B1 -RSL Strand Literature Review Report
http://slidepdf.com/reader/full/appendix-b1-rsl-strand-literature-review-report 26/45
Appendix – B1: A summary of the State-of-the-art Residual Service Life methods
Figure 2-7:Typical Degradation chart and cost charts based on retrofit scenarios
26

7/29/2019 Appendix-B1 -RSL Strand Literature Review Report
http://slidepdf.com/reader/full/appendix-b1-rsl-strand-literature-review-report 27/45
Appendix – B1: A summary of the State-of-the-art Residual Service Life methods
2.5.5 A construct iv is t and interactive approach
Checking the hypotheses of these models requires the verification of real timedecisions with those taken in a controlled environment. The authors point out that themodels like EPIQR and TOBUS were evaluated against users who have actually
used these models or tools in real time. It is interesting to note that many agree thatthese models are systematic and provide better insight into energy savings, IEQ andbetter global vision. Thus the models do appear to enjoy some success.
2.5.6 Multicriteria approach to off ice building retrofit strategies
Rey, E., (2004) has presented a multi criteria approach of an architectural issue inoffice buildings. Typically the retrofitting duration is assumed to be in the order of 25to 30 years, which can be considered as a preliminary estimate of residual life.Nonetheless the method has some advantages for these offers another view point onretrofit strategies.
The issue discussed here is the retrofitting strategy of a building façade. Threestrategies namely, the stabilisation strategy, substitution strategy and the double-skinfaçade strategy have been considered. Perhaps the strategies are self-explanatory.
2.5.6.1 Multicriteria assessment methodology
The choice of the criteria has been based on three main fields of sustainability:environmental, sociocultural and economic criteria have been consideredsimultaneously. In addition under each criterion, relevant issues have been
considered. For example, the Environmental criteria have been broken down toAnnual energy use for heating, electricity use, emissions etc., thus making eachcriterion more relevant. Weight sets for each of these factors have been assigned.However, the bases of arriving at the weight sets have not been explained.
In order to determine the most effective retrofitting strategy, a software known asELECTRE III has been adopted. The key steps involved are:
• Definition of weights and thresholdso For each criterion a weight factor has to be defined to assign a
coefficient of importance to three threshold values like, preference,indifference and veto.
• Criterion-by-criterion comparisono The three strategies noted earlier are compared two-by-two and
criterion-by-criterion. For each criterion, the difference between twoperformance values is compared with the three predefined thresholds. This comparison gives a value between 0 and 1 meaning eitherconcordance or discordance index.
• Global outranking relationo This is based on comparing two strategies and assigning one over the
other provided that one strategy is clearly over the other for majority of the criteria without being too bad in relation to the other criterias. These conditions are based on establishing a global concordanceindex and a credibility index that may result in either incomparability orpreference or indifference.
• Ascending and descending distillation
27

7/29/2019 Appendix-B1 -RSL Strand Literature Review Report
http://slidepdf.com/reader/full/appendix-b1-rsl-strand-literature-review-report 28/45
Appendix – B1: A summary of the State-of-the-art Residual Service Life methods
o In order to establish a global ranking list, the list of strategies that areabove and below a particular strategy. This complex has been madepossible by the ELECTRE III software.
• Ascending and descending ranking listso The above step leads to two sets namely the ascending and
descending ranking lists.• Final ranking list
o An intersection of the ascending and descending strategies leads tothe final ranking list. This leads to the outcome that one strategy couldbe before another in one ranking list and also before or equal toanother in the other strategy. Thus it is possible to identify whetherstrategies are equal or comparable or incomparable.
Although the above process appears to be elegant, the assignment of criteria and weights does require a significant database and skill.
2.5.6.2 Case study results
The authors present three case study results to explain this methodology. The firstbuilding, a framed concrete structure building with structural facades and naturallyventilated office spaces identifies the stabilisation strategy to be the predominantstrategy for all weight sets except for the environmental criteria. This is reasonableconsidering the age and type of construction of the building (1950’s type building). The second case study provides a mixed indication given that the type of buildingbelonged to internationally influences. (Independent structure with suspended glassfacades). For the third case study office building constructed after the 1980’s thedouble-skin façade strategy was considered to be more appropriate.
Thus the methodology offers sensible solutions, but it would require sufficient skill and knowledge to undertake such rigorous exercises.
2.5.7 Addi tional mult i c ri ter ion stud ies
Kaklauskas et.al, (2005) have presented a similar multivariant and multiple criteriaanalysis to address the alternative variants in building refurbishment. This methodrequires the decision maker to use best practices of similar situations and expert’smethods determines the system of criteria and to calculate the values of initialweights of qualitative criteria, which is very similar to the observations made earlier.
Some similar studies have been reported by other authors.
2.6 Normal Distr ibut ion Model or ISO factorial model
2.6.1 Methodology
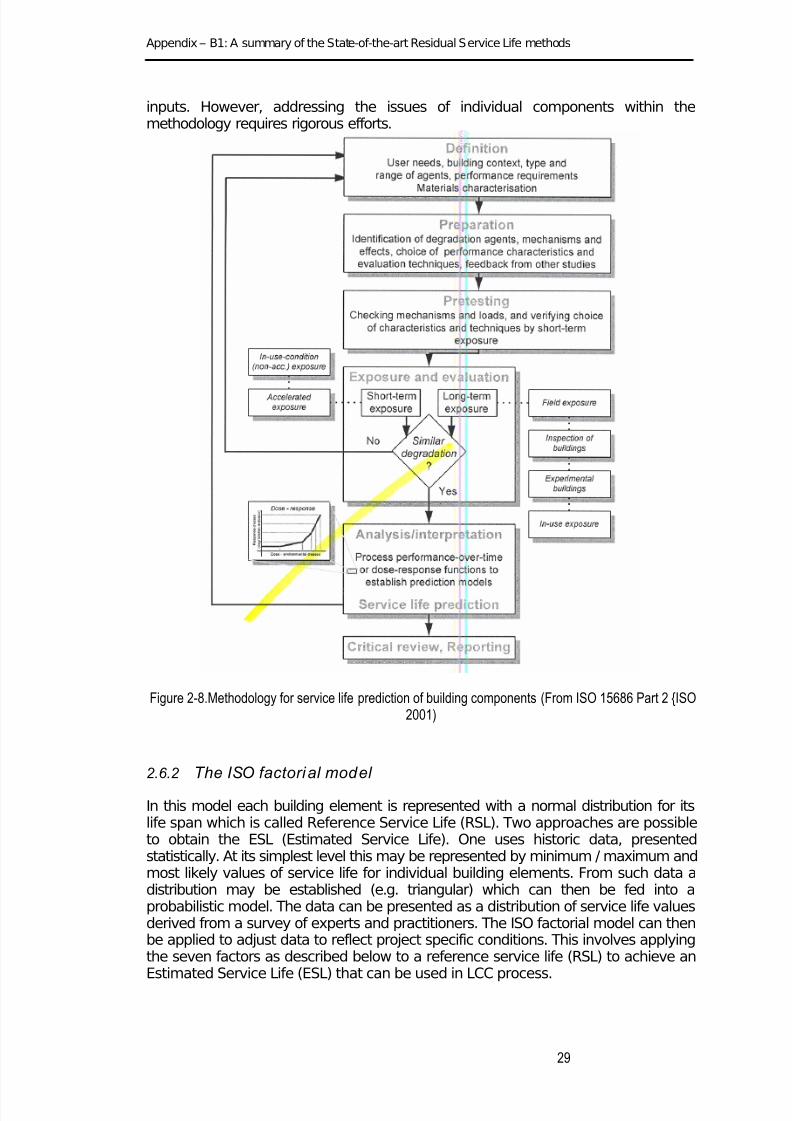
In order to address the generic issues of residual life cycle modelling, theInternational Standards Organisation ISO, recommended a methodology that hasbeen presented in Figure 2-8. (ISO 15686 Part 2, 2001). These recommendationshave been based on the RILEM recommendations, contained in the report RILEM,1989). Apparently, the methodology is generic and has resulted based on numerous
28
7/29/2019 Appendix-B1 -RSL Strand Literature Review Report
http://slidepdf.com/reader/full/appendix-b1-rsl-strand-literature-review-report 29/45
Appendix – B1: A summary of the State-of-the-art Residual Service Life methods
inputs. However, addressing the issues of individual components within themethodology requires rigorous efforts.
Figure 2-8.Methodology for service life prediction of building components (From ISO 15686 Part 2 {ISO2001)
2.6.2 The ISO factorial model
In this model each building element is represented with a normal distribution for itslife span which is called Reference Service Life (RSL). Two approaches are possibleto obtain the ESL (Estimated Service Life). One uses historic data, presentedstatistically. At its simplest level this may be represented by minimum / maximum andmost likely values of service life for individual building elements. From such data adistribution may be established (e.g. triangular) which can then be fed into aprobabilistic model. The data can be presented as a distribution of service life valuesderived from a survey of experts and practitioners. The ISO factorial model can thenbe applied to adjust data to reflect project specific conditions. This involves applyingthe seven factors as described below to a reference service life (RSL) to achieve anEstimated Service Life (ESL) that can be used in LCC process.
29

7/29/2019 Appendix-B1 -RSL Strand Literature Review Report
http://slidepdf.com/reader/full/appendix-b1-rsl-strand-literature-review-report 30/45
Appendix – B1: A summary of the State-of-the-art Residual Service Life methods
ESL= RSL x A x B x C x D x E x F x G
Where the factors are:
A - QualityB - DesignC - ExecutionD - Indoor environmentE - Outdoor environmentF - Condition in useG - Maintenance regime
The above model has been accepted internationally as a more systematic model. The method has the flexibility to integrate the inputs from other considerations suchas indoor and outdoor environment. However, the choice of the factors involved in
the equation requires considerable engineering expertise and judgement. Therefore,the method is not straight forward in application, especially the situations withinadequate data.
2.6.2.1 Evaluation of the ISO model
The ISO standard contains a chapter that describes the factor method. There is ageneral discussion as well as a discussion of the reference service life and each of the factors. Some of the discussions based on Hovde and Moser (2004) are asfollows:
The factor method is a way of bringing together the consideration of each of the variables thatis likely to affect the service life. The intention is to bring together the experience of designers, observations, intentions of managers and manufacturers assurances as well as datafrom test houses. The factor method is not intended to provide an assurance of service life; itis rather an empirical estimate based on the information. The method can be applied tocomponents and assemblies. In modelling the assemblies, interfaces should be considered.
In the discussion of the reference service life, it is pointed out that the most reliableway of establishing this is by use of the service life prediction procedure that is brieflydescribed in chapter 8 of ISO 15685 Part 1 [ISO 2000] or fully described in ISO15685 Part 2 [ISO 2000]. These procedures are based on the RILEMrecommendation [RILEM, 1989].
• Bourke and Davis (1997), maintain that the adoption of such a model shouldresult in the optimising the selection of components, making large-scale,expensive and disruptive remediation unnecessary.
• Lounis, et.al (1998), state that “Despite its practicability, this approach hasmany shortcomings. The method is not performance based, arbitrary choicesof reference lives and adjusting factors. There are uncertainties andvariabilities in the estimation of service life and therefore has limitations forimmediate application or may not be likely attainable in future.
30
7/29/2019 Appendix-B1 -RSL Strand Literature Review Report
http://slidepdf.com/reader/full/appendix-b1-rsl-strand-literature-review-report 31/45
Appendix – B1: A summary of the State-of-the-art Residual Service Life methods
The opinion of the above author the statement that “The ISO method is deterministic” is questionable. The author maintains that the model is only a fair estimate of theresidual life and the deterioration models should include uncertainty in the equation.However, in conclusion the authors state that the use of in-service performance datato develop this stochastic model overcomes the difficulties associated with
accelerated life testing and empirical factorial approaches.
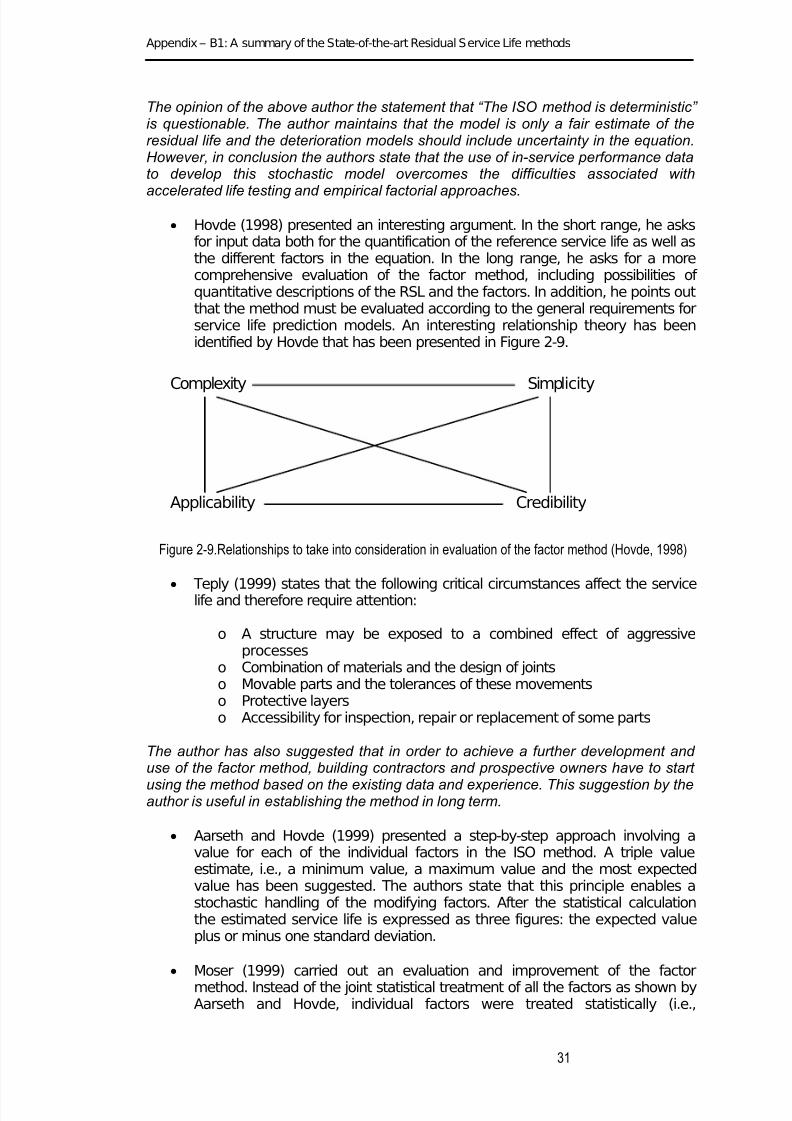
• Hovde (1998) presented an interesting argument. In the short range, he asksfor input data both for the quantification of the reference service life as well asthe different factors in the equation. In the long range, he asks for a morecomprehensive evaluation of the factor method, including possibilities of quantitative descriptions of the RSL and the factors. In addition, he points outthat the method must be evaluated according to the general requirements forservice life prediction models. An interesting relationship theory has beenidentified by Hovde that has been presented in Figure 2-9.
Complexity Simp
Applicability Credibility
licity
Figure 2-9.Relationships to take into consideration in evaluation of the factor method (Hovde, 1998)
•
Teply (1999) states that the following critical circumstances affect the servicelife and therefore require attention:
o A structure may be exposed to a combined effect of aggressiveprocesses
o Combination of materials and the design of jointso Movable parts and the tolerances of these movementso Protective layerso Accessibility for inspection, repair or replacement of some parts
The author has also suggested that in order to achieve a further development and use of the factor method, building contractors and prospective owners have to start
using the method based on the existing data and experience. This suggestion by theauthor is useful in establishing the method in long term.
• Aarseth and Hovde (1999) presented a step-by-step approach involving avalue for each of the individual factors in the ISO method. A triple valueestimate, i.e., a minimum value, a maximum value and the most expectedvalue has been suggested. The authors state that this principle enables astochastic handling of the modifying factors. After the statistical calculationthe estimated service life is expressed as three figures: the expected valueplus or minus one standard deviation.
• Moser (1999) carried out an evaluation and improvement of the factor
method. Instead of the joint statistical treatment of all the factors as shown byAarseth and Hovde, individual factors were treated statistically (i.e.,
31
7/29/2019 Appendix-B1 -RSL Strand Literature Review Report
http://slidepdf.com/reader/full/appendix-b1-rsl-strand-literature-review-report 32/45
Appendix – B1: A summary of the State-of-the-art Residual Service Life methods
deterministic, normal, lognormal or Gumbel) and by providing individualfigures for minimum, most probable and maximum value of each factor.
• Rudbeck (1999), presented a discussion of the factor method for service lifeprediction methods as:
“So before the most correct method can be determined, assisted by the field data, one can onlylook at the possible advantages and disadvantages that the methods present. From thisviewpoint, the methods based on the ISO proposal with a probabilistic approach, described byAarseth and Hovde(1999) and Moser (1999), seem to be the most usable. The requirement forinput to develop the needed functions in the two methods is the same, but they report theinput in different ways. The method suggested by Aarseth and Hovde reports the data in avery aggregated form (low, medium, and high estimate for each parameter), whereas themethod described by Moser enables the use of all available data. From a statistical point of view, the latter method therefore seems to be the most reliable”.
Rudbeck also suggests that large sample sizes may be required for a probabilistic
approach. The use of hybrid methods such as coupling the factor approach and the probabilistic approach can be considered as a viable alternative. This comment by the author is realistic as it can be noted from the discussions thus far, that theresidual life service model would need an integration of probabilistic and deterministic approaches. Interestingly, Rudbeck points out to the need for developing transitionmatrices in the Markovian model , which can then be considered as a reasonablemodel of estimating residual service life.
2.6.2.2 Further development of factor methods
Hovde and Moser (2004), has presented the following topics that might need further
research before the ISO method can be applied in normal practice.
• Determination and collection of data for the reference service life (RSL) andthe individual factors
• Development of sound engineering methods that combine the benefits of more sophisticated probabilistic methods and simple deterministic methods. Apractical approach seems to be to describe the different factors by use of statistical distributions.
• Practical use of methods in case studies of specific building materials andcomponents of specific buildings
• Application of the methods in life cycle assessment of building materials and
components and environmental evaluation methods for buildings• Application of the methods in integrated life cycle design and design for
durability of buildings
It can be understood from the discussions thus far that the ISO model does not consider the possibility of previous interventions. In addition, establishing a referenceservice life other than statistical database needs to be explored. In this connection, it is possible to compare two buildings or building elements, with very similar conditionsand circumstances to arrive at reference life. All the factors listed in the factorial method may not be relevant for elements under consideration. It thus requires acareful consideration of the priorities and requirements.
32

7/29/2019 Appendix-B1 -RSL Strand Literature Review Report
http://slidepdf.com/reader/full/appendix-b1-rsl-strand-literature-review-report 33/45
Appendix – B1: A summary of the State-of-the-art Residual Service Life methods
2.6.3 The Markov model
Literature on Markov models are too numerous to mention. The importance of thismodel is that it has a structured mathematical approach and therefore might be veryuseful for practical applications. In this model different states of the element and its
transition from one to another needs to be established. Rudbeck (1999) concludesthat “If the probability transition matrices for the Markovian model can be developedand validated, that model would be the one recommended when predicting servicelife of building components”. This conclusion suggests that significant research workis required towards adopting Markov models in residual service life estimation.
2.6.4 Other residual service life models
• Bamforth, P., (2003), presented a service life model when historic data areinadequate for modelling purposes. This has been presented in Figure.2-10. The model is based on the contention that the performance of buildingcomponents is subject to inherent variability and uncertainty and that theinitial performance will also determine the rate of deterioration. With time, thedistribution of predicted performance will drop to a level below that which isacceptable. It is thus apparent that modelling the deterioration process of elements or building is an essential component of the residual life cycleprocess. It has also been stated that the deterioration rate falls into one of sixtypical patterns. Thus converting this pattern into mathematical models couldaid in modelling the deterioration process. The rate of deterioration isparticularly important when considering the risk attached to assumptionsabout changes in service life.
Figure 2-10.Serice Life Model for elements lacking historic data
In the above model, the service life has been defined as the time to achieve amaximum acceptable probability of the serviceability limit state being reached. Apparently, failure is the minimum acceptable probability of the element being below the limiting conditions. To apply the model in practice one must have sufficient knowledge of the deterioration trends of the elements.
• CSIRO, Australia has developed a RSL model based on the emissions of agiven element in a region within Australia. The reader is advised to refer to
the above institution to acquire the developed software.
33

7/29/2019 Appendix-B1 -RSL Strand Literature Review Report
http://slidepdf.com/reader/full/appendix-b1-rsl-strand-literature-review-report 34/45
Appendix – B1: A summary of the State-of-the-art Residual Service Life methods
• Shah and Kumar (2004), proposed a refined residual service life model,presented in Figure. 2-11. this conceptual model has the flexibility toaccommodate repair scenarios that would influence the residual life. To applythis model in practice, past deterioration curves and the prediction of futuredeterioration trends is essential.
Figure 2-11.Typical deterioration trend of building element
• Hovde and Moser, K.,(2004) presented some examples of engineering designmethods which use the probability density functions for factors as opposedusing simple numerical factors. He concludes that the methods require theidentification of relevant parameters that govern the service life of all kinds of materials, as well as to set up workable mathematical relations for the
application of these methods.
34
7/29/2019 Appendix-B1 -RSL Strand Literature Review Report
http://slidepdf.com/reader/full/appendix-b1-rsl-strand-literature-review-report 35/45
Appendix – B1: A summary of the State-of-the-art Residual Service Life methods
3 EVALUATION OF THE FUNCTIONALOBSOLESCENCE OF BUILDINGS
The aforementioned discussions have highlighted the significance of physicaldegradation of buildings leading to refurbishment. The service life prediction of buildings is significantly dependent on the evaluation of the functional obsolescenceof buildings, since it might be the main reason for refurbishment/ retrofitting of abuilding. In this section of the report a review of the functional obsolescence of buildings has been presented.
The work environment of the commercial buildings is constantly evolving with theaddition of new technologies and office automation equipment, new workingmethods, re-organisation of floor plans, floor space optimisations, etc. A moderncommercial building must meet the new requirements, otherwise it will soon cease tofulfil the expected services, depreciate in value and loose its renting potential or
market value (Allehaux and Tessier, 2002).
Generally, the building becomes functionally obsolete, when the capacity of aproperty to perform the function for which it was intended decline. Functionalobsolescence may originate from several sources following changes in the market, inequipment design or process or because of poor initial design. The following criterianeed to be established for evaluation of the functional obsolescence of a building.
• Determination of the obsolescence criteria;• Definition of a suitable breakdown of building services for the application of
the obsolescence criteria, leading to the creation of a list of “building
components/objects”.• Establishment of correspondence between the criteria and the building
objects.• Establishment of diagnostic descriptions.• Establishment of upgrading description.
3.1 Obsolescence Criteria
Allehaux and Tessier, 2002, defined following requirements as obsolescence criteriabased on the author’s experience of office building designers, and on buildingowners’ expectations, accounting for the particular qualities of service sought in
modern buildings.
• Provide all the necessary technical equipment and infrastructures that arenecessary to support office activities;
• Allow for space flexibility and divisibility, and to ease the maintenance;• Meet national safety regulations.
Missing any of these requirements constitutes a possible cause of functionalobsolescence for the audited building. Accordingly, the following five objective criteriawere defined (Figure 3-1), given in the following sections
35

7/29/2019 Appendix-B1 -RSL Strand Literature Review Report
http://slidepdf.com/reader/full/appendix-b1-rsl-strand-literature-review-report 36/45
Appendix – B1: A summary of the State-of-the-art Residual Service Life methods
3.1.1 User needs
One of the main reasons for obsolescence in building is the lack of technicalequipment and installations necessary to meet user needs constitutes. For instance,in sufficient number and properly placed power, data out-lets, lighting fixtures
adapted to computer stations and toilets, etc.
3.1.2 Flexibility
In modern office buildings, the interior space partitioning and general officearrangements and layout need to be modified to adopt the changes in work activitiesor the company reorganisation.
3.1.3 Divisibility
The building owners quite often search for capacity to divide the building into
separate and independent zones. Each zone can then have autonomous installation,layout and energy metering. This makes it possible to rent part of the building toindependent business.
3.1.4 Maintainability
Maintenance cost is a major concern for the modern office buildings. Hence thecapacity to enable easy and cheap maintenance of the premises is preferable. Forinstance the pipe network system and the equipment layout in a plant room could bestudied in order to ease the implementation of necessary repair work.
3.1.5 Compliance with regulations
The building environment, technical equipment and various installations shouldcomply with national safety regulations. From a strict point of view this criterion maynot directly consider part of functional obsolescence. Nevertheless, it may prove toalso check this criterion during an audit of the building installation. Owners arealways interested to know whether the technical installations of their building are incompliance with up-to-date regulations or not, even if there is usually no obligation toupgrade. The old installations in major retrofitting actions are decided following theaudit, corrective actions will have to be done on the modified installations. In such acase, it is important to know the accurate extent of the required work.
36

7/29/2019 Appendix-B1 -RSL Strand Literature Review Report
http://slidepdf.com/reader/full/appendix-b1-rsl-strand-literature-review-report 37/45
Appendix – B1: A summary of the State-of-the-art Residual Service Life methods
Functional Obsolescenc
User need
DivisibilityMaintainability
Flexibility
Compliance withregulations
Figure 3-1: Functional obsolescence criteria
3.2 Breakdown of Building
In order to complete the evaluation of functional obsolescence, the buildingcomponent and the services in particular need to be broken down. The buildingcomponents are examined in a systematic way against the obsolescence criteria. This includes the evaluation of existing building installations as well as to record themissing ones. Actually, the absence of certain equipment, installations and buildingcomponents can be a cause of obsolescence. An exhaustive list of technicalequipment and installations in a modern building may be grouped as follows:
• Exhaustive;• Compatible with the evaluation needs of the other areas such as degradation,
energy and indoor quality and;• Sufficiently detailed to obtain a realistic cost estimate of the necessary
renovation works.
The retained list, capable of supporting functional obsolescence evaluation need tobe organised in a logical manner that covers the main categories of technicalinstallations, including,
• HVAC;•
Plumbing;• Fire protection;• High voltage Low currents;• Vertical transportation systems and;• Building cleaning system.
The entire building can be divided up to 70 objects, each one belonging to differenttypes of building construction and services as details in previous sections. The onesthat pertain to building services and to be checked regarding functional obsolescenceare 44 objects, each one may be included several times. For instance, one buildingobject is the “heat production plants” that includes six different types as follows:
• Fuel boiler;• Gas boiler;
37
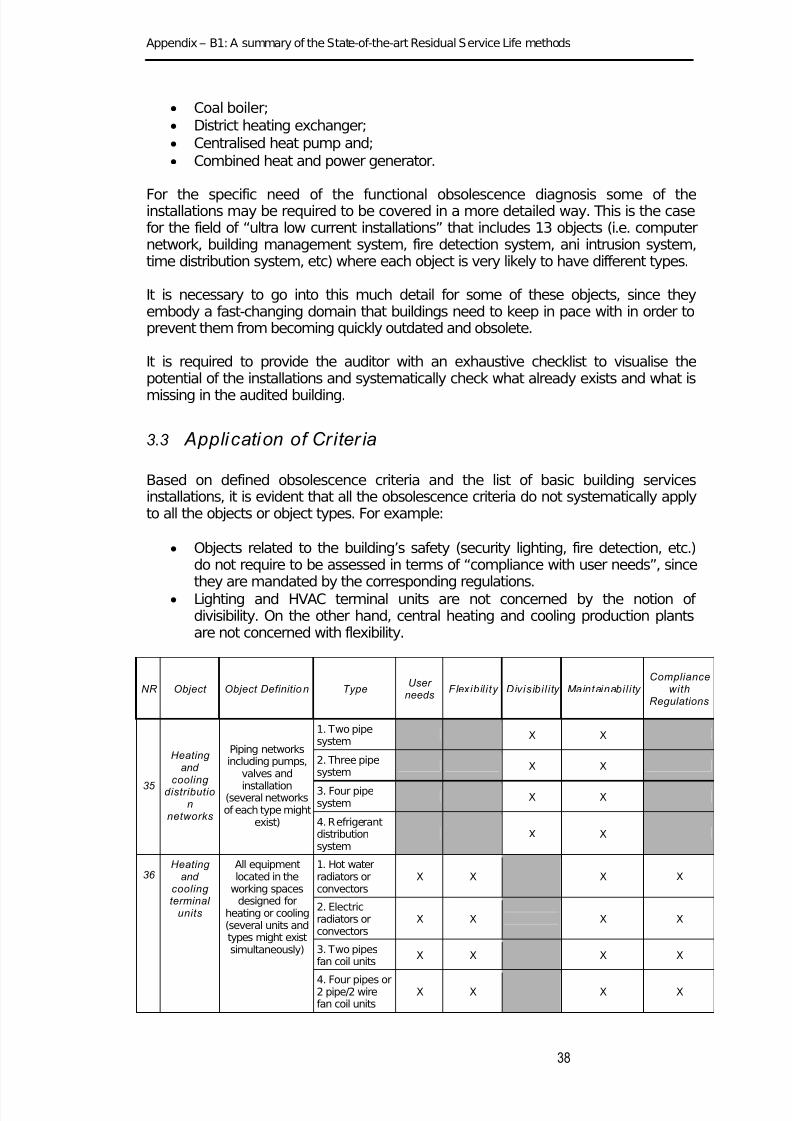
7/29/2019 Appendix-B1 -RSL Strand Literature Review Report
http://slidepdf.com/reader/full/appendix-b1-rsl-strand-literature-review-report 38/45
Appendix – B1: A summary of the State-of-the-art Residual Service Life methods
• Coal boiler;• District heating exchanger;• Centralised heat pump and;• Combined heat and power generator.
For the specific need of the functional obsolescence diagnosis some of theinstallations may be required to be covered in a more detailed way. This is the casefor the field of “ultra low current installations” that includes 13 objects (i.e. computernetwork, building management system, fire detection system, ani intrusion system,time distribution system, etc) where each object is very likely to have different types.
It is necessary to go into this much detail for some of these objects, since theyembody a fast-changing domain that buildings need to keep in pace with in order toprevent them from becoming quickly outdated and obsolete.
It is required to provide the auditor with an exhaustive checklist to visualise thepotential of the installations and systematically check what already exists and what is
missing in the audited building.
3.3 Application of Criter ia
Based on defined obsolescence criteria and the list of basic building servicesinstallations, it is evident that all the obsolescence criteria do not systematically applyto all the objects or object types. For example:
• Objects related to the building’s safety (security lighting, fire detection, etc.)do not require to be assessed in terms of “compliance with user needs”, since
they are mandated by the corresponding regulations.• Lighting and HVAC terminal units are not concerned by the notion of divisibility. On the other hand, central heating and cooling production plantsare not concerned with flexibility.
NR Object Object Definition TypeUser
needsFlexibility Divisibility Maintainability
Compliancewith
Regulations
1. Two pipesystem
X X
2. Three pipesystem
X X
3. Four pipesystem
X X35
Heating and
cooling distributio
nnetworks
Piping networksincluding pumps,
valves and
installation(several networksof each type might
exist) 4. Refrigerantdistributionsystem
X X
1. Hot waterradiators orconvectors
X X X X
2. Electricradiators orconvectors
X X X X
3. Two pipesfan coil units
X X X X
36 Heating
and cooling terminal
units
All equipmentlocated in the
working spacesdesigned for
heating or cooling(several units andtypes might existsimultaneously)
4. Four pipes or2 pipe/2 wirefan coil units
X X X X
38

7/29/2019 Appendix-B1 -RSL Strand Literature Review Report
http://slidepdf.com/reader/full/appendix-b1-rsl-strand-literature-review-report 39/45
Appendix – B1: A summary of the State-of-the-art Residual Service Life methods
5. Inductionunits
X X X X
6. Heating orcooling floor
X X X X
7. Heating orcooling ceiling
X X X X
8. individualheat pumps onwater loop
X X X X
9. Window units X X X X
10. Spilt system X X X X
11. Airconditioningcabinets
X X X X
12. VRV system X X X X
Table 3-1: Representative section of the building objects and obsolescence criteria matrix
All the building objects can be accordingly listed against obsolescence criteria in amatrix, defining the cases to be examined. Table 3-1, lists a representative section of this matrix that refers to two objects (“heating and cooling distribution networks” and“heating and cooling terminal units”) and their corresponding types. The matrix listsall the obsolescence criteria that apply (marked with an X) and those do not apply.
3.4 Diagnosis codes and descriptions
For each obsolescence criterion, the examined type of an object can be awarded one
of three descriptions codes.
Code A GoodCode B MediumCode C Poor or not sufficient
This aims to establish three descriptions for each type of an object and eachobsolescence criterion, each descriptions corresponding to one of three ratings (A, Bor C). These descriptions can be reviewed to assess a specific type and award it anA, B, or C code. Some representative examples for the supporting diagnostic text aregiven below.
• Diagnosis for obsolescence criterion: “compliance with user needs”.o Object : telephone (private auto branch exchange - PABX)
Code A: up-to-date PABX technology (digital type, possibility tobe connected to a network, automatic router). Sufficientnumber of lines for current needs and for the near future.
Code B: a few years old PABX technology, but still operational.Sufficient number of lines for current needs.
Code C: out-of-date PABX technology. Insufficient number of lines.
Similar criterion descriptions for flexibility and divisibility can be found from the abovereference. In some special cases, this three letter code may not be applicable. The
authors have considered the example of an UPS (Uninterrupted Power Supply)under the obsolescence criterion “Compliance with user needs”. In this case Code A
39
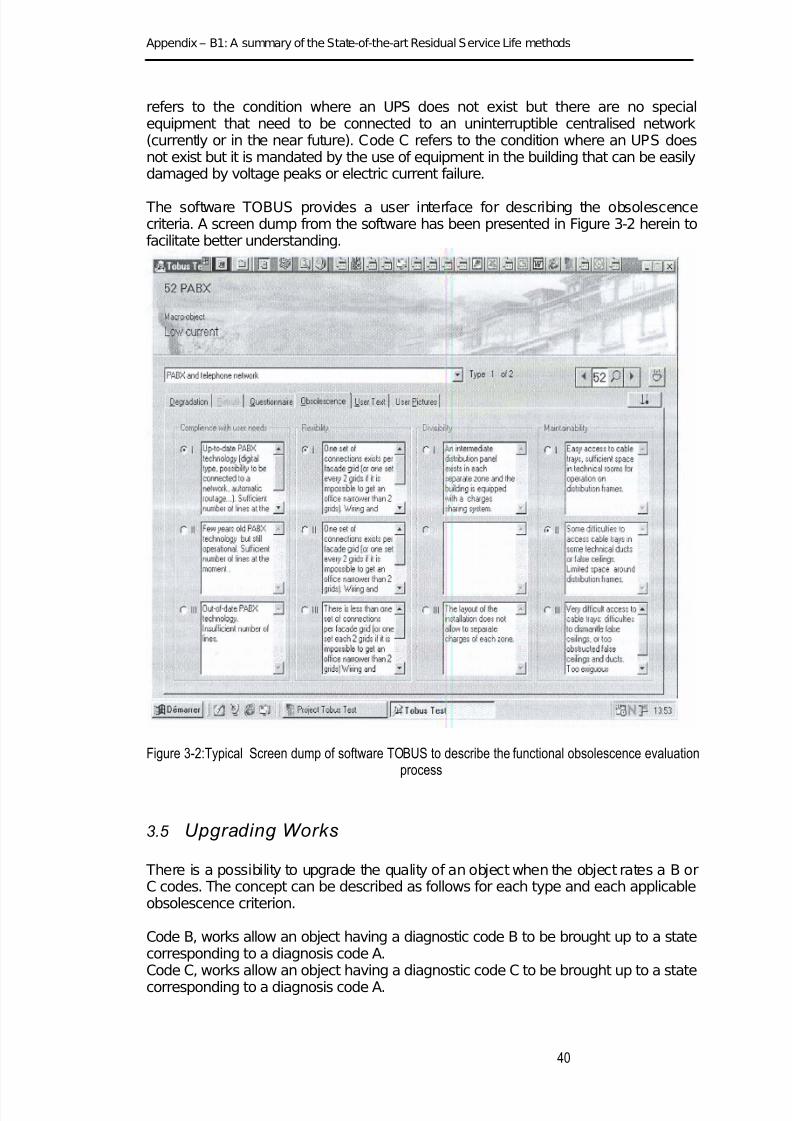
7/29/2019 Appendix-B1 -RSL Strand Literature Review Report
http://slidepdf.com/reader/full/appendix-b1-rsl-strand-literature-review-report 40/45
Appendix – B1: A summary of the State-of-the-art Residual Service Life methods
refers to the condition where an UPS does not exist but there are no specialequipment that need to be connected to an uninterruptible centralised network(currently or in the near future). Code C refers to the condition where an UPS doesnot exist but it is mandated by the use of equipment in the building that can be easilydamaged by voltage peaks or electric current failure.
The software TOBUS provides a user interface for describing the obsolescencecriteria. A screen dump from the software has been presented in Figure 3-2 herein tofacilitate better understanding.
Figure 3-2:Typical Screen dump of software TOBUS to describe the functional obsolescence evaluationprocess
3.5 Upgrading Works
There is a possibility to upgrade the quality of an object when the object rates a B orC codes. The concept can be described as follows for each type and each applicableobsolescence criterion.
Code B, works allow an object having a diagnostic code B to be brought up to a statecorresponding to a diagnosis code A.Code C, works allow an object having a diagnostic code C to be brought up to a state
corresponding to a diagnosis code A.
40

7/29/2019 Appendix-B1 -RSL Strand Literature Review Report
http://slidepdf.com/reader/full/appendix-b1-rsl-strand-literature-review-report 41/45
Appendix – B1: A summary of the State-of-the-art Residual Service Life methods
The following were observed during the process to define the work descriptionsassociated with functional obsolescence (Allehaux and Tessier, 2002).
Considering the criteria of “users need”, “flexibility” and “divisibility”, in 90% of casesthe works required involved the creation of a new installation or the complete
replacement of the existing one.Regarding the criteria of “maintainability”, the owners of the building rarely decide toreplace an installation solely on the basis of lack of maintainability.
There is no obligation to carry out the works when an object is diagnosed asfunctionally obsolescent. This is very different from the logic of how the buildingdegradation codes and related works are handled. However, In the case of functionalobsolescence and its criteria of divisibility and flexibility, even a rate C code for anobject may not result in any works that have to be undertaken.
3.6 Review of the model
Despite the appropriateness of the above methodology, it has to be understood that the criteria chosen for the code descriptions have been based on author’sexperience. This highlights the need for the user to have a sufficient understanding of the building obsolescence process. As such, the method can be adopted by expertsor expert guidance would be needed during the process of evaluation. The coding descriptions are highly influenced by the user expectation, national codes etc.,Nonetheless the approach to the problem is systematic.
4 Influence of Residual Service Life models on Life
cycle costs of a building
The life cycle costing (LCC) is usually a prediction of annual costs and a cost profileover the life of an asset. This is highly dependent upon the performance of buildings,its components and other unforeseen costs. As noted earlier, modelling the buildingdeterioration and functional obsolescence are associated with significantuncertainties. Therefore an understanding of the inaccuracies arising out of themodel predictions is important towards successfully managing the risks in life cyclemanagement.
Bamforth, P.,(2004) presented a probabilistic approach to wards modelling the life
cycle costs. He suggested a cost breakdown tree that has been presented in Figure4-1. Importantly, he suggests that in the design stage of cost estimation, 80% of thecost is associated with 20% of tis components. Therefore by focussing on the 20%cost, uncertainties on the most expensive items can be reduced. In here, the residuallife cycle models on building deterioration and functional obsolescence play animportant role in the decision making process.
41
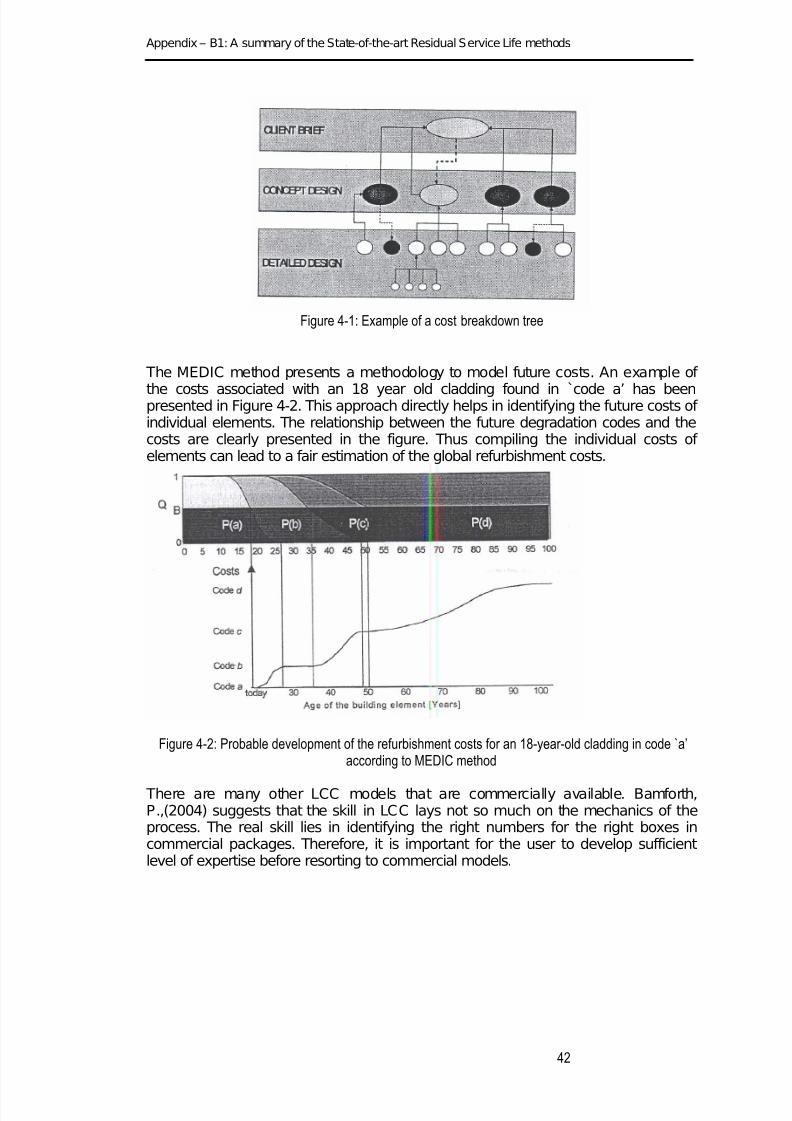
7/29/2019 Appendix-B1 -RSL Strand Literature Review Report
http://slidepdf.com/reader/full/appendix-b1-rsl-strand-literature-review-report 42/45
Appendix – B1: A summary of the State-of-the-art Residual Service Life methods
Figure 4-1: Example of a cost breakdown tree
The MEDIC method presents a methodology to model future costs. An example of
the costs associated with an 18 year old cladding found in `code a’ has beenpresented in Figure 4-2. This approach directly helps in identifying the future costs of individual elements. The relationship between the future degradation codes and thecosts are clearly presented in the figure. Thus compiling the individual costs of elements can lead to a fair estimation of the global refurbishment costs.
Figure 4-2: Probable development of the refurbishment costs for an 18-year-old cladding in code `a’according to MEDIC method
There are many other LCC models that are commercially available. Bamforth,P.,(2004) suggests that the skill in LCC lays not so much on the mechanics of theprocess. The real skill lies in identifying the right numbers for the right boxes incommercial packages. Therefore, it is important for the user to develop sufficientlevel of expertise before resorting to commercial models.
42

7/29/2019 Appendix-B1 -RSL Strand Literature Review Report
http://slidepdf.com/reader/full/appendix-b1-rsl-strand-literature-review-report 43/45
Appendix – B1: A summary of the State-of-the-art Residual Service Life methods
5 Review and Closing remarks
Based on the above discussions, it can be concluded that the models available forestimating Residual Service Life fall into two categories:
• Models based on Building degradation aspects• Models based on Building functional aspects
Models such as EPIQR and MEDIC are based on the degradation aspects, whilst theISO model is based on functional aspects or service aspects of a building. There arenumber of issues to be considered when applying these models in practice.Modelling building degradation requires the information or knowledge on past andfuture levels of building degradation. Establishing probability curves in thisconnection requires a reasonable database. In addition, the criteria employed forascertaining the existing conditions are more or less based on experience and judgement. Therefore, users intending to adopt this process must have sufficientbuilding evaluation skills or may have to resort to experts. Most of the modelsdeveloped are outside Australia and hence their adaptation requires some form of verification.
The ISO model has the advantage of universal acceptance. However, most of thefactors adopted in the model can be handled only by experts. Review shows thatextensive work is required in arriving at some conclusions from this model.Consequently, these models lack direct application by end users. Clearly furtherresearch is required in adopting these models for application.
The costs associated with the life time of a building are significantly dependent uponthe refurb strategies in the design stage of the project. The residual service life
models present the user with probable costs associated with refurb scenarios in theinitial design phase. These models are dependent on the physical degradation stateof the building and their functional obsolescence. This involves a complex integrationof deterministic and probabilistic approaches.
These models do not have the facility to incorporate structural strengtheningtechniques. The implications of decision making and intervention on residual servicelife have not been clearly outlined. In addition quantification of risks needs to beundertaken.
In addition to the models described herein, many other countries like UnitedKingdom, J apan and United States are moving towards developing best practice
guidelines and procedures in asset management practice. From an Australianperspective it appears that sophisticated tools and guidelines for estimating residualservice life would need to be developed.
43

7/29/2019 Appendix-B1 -RSL Strand Literature Review Report
http://slidepdf.com/reader/full/appendix-b1-rsl-strand-literature-review-report 44/45
Appendix – B1: A summary of the State-of-the-art Residual Service Life methods
6 REFERENCES
Aarseth, L.I., and Hovde, P.J ., (1999). “A stochastic approach to the factor method forestimating the service life”. 8th International conference on durability of building
materials and components, Vancover, Canada, 30 May – J une 3.Allehaux, D. and Tessier, P . (2002), “Evaluation of the functional obosolenscene of building
services in European office buildings”Journal of Energy and buildings, 34, pp.127-133Ballaras, C.A., Dascalaki, E., Droutsa, P., and Kontoyiannidis, S., (2001), “EPIQR-TOBUS-
XENIOS-INVESTIMMO European methodologies & software tools for buildingrefurbishment, assessment of energy savings and IEQ” Energy and Buildings, 2002.
Bamforth, P., (2003) “Probabalistic approach for predictiong life cycle costs and performanceof buildings and civil infrastructures”. Proceedings of the 2
nd International Symposium
on Integrated Life-time Engineering of Buildings and Infrastructures, Kuopio, Finland,pp.553-558
Bourke, K., and Davies, H., (1997). “Factors affecting service life predictions of buildings: adiscussion paper”, Laboratory report, Building Research Establishment, Garston,Watford, UK.
Caccavelli D., Genre, J .-L. (2000), “Diagnosis of the degradation state of the building and costevaluation of induced refurbishment works” Journal of Energy and buildings, 31,pp.159-165
Flourentzou, F., Brandt, E., Wetzel, C. (2000), “MEDIC-a method for predicting residualservice life and refurbishment investment budgets”Journal of Energy and buildings, 31,pp.167-170
Flourentzos, F., Droutsa, K., and Wittchen, K.B., (2000). “EPIQR software”, Energy andBuildings, Vol.31, pp. 129-136.
Flourentzos, F., Genre, J .L., and Roulet, C.A., (2002). “TOBUS software – an interactivedecision aid tool for building retrofit studies”, Energy and Buildings, Vol.34, pp. 193-202.
Flourentzou, F., Roulet, C.-A. (2002), “Elaboration of retrofit scenarios” Journal of Energy and buildings, 34, pp.185-192
Hovde, P.J ., (1998). “Evaluation of the factor method to estimate the service life of buildingcomponents”, Materials and technologies for sustainable construction, CIB worldbuilding congress, 1998, Gavle, Sweden, 7-12 J une.
Hovde, P.J ., and Moser, K., (2004). “Performance based methods for service life prediction”State of the art reports, CIB Report: Publication 294, ISBN: 90-6363-040-9,CIB, NTNUand EMPA, 2004.
IIMM, (2002), “International Infrastructure Management Manual – Version 2.0”, Australia,2002
Investimmo, (2001), “A decision-making tool for long-term efficient investment strategies inhousing maintenance and refurbishment”, Newsletter No.1, September 2001.
ISO 15686 Part 1, (2000). “Building and constructed assets – Service Life Planning – Part -1:General principles”. International Organisation for Standardisation, Geneve,Switzerland.
ISO 15686 Part 2, (2001). “Building and construction assets – Service Life Planning – Part -2:Service Life prediction procedures”. International Organisation for Standardisation,Geneve, Switzerland.
J .-L. Genre, MEBI - Me’thode d’Estimation de Bugents d’Investissements, LESO-PB, EPFL,Lausanne, Switzerland, 1995
Kaklauskas, A., Zavadskas, E.K., and Raslanas, S., (2005). “Multivariant design and multiplecriteria analysis of building refurbishments”, Energy and Buildings, Vol.37, pp. 367-372.
Lounis, Z., Lacasse, M.A., Vanier, D.J ., and Kyle, B.R., (1998). “Towards standardisation of service life prediction of roofing membranes”. Roofing research and standardsdevelopment: 4th volume, ASTM STP 1349, PA, USA.
Moser, K., (1999). “Towards the practical evaluation of serice life – illustrative application of the probabilistic approach”. 8th International conference on durability of buildingmaterials and components, Vancouver, Canada, 30 May – 3 J une.
Rey, E., (2004). “Office building retrofitting strategies: multi criteria approach of anarchitectural and technical issue”, Energy and Buildings, Vol 36, pp. 367-372.
44

7/29/2019 Appendix-B1 -RSL Strand Literature Review Report
http://slidepdf.com/reader/full/appendix-b1-rsl-strand-literature-review-report 45/45
Appendix – B1: A summary of the State-of-the-art Residual Service Life methods
RILEM (1989). “Systematic methodology for service life prediction of building materials andcomponents”. RILEM recommendation, Materials and Structures, vol.22, pp. 385-392.
Rudbeck, C., (1999). “Methods for designing building envelope components prepared forrepair and maintenance”. PhD thesis. Report R-035, Department of Buildings andEnergy, technical University of Denmark, Lyngby, Denmark.
Teply, B.,(1999). “Service life prediction of structures – Factor method”, Stavebni Obzor
(Structural Horizon), Vol 8. pp. 137-139 (In Czech).Wittchen, K.B., and Aggerholm, S., (2000). “Calculation of building heating demand in
EPIQR”, Energy and Buildings, Vol.31, pp. 137-141.