appendix b online appendix table b1
TRANSCRIPT
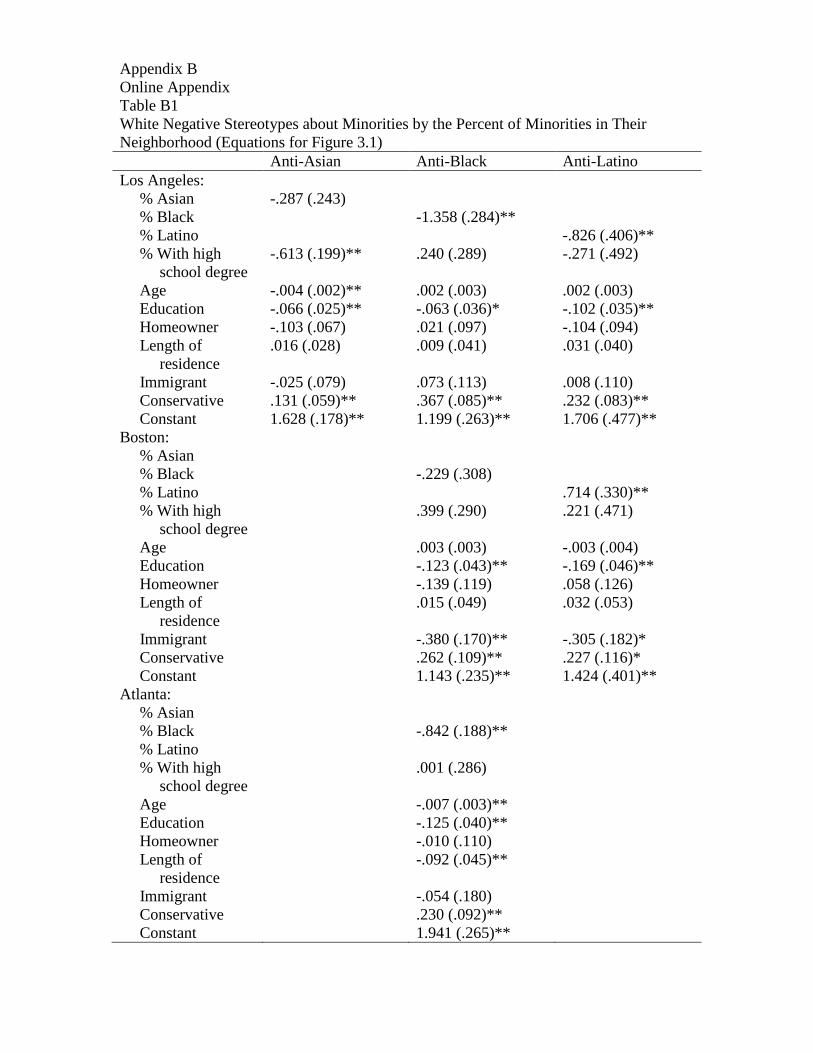
Appendix B
Online Appendix
Table B1
White Negative Stereotypes about Minorities by the Percent of Minorities in Their
Neighborhood (Equations for Figure 3.1)
Anti-Asian Anti-Black Anti-Latino
Los Angeles:
% Asian -.287 (.243)
% Black -1.358 (.284)**
% Latino -.826 (.406)**
% With high
school degree
-.613 (.199)** .240 (.289) -.271 (.492)
Age -.004 (.002)** .002 (.003) .002 (.003)
Education -.066 (.025)** -.063 (.036)* -.102 (.035)**
Homeowner -.103 (.067) .021 (.097) -.104 (.094)
Length of
residence
.016 (.028) .009 (.041) .031 (.040)
Immigrant -.025 (.079) .073 (.113) .008 (.110)
Conservative .131 (.059)** .367 (.085)** .232 (.083)**
Constant 1.628 (.178)** 1.199 (.263)** 1.706 (.477)**
Boston:
% Asian
% Black -.229 (.308)
% Latino .714 (.330)**
% With high
school degree
.399 (.290) .221 (.471)
Age .003 (.003) -.003 (.004)
Education -.123 (.043)** -.169 (.046)**
Homeowner -.139 (.119) .058 (.126)
Length of
residence
.015 (.049) .032 (.053)
Immigrant -.380 (.170)** -.305 (.182)*
Conservative .262 (.109)** .227 (.116)*
Constant 1.143 (.235)** 1.424 (.401)**
Atlanta:
% Asian
% Black -.842 (.188)**
% Latino
% With high
school degree
.001 (.286)
Age -.007 (.003)**
Education -.125 (.040)**
Homeowner -.010 (.110)
Length of
residence
-.092 (.045)**
Immigrant -.054 (.180)
Conservative .230 (.092)**
Constant 1.941 (.265)**

Detroit:
% Asian
% Black -.327 (.154)**
% Latino
% With high
school degree
-.225 (.311)
Age .003 (.002)
Education -.141 (.032)**
Homeowner .082 (.082)
Length of
residence
-.021 (.033)
Immigrant
Conservative .195 (.074)**
Constant 1.131 (.265)**
Source: Multi-City Study of Urban Inequality.
**p<.01.
*p<.05.

Table B2
Predicted Scores on Whites’ Perception of Zero-Sum Competition by Racial
Environment and Individual Characteristics
Zero Sum
with Asians
Zero Sum
with Blacks
Zero Sum
with Latinos
Zero-Sum
Immigrant
Threat
Contextual:
% White in
neighborhood
.493 (.201)** .049 (.231) -.064 (.185) .540 (.173)**
% With high
school degree
-.373 (.175)** -.458 (.153)**
-.288 (.171)*
-.381 (.160)**
Atlanta × %
white
.817 (.261)** .238 (.232)
Atlanta -.363 (.169)** -.269 (.162)*
Boston × % white -.439 (.248)* -.114 (.311)
.251 (.231)
-.628 (.217)**
Boston .232 (.164)
-.010 (.206) -.149 (.153) .280 (.144)
Detroit × % white -.399 (.213)* .079 (.254) .128 (.197)
-.435 (.220)**
Detroit -.617 (.141)** -.792 (.170)** -.874 (.134)** -1.11 (.164)**
Individual:
Age .002 (.001)* .003 (.001)** .001 (.001) .002 (.001)*
Education -.006 (.017)** -.112 (.018)** -.053 (.017)** -.094 (.018)**
Homeowner -.003 (.047) -.062 (.047) .022 (.045) -.093 (.048)*
Length of
residence
-.019 (.019) -.016 (.019) .008 (.018) .014 (.020)
Immigrant .004 (.096) -.060 (.092) .044 (.088) -.433 (.075)**
Conservative .040 (.042) .046 (.042) .097 (.040)** .137 (.042)**
Constant .822 (.150)** 1.108 (.162)** 1.023 (.146)** 1.349 (.138)**
R2 .261 .230 .257 .246
N 1260 1933 1285 2905
Source: Multi-City Study of Urban Inequality.
**p<.01.
*p<.05.

Table B3
Negative Attitudes Toward Asians, Latinos, and Whites among Blacks by the Percent of
the Out-Group in Their Neighborhood
Anti-Asian Anti-Latino Anti-White
Los Angeles (n =
1116):
% Asian in
neighborhood
-1.603 (.323)**
% Latino in
neighborhood
-.135 (.263)
% White in
neighborhood
-.143 (.214)
% With high
school degree
.122 (.174) -.284 (.301) -.236 (.196)
Age -.006 (.002)** .000 (.002) -.005 (.002)**
Education .018 (.032) -.042 (.039) .001 (.032)
Homeowner .119 (.075) -.006 (.091) .035 (.076)
Length of
residence
-.009 (.027) -.034 (.033) .000 (.028)
Immigrant .095 (.142) -.025 (.173) .043 (.145)
Conservative -.138 (.063)** .083 (.076) -.067 (.064)
Constant 1.654 (.136)** 1.783 (.262)** 1.774 (.143)**
R2 .038 .005 .009
Boston (n = 462):
% Latino in
neighborhood
.222 (.351)
% White in
neighborhood
-.340 (.250)
% With high
school degree
.557 (.447) .209 (.351)
Age -.010 (.004)** -.005 (.004)
Education -.185 (.051)** .005 (.048)
Homeowner -.245 (.134)* -.113 (.124)
Length of
residence
.043 (.046) -.056 (.043)
Immigrant .174 (.116) -.112 (.107)
Conservative .268 (.114)** .284 (.106)**
Constant 1.470 (.374)** 1.422 (.269)**
R2 .071 .037
Atlanta (n = 808):
% White in
neighborhood
-.508 (.154)**
% With high
school degree
.173 (.204)
Age -.009 (.002)**
Education -.030 (.037)
Homeowner .118 (.088)
Length of .006 (.034)

residence
Immigrant .275 (.278)
Conservative .087 (.089)
Constant 1.625 (.167)**
R2 .041
Source: Multi-City Study of Urban Inequality.
**p<.01.
*p<.05.
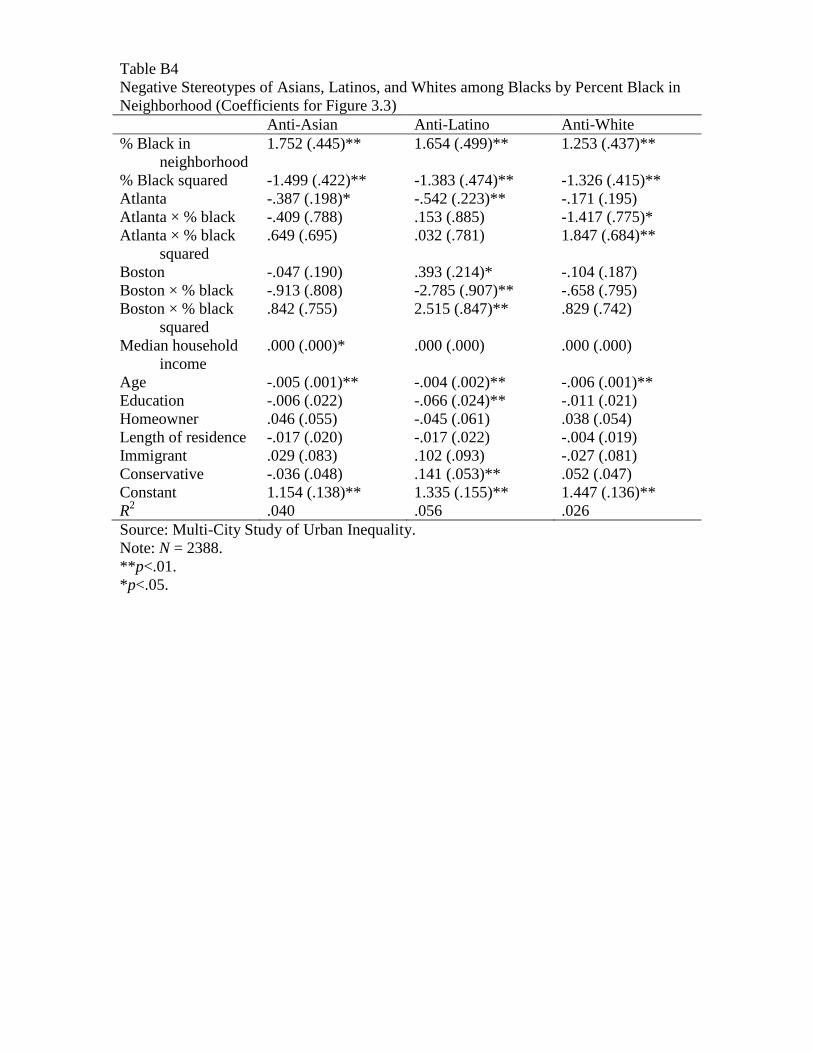
Table B4
Negative Stereotypes of Asians, Latinos, and Whites among Blacks by Percent Black in
Neighborhood (Coefficients for Figure 3.3)
Anti-Asian Anti-Latino Anti-White
% Black in
neighborhood
1.752 (.445)** 1.654 (.499)** 1.253 (.437)**
% Black squared -1.499 (.422)** -1.383 (.474)** -1.326 (.415)**
Atlanta -.387 (.198)* -.542 (.223)** -.171 (.195)
Atlanta × % black -.409 (.788) .153 (.885) -1.417 (.775)*
Atlanta × % black
squared
.649 (.695) .032 (.781) 1.847 (.684)**
Boston -.047 (.190) .393 (.214)* -.104 (.187)
Boston × % black -.913 (.808) -2.785 (.907)** -.658 (.795)
Boston × % black
squared
.842 (.755) 2.515 (.847)** .829 (.742)
Median household
income
.000 (.000)* .000 (.000) .000 (.000)
Age -.005 (.001)** -.004 (.002)** -.006 (.001)**
Education -.006 (.022) -.066 (.024)** -.011 (.021)
Homeowner .046 (.055) -.045 (.061) .038 (.054)
Length of residence -.017 (.020) -.017 (.022) -.004 (.019)
Immigrant .029 (.083) .102 (.093) -.027 (.081)
Conservative -.036 (.048) .141 (.053)** .052 (.047)
Constant 1.154 (.138)** 1.335 (.155)** 1.447 (.136)**
R2 .040 .056 .026
Source: Multi-City Study of Urban Inequality.
Note: N = 2388.
**p<.01.
*p<.05.

Table B5
Feelings of Zero-Sum Competition and Threats from Immigration among Blacks by
Percent Black in Neighborhood
Zero-Sum Asian Zero-Sum Latino Zero-Sum Immigrant
Threat
% Black in
neighborhood
2.184 (.981)** 1.834 (.937)* 2.855 (.608)**
% Black squared -1.356 (.923) -.987 (.901) -2.050 (.578)**
Atlanta .281 (.271)
Atlanta × % black -3.682 (1.078)**
Atlanta × % black
squared
3.121 (.951)**
Boston -.616 (.443) -.491 (.378) -.087 (.261)
Boston × % black -.139 (1.796) -1.596 (1.685) -1.114 (1.105)
Boston × % black
squared
-.454 (1.640 1.372 (1.607) .526 (1.033)
Median household
income
.000 (.000)* .000 (.000)** .000 (.000)
Age -.001 (.004) .006 (.004) .003 (.002)
Education -.127 (.058)** -.159 (.058)** -.041 (.030)
Homeowner .005 (.146) -.037 (.146) .196 (.075)**
Length of residence .022 (.051) .010 (.050) -.024 (.027)
Immigrant -.064 (.176) -.066 (.195) -.369 (.113)**
Conservative .162 (.119) .160 (.121) .112 (.065)*
Constant 1.697 (.330)** 1.397 (.321)** .658 (.189)**
R2 .108 .127 .071
N 808 770 2388
Source: Multi-City Study of Urban Inequality.
**p<.01.
*p<.05.

Table B6
Negative Stereotypes among Latinos by Percent Out-Group in Neighborhood
Anti-Asian Anti-Black Anti-White
% Asian -.980 (.253)**
% Black -.361 (.198)*
% White -.487 (.184)**
Boston -.189 (.062)** -.682 (.080)** .044 (.078)
Boston × Asian 1.167 (.712)
Boston × black .670 (.275)**
Boston × white .313 (.237)
Median household
income
.000 (.000) .000 (.000) .000 (.000)
Age -.001 (.002) -.008 (.002)** -.002 (.002)
Education .011 (.028) -.047 (.035) -.009 (.028)
Homeowner -.126 (.071)* .030 (.088) -.141 (.069)**
Length of residence .030 (.024) .008 (.030) 032 (.024)
Immigrant 030 (.080) .136 (.098) .014 (.078)
Conservative .054 (.050) .105 (.062)* -.023 (.049)
Citizen .010 (.064) -.213 (.078)** -.042 (.062)
Constant 1.211 (.119)** 2.441 (.152)** 1.295 (.116)**
R2 .014 .091 .012
Source: Multi-City Study of Urban Inequality.
Note: N = 1691.
**p<.01.
*p<.05.
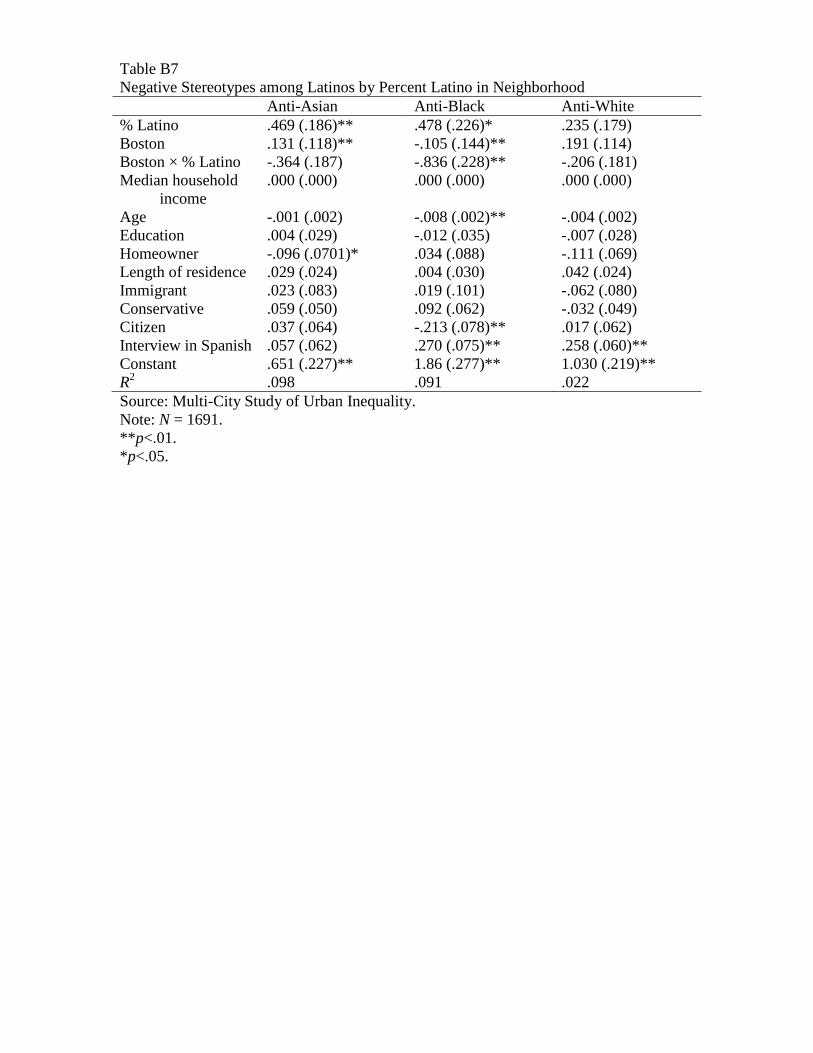
Table B7
Negative Stereotypes among Latinos by Percent Latino in Neighborhood
Anti-Asian Anti-Black Anti-White
% Latino .469 (.186)** .478 (.226)* .235 (.179)
Boston .131 (.118)** -.105 (.144)** .191 (.114)
Boston × % Latino -.364 (.187) -.836 (.228)** -.206 (.181)
Median household
income
.000 (.000) .000 (.000) .000 (.000)
Age -.001 (.002) -.008 (.002)** -.004 (.002)
Education .004 (.029) -.012 (.035) -.007 (.028)
Homeowner -.096 (.0701)* .034 (.088) -.111 (.069)
Length of residence .029 (.024) .004 (.030) .042 (.024)
Immigrant .023 (.083) .019 (.101) -.062 (.080)
Conservative .059 (.050) .092 (.062) -.032 (.049)
Citizen .037 (.064) -.213 (.078)** .017 (.062)
Interview in Spanish .057 (.062) .270 (.075)** .258 (.060)**
Constant .651 (.227)** 1.86 (.277)** 1.030 (.219)**
R2 .098 .091 .022
Source: Multi-City Study of Urban Inequality.
Note: N = 1691.
**p<.01.
*p<.05.

Table B8
Perceptions of Linked Fate, Discrimination, and Zero-Sum Competition among Latinos
by Percent Latino in Neighborhood
Linked Fate Zero Sum with
Blacks
Zero Sum with
Asians
Latino Job
Discrimination
% Latino .137 (.107) .114 (.314) .086 (.330) .171 (.111)
Boston .012 (.096) -.253 (.295) .096 (.283) -.013 (.098)
Boston × %
Latino
-.091 (.149) .008 (.450) -.235 (.449) -.222 (.153)
Median
household
income
.000 (.000) .000 (.000) .000 (.000) .000 (.000)
Interview in
Spanish
.071 (.050) .082 (.144) .072 (.157) .312 (.052)**
Linked fate .282 (.086)** .271 (.095)**
Age .001 (.002) .006 (.005) .001 (.005) -.005 (.002)**
Education .006 (.023) -.179 (.070)** -.126 (.066)* .002 (.024)
Homeowner -.155 (.058)** -.053 (.176) .040 (.173) -.038 (.059)
Length of
residence
.032 (.020) -.027 (.058) .036 (.060) .021 (.021)
Immigrant -.022 (.071) .348 (.208)* -.451 (.218)** .156 (.070)**
Conservative .005 (.040) .122 (.119) -.035 (.124) -.078 (.042)*
Citizen -.089 (.052)* .145 (.155) -.266 (.160)* .014 (.055)
Constant 2.199 (.132)** .019 (.441) 1.238 (.446)** 2.179 (.135)**
R2 .024 .069 .039 .067
N 1109 545 563 1678
Source: Multi-City Study of Urban Inequality.
**p<.01.
*p<.05.
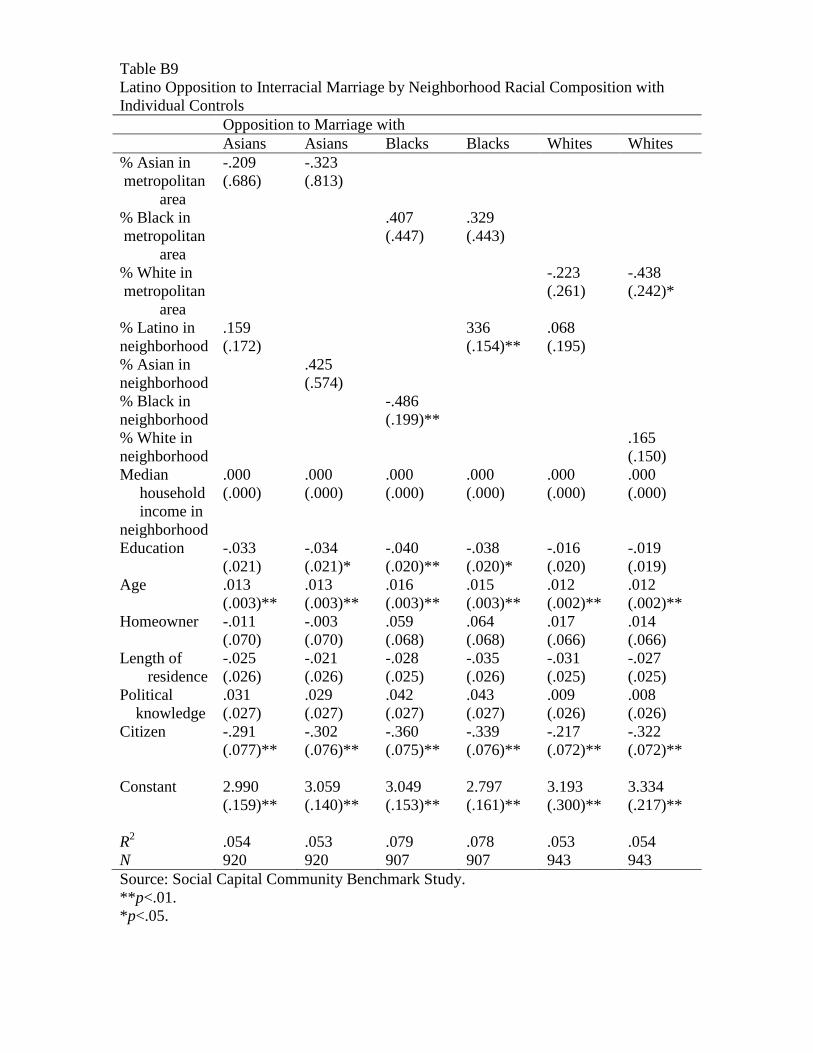
Table B9
Latino Opposition to Interracial Marriage by Neighborhood Racial Composition with
Individual Controls
Opposition to Marriage with
Asians Asians Blacks Blacks Whites Whites
% Asian in
metropolitan
area
-.209
(.686)
-.323
(.813)
% Black in
metropolitan
area
.407
(.447)
.329
(.443)
% White in
metropolitan
area
-.223
(.261)
-.438
(.242)*
% Latino in
neighborhood
.159
(.172)
336
(.154)**
.068
(.195)
% Asian in
neighborhood
.425
(.574)
% Black in
neighborhood
-.486
(.199)**
% White in
neighborhood
.165
(.150)
Median
household
income in
neighborhood
.000
(.000)
.000
(.000)
.000
(.000)
.000
(.000)
.000
(.000)
.000
(.000)
Education -.033
(.021)
-.034
(.021)*
-.040
(.020)**
-.038
(.020)*
-.016
(.020)
-.019
(.019)
Age .013
(.003)**
.013
(.003)**
.016
(.003)**
.015
(.003)**
.012
(.002)**
.012
(.002)**
Homeowner -.011
(.070)
-.003
(.070)
.059
(.068)
.064
(.068)
.017
(.066)
.014
(.066)
Length of
residence
-.025
(.026)
-.021
(.026)
-.028
(.025)
-.035
(.026)
-.031
(.025)
-.027
(.025)
Political
knowledge
.031
(.027)
.029
(.027)
.042
(.027)
.043
(.027)
.009
(.026)
.008
(.026)
Citizen -.291
(.077)**
-.302
(.076)**
-.360
(.075)**
-.339
(.076)**
-.217
(.072)**
-.322
(.072)**
Constant 2.990
(.159)**
3.059
(.140)**
3.049
(.153)**
2.797
(.161)**
3.193
(.300)**
3.334
(.217)**
R2 .054 .053 .079 .078 .053 .054
N 920 920 907 907 943 943
Source: Social Capital Community Benchmark Study.
**p<.01.
*p<.05.
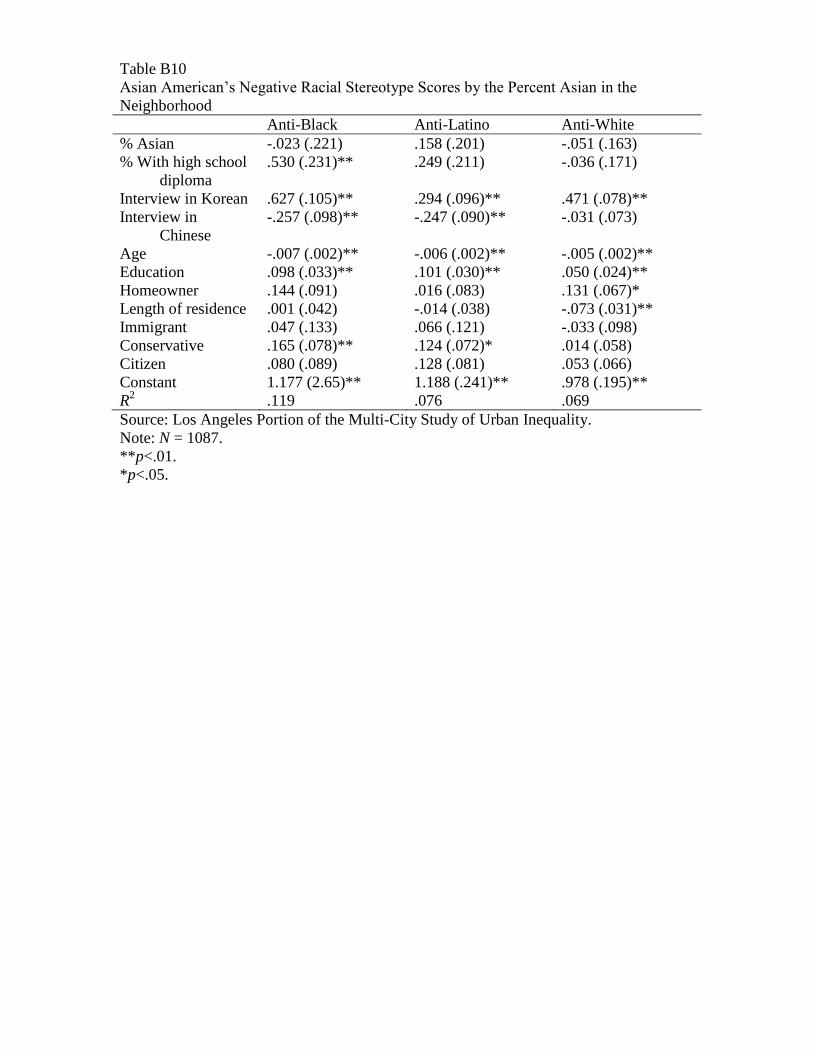
Table B10
Asian American’s Negative Racial Stereotype Scores by the Percent Asian in the
Neighborhood
Anti-Black Anti-Latino Anti-White
% Asian -.023 (.221) .158 (.201) -.051 (.163)
% With high school
diploma
.530 (.231)** .249 (.211) -.036 (.171)
Interview in Korean .627 (.105)** .294 (.096)** .471 (.078)**
Interview in
Chinese
-.257 (.098)** -.247 (.090)** -.031 (.073)
Age -.007 (.002)** -.006 (.002)** -.005 (.002)**
Education .098 (.033)** .101 (.030)** .050 (.024)**
Homeowner .144 (.091) .016 (.083) .131 (.067)*
Length of residence .001 (.042) -.014 (.038) -.073 (.031)**
Immigrant .047 (.133) .066 (.121) -.033 (.098)
Conservative .165 (.078)** .124 (.072)* .014 (.058)
Citizen .080 (.089) .128 (.081) .053 (.066)
Constant 1.177 (2.65)** 1.188 (.241)** .978 (.195)**
R2 .119 .076 .069
Source: Los Angeles Portion of the Multi-City Study of Urban Inequality.
Note: N = 1087.
**p<.01.
*p<.05.

Table B11
Asian Negative Stereotypes about Out-Groups by the Percent Asian in Neighborhood and
Interview Language
Anti-Black Anti-Latino Anti-White
% Asian .648 (.259)* .742 (.328)* .815 (.264)**
Interview in Korean 1.146 (.239)** .571 (.218)** .746 (.176)**
Korean × % Asian -1.67 (.677)** -.927 (.618) -.965 (.497)*
Interview in
Chinese
.017 (.189) .061 (.173)** .543 (.139)**
Chinese × % Asian -.831 (.473)* -.913 (.432)* -1.50 (.347)**
% With high school
diploma
.557 (.239)** .208 (.281) -.147 (.175)
Age -.007 (.002)** -.006 (.002)** -.005 (.002)**
Education .101 (.033)** .102 (.030)** .040 (.024)*
Homeowner .141 (.091) .010 (.083) .116 (.066)*
Length of residence -.004 (.042) -.017 (.038) -.071 (.030)**
Immigrant .049 (.133) .095 (.122) .005 (.097)
Conservative .169 (.078)** .133 (.072)* .032 (.057)
Citizen .070 (.089) .130 (.081) .058 (.065)
Constant .965 (.276)** 1.364 (.245)** 1.157 (.196)**
R2 .13 .08 .085
Source: Los Angeles Portion of the Multi-City Study of Urban Inequality.
Note: N = 1087.
**p<.01.
*p<.05.

Table B12
Asian Negative Stereotypes about Out-Groups by the Percent White in Neighborhood
and Interview Language
Anti-Black Anti-Latino Anti-White
% White -.652 (.277)** -.604 (.253)** -.556 (.202)**
% With high school
diploma
.686 (.308)** .385 (.281) -.009 (.224)
Interview in Korean .407 (.174)** .094 (.159) .408 (.127)**
Interview in
Chinese
-.600 (.161)** -.527 (.147)** -.455 (.117)**
Korean × % white .499 (.415) .446 (.379) -.060 (.303)
Chinese × % white .901 (.354)** .766 (.323)** 1.352 (.258)**
Age -.007 (.002)** -.006 (.002)** -.005 (.002)**
Education .092 (.033)** .096 (.030)** .040 (.024)*
Homeowner .148 (.091) .010 (.083) .116 (.066)*
Length of residence -.003 (.042) -.017 (.038) -.071 (.030)**
Immigrant .083 (.133) .095 (.122) .005 (.097)
Conservative .173 (.078)** .133 (.072)* .032 (.057)
Citizen .079 (.089) .130 (.081) .058 (.065)
Constant 1.294 (.268)** 1.364 (.245)** 1.157 (.196)**
R2 .126 .082 .099
Source: Los Angeles Portion of the Multi-City Study of Urban Inequality.
Note: N = 1087.
**p<.01.
*p<.05.

Table B13
Asian’s Perceptions of Zero-Sum Competition and Feelings of Linked Fate by the
Percent Asian in Their Neighborhood and Interview Language
Zero-Sum Black Zero-Sum Latino Linked Fate
% Asian .852 (.439)* .452 (.364) -.113 (.199)
% With high school
diploma
-.010 (.280) .164 (.247) -.136 (.127)
Interview in Korean .656 (.266)** .587 (.260)** .379 (.126)**
Interview in
Chinese
-.068 (.214) .145 (.204) .121 (.108)
Korean × % Asian -1.179 (.760) -.820 (.737) -.284 (.346)
Chinese × % Asian -.067 (.562) -.443 (.491) -.070 (.265)
Age .003 (.003) .000 (.003) -.003 (.001)**
Education .040 (.037) .039 (.036) .020 (.018)
Homeowner .053 (.103) .076 (.098) -.053 (.050)
Length of residence -.063 (.047) -.030 (.045) -.023 (.023)
Immigrant .222 (.157) .081 (.138) .118 (.072)*
Conservative -.038 (.088) .177 (.084)** .075 (.042)*
Citizen .061 (.101) -.053 (.094) .220 (.048)**
Constant -.077 (.331) .106 (.282) 1.996 (.150)**
R2 .048 .049 .079
N 547 539 816
Source: Los Angeles Portion of the Multi-City Study of Urban Inequality.
Note: N = 1087.
**p<.01.
*p<.05.

Table B14

Table B15
Whites’ Negative Stereotypes of Minority Groups by Percent White in Neighborhood
with Controls for Neighborhood Racial Preference
For
Blacks
(No
Controls)
For
Blacks
(Controls)
For Latinos
(No
Controls)
For
Latinos
(Controls)
For
Asians
(No
Controls)
For
Asians
(Controls)
Contextual:
% White
in neighborhood
.644
(.183)**
.454
(.175)**
.500
(.178)**
.347
(.174)**
.156
(.130)
-.206
(.130)
% With
high
school
degree
-.070
(.170)
.103
(.162)
-.186 (.165) -.077
(.161)
-.214
(.120)*
-.179
(.120)
White neighborhood
.264
(.016)**
.161
(.016)**
.053
(.012)**
Number
of white
neighbors
desired
.017
(.007)**
.029
(.007)**
.009
(.005)*
Atlanta ×
% white
.221
(.245)
.020
(.234)
-.014 (.238) -.100
(.233)
.367
(.174)**
.339
(.174)*
Atlanta -.565
(.172)**
-.354
(.167)**
-.457
(.167)**
.230
(.166)
-.459
(.122)**
-.385
(.124)**
Boston ×
% white
-.388
(.229)*
-.389
(.218)*
-.523
(.222)**
-.517
(.217)**
-.024
(.162)
-.022
(.162)
Boston .097
(.152)
.096
(.146)
.409
(.148)**
.446
(.145)**
-.012
(.108)
.000
(.108)
Detroit ×
% white
-.370
(.232)
-.653
(.222)**
-.350 (.226) -.488
(.222)**
.095
(.165)
.051
(.165)
Detroit -.397
(.174)**
-.140
(.169)
-.476
(.169)**
-.221
(.168)
-.584
(.123)**
-.501
(.125)**
Individual:
Age .000
(.001)
-.002
(.001)*
-.003 (.001)* -.004
(.001)**
-.001
(.001)
-.002
(.001)*
Education
-.106
(.019)**
-.071
(.018)**
-.106
(.018)**
-.084
(.018)**
-.048
(.013)**
-.040
(.013)**
Homeowner
-.004
(.050)
-.026
(.048)
-.043 (.049) -.055
(.048)
-.077
(.036)**
-.080
(.036)**
Length of
residence
-.012
(.021)
-.014
(.020)
.023 (.020) .021
(.020)
-.006
(.015)
-.007
(.015)
Immigrant
-.020
(.080)
-.043
(.076)
-.095 (.078) -.101
(.076)
-.085
(.057)
-.086
(.056)
Conservative
.258
(.044)**
.182
(.042)**
.162
(.043)**
.108
(.042)**
.112
(.031)**
.095
(.031)**
Constant 1.255 1.031 1.410 1.179 1.235 1.160

(.146)**
(.142)** (.141)** (.142)**
(.103)**
(.106)**
R2 .061 .151 .085 .129 .093 .102
Source: Multi-City Study of Urban Inequality.
Note: N = 2905.
**p<.01.
*p<.05.Source: MCSUI
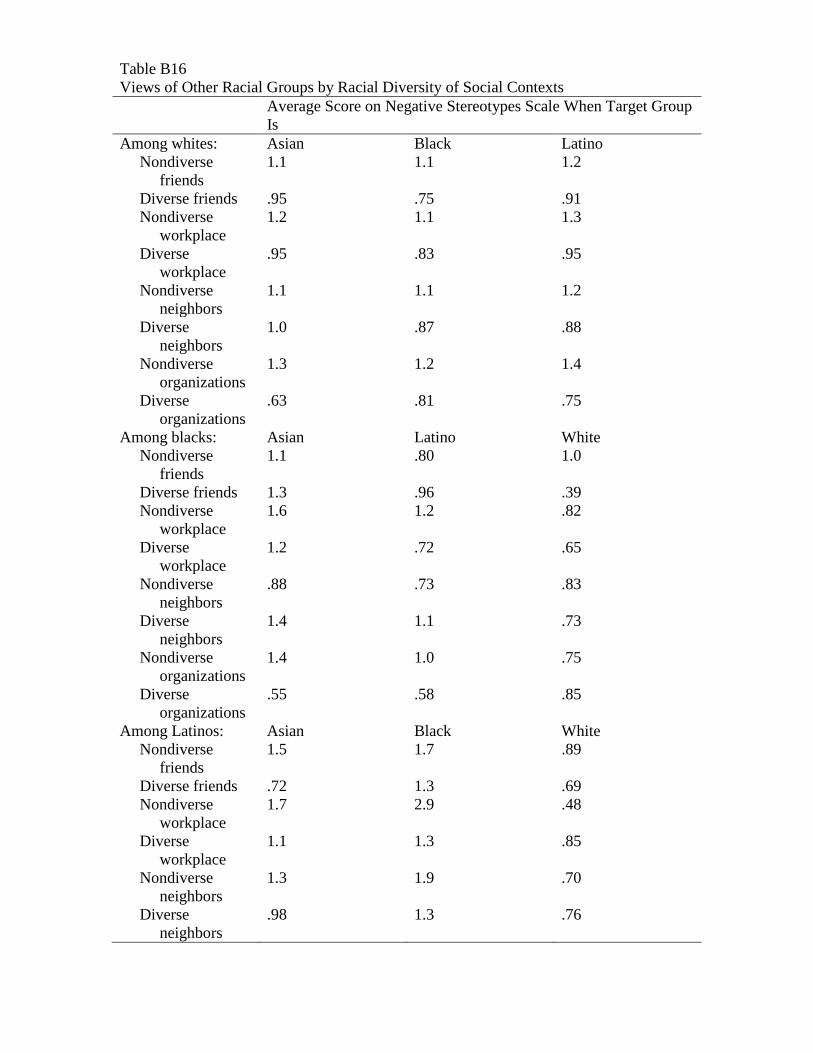
Table B16
Views of Other Racial Groups by Racial Diversity of Social Contexts
Average Score on Negative Stereotypes Scale When Target Group
Is
Among whites: Asian Black Latino
Nondiverse
friends
1.1 1.1 1.2
Diverse friends .95 .75 .91
Nondiverse
workplace
1.2 1.1 1.3
Diverse
workplace
.95 .83 .95
Nondiverse
neighbors
1.1 1.1 1.2
Diverse
neighbors
1.0 .87 .88
Nondiverse
organizations
1.3 1.2 1.4
Diverse
organizations
.63 .81 .75
Among blacks: Asian Latino White
Nondiverse
friends
1.1 .80 1.0
Diverse friends 1.3 .96 .39
Nondiverse
workplace
1.6 1.2 .82
Diverse
workplace
1.2 .72 .65
Nondiverse
neighbors
.88 .73 .83
Diverse
neighbors
1.4 1.1 .73
Nondiverse
organizations
1.4 1.0 .75
Diverse
organizations
.55 .58 .85
Among Latinos: Asian Black White
Nondiverse
friends
1.5 1.7 .89
Diverse friends .72 1.3 .69
Nondiverse
workplace
1.7 2.9 .48
Diverse
workplace
1.1 1.3 .85
Nondiverse
neighbors
1.3 1.9 .70
Diverse
neighbors
.98 1.3 .76

Nondiverse
organizations
.95 1.6 .74
Diverse
organizations
1.3 1.1 .89
Source: 2005 Citizen, Information and Democracy Study.
Note: Survey respondents were asked to estimate, on a 9-point scale, how many of their
close friends, workmates, neighbors, and fellow members of clubs, churches, or other
organizations were of another race. Those who estimated that more than 10 percent of
such contacts were of another race are included in the categories above.

Table B17
Opposition to Interracial Marriage by Percent White in Neighborhood and Metropolitan
Area
Opposition to Marriage with
Blacks Blacks Latinos Latinos Asians Asians
Contextual:
% White in
neighborhood
.111
(.030)**
.071
(.032)**
.065
(.024)**
.038
(.025)
.057
(.020)**
.048
(.022)**
Median
household
income in
neighborhood
.000
(.000)**
.000
(.000)**
.000
(.000)**
.000
(.000)**
.000
(.000)**
.000
(.000)**
% White in
metropolitan
area
-.159
(.042)**
-.168
(.045)**
-.090
(.034)**
-.126
(.036)**
-.074
(.029)**
-.086
(.030)**
Individual:
Has black
friend
-.065
(.009)**
Has Latino
friend
-.069
(.007)**
Has Asian
friend
-.029
(.006)**
Belongs to
integrated
group
.043
(.010)**
.012
(.008)
.011
(.007)*
Education -.024
(.002)**
-.025
(.003)**
-.023
(.002)**
-.021
(.002)**
-.018
(.002)**
-.017
(.002)**
Age .006
(.000)**
.005
(.000)**
.003
(.000)**
.003
(.000)**
.003
(.000)**
.002
(.000)**
Homeowner .023
(.010)**
.023
(.011)**
.002
(.008)
.001
(.009)
.002
(.007)
.003
(.008)
Years in
local
community
.007
(.003)**
.007
(.003)**
.006
(.003)**
.006
(.003)**
.000
(.002)
.001
(.002)
Political
knowledge
-.011
(.003)**
-.011
(.003)**
-.011
(.002)**
-.011
(.002)**
-.006
(.002)**
-.003
(.002)*
Constant .087
(.039)**
.150
(.044)**
.128
(.031)**
.202
(.035)**
.090
(.027)**
.108
(.029)**
R2 .095 .111 .065 .082 .059 .060
N 7347 6362 7347 6349 7347 6350
Source: Social Capital Community Benchmark Study.
**p<.01.
*p<.05.
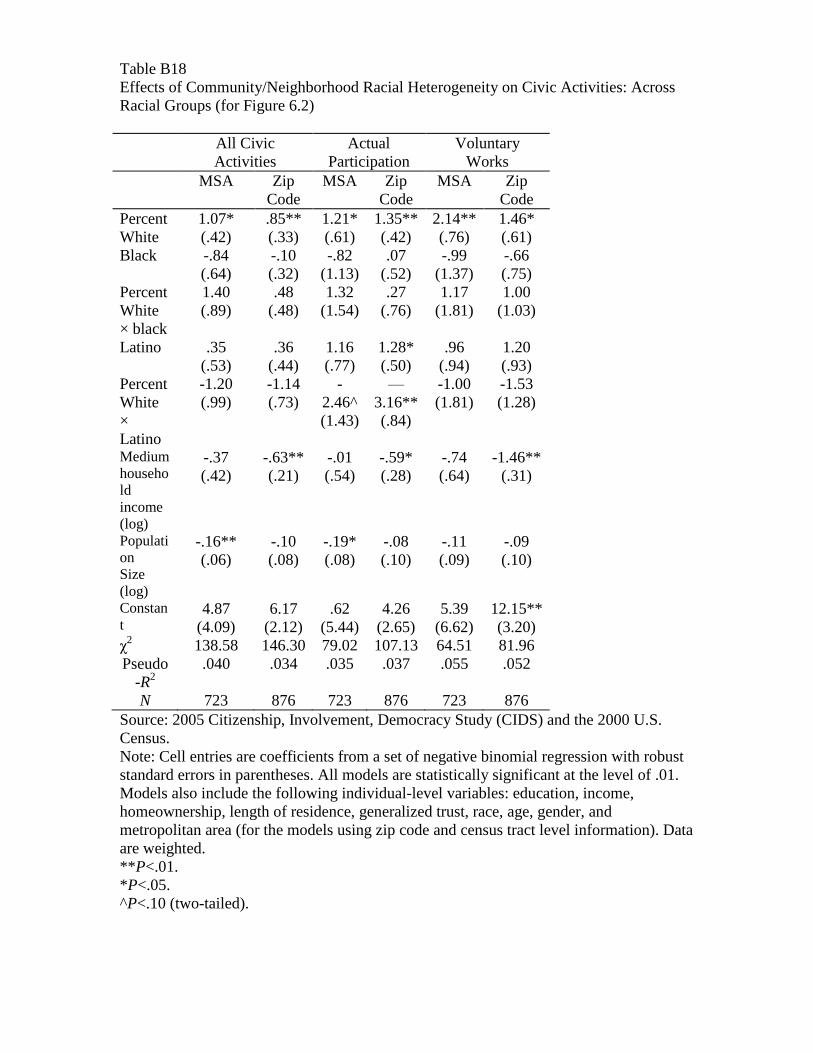
Table B18
Effects of Community/Neighborhood Racial Heterogeneity on Civic Activities: Across
Racial Groups (for Figure 6.2)
All Civic
Activities
Actual
Participation
Voluntary
Works
MSA Zip
Code
MSA Zip
Code
MSA Zip
Code
Percent
White
1.07*
(.42)
.85**
(.33)
1.21*
(.61)
1.35**
(.42)
2.14**
(.76)
1.46*
(.61)
Black -.84
(.64)
-.10
(.32)
-.82
(1.13)
.07
(.52)
-.99
(1.37)
-.66
(.75)
Percent
White
× black
1.40
(.89)
.48
(.48)
1.32
(1.54)
.27
(.76)
1.17
(1.81)
1.00
(1.03)
Latino .35
(.53)
.36
(.44)
1.16
(.77)
1.28*
(.50)
.96
(.94)
1.20
(.93)
Percent
White
×
Latino
-1.20
(.99)
-1.14
(.73)
-
2.46^
(1.43)
—
3.16**
(.84)
-1.00
(1.81)
-1.53
(1.28)
Medium
househo
ld
income
(log)
-.37
(.42)
-.63**
(.21)
-.01
(.54)
-.59*
(.28)
-.74
(.64)
-1.46**
(.31)
Populati
on
Size
(log)
-.16**
(.06)
-.10
(.08)
-.19*
(.08)
-.08
(.10)
-.11
(.09)
-.09
(.10)
Constan
t 4.87
(4.09)
6.17
(2.12)
.62
(5.44)
4.26
(2.65)
5.39
(6.62)
12.15**
(3.20)
χ2
138.58 146.30 79.02 107.13 64.51 81.96
Pseudo
-R2
.040 .034 .035 .037 .055 .052
N 723 876 723 876 723 876
Source: 2005 Citizenship, Involvement, Democracy Study (CIDS) and the 2000 U.S.
Census.
Note: Cell entries are coefficients from a set of negative binomial regression with robust
standard errors in parentheses. All models are statistically significant at the level of .01.
Models also include the following individual-level variables: education, income,
homeownership, length of residence, generalized trust, race, age, gender, and
metropolitan area (for the models using zip code and census tract level information). Data
are weighted.
**P<.01.
*P<.05.
^P<.10 (two-tailed).
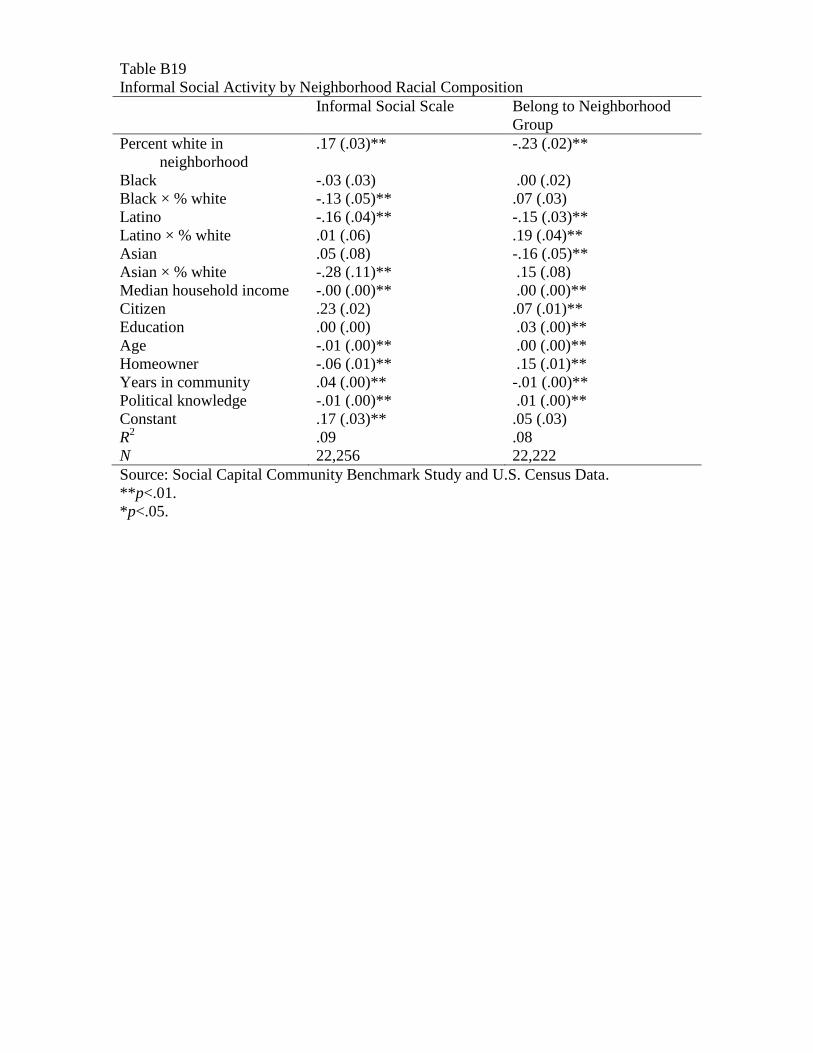
Table B19
Informal Social Activity by Neighborhood Racial Composition
Informal Social Scale Belong to Neighborhood
Group
Percent white in
neighborhood
.17 (.03)** -.23 (.02)**
Black -.03 (.03) .00 (.02)
Black × % white -.13 (.05)** .07 (.03)
Latino -.16 (.04)** -.15 (.03)**
Latino × % white .01 (.06) .19 (.04)**
Asian .05 (.08) -.16 (.05)**
Asian × % white -.28 (.11)** .15 (.08)
Median household income -.00 (.00)** .00 (.00)**
Citizen .23 (.02) .07 (.01)**
Education .00 (.00) .03 (.00)**
Age -.01 (.00)** .00 (.00)**
Homeowner -.06 (.01)** .15 (.01)**
Years in community .04 (.00)** -.01 (.00)**
Political knowledge -.01 (.00)** .01 (.00)**
Constant .17 (.03)** .05 (.03)
R2 .09 .08
N 22,256 22,222
Source: Social Capital Community Benchmark Study and U.S. Census Data.
**p<.01.
*p<.05.

Table B19
Feelings of Connection with Neighbors by Neighborhood Racial Composition
Trust Your Neighbors Neighbors Give You a
Sense of Belonging
Percent white in
neighborhood
.47 (.03)** .08 (.02)**
Black -.17 (.04)** .08 (.03)**
Black × % white -.26 (.06)** -.11 (.04)**
Latino -.16 (.05)** .11 (.04)**
Latino × % white -.28 (.07)** -.18 (.05)**
Asian -.11 (.09) -.05 (.07)
Asian × % white .02 (.14) .09 (.11)
Median household income .00 (.00)** .00 (.00)
Citizen .10 (.02)** -.05 (.02)**
Education .07 (.00)** .00 (.02)
Age .01 (.00)** .00 (.00)**
Homeowner .32 (.01)** .10 (.01)**
Years in community .02 (.00)** .01 (.00)*
Political knowledge .02 (.00)** .00 (.00)
Constant 1.7 (.04)** .60 (.03)**
R2 .24 .25
N 21,789 11,035
Source: Social Capital Community Benchmark Study and U.S. Census Data.
**p<.01.
*p<.05.