appendix b boater survey report - united states army
TRANSCRIPT
Beaver Lake Boating Carrying Capacity Study Page B-1
Appendix B Boater Survey Report
Appendix B • Boater Survey Report
Beaver Lake Boating Carrying Capacity Study Page B-2
This page intentionally left blank.
Appendix B • Boater Survey Report
Beaver Lake Boating Carrying Capacity Study Page B-3
This appendix describes the Beaver Lake Boating survey administered to recreational boaters at Beaver Lake following the summer 2016 boating season. Section B.1 describes development and administration of the survey. Section B.2 provides the survey questionnaire that was administered. Section B.3 presents the basic frequency of response for each question and Section B.4
B.1 User Survey Development and AdministrationB.1.1 Survey Design and ApprovalTo avoid overburdening the public with federally sponsored data collections, the Paperwork Reduction Act (PRA) of 1995 requires that U.S. federal government agencies obtain Office of Management and Budget (OMB) approval before requesting or collecting most types of information from the public. In accordance with the PRA, OMB approval must be obtained prior to collecting federally sponsored data in any situation where 10 or more respondents, within a 12-month period, are involved. The questions are standardized in nature whether they are delivered in-person, on the telephone, or online.
The Beaver Lake Boating Survey was submitted to OMB under the Interagency Generic Clearance for Federal Land Management Agencies Collaborative Visitor Feedback Surveys on Recreation and Transportation Related Programs and Systems (OMB control number 0596-0236). The generic clearance was submitted jointly to help the signatory Federal Land Management Agencies, including the Bureau of Land Management, U.S. Fish and Wildlife Service, National Park Service, Forest Service, and Army Corps of Engineers, improve transportation conditions and recreation and resource management. The FLMA clearance was designed to collect information about visitors’ perceptions, experiences, and expectations, with respect to transportation conditions, services, and recreation opportunities at various FLMA locations and across areas that could include multiple locations managed by different FLMAs. OMB approval is still required for each survey requested to be administered under the FLMA clearance.
Survey questions related to these topics have been compiled for use in designing surveys submitted under the FLMA clearance, use of which helps to streamline the approval process. The OMB approval process requires identification of which questions in the proposed survey are taken from the previously compiled questions. Questions that are not in the collection are allowed, but the source for these questions must be clearly identified (e.g., are they new or are they taken from a previous survey that has been approved by OMB), and these questions must be reviewed and approved by OMB.
Pulling from the question collection, 21 questions were selected to determine respondent characteristics, assess visitor experiences, and characterize trip behaviors. One non-compendium question was asked from a recently expired OMB Clearance (0710-0001). The questions were combined into a survey instrument with an accompanying cover letter. Experts in graphic design and development of publicly distributed materials were involved in designing the cover letter in an effort to improve the response rate.
Pre-testing and consultation were conducted with five volunteer participants with no specific background or training in survey research methods or analysis (i.e., representative of the public, rather than survey experts). Specifically, the individuals were asked to complete the questionnaire and then asked a series of debriefing questions to elicit their feedback on the practical utility of the study, questionnaire/respondent burden, quality and clarity of the questions and instructions, and
Appendix B • Boater Survey Report
Beaver Lake Boating Carrying Capacity Study Page B-4
ways to minimize respondent burden. Comments were incorporated into the final instrument. Time to complete the survey ranged from 5 to 9 minutes.
The survey was offered through two mediums: online and paper copy via a mail out/mail back method. The online survey was hosted at surveygizmo.com. The online survey was tested on a variety of operating systems and hand-held, personal devices to ensure those who preferred to take the survey online could access and complete each question. No Personally Identifiable Information was maintained during the survey process.
The final mail out survey instrument approved by OMB is provided in Section B.2.
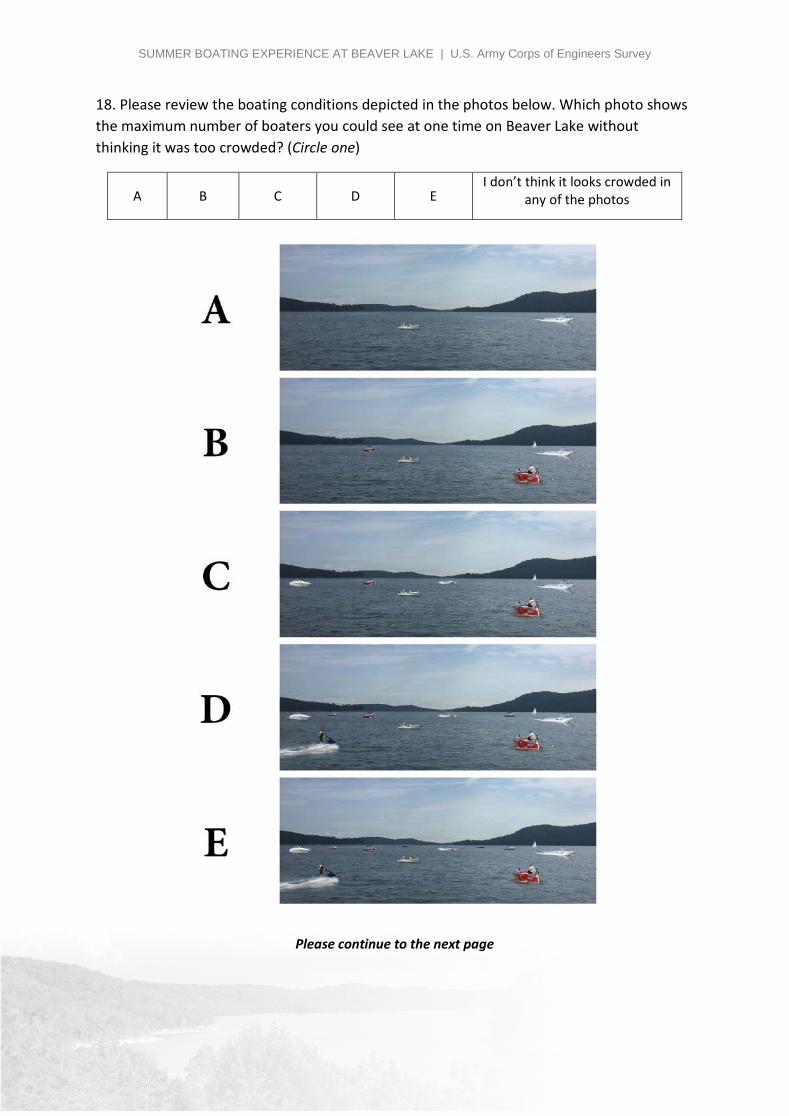
B.1.2 Photo Simulation Question DevelopmentA question was allowed by OMB that simulates maximum acceptable impact using photo simulation of a scale of watercraft density. This method has been widely used in the parks and recreation assessment field for simulating hiker and vehicular traffic that is acceptable to visitors. The method has been applied in numerous boating capacity studies as well. The photo simulation is effective for collecting evaluative information about use levels that are higher and lower than the current, existing lake use levels. The goal of the photo simulation is to provide a foundation for careful assessment of the reasonable range for social carrying capacity at Beaver Lake.
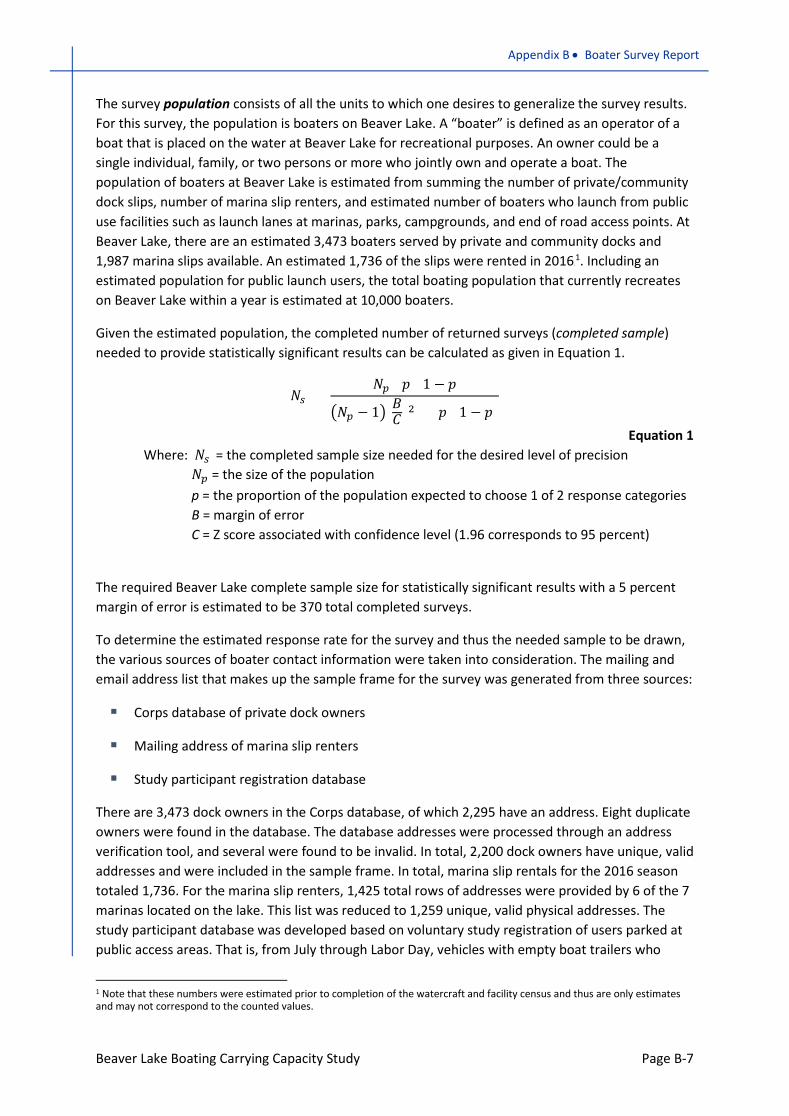
The survey Question 18 asked respondents: Please review the boating conditions depicted in the photos below. Which photo shows the maximum number of boaters you could see at one time on Beaver Lake without thinking it was too crowded?
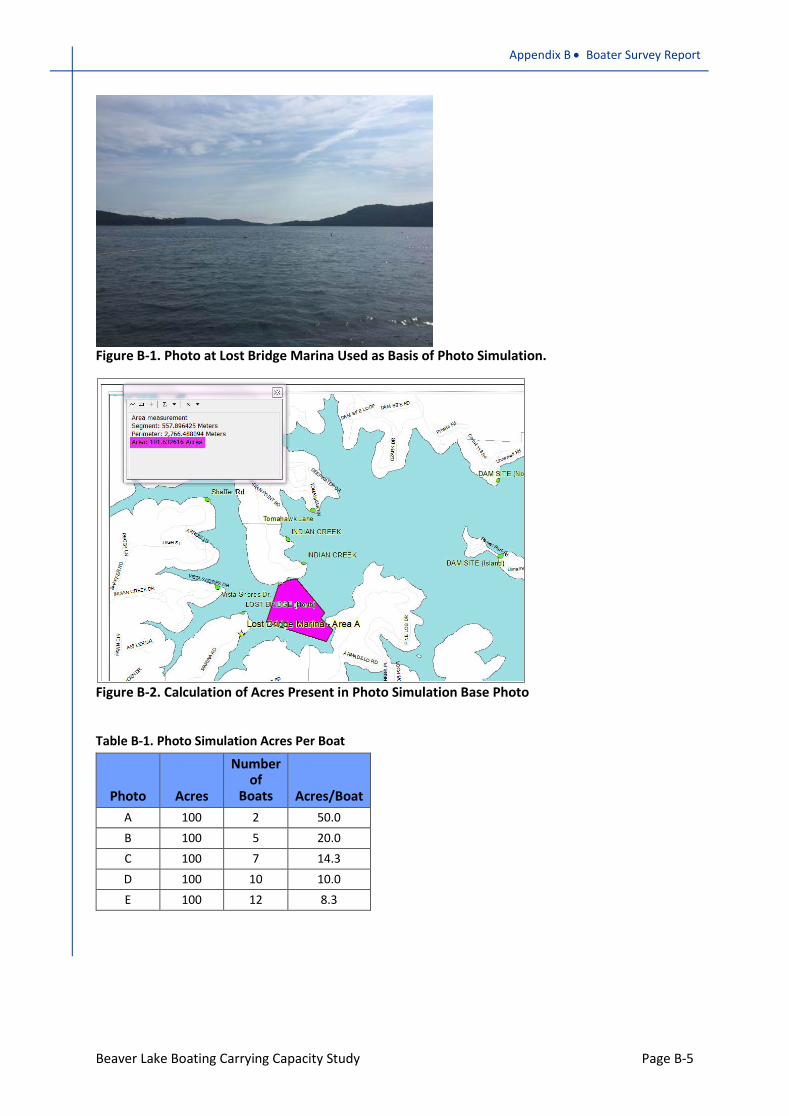
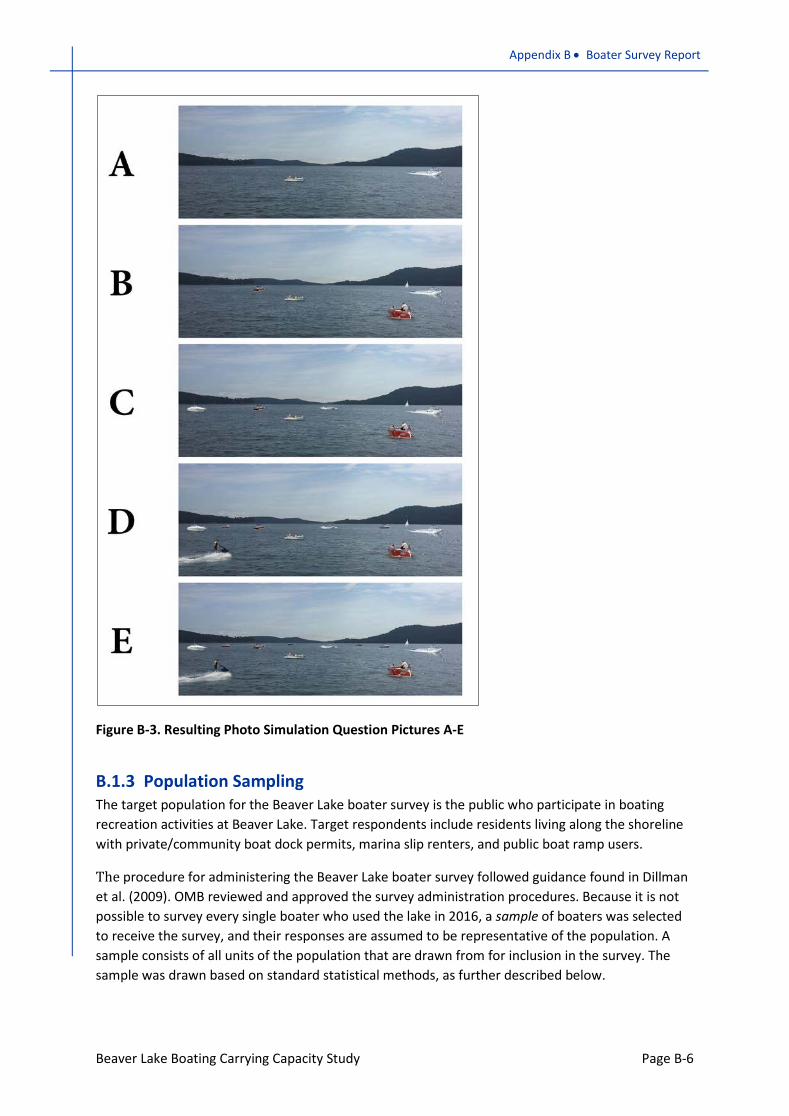
To develop the photo images that correspond to the question, a photograph was taken at Lost Bridge Marina while no boats were present, as shown in Figure B-1. Using Photoshop, the buoys and ropes were removed from the photo. GIS was used to estimate the number of acres present in the use area of the photo (Figure B-2). Boats were then added to simulate a range of reservoir use levels per Table B-1. Results are provided in Figure B-3.
Appendix B • Boater Survey Report
Beaver Lake Boating Carrying Capacity Study Page B-5
Figure B-1. Photo at Lost Bridge Marina Used as Basis of Photo Simulation.
Figure B-2. Calculation of Acres Present in Photo Simulation Base Photo
Table B-1. Photo Simulation Acres Per Boat
Photo Acres
Number of
Boats Acres/Boat A 100 2 50.0 B 100 5 20.0 C 100 7 14.3 D 100 10 10.0 E 100 12 8.3
Appendix B • Boater Survey Report
Beaver Lake Boating Carrying Capacity Study Page B-6
Figure B-3. Resulting Photo Simulation Question Pictures A-E
B.1.3 Population SamplingThe target population for the Beaver Lake boater survey is the public who participate in boating recreation activities at Beaver Lake. Target respondents include residents living along the shoreline with private/community boat dock permits, marina slip renters, and public boat ramp users.
The procedure for administering the Beaver Lake boater survey followed guidance found in Dillman et al. (2009). OMB reviewed and approved the survey administration procedures. Because it is not possible to survey every single boater who used the lake in 2016, a sample of boaters was selected to receive the survey, and their responses are assumed to be representative of the population. A sample consists of all units of the population that are drawn from for inclusion in the survey. The sample was drawn based on standard statistical methods, as further described below.
Appendix B • Boater Survey Report
Beaver Lake Boating Carrying Capacity Study Page B-7
The survey population consists of all the units to which one desires to generalize the survey results. For this survey, the population is boaters on Beaver Lake. A “boater” is defined as an operator of a boat that is placed on the water at Beaver Lake for recreational purposes. An owner could be a single individual, family, or two persons or more who jointly own and operate a boat. The population of boaters at Beaver Lake is estimated from summing the number of private/community dock slips, number of marina slip renters, and estimated number of boaters who launch from public use facilities such as launch lanes at marinas, parks, campgrounds, and end of road access points. At Beaver Lake, there are an estimated 3,473 boaters served by private and community docks and 1,987 marina slips available. An estimated 1,736 of the slips were rented in 20160F
1. Including an estimated population for public launch users, the total boating population that currently recreates on Beaver Lake within a year is estimated at 10,000 boaters.
Given the estimated population, the completed number of returned surveys (completed sample) needed to provide statistically significant results can be calculated as given in Equation 1.
𝑁𝑁𝑠𝑠 = (𝑁𝑁𝑝𝑝)(𝑝𝑝)(1 − 𝑝𝑝)
�𝑁𝑁𝑝𝑝 − 1�(𝐵𝐵𝐶𝐶)2 + (𝑝𝑝)(1 − 𝑝𝑝)Equation 1
Where: 𝑁𝑁𝑠𝑠 = the completed sample size needed for the desired level of precision 𝑁𝑁𝑝𝑝 = the size of the population p = the proportion of the population expected to choose 1 of 2 response categories B = margin of error C = Z score associated with confidence level (1.96 corresponds to 95 percent)
The required Beaver Lake complete sample size for statistically significant results with a 5 percent margin of error is estimated to be 370 total completed surveys.
To determine the estimated response rate for the survey and thus the needed sample to be drawn, the various sources of boater contact information were taken into consideration. The mailing and email address list that makes up the sample frame for the survey was generated from three sources:
Corps database of private dock owners
Mailing address of marina slip renters
Study participant registration database
There are 3,473 dock owners in the Corps database, of which 2,295 have an address. Eight duplicate owners were found in the database. The database addresses were processed through an address verification tool, and several were found to be invalid. In total, 2,200 dock owners have unique, valid addresses and were included in the sample frame. In total, marina slip rentals for the 2016 season totaled 1,736. For the marina slip renters, 1,425 total rows of addresses were provided by 6 of the 7 marinas located on the lake. This list was reduced to 1,259 unique, valid physical addresses. The study participant database was developed based on voluntary study registration of users parked at public access areas. That is, from July through Labor Day, vehicles with empty boat trailers who
1 Note that these numbers were estimated prior to completion of the watercraft and facility census and thus are only estimates and may not correspond to the counted values.
Appendix B • Boater Survey Report
Beaver Lake Boating Carrying Capacity Study Page B-8
were parked at public access areas were invited via a postcard on their windshield to register to participate in the Beaver Lake study. In all, 174 unique registrations were received. Of those, 123 requested to be contacted via email and 50 requested to be contacted via postal mail. One email address was found to be invalid, and no physical address was provided. Thus, the email registrants totaled 122.
Of those who registered to participate in the study, a 50 percent response rate was assumed for those who asked to be contacted via email. That left 309 (370-61) as the target for completed surveys from postal mail-out/mail-back. A conservative 10 percent response rate on mail-out/mail-back was assumed. Thus, 3,090 paper surveys were mailed (309/0.10).
All 50 who registered via the windshield postcard and asked for the paper survey were provided with the opportunity to respond. This was done to balance the targeted completed sample for those who access the lake via public launch areas. To draw a sample from the dock owners and slip renters, the valid, unique addresses were organized in an Excel workbook by group. The target was set in proportion to the known population (known = 1,736 marina slip renters and 3,473 dock owners; target 1,013 marina slip renters and 2,027 dock owners). A random number between 0 and 10,000 was assigned to each address by type. The addresses were then sorted by type and the random number from smallest to largest. The smallest 1,013 random numbers for marina slip renters were selected to receive a survey. The smallest 2,027 random numbers for dock owners were selected to receive a survey.
B.1.4 Survey AdministrationThe survey was administered on October 19 and left open for 30 days. Responses received through November 28 were included in the results. The additional time allowed for responses mailed back at the end of the 30-day request period to be counted. The mail out survey included a postage paid, self-addressed envelope. The respondents were also provided the online survey web address for those who preferred to complete the survey online.
Email requests to complete the survey were sent from an email address created specifically for the study ([email protected]). To avoid or reduce the chance of the email being marked as spam, individual emails were sent rather than a bulk email to all possible respondents. The initial email was sent out on October 19, and email reminders were sent out on November 3.
Responses received through the postal mail were added to the online database using the surveygizmo.com interface. Quality checking procedures were employed to ensure accuracy of entered data. No “undeliverable” surveys were returned, indicating all were received by the target recipients.
B.1.5 Quality ProceduresTo ensure quality and reduce potential error that was possible during the survey administration process, quality discussions occurred between the Project Manager and Program Manager. Potential sources of error were identified, and a mitigation plan was developed.
The greatest potential was determined to be in collection and entry of the surveys received via postal mail. The following steps were taken to reduce and mitigate potential error:
As surveys were received, each was removed from the envelope and stamped with the datereceived.
Appendix B • Boater Survey Report
Beaver Lake Boating Carrying Capacity Study Page B-9
The same trained technician handled and entered all paper surveys received to reducepotential entry error and ensure consistency in entry.
Survey responses were recorded per the date received, with the first surveys receivedentered first, and so on.
As survey responses were entered via the online survey interface, each paper survey wasclearly marked as recorded and initialed by the technician and filed per date received.
Independent checking was conducted on approximately 10 percent of the surveys. Knowingthe IP address of the entry technician, 140 surveys were independently checked and verified.Seven errors in total were found, representing 5 percent of those checked. Entry errors weredocumented and corrected in the response database.
A procedure was established for dealing with responses received past the open period.Responses were marked as such and filed per the date received.
Additionally, the online survey responses were checked for quality. In total, 12 responses were removed from the online database. These responses were verified as being duplicate entries from the same IP address. In all instances, it was obvious that the respondent had begun the survey, navigated away from the page, then returned to the survey starting a new entry.
B.2 Beaver Lake Survey QuestionnaireThis section provides the mail questionnaire. Questions for the online version were exact, with question skipping built into the design.
SUMMER BOATING EXPERIENCE AT BEAVER LAKE U.S. Army Corps of Engineers Survey
This study is being conducted by CDM Smith, a contractor, on behalf of the U.S. Army Corps of Engineers.
The public reporting burden for this collection of information is estimated to average 10 minutes per response, including the time for reviewing instructions, searching existing data sources, gathering and maintaining the data needed, and completing and reviewing the collection of information. Send comments regarding this burden estimate or any other aspect of this collection of information, including suggestions for reducing the burden, to the Department of Defense, Washington Headquarters services, Executive Services Directorate, Information Management Division, 4800 Mark Center Drive, East Tower, Suite 02G09, Alexandria, VA 22350-3100 (0596-0236, expiration 11-30-17). Respondents should be aware that notwithstanding any other provision of law, no person shall be subject to any penalty for failing to comply with a collection of information if it does not display a currently valid OMB control number. PLEASE DO NOT RETURN YOUR RESPONSE TO THE ABOVE ADDRESS.
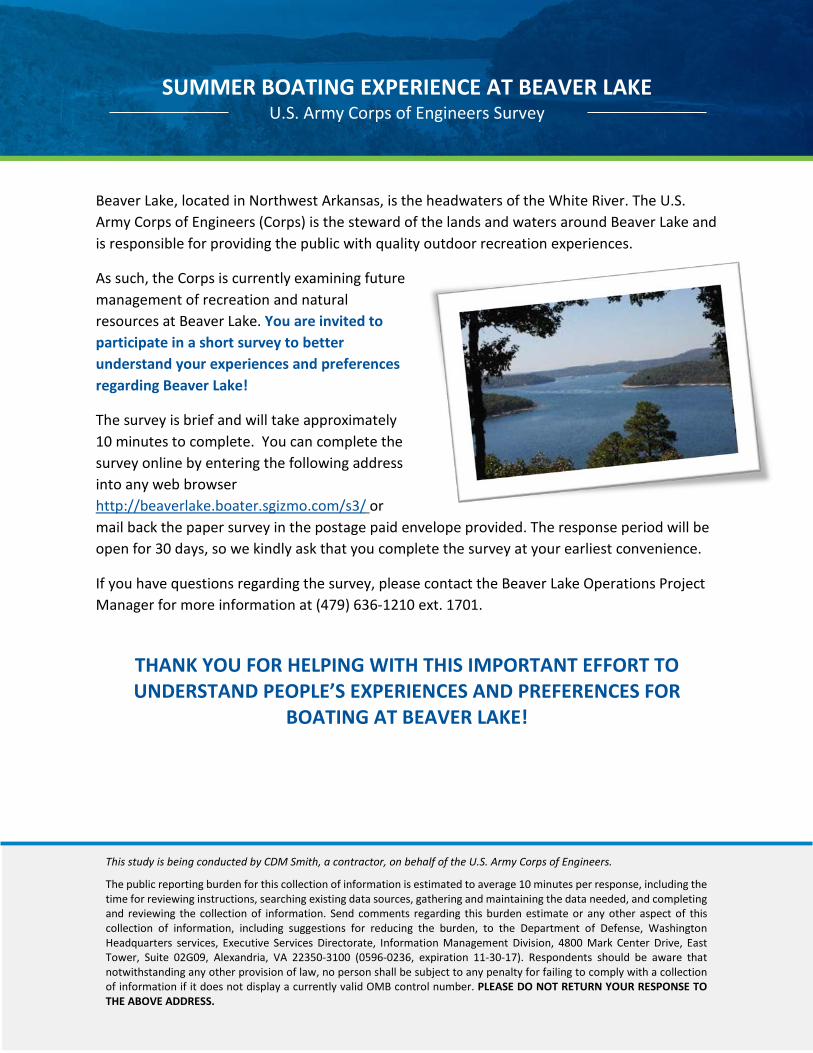
Beaver Lake, located in Northwest Arkansas, is the headwaters of the White River. The U.S. Army Corps of Engineers (Corps) is the steward of the lands and waters around Beaver Lake and is responsible for providing the public with quality outdoor recreation experiences.
As such, the Corps is currently examining future management of recreation and natural resources at Beaver Lake. You are invited to participate in a short survey to better understand your experiences and preferences regarding Beaver Lake!
The survey is brief and will take approximately 10 minutes to complete. You can complete the survey online by entering the following address into any web browser http://beaverlake.boater.sgizmo.com/s3/ or mail back the paper survey in the postage paid envelope provided. The response period will be open for 30 days, so we kindly ask that you complete the survey at your earliest convenience.
If you have questions regarding the survey, please contact the Beaver Lake Operations Project Manager for more information at (479) 636-1210 ext. 1701.
THANK YOU FOR HELPING WITH THIS IMPORTANT EFFORT TO UNDERSTAND PEOPLE’S EXPERIENCES AND PREFERENCES FOR
BOATING AT BEAVER LAKE!
SUMMER BOATING EXPERIENCE AT BEAVER LAKE | U.S. Army Corps of Engineers Survey
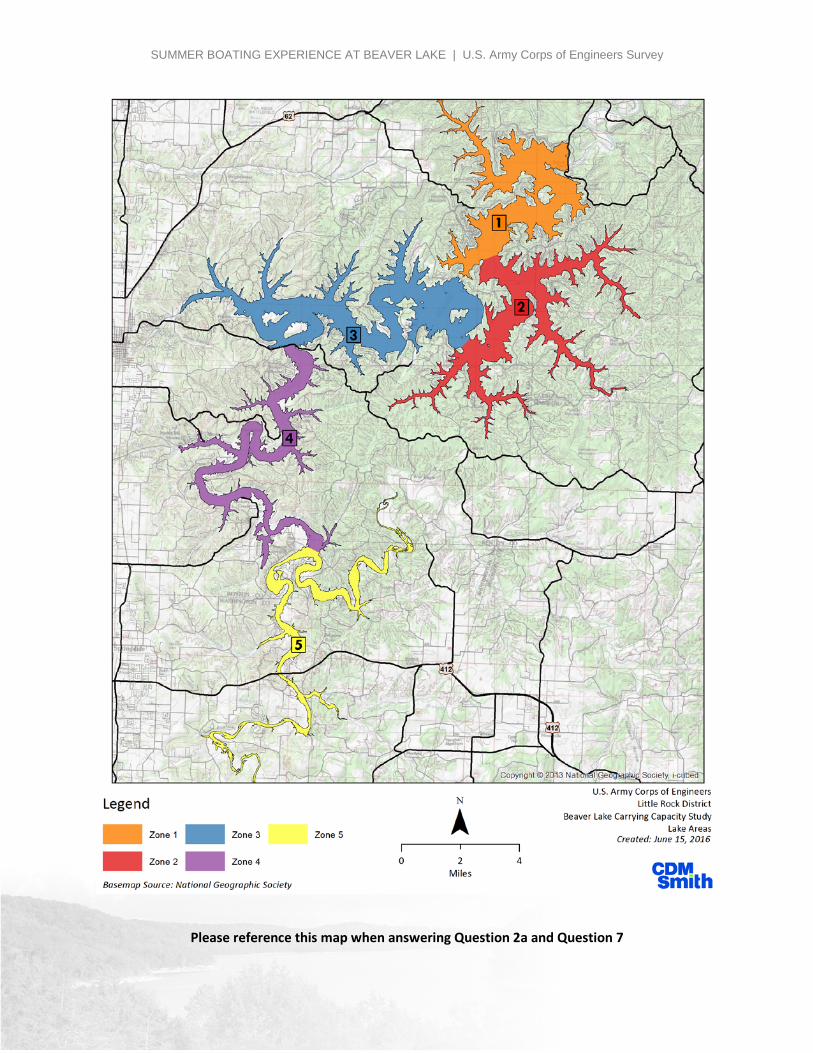
Please reference this map when answering Question 2a and Question 7
SUMMER BOATING EXPERIENCE AT BEAVER LAKE | U.S. Army Corps of Engineers Survey
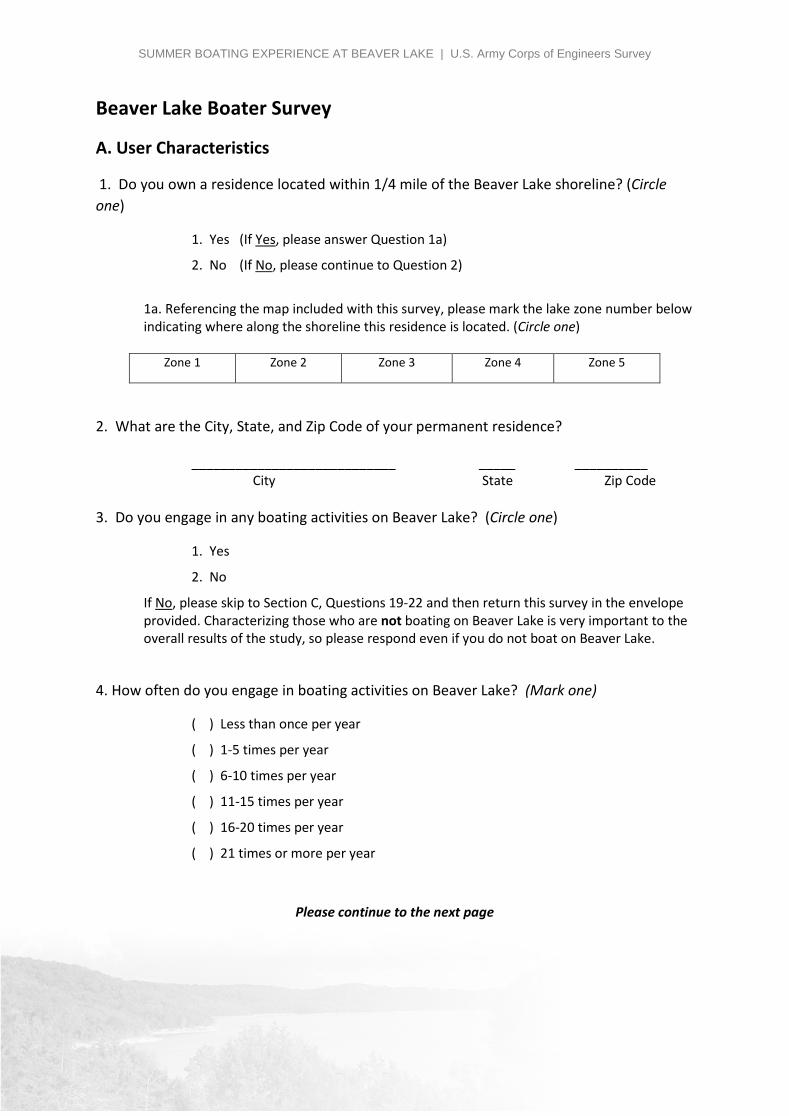
Beaver Lake Boater Survey
A. User Characteristics
1. Do you own a residence located within 1/4 mile of the Beaver Lake shoreline? (Circleone)
1. Yes (If Yes, please answer Question 1a)
2. No (If No, please continue to Question 2)
1a. Referencing the map included with this survey, please mark the lake zone number below indicating where along the shoreline this residence is located. (Circle one)
Zone 1 Zone 2 Zone 3 Zone 4 Zone 5
2. What are the City, State, and Zip Code of your permanent residence?
____________________________ _____ __________ City State Zip Code
3. Do you engage in any boating activities on Beaver Lake? (Circle one)
1. Yes
2. No
If No, please skip to Section C, Questions 19-22 and then return this survey in the envelope provided. Characterizing those who are not boating on Beaver Lake is very important to the overall results of the study, so please respond even if you do not boat on Beaver Lake.
4. How often do you engage in boating activities on Beaver Lake? (Mark one)
( ) Less than once per year
( ) 1-5 times per year
( ) 6-10 times per year
( ) 11-15 times per year
( ) 16-20 times per year
( ) 21 times or more per year
Please continue to the next page
SUMMER BOATING EXPERIENCE AT BEAVER LAKE | U.S. Army Corps of Engineers Survey
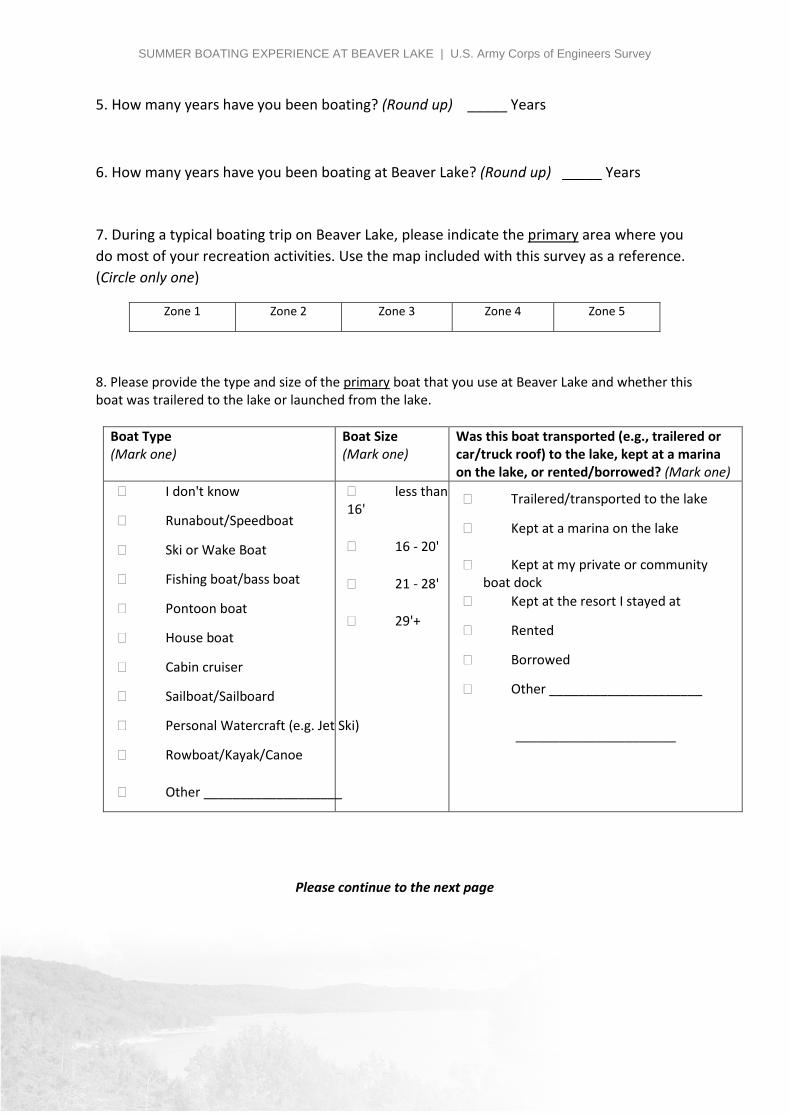
5. How many years have you been boating? (Round up) _____ Years
6. How many years have you been boating at Beaver Lake? (Round up) _____ Years
7. During a typical boating trip on Beaver Lake, please indicate the primary area where youdo most of your recreation activities. Use the map included with this survey as a reference.(Circle only one)
Zone 1 Zone 2 Zone 3 Zone 4 Zone 5
8. Please provide the type and size of the primary boat that you use at Beaver Lake and whether thisboat was trailered to the lake or launched from the lake.
Boat Type (Mark one)
Boat Size (Mark one)
Was this boat transported (e.g., trailered or car/truck roof) to the lake, kept at a marina on the lake, or rented/borrowed? (Mark one)
� I don't know
� Runabout/Speedboat
� Ski or Wake Boat
� Fishing boat/bass boat
� Pontoon boat
� House boat
� Cabin cruiser
� Sailboat/Sailboard
� Personal Watercraft (e.g. Jet Ski)
� Rowboat/Kayak/Canoe
� Other ___________________
� less than 16'
� 16 - 20'
� 21 - 28'
� 29'+
� Trailered/transported to the lake
� Kept at a marina on the lake
� Kept at my private or community boat dock
� Kept at the resort I stayed at
� Rented
� Borrowed
� Other _____________________
______________________
Please continue to the next page
SUMMER BOATING EXPERIENCE AT BEAVER LAKE | U.S. Army Corps of Engineers Survey
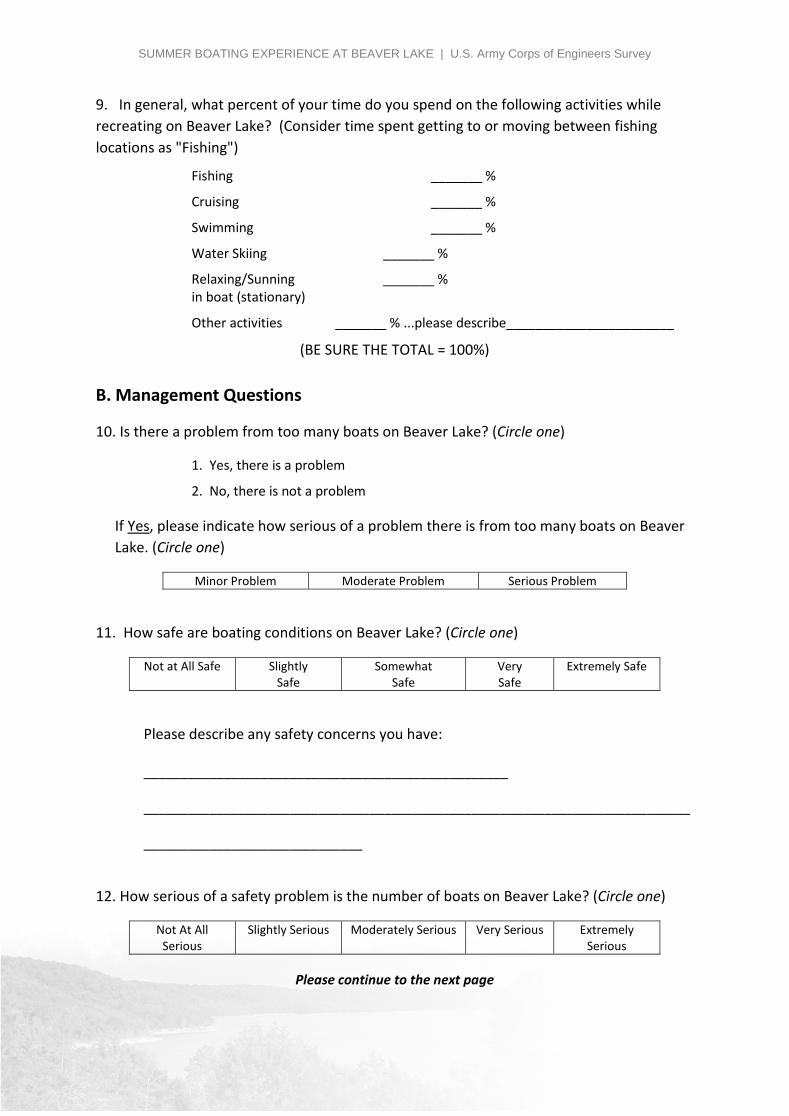
9. In general, what percent of your time do you spend on the following activities whilerecreating on Beaver Lake? (Consider time spent getting to or moving between fishinglocations as "Fishing")
Fishing _______ %
Cruising _______ %
Swimming _______ %
Water Skiing _______ %
Relaxing/Sunning _______ % in boat (stationary)
Other activities _______ % ...please describe_______________________
(BE SURE THE TOTAL = 100%)
B. Management Questions
10. Is there a problem from too many boats on Beaver Lake? (Circle one)
1. Yes, there is a problem
2. No, there is not a problem
If Yes, please indicate how serious of a problem there is from too many boats on Beaver Lake. (Circle one)
Minor Problem Moderate Problem Serious Problem
11. How safe are boating conditions on Beaver Lake? (Circle one)
Not at All Safe Slightly Safe
Somewhat Safe
Very Safe
Extremely Safe
Please describe any safety concerns you have:
__________________________________________________
___________________________________________________________________________
______________________________
12. How serious of a safety problem is the number of boats on Beaver Lake? (Circle one)
Not At All Serious
Slightly Serious Moderately Serious Very Serious Extremely Serious
Please continue to the next page
SUMMER BOATING EXPERIENCE AT BEAVER LAKE | U.S. Army Corps of Engineers Survey
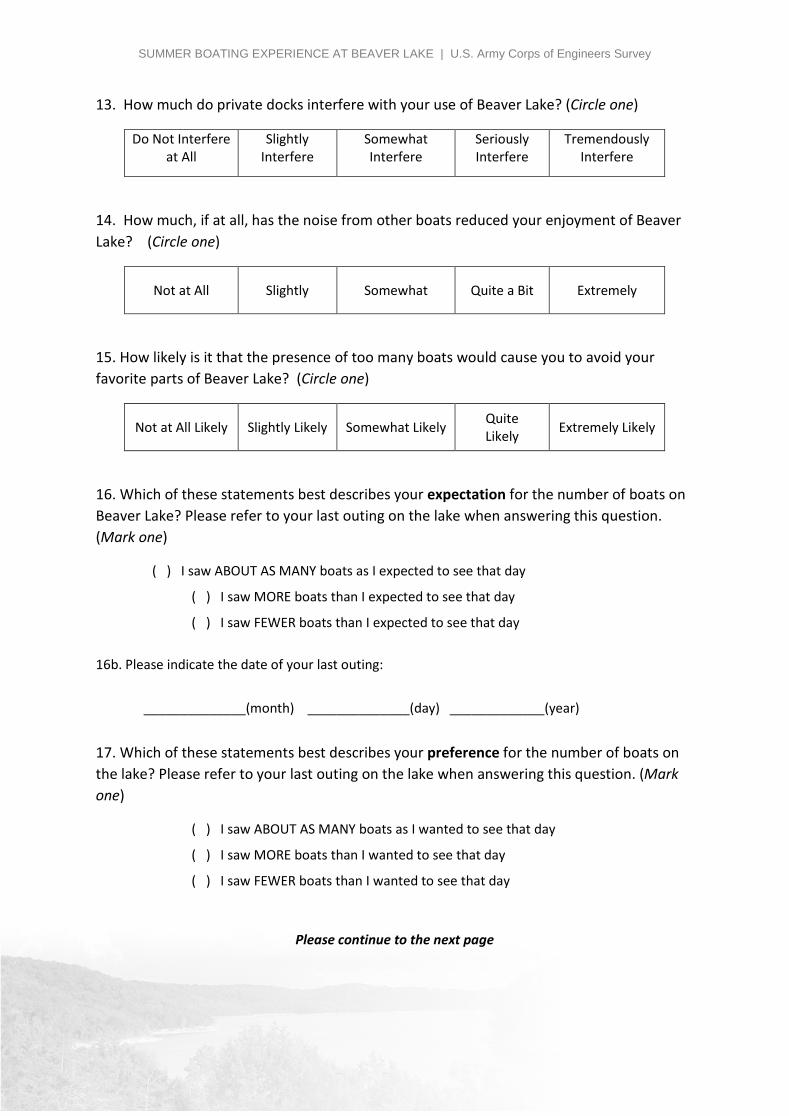
13. How much do private docks interfere with your use of Beaver Lake? (Circle one)
Do Not Interfere at All
Slightly Interfere
Somewhat Interfere
Seriously Interfere
Tremendously Interfere
14. How much, if at all, has the noise from other boats reduced your enjoyment of BeaverLake? (Circle one)
Not at All Slightly Somewhat Quite a Bit Extremely
15. How likely is it that the presence of too many boats would cause you to avoid yourfavorite parts of Beaver Lake? (Circle one)
Not at All Likely Slightly Likely Somewhat Likely Quite Likely Extremely Likely
16. Which of these statements best describes your expectation for the number of boats onBeaver Lake? Please refer to your last outing on the lake when answering this question.(Mark one)
( ) I saw ABOUT AS MANY boats as I expected to see that day
( ) I saw MORE boats than I expected to see that day
( ) I saw FEWER boats than I expected to see that day
16b. Please indicate the date of your last outing:
______________(month) ______________(day) _____________(year)
17. Which of these statements best describes your preference for the number of boats onthe lake? Please refer to your last outing on the lake when answering this question. (Markone)
( ) I saw ABOUT AS MANY boats as I wanted to see that day
( ) I saw MORE boats than I wanted to see that day
( ) I saw FEWER boats than I wanted to see that day
Please continue to the next page
SUMMER BOATING EXPERIENCE AT BEAVER LAKE | U.S. Army Corps of Engineers Survey
18. Please review the boating conditions depicted in the photos below. Which photo showsthe maximum number of boaters you could see at one time on Beaver Lake withoutthinking it was too crowded? (Circle one)
A B C D E I don’t think it looks crowded in
any of the photos
Please continue to the next page
SUMMER BOATING EXPERIENCE AT BEAVER LAKE | U.S. Army Corps of Engineers Survey
C. Basic Demographics
19. What is your gender? (Mark one) ( ) Female ( ) Male
20. What is your age? (Mark one)
( ) Under 18 ( ) 18 – 24 ( ) 25 – 44 ( ) 45 – 54 ( ) 55 – 64 ( ) 65+
21. Please indicate the highest level of education you have completed? (Mark one)
( ) Less than high school ( ) High school graduate/GED ( ) Vocational or Technical School certificate ( ) Associates Degree ( ) Some college ( ) Bachelor’s degree ( ) Graduate degree or professional degree (MA, MS, PhD, JD, MBA etc.)
22. Which category best represents your annual household income (before taxes) last year?(Mark one)
( ) Less than $24,999 ( ) $100,000-$149,999 ( ) $25,000-$34,999 ( ) $150,000-$199, 999 ( ) $35,000-$49,999 ( ) $200,000 or more ( ) $50,000-$74,999 ( ) Do not wish to answer ( ) $75,000-$99,999
Thank you for taking the time to complete this survey. Your responses are important and will help inform the
future management of Beaver Lake.
Please return your completed survey in the postage paid envelope provided.
Appendix B • Boater Survey Report
Beaver Lake Boating Carrying Capacity Study Page B-18
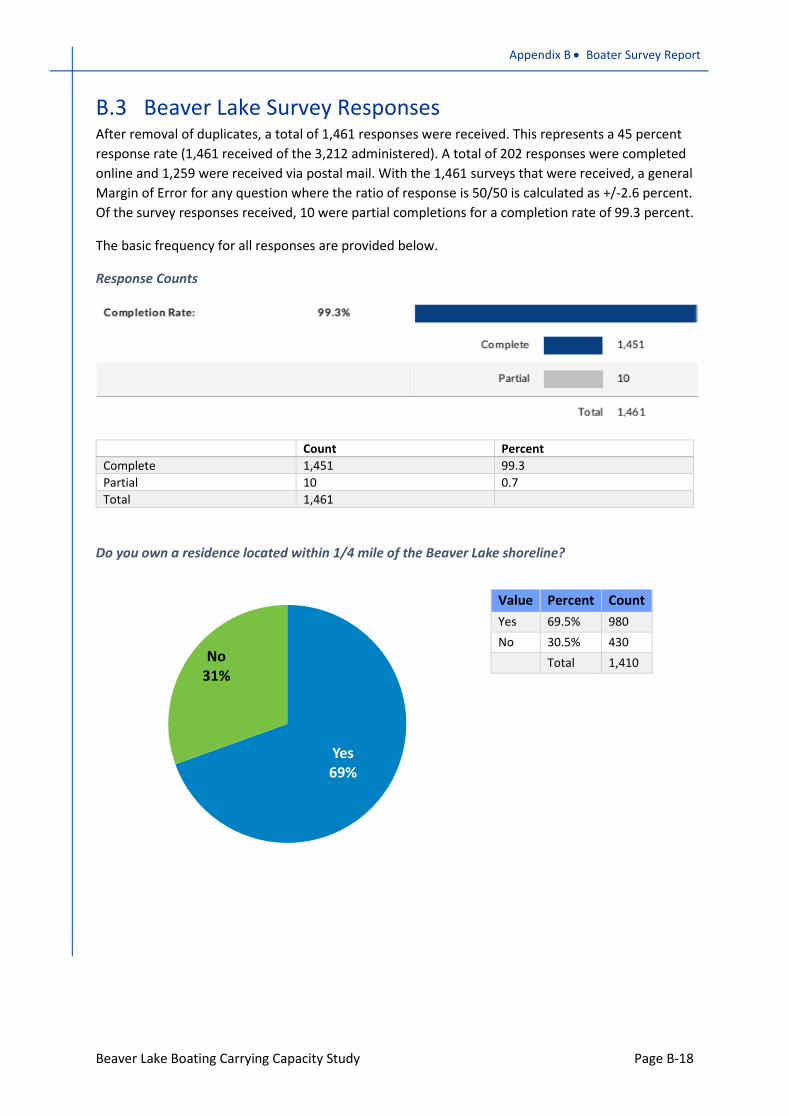
B.3 Beaver Lake Survey ResponsesAfter removal of duplicates, a total of 1,461 responses were received. This represents a 45 percent response rate (1,461 received of the 3,212 administered). A total of 202 responses were completed online and 1,259 were received via postal mail. With the 1,461 surveys that were received, a general Margin of Error for any question where the ratio of response is 50/50 is calculated as +/-2.6 percent. Of the survey responses received, 10 were partial completions for a completion rate of 99.3 percent.
The basic frequency for all responses are provided below.
Response Counts
Count Percent Complete 1,451 99.3 Partial 10 0.7 Total 1,461
Do you own a residence located within 1/4 mile of the Beaver Lake shoreline?
Value Percent Count Yes 69.5% 980 No 30.5% 430
Total 1,410
Yes69%
No31%
Appendix B • Boater Survey Report
Beaver Lake Boating Carrying Capacity Study Page B-19
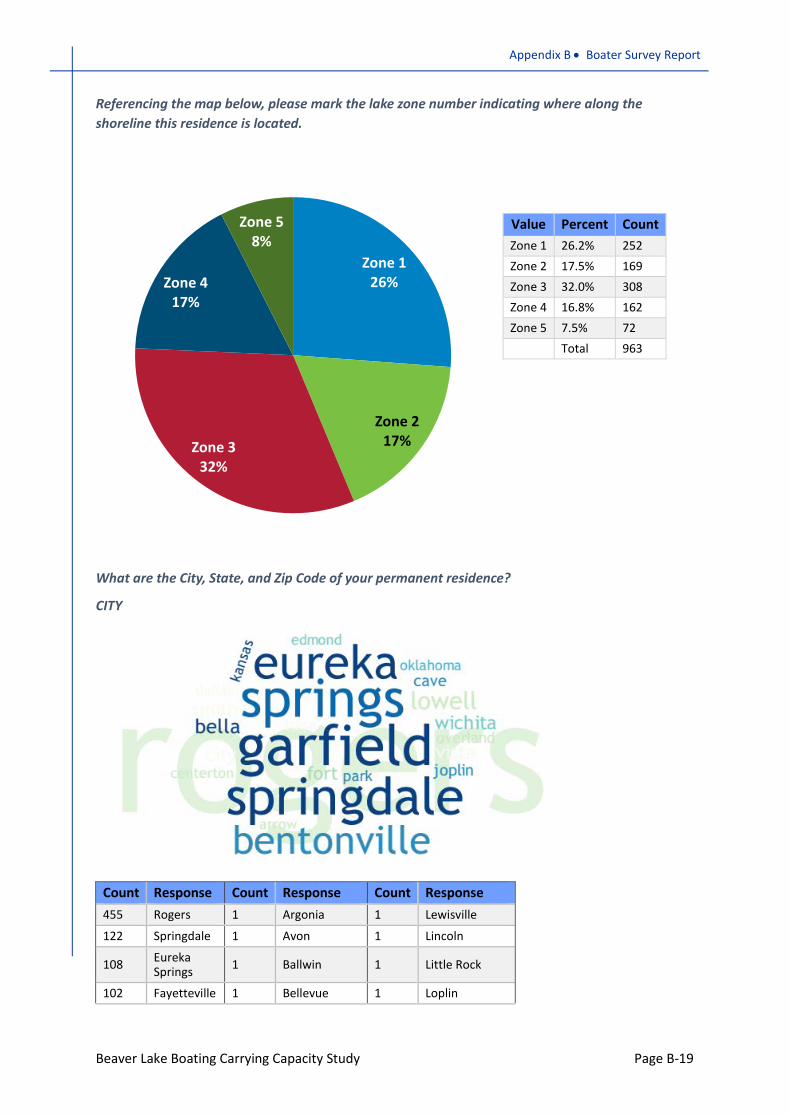
Referencing the map below, please mark the lake zone number indicating where along the shoreline this residence is located.
Value Percent Count Zone 1 26.2% 252 Zone 2 17.5% 169 Zone 3 32.0% 308 Zone 4 16.8% 162 Zone 5 7.5% 72
Total 963
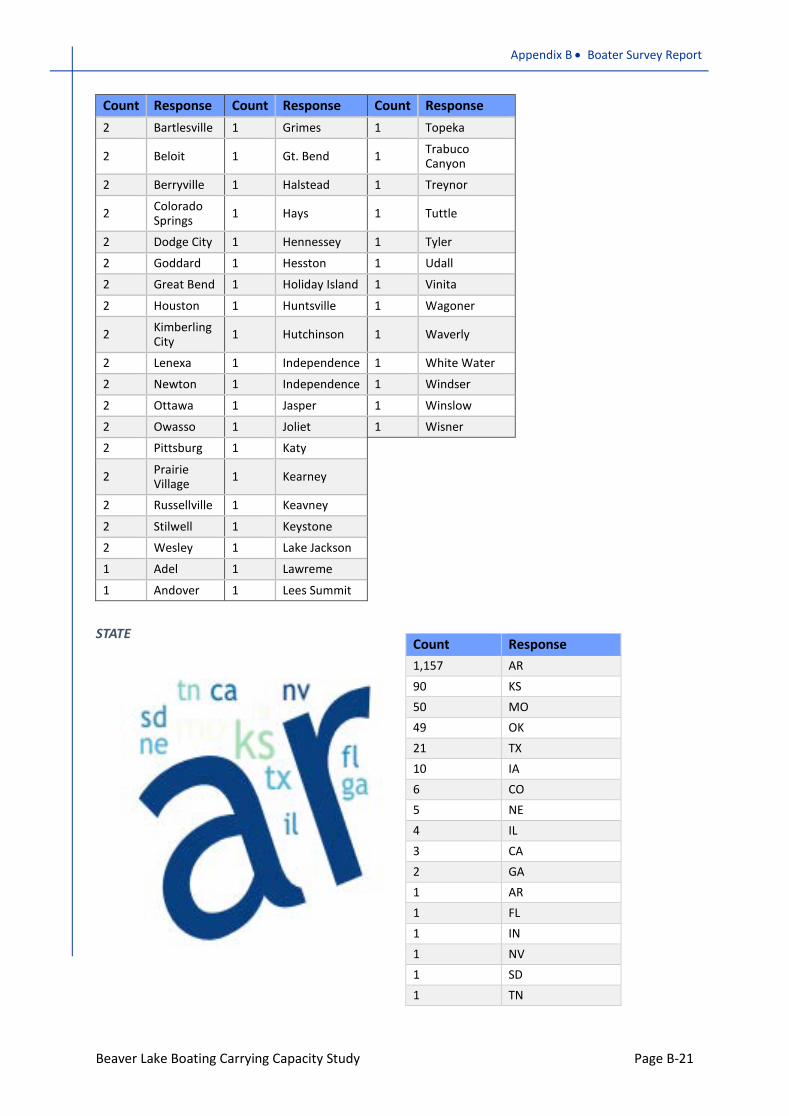
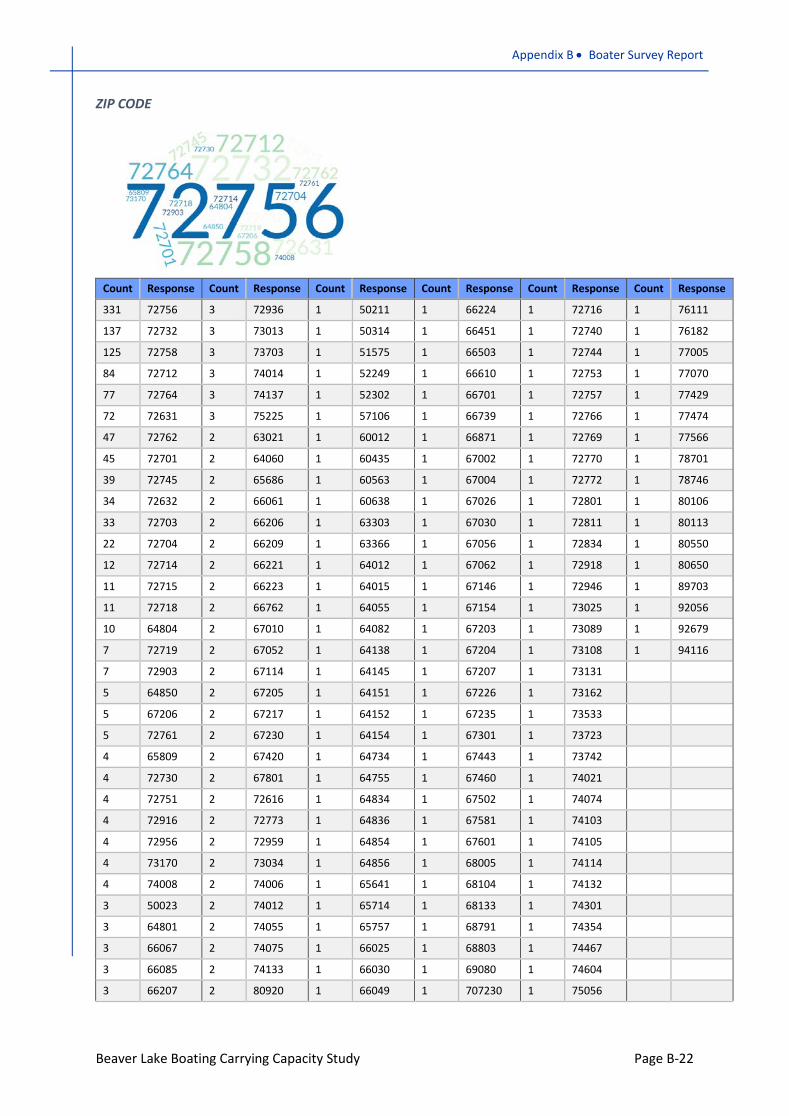
What are the City, State, and Zip Code of your permanent residence?
CITY
Count Response Count Response Count Response 455 Rogers 1 Argonia 1 Lewisville
122 Springdale 1 Avon 1 Lincoln
108 Eureka Springs 1 Ballwin 1 Little Rock
102 Fayetteville 1 Bellevue 1 Loplin
Zone 126%
Zone 217%Zone 3
32%
Zone 417%
Zone 58%
Appendix B • Boater Survey Report
Beaver Lake Boating Carrying Capacity Study Page B-20
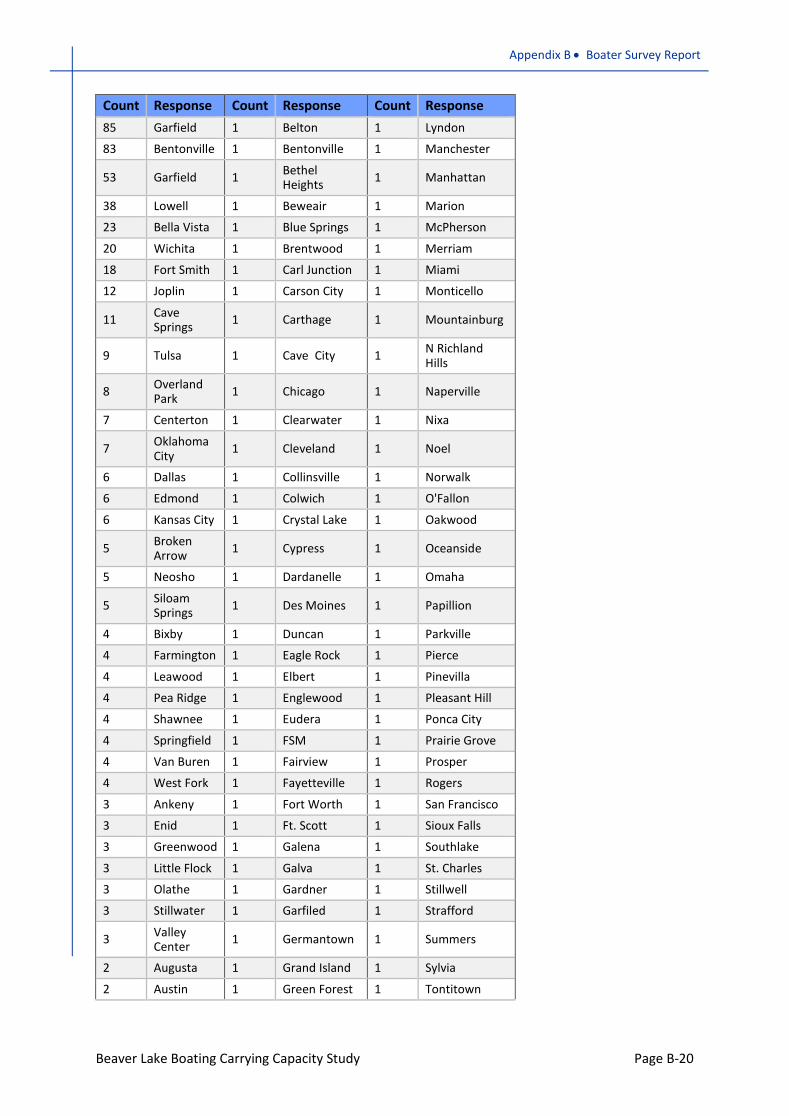
Count Response Count Response Count Response 85 Garfield 1 Belton 1 Lyndon
83 Bentonville 1 Bentonville 1 Manchester
53 Garfield 1 Bethel Heights 1 Manhattan
38 Lowell 1 Beweair 1 Marion
23 Bella Vista 1 Blue Springs 1 McPherson
20 Wichita 1 Brentwood 1 Merriam
18 Fort Smith 1 Carl Junction 1 Miami
12 Joplin 1 Carson City 1 Monticello
11 Cave Springs 1 Carthage 1 Mountainburg
9 Tulsa 1 Cave City 1 N Richland Hills
8 Overland Park 1 Chicago 1 Naperville
7 Centerton 1 Clearwater 1 Nixa
7 Oklahoma City 1 Cleveland 1 Noel
6 Dallas 1 Collinsville 1 Norwalk
6 Edmond 1 Colwich 1 O'Fallon
6 Kansas City 1 Crystal Lake 1 Oakwood
5 Broken Arrow 1 Cypress 1 Oceanside
5 Neosho 1 Dardanelle 1 Omaha
5 Siloam Springs 1 Des Moines 1 Papillion
4 Bixby 1 Duncan 1 Parkville
4 Farmington 1 Eagle Rock 1 Pierce
4 Leawood 1 Elbert 1 Pinevilla
4 Pea Ridge 1 Englewood 1 Pleasant Hill
4 Shawnee 1 Eudera 1 Ponca City
4 Springfield 1 FSM 1 Prairie Grove
4 Van Buren 1 Fairview 1 Prosper
4 West Fork 1 Fayetteville 1 Rogers
3 Ankeny 1 Fort Worth 1 San Francisco
3 Enid 1 Ft. Scott 1 Sioux Falls
3 Greenwood 1 Galena 1 Southlake
3 Little Flock 1 Galva 1 St. Charles
3 Olathe 1 Gardner 1 Stillwell
3 Stillwater 1 Garfiled 1 Strafford
3 Valley Center 1 Germantown 1 Summers
2 Augusta 1 Grand Island 1 Sylvia
2 Austin 1 Green Forest 1 Tontitown
Appendix B • Boater Survey Report
Beaver Lake Boating Carrying Capacity Study Page B-21
Count Response Count Response Count Response 2 Bartlesville 1 Grimes 1 Topeka
2 Beloit 1 Gt. Bend 1 Trabuco Canyon
2 Berryville 1 Halstead 1 Treynor
2 Colorado Springs 1 Hays 1 Tuttle
2 Dodge City 1 Hennessey 1 Tyler
2 Goddard 1 Hesston 1 Udall
2 Great Bend 1 Holiday Island 1 Vinita
2 Houston 1 Huntsville 1 Wagoner
2 Kimberling City 1 Hutchinson 1 Waverly
2 Lenexa 1 Independence 1 White Water
2 Newton 1 Independence 1 Windser
2 Ottawa 1 Jasper 1 Winslow
2 Owasso 1 Joliet 1 Wisner
2 Pittsburg 1 Katy
2 Prairie Village 1 Kearney
2 Russellville 1 Keavney
2 Stilwell 1 Keystone
2 Wesley 1 Lake Jackson
1 Adel 1 Lawreme
1 Andover 1 Lees Summit
STATE Count Response 1,157 AR 90 KS 50 MO 49 OK 21 TX 10 IA 6 CO 5 NE 4 IL 3 CA 2 GA 1 AR 1 FL 1 IN 1 NV 1 SD 1 TN
Appendix B • Boater Survey Report
Beaver Lake Boating Carrying Capacity Study Page B-22
ZIP CODE
Count Response Count Response Count Response Count Response Count Response Count Response
331 72756 3 72936 1 50211 1 66224 1 72716 1 76111
137 72732 3 73013 1 50314 1 66451 1 72740 1 76182
125 72758 3 73703 1 51575 1 66503 1 72744 1 77005
84 72712 3 74014 1 52249 1 66610 1 72753 1 77070
77 72764 3 74137 1 52302 1 66701 1 72757 1 77429
72 72631 3 75225 1 57106 1 66739 1 72766 1 77474
47 72762 2 63021 1 60012 1 66871 1 72769 1 77566
45 72701 2 64060 1 60435 1 67002 1 72770 1 78701
39 72745 2 65686 1 60563 1 67004 1 72772 1 78746
34 72632 2 66061 1 60638 1 67026 1 72801 1 80106
33 72703 2 66206 1 63303 1 67030 1 72811 1 80113
22 72704 2 66209 1 63366 1 67056 1 72834 1 80550
12 72714 2 66221 1 64012 1 67062 1 72918 1 80650
11 72715 2 66223 1 64015 1 67146 1 72946 1 89703
11 72718 2 66762 1 64055 1 67154 1 73025 1 92056
10 64804 2 67010 1 64082 1 67203 1 73089 1 92679
7 72719 2 67052 1 64138 1 67204 1 73108 1 94116
7 72903 2 67114 1 64145 1 67207 1 73131
5 64850 2 67205 1 64151 1 67226 1 73162
5 67206 2 67217 1 64152 1 67235 1 73533
5 72761 2 67230 1 64154 1 67301 1 73723
4 65809 2 67420 1 64734 1 67443 1 73742
4 72730 2 67801 1 64755 1 67460 1 74021
4 72751 2 72616 1 64834 1 67502 1 74074
4 72916 2 72773 1 64836 1 67581 1 74103
4 72956 2 72959 1 64854 1 67601 1 74105
4 73170 2 73034 1 64856 1 68005 1 74114
4 74008 2 74006 1 65641 1 68104 1 74132
3 50023 2 74012 1 65714 1 68133 1 74301
3 64801 2 74055 1 65757 1 68791 1 74354
3 66067 2 74075 1 66025 1 68803 1 74467
3 66085 2 74133 1 66030 1 69080 1 74604
3 66207 2 80920 1 66049 1 707230 1 75056
Appendix B • Boater Survey Report
Beaver Lake Boating Carrying Capacity Study Page B-23
Count Response Count Response Count Response Count Response Count Response Count Response
3 66226 1 30215 1 66109 1 71655 1 75069
3 67147 1 30566 1 66202 1 72003 1 75078
3 67212 1 33756 1 66205 1 72201 1 75206
3 67530 1 38139 1 66208 1 72362 1 75214
3 72774 1 46123 1 66215 1 72521 1 75248
3 72901 1 50003 1 66216 1 72634 1 75707
3 72908 1 50111 1 66220 1 72638 1 7609
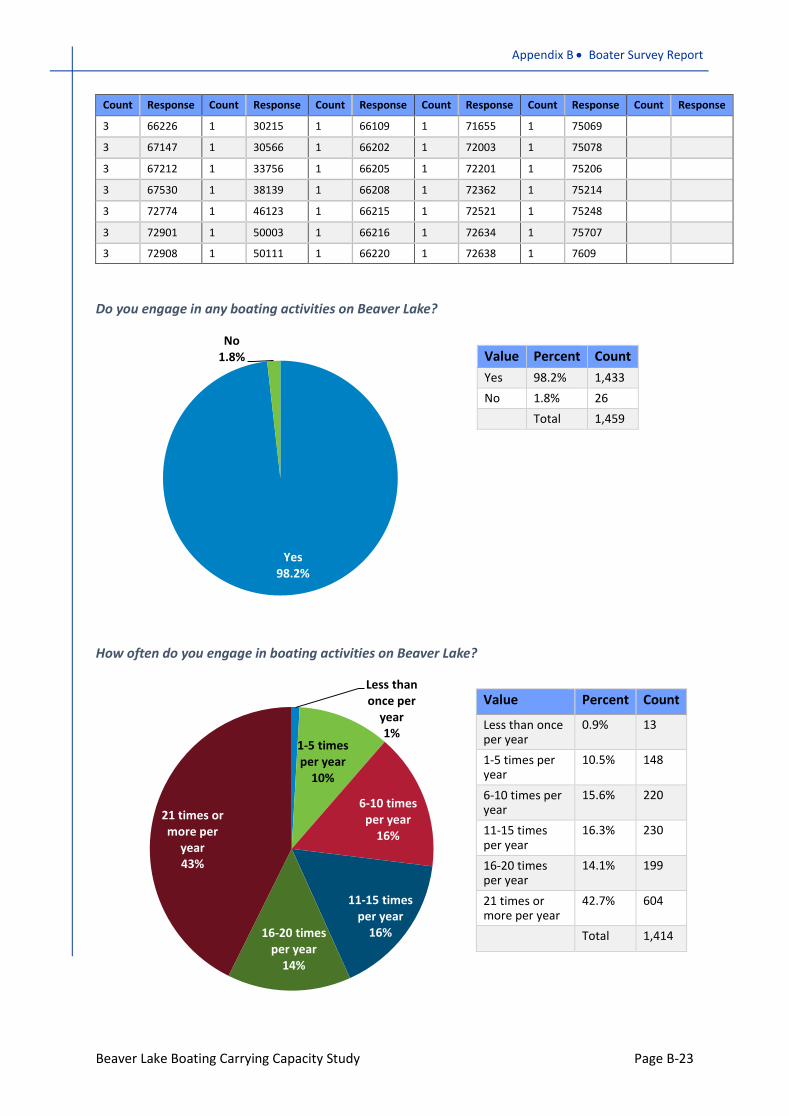
Do you engage in any boating activities on Beaver Lake?
Value Percent Count Yes 98.2% 1,433 No 1.8% 26
Total 1,459
How often do you engage in boating activities on Beaver Lake?
Value Percent Count
Less than once per year
0.9% 13
1-5 times peryear
10.5% 148
6-10 times peryear
15.6% 220
11-15 timesper year
16.3% 230
16-20 timesper year
14.1% 199
21 times or more per year
42.7% 604
Total 1,414
Yes98.2%
No1.8%
Less than once per
year1%
1-5 timesper year
10%
6-10 timesper year
16%
11-15 timesper year
16%16-20 timesper year
14%
21 times or more per
year43%
Appendix B • Boater Survey Report
Beaver Lake Boating Carrying Capacity Study Page B-24
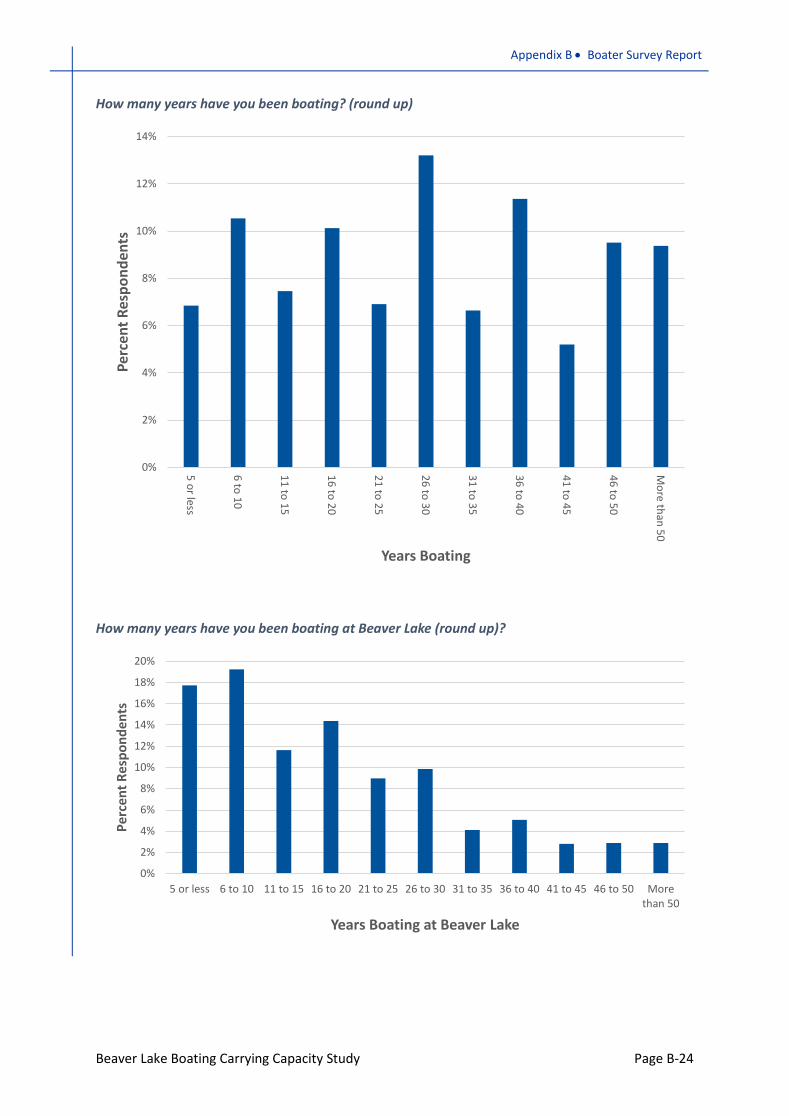
How many years have you been boating? (round up)
How many years have you been boating at Beaver Lake (round up)?
0%
2%
4%
6%
8%
10%
12%
14%
5 or less
6 to 10
11 to 15
16 to 20
21 to 25
26 to 30
31 to 35
36 to 40
41 to 45
46 to 50
More than 50
Perc
ent R
espo
nden
ts
Years Boating
0%
2%
4%
6%
8%
10%
12%
14%
16%
18%
20%
5 or less 6 to 10 11 to 15 16 to 20 21 to 25 26 to 30 31 to 35 36 to 40 41 to 45 46 to 50 Morethan 50
Perc
ent R
espo
nden
ts
Years Boating at Beaver Lake
Appendix B • Boater Survey Report
Beaver Lake Boating Carrying Capacity Study Page B-25
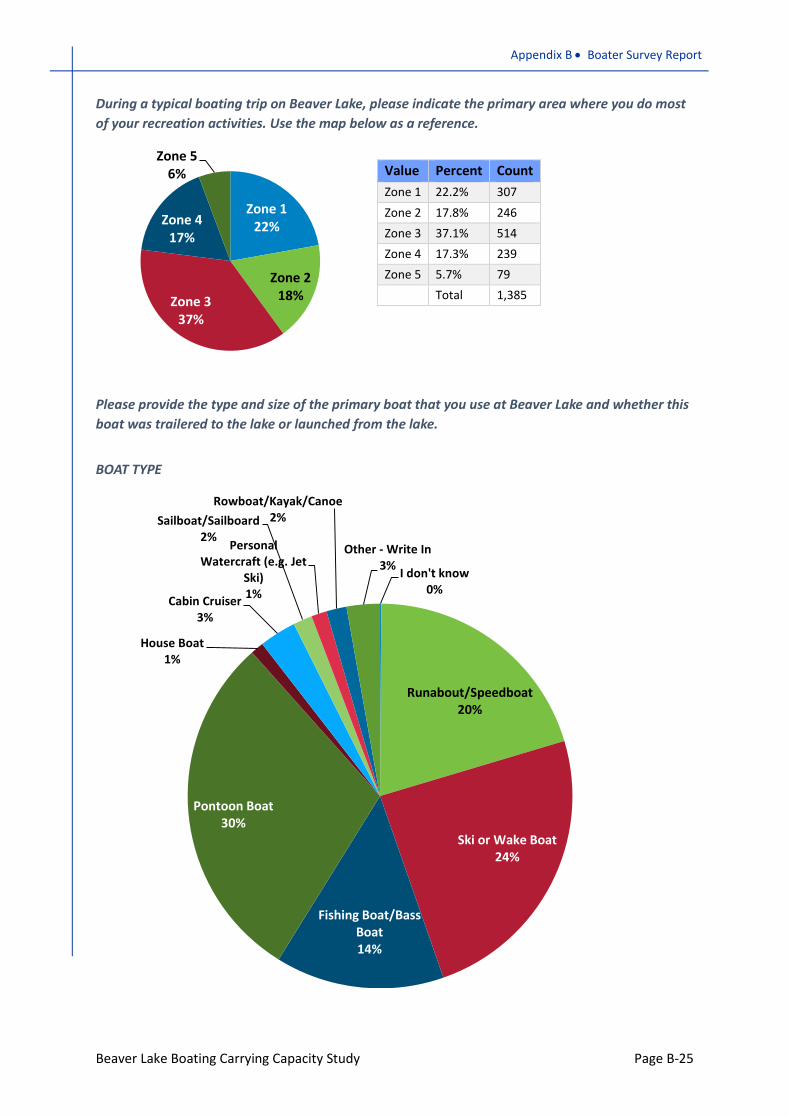
During a typical boating trip on Beaver Lake, please indicate the primary area where you do most of your recreation activities. Use the map below as a reference.
Value Percent Count Zone 1 22.2% 307 Zone 2 17.8% 246 Zone 3 37.1% 514 Zone 4 17.3% 239 Zone 5 5.7% 79
Total 1,385
Please provide the type and size of the primary boat that you use at Beaver Lake and whether this boat was trailered to the lake or launched from the lake.
BOAT TYPE
I don't know0%
Runabout/Speedboat20%
Ski or Wake Boat24%
Fishing Boat/Bass Boat14%
Pontoon Boat30%
House Boat1%
Cabin Cruiser3%
Sailboat/Sailboard2% PersonalWatercraft (e.g. Jet
Ski)1%
Rowboat/Kayak/Canoe2%
Other - Write In3%
Zone 122%
Zone 218%Zone 3
37%
Zone 417%
Zone 56%
Appendix B • Boater Survey Report
Beaver Lake Boating Carrying Capacity Study Page B-26
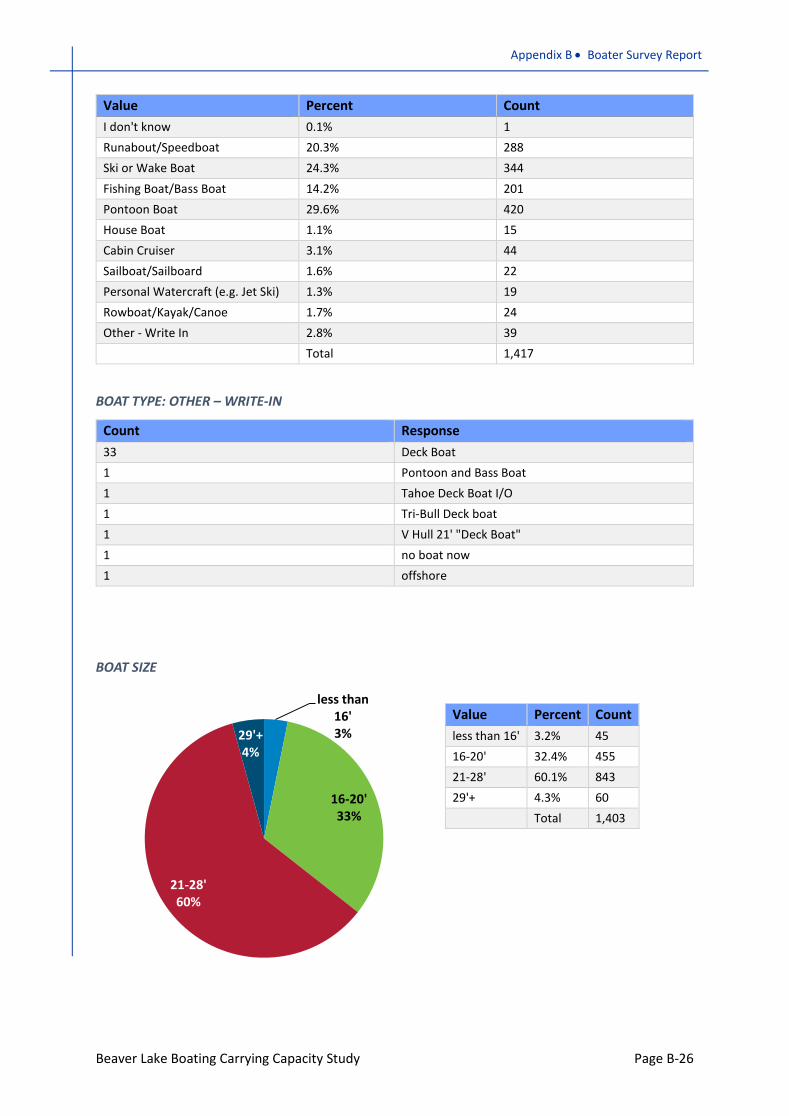
Value Percent Count I don't know 0.1% 1 Runabout/Speedboat 20.3% 288 Ski or Wake Boat 24.3% 344 Fishing Boat/Bass Boat 14.2% 201 Pontoon Boat 29.6% 420 House Boat 1.1% 15 Cabin Cruiser 3.1% 44 Sailboat/Sailboard 1.6% 22 Personal Watercraft (e.g. Jet Ski) 1.3% 19 Rowboat/Kayak/Canoe 1.7% 24 Other - Write In 2.8% 39
Total 1,417
BOAT TYPE: OTHER – WRITE-IN
Count Response 33 Deck Boat 1 Pontoon and Bass Boat 1 Tahoe Deck Boat I/O 1 Tri-Bull Deck boat 1 V Hull 21' "Deck Boat" 1 no boat now 1 offshore
BOAT SIZE
Value Percent Count less than 16' 3.2% 45 16-20' 32.4% 455 21-28' 60.1% 843 29'+ 4.3% 60
Total 1,403
less than 16'3%
16-20'33%
21-28'60%
29'+4%
Appendix B • Boater Survey Report
Beaver Lake Boating Carrying Capacity Study Page B-27
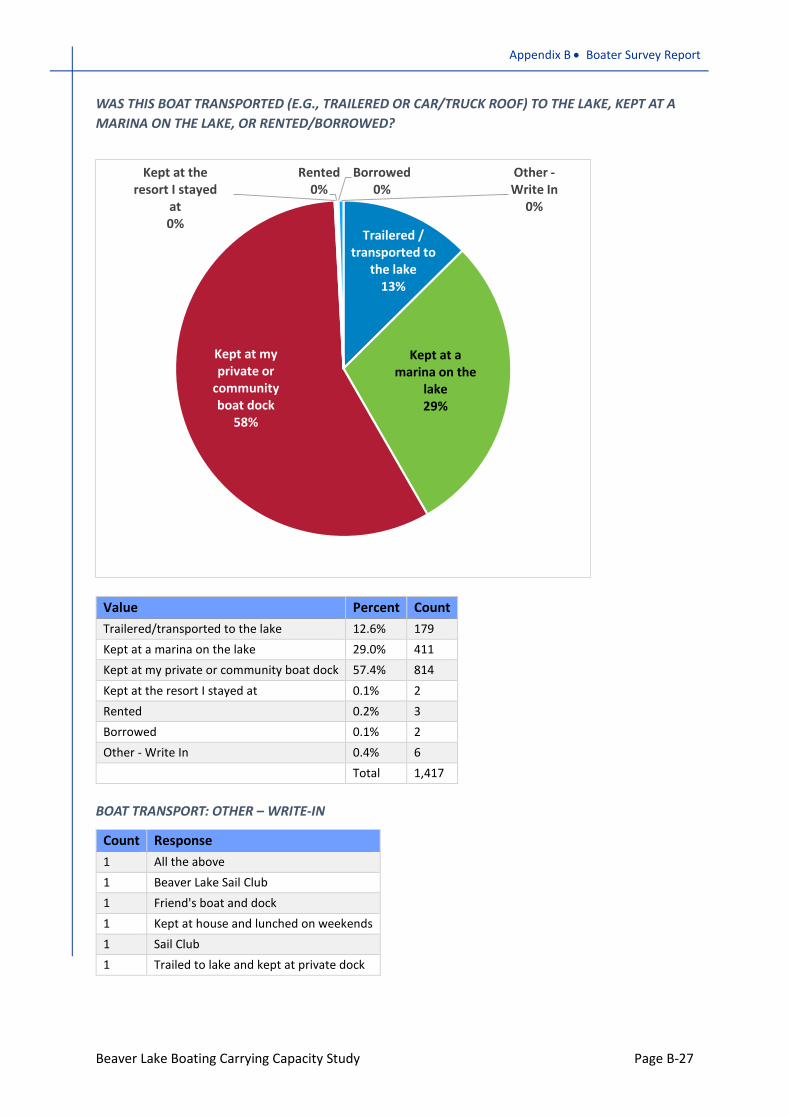
WAS THIS BOAT TRANSPORTED (E.G., TRAILERED OR CAR/TRUCK ROOF) TO THE LAKE, KEPT AT A MARINA ON THE LAKE, OR RENTED/BORROWED?
Value Percent Count Trailered/transported to the lake 12.6% 179 Kept at a marina on the lake 29.0% 411 Kept at my private or community boat dock 57.4% 814 Kept at the resort I stayed at 0.1% 2 Rented 0.2% 3 Borrowed 0.1% 2 Other - Write In 0.4% 6
Total 1,417
BOAT TRANSPORT: OTHER – WRITE-IN
Count Response 1 All the above 1 Beaver Lake Sail Club 1 Friend's boat and dock 1 Kept at house and lunched on weekends 1 Sail Club 1 Trailed to lake and kept at private dock
Trailered / transported to
the lake 13%
Kept at a marina on the
lake 29%
Kept at my private or
community boat dock
58%
Kept at the resort I stayed
at 0%
Rented 0%
Borrowed 0%
Other -Write In
0%
Appendix B • Boater Survey Report
Beaver Lake Boating Carrying Capacity Study Page B-28
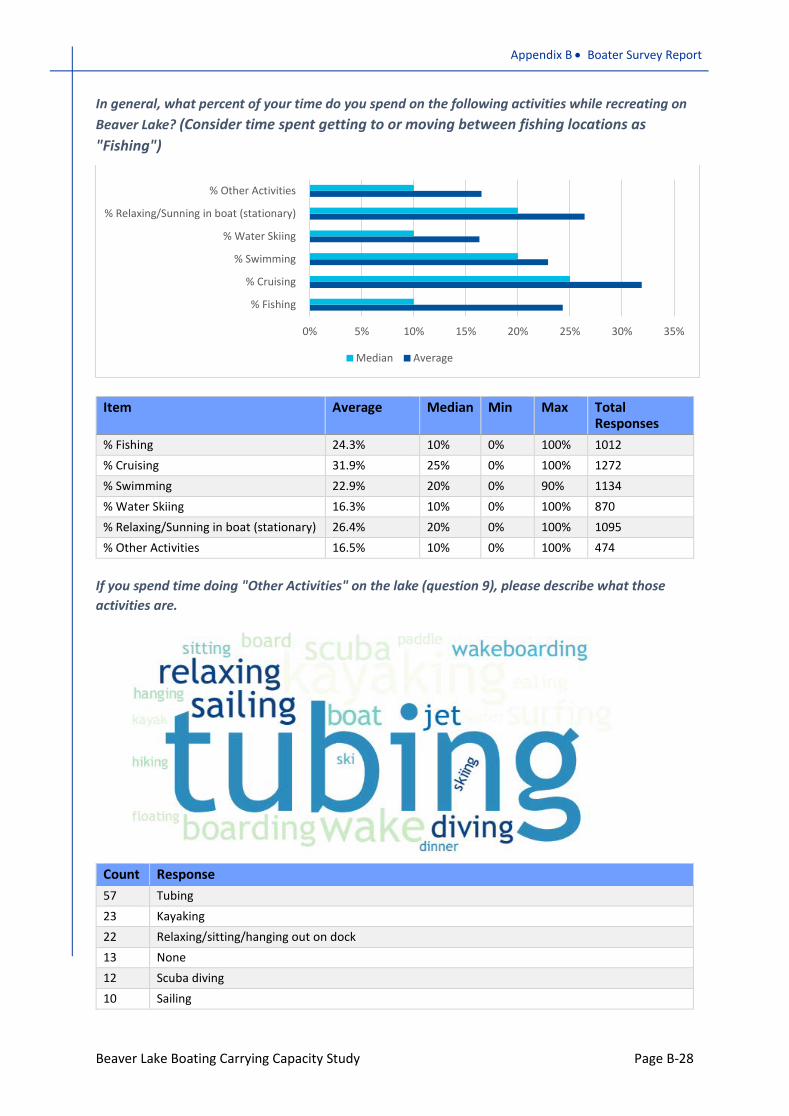
In general, what percent of your time do you spend on the following activities while recreating on Beaver Lake? (Consider time spent getting to or moving between fishing locations as "Fishing")
Item Average Median Min Max Total Responses
% Fishing 24.3% 10% 0% 100% 1012 % Cruising 31.9% 25% 0% 100% 1272 % Swimming 22.9% 20% 0% 90% 1134 % Water Skiing 16.3% 10% 0% 100% 870 % Relaxing/Sunning in boat (stationary) 26.4% 20% 0% 100% 1095 % Other Activities 16.5% 10% 0% 100% 474
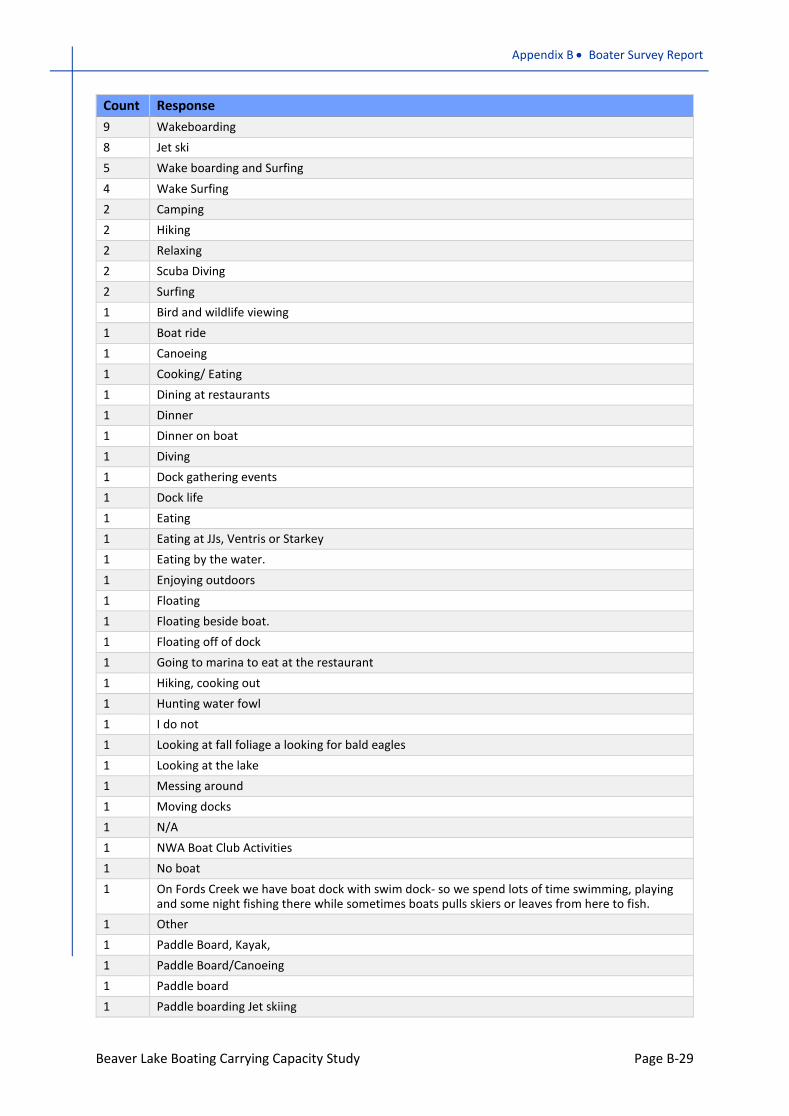
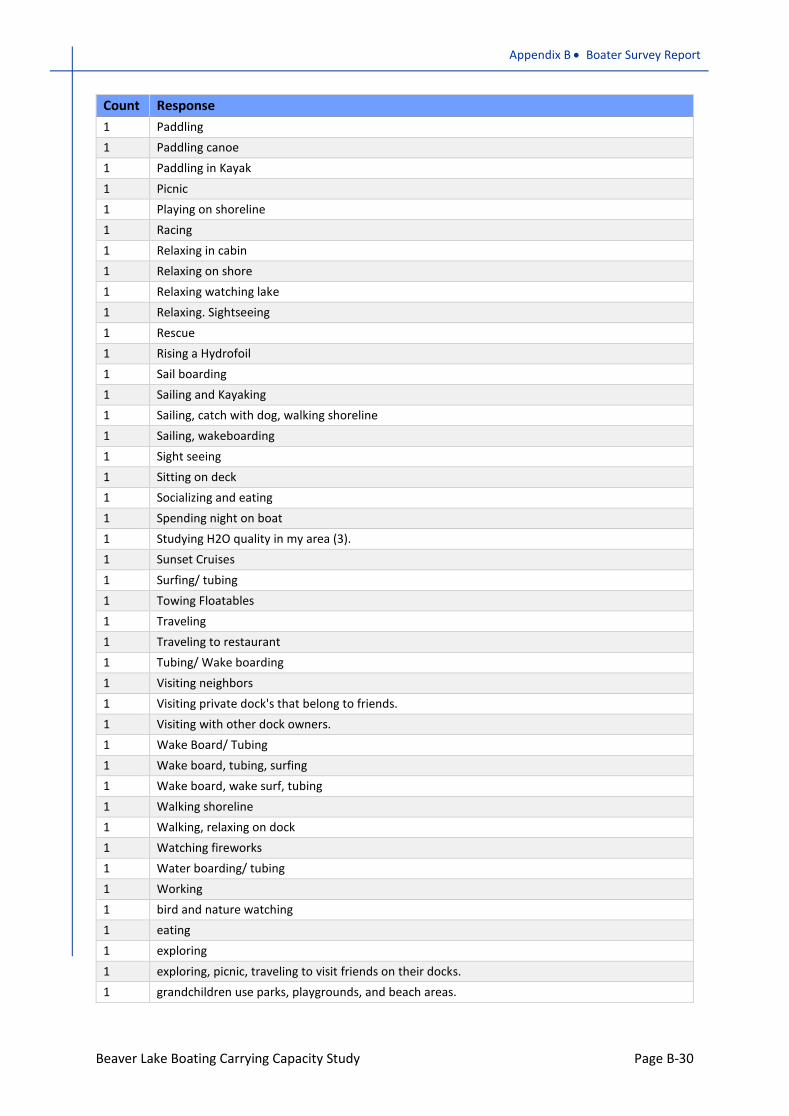
If you spend time doing "Other Activities" on the lake (question 9), please describe what those activities are.
Count Response 57 Tubing 23 Kayaking 22 Relaxing/sitting/hanging out on dock 13 None 12 Scuba diving 10 Sailing
0% 5% 10% 15% 20% 25% 30% 35%
% Fishing
% Cruising
% Swimming
% Water Skiing
% Relaxing/Sunning in boat (stationary)
% Other Activities
Median Average
Appendix B • Boater Survey Report
Beaver Lake Boating Carrying Capacity Study Page B-29
Count Response 9 Wakeboarding 8 Jet ski 5 Wake boarding and Surfing 4 Wake Surfing 2 Camping 2 Hiking 2 Relaxing 2 Scuba Diving 2 Surfing 1 Bird and wildlife viewing 1 Boat ride 1 Canoeing 1 Cooking/ Eating 1 Dining at restaurants 1 Dinner 1 Dinner on boat 1 Diving 1 Dock gathering events 1 Dock life 1 Eating 1 Eating at JJs, Ventris or Starkey 1 Eating by the water. 1 Enjoying outdoors 1 Floating 1 Floating beside boat. 1 Floating off of dock 1 Going to marina to eat at the restaurant 1 Hiking, cooking out 1 Hunting water fowl 1 I do not 1 Looking at fall foliage a looking for bald eagles 1 Looking at the lake 1 Messing around 1 Moving docks 1 N/A 1 NWA Boat Club Activities 1 No boat 1 On Fords Creek we have boat dock with swim dock- so we spend lots of time swimming, playing
and some night fishing there while sometimes boats pulls skiers or leaves from here to fish. 1 Other 1 Paddle Board, Kayak, 1 Paddle Board/Canoeing 1 Paddle board 1 Paddle boarding Jet skiing
Appendix B • Boater Survey Report
Beaver Lake Boating Carrying Capacity Study Page B-30
Count Response 1 Paddling 1 Paddling canoe 1 Paddling in Kayak 1 Picnic 1 Playing on shoreline 1 Racing 1 Relaxing in cabin 1 Relaxing on shore 1 Relaxing watching lake 1 Relaxing. Sightseeing 1 Rescue 1 Rising a Hydrofoil 1 Sail boarding 1 Sailing and Kayaking 1 Sailing, catch with dog, walking shoreline 1 Sailing, wakeboarding 1 Sight seeing 1 Sitting on deck 1 Socializing and eating 1 Spending night on boat 1 Studying H2O quality in my area (3). 1 Sunset Cruises 1 Surfing/ tubing 1 Towing Floatables 1 Traveling 1 Traveling to restaurant 1 Tubing/ Wake boarding 1 Visiting neighbors 1 Visiting private dock's that belong to friends. 1 Visiting with other dock owners. 1 Wake Board/ Tubing 1 Wake board, tubing, surfing 1 Wake board, wake surf, tubing 1 Walking shoreline 1 Walking, relaxing on dock 1 Watching fireworks 1 Water boarding/ tubing 1 Working 1 bird and nature watching 1 eating 1 exploring 1 exploring, picnic, traveling to visit friends on their docks. 1 grandchildren use parks, playgrounds, and beach areas.
Appendix B • Boater Survey Report
Beaver Lake Boating Carrying Capacity Study Page B-31
Count Response 1 heading to dinner 1 kayaking, birding 1 maintaining my boat dock 1 other activities for us is tubing or dining/marina time 1 picnics 1 sailing 1 surfing 1 swimming, canoeing, dock fishing Jet Skiing 1 towing water towable 1 wake boarding, surfing, tubing, knee boarding 1 wakeboarding/tubing
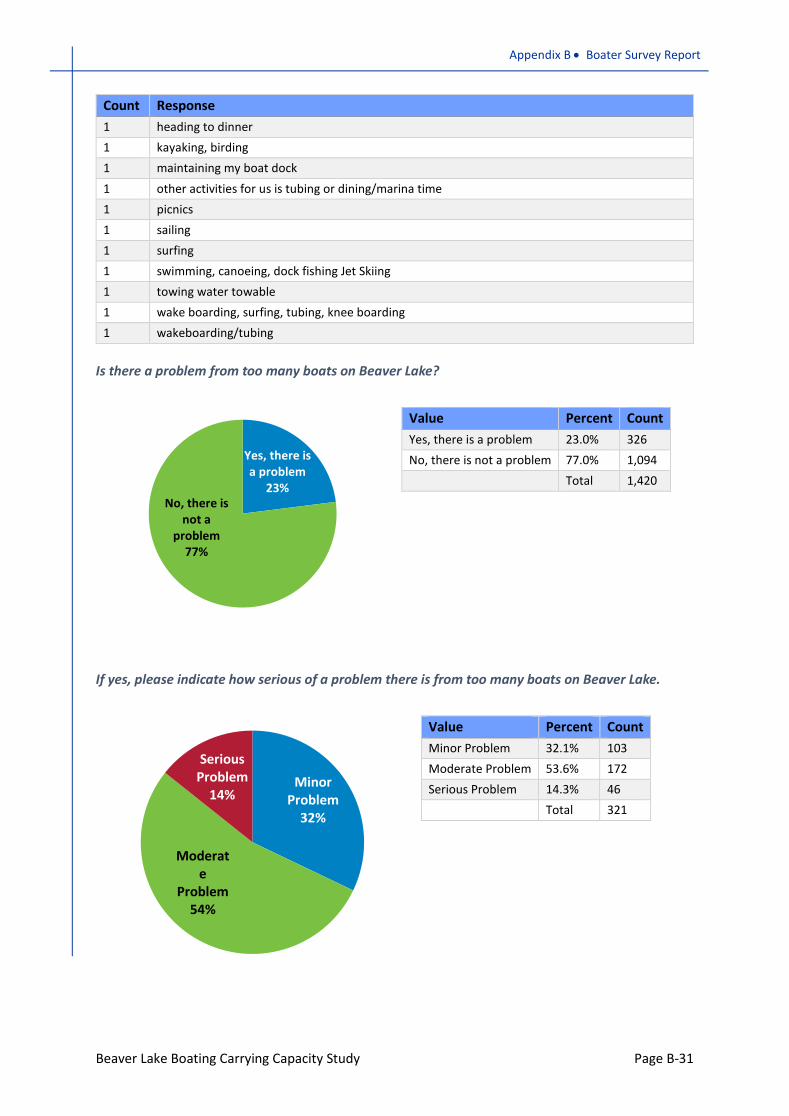
Is there a problem from too many boats on Beaver Lake?
Value Percent Count Yes, there is a problem 23.0% 326 No, there is not a problem 77.0% 1,094
Total 1,420
If yes, please indicate how serious of a problem there is from too many boats on Beaver Lake.
Value Percent Count Minor Problem 32.1% 103 Moderate Problem 53.6% 172 Serious Problem 14.3% 46
Total 321
Yes, there is a problem
23%No, there is
not a problem
77%
Minor Problem
32%
Moderate
Problem54%
Serious Problem
14%
Appendix B • Boater Survey Report
Beaver Lake Boating Carrying Capacity Study Page B-32
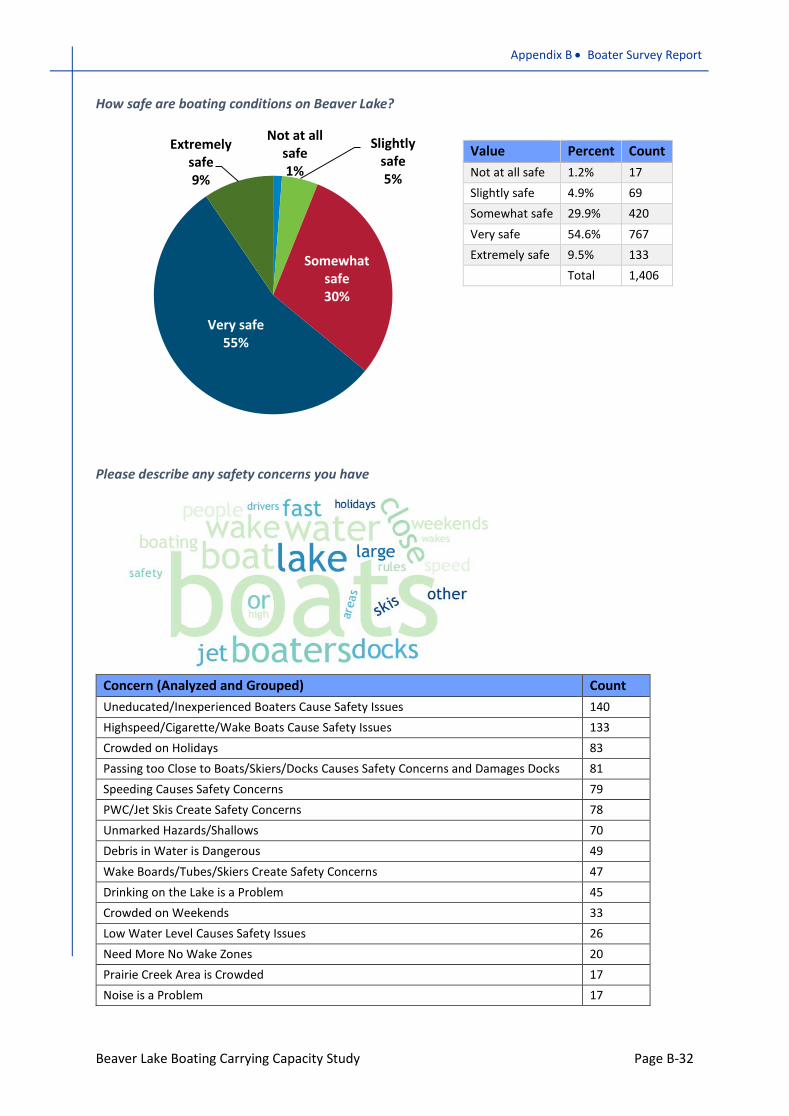
How safe are boating conditions on Beaver Lake?
Value Percent Count Not at all safe 1.2% 17 Slightly safe 4.9% 69 Somewhat safe 29.9% 420 Very safe 54.6% 767 Extremely safe 9.5% 133
Total 1,406
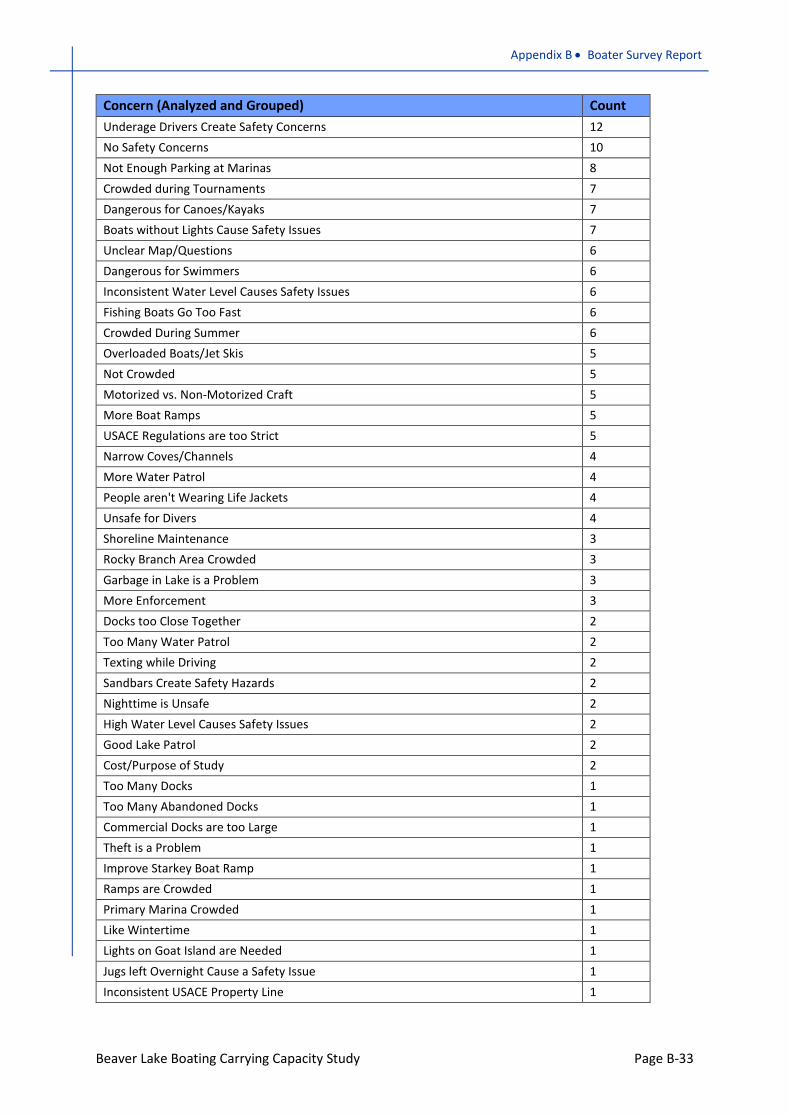
Please describe any safety concerns you have
Concern (Analyzed and Grouped) Count Uneducated/Inexperienced Boaters Cause Safety Issues 140 Highspeed/Cigarette/Wake Boats Cause Safety Issues 133 Crowded on Holidays 83 Passing too Close to Boats/Skiers/Docks Causes Safety Concerns and Damages Docks 81 Speeding Causes Safety Concerns 79 PWC/Jet Skis Create Safety Concerns 78 Unmarked Hazards/Shallows 70 Debris in Water is Dangerous 49 Wake Boards/Tubes/Skiers Create Safety Concerns 47 Drinking on the Lake is a Problem 45 Crowded on Weekends 33 Low Water Level Causes Safety Issues 26 Need More No Wake Zones 20 Prairie Creek Area is Crowded 17 Noise is a Problem 17
Not at all safe1%
Slightly safe5%
Somewhat safe30%
Very safe55%
Extremely safe9%
Appendix B • Boater Survey Report
Beaver Lake Boating Carrying Capacity Study Page B-33
Concern (Analyzed and Grouped) Count Underage Drivers Create Safety Concerns 12 No Safety Concerns 10 Not Enough Parking at Marinas 8 Crowded during Tournaments 7 Dangerous for Canoes/Kayaks 7 Boats without Lights Cause Safety Issues 7 Unclear Map/Questions 6 Dangerous for Swimmers 6 Inconsistent Water Level Causes Safety Issues 6 Fishing Boats Go Too Fast 6 Crowded During Summer 6 Overloaded Boats/Jet Skis 5 Not Crowded 5 Motorized vs. Non-Motorized Craft 5 More Boat Ramps 5 USACE Regulations are too Strict 5 Narrow Coves/Channels 4 More Water Patrol 4 People aren't Wearing Life Jackets 4 Unsafe for Divers 4 Shoreline Maintenance 3 Rocky Branch Area Crowded 3 Garbage in Lake is a Problem 3 More Enforcement 3 Docks too Close Together 2 Too Many Water Patrol 2 Texting while Driving 2 Sandbars Create Safety Hazards 2 Nighttime is Unsafe 2 High Water Level Causes Safety Issues 2 Good Lake Patrol 2 Cost/Purpose of Study 2 Too Many Docks 1 Too Many Abandoned Docks 1 Commercial Docks are too Large 1 Theft is a Problem 1 Improve Starkey Boat Ramp 1 Ramps are Crowded 1 Primary Marina Crowded 1 Like Wintertime 1 Lights on Goat Island are Needed 1 Jugs left Overnight Cause a Safety Issue 1 Inconsistent USACE Property Line 1
Appendix B • Boater Survey Report
Beaver Lake Boating Carrying Capacity Study Page B-34
Concern (Analyzed and Grouped) Count Future Crowding is a Concern 1 Don't Reduce Number of Boats 1 Dock at JJ Restaurant is Unsafe 1 Cliff Jumping is Unsafe 1 Alice Walton at Camp War Eagle is a Problem 1 Buoys at Boat Ramps Needed 1 Airplanes Landing/Flying Over Lake Cause Safety Issue 1
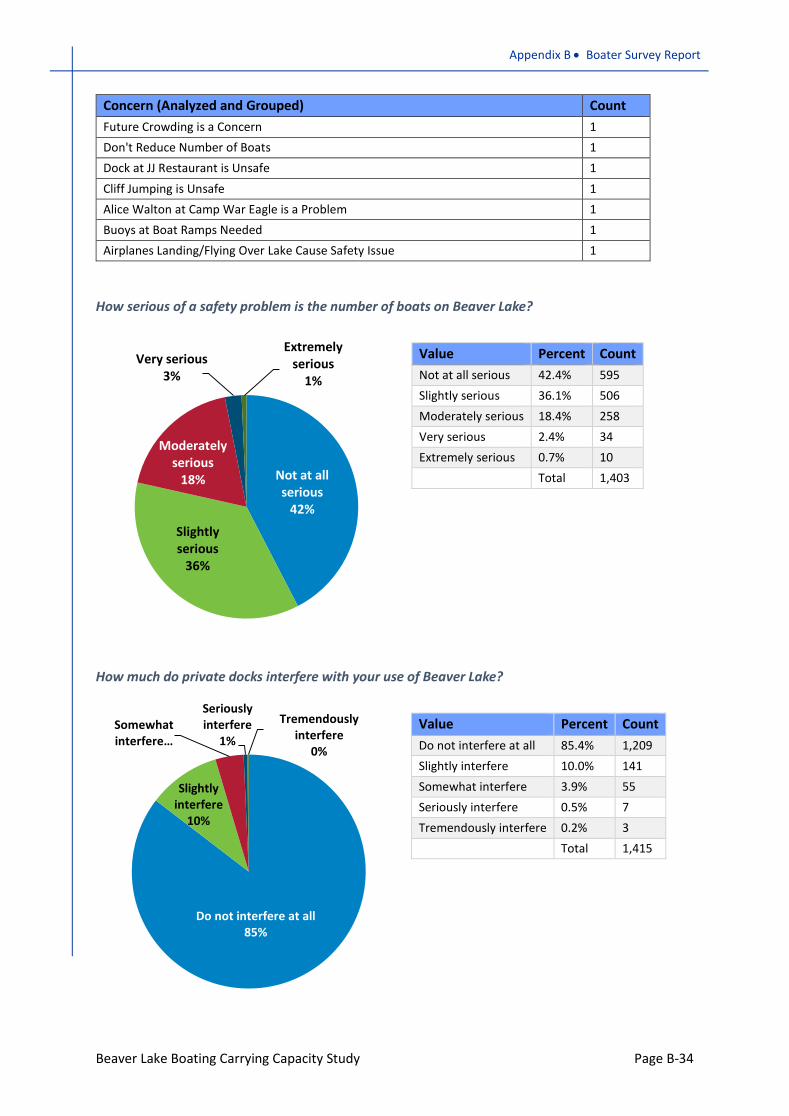
How serious of a safety problem is the number of boats on Beaver Lake?
Value Percent Count Not at all serious 42.4% 595 Slightly serious 36.1% 506 Moderately serious 18.4% 258 Very serious 2.4% 34 Extremely serious 0.7% 10
Total 1,403
How much do private docks interfere with your use of Beaver Lake?
Value Percent Count Do not interfere at all 85.4% 1,209 Slightly interfere 10.0% 141 Somewhat interfere 3.9% 55 Seriously interfere 0.5% 7 Tremendously interfere 0.2% 3
Total 1,415
Not at all serious
42%
Slightly serious
36%
Moderately serious
18%
Very serious3%
Extremely serious
1%
Do not interfere at all85%
Slightly interfere
10%
Somewhat interfere…
Seriously interfere
1%
Tremendously interfere
0%
Appendix B • Boater Survey Report
Beaver Lake Boating Carrying Capacity Study Page B-35
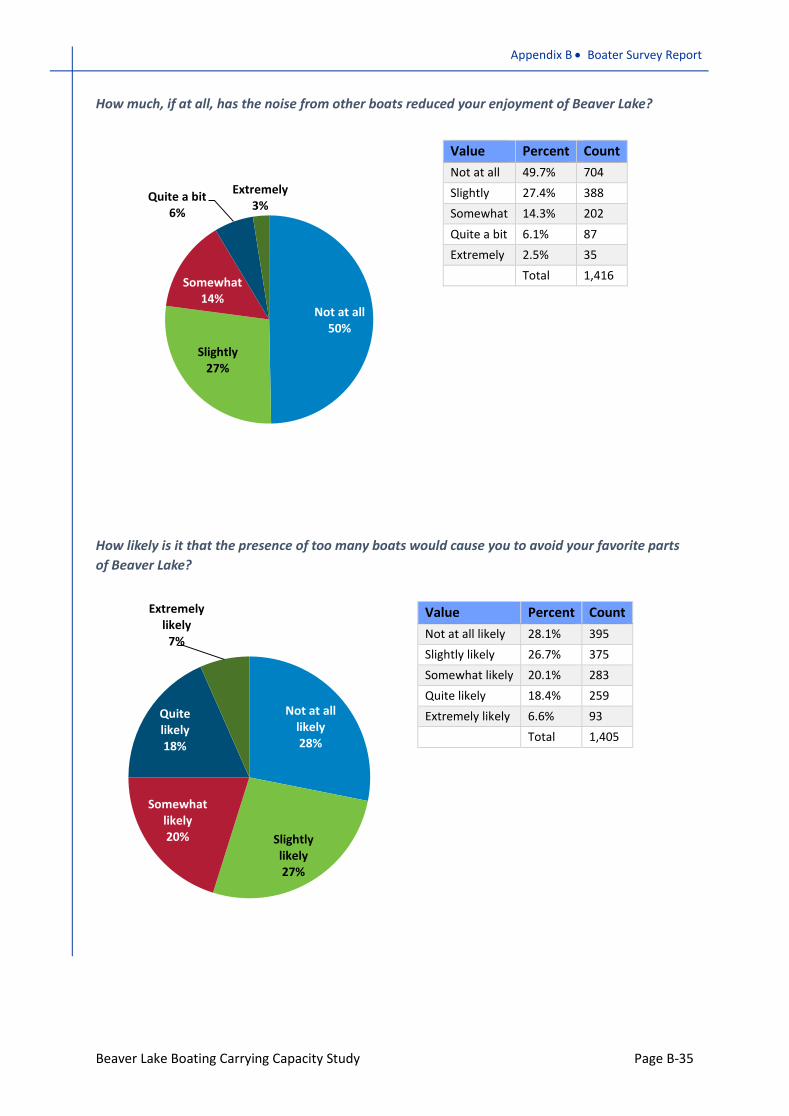
How much, if at all, has the noise from other boats reduced your enjoyment of Beaver Lake?
Value Percent Count Not at all 49.7% 704 Slightly 27.4% 388 Somewhat 14.3% 202 Quite a bit 6.1% 87 Extremely 2.5% 35
Total 1,416
How likely is it that the presence of too many boats would cause you to avoid your favorite parts of Beaver Lake?
Value Percent Count Not at all likely 28.1% 395 Slightly likely 26.7% 375 Somewhat likely 20.1% 283 Quite likely 18.4% 259 Extremely likely 6.6% 93
Total 1,405
Not at all50%
Slightly27%
Somewhat14%
Quite a bit6%
Extremely3%
Not at all likely28%
Slightly likely27%
Somewhat likely20%
Quite likely18%
Extremely likely
7%
Appendix B • Boater Survey Report
Beaver Lake Boating Carrying Capacity Study Page B-36
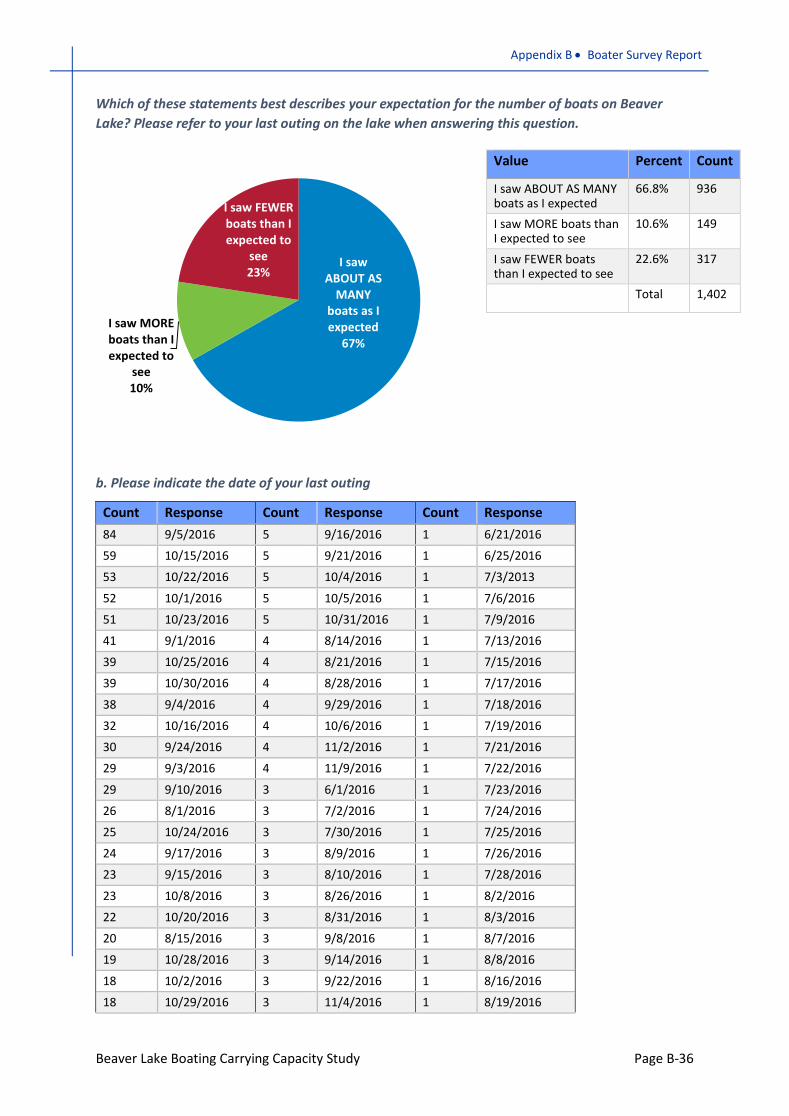
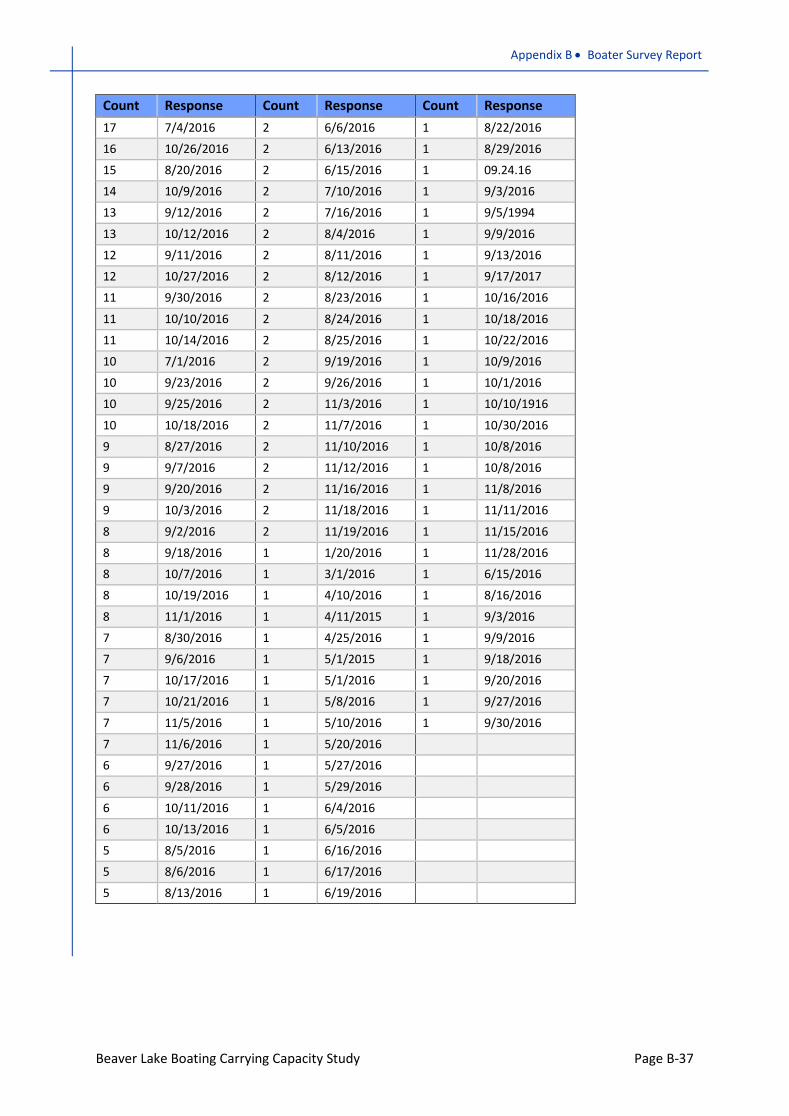
Which of these statements best describes your expectation for the number of boats on Beaver Lake? Please refer to your last outing on the lake when answering this question.
b. Please indicate the date of your last outing
Count Response Count Response Count Response 84 9/5/2016 5 9/16/2016 1 6/21/2016
59 10/15/2016 5 9/21/2016 1 6/25/2016
53 10/22/2016 5 10/4/2016 1 7/3/2013
52 10/1/2016 5 10/5/2016 1 7/6/2016
51 10/23/2016 5 10/31/2016 1 7/9/2016
41 9/1/2016 4 8/14/2016 1 7/13/2016
39 10/25/2016 4 8/21/2016 1 7/15/2016
39 10/30/2016 4 8/28/2016 1 7/17/2016
38 9/4/2016 4 9/29/2016 1 7/18/2016
32 10/16/2016 4 10/6/2016 1 7/19/2016
30 9/24/2016 4 11/2/2016 1 7/21/2016
29 9/3/2016 4 11/9/2016 1 7/22/2016
29 9/10/2016 3 6/1/2016 1 7/23/2016
26 8/1/2016 3 7/2/2016 1 7/24/2016
25 10/24/2016 3 7/30/2016 1 7/25/2016
24 9/17/2016 3 8/9/2016 1 7/26/2016
23 9/15/2016 3 8/10/2016 1 7/28/2016
23 10/8/2016 3 8/26/2016 1 8/2/2016
22 10/20/2016 3 8/31/2016 1 8/3/2016
20 8/15/2016 3 9/8/2016 1 8/7/2016
19 10/28/2016 3 9/14/2016 1 8/8/2016
18 10/2/2016 3 9/22/2016 1 8/16/2016
18 10/29/2016 3 11/4/2016 1 8/19/2016
Value Percent Count
I saw ABOUT AS MANY boats as I expected
66.8% 936
I saw MORE boats than I expected to see
10.6% 149
I saw FEWER boats than I expected to see
22.6% 317
Total 1,402
I saw ABOUT AS
MANY boats as I expected
67%I saw MORE boats than I expected to
see 10%
I saw FEWER boats than I expected to
see23%
Appendix B • Boater Survey Report
Beaver Lake Boating Carrying Capacity Study Page B-37
Count Response Count Response Count Response 17 7/4/2016 2 6/6/2016 1 8/22/2016
16 10/26/2016 2 6/13/2016 1 8/29/2016
15 8/20/2016 2 6/15/2016 1 09.24.16
14 10/9/2016 2 7/10/2016 1 9/3/2016
13 9/12/2016 2 7/16/2016 1 9/5/1994
13 10/12/2016 2 8/4/2016 1 9/9/2016
12 9/11/2016 2 8/11/2016 1 9/13/2016
12 10/27/2016 2 8/12/2016 1 9/17/2017
11 9/30/2016 2 8/23/2016 1 10/16/2016
11 10/10/2016 2 8/24/2016 1 10/18/2016
11 10/14/2016 2 8/25/2016 1 10/22/2016
10 7/1/2016 2 9/19/2016 1 10/9/2016
10 9/23/2016 2 9/26/2016 1 10/1/2016
10 9/25/2016 2 11/3/2016 1 10/10/1916
10 10/18/2016 2 11/7/2016 1 10/30/2016
9 8/27/2016 2 11/10/2016 1 10/8/2016
9 9/7/2016 2 11/12/2016 1 10/8/2016
9 9/20/2016 2 11/16/2016 1 11/8/2016
9 10/3/2016 2 11/18/2016 1 11/11/2016
8 9/2/2016 2 11/19/2016 1 11/15/2016
8 9/18/2016 1 1/20/2016 1 11/28/2016
8 10/7/2016 1 3/1/2016 1 6/15/2016
8 10/19/2016 1 4/10/2016 1 8/16/2016
8 11/1/2016 1 4/11/2015 1 9/3/2016
7 8/30/2016 1 4/25/2016 1 9/9/2016
7 9/6/2016 1 5/1/2015 1 9/18/2016
7 10/17/2016 1 5/1/2016 1 9/20/2016
7 10/21/2016 1 5/8/2016 1 9/27/2016
7 11/5/2016 1 5/10/2016 1 9/30/2016
7 11/6/2016 1 5/20/2016
6 9/27/2016 1 5/27/2016
6 9/28/2016 1 5/29/2016
6 10/11/2016 1 6/4/2016
6 10/13/2016 1 6/5/2016
5 8/5/2016 1 6/16/2016
5 8/6/2016 1 6/17/2016
5 8/13/2016 1 6/19/2016
Appendix B • Boater Survey Report
Beaver Lake Boating Carrying Capacity Study Page B-38
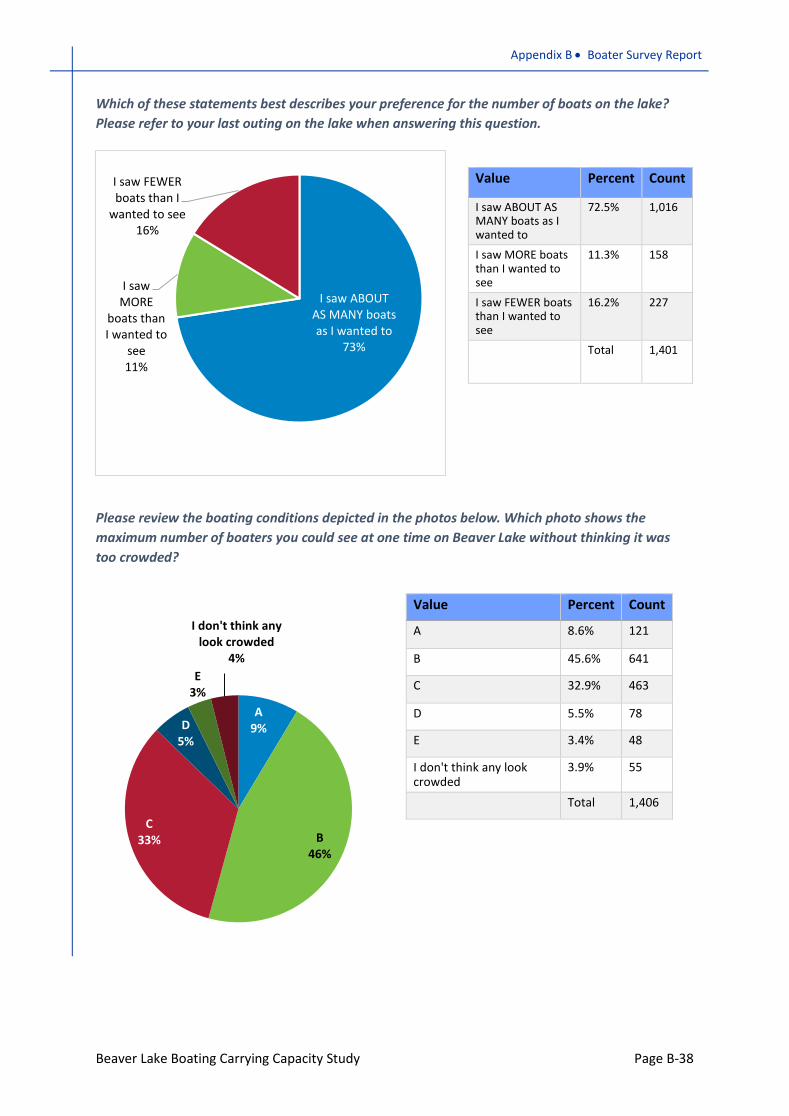
Which of these statements best describes your preference for the number of boats on the lake? Please refer to your last outing on the lake when answering this question.
Please review the boating conditions depicted in the photos below. Which photo shows the maximum number of boaters you could see at one time on Beaver Lake without thinking it was too crowded?
Value Percent Count
A 8.6% 121
B 45.6% 641
C 32.9% 463
D 5.5% 78
E 3.4% 48
I don't think any look crowded
3.9% 55
Total 1,406
Value Percent Count
I saw ABOUT AS MANY boats as I wanted to
72.5% 1,016
I saw MORE boats than I wanted to see
11.3% 158
I saw FEWER boats than I wanted to see
16.2% 227
Total 1,401
I saw ABOUT AS MANY boats as I wanted to
73%
I saw MORE
boats than I wanted to
see 11%
I saw FEWER boats than I
wanted to see 16%
A9%
B46%
C33%
D5%
E3%
I don't think any look crowded
4%
Appendix B • Boater Survey Report
Beaver Lake Boating Carrying Capacity Study Page B-39
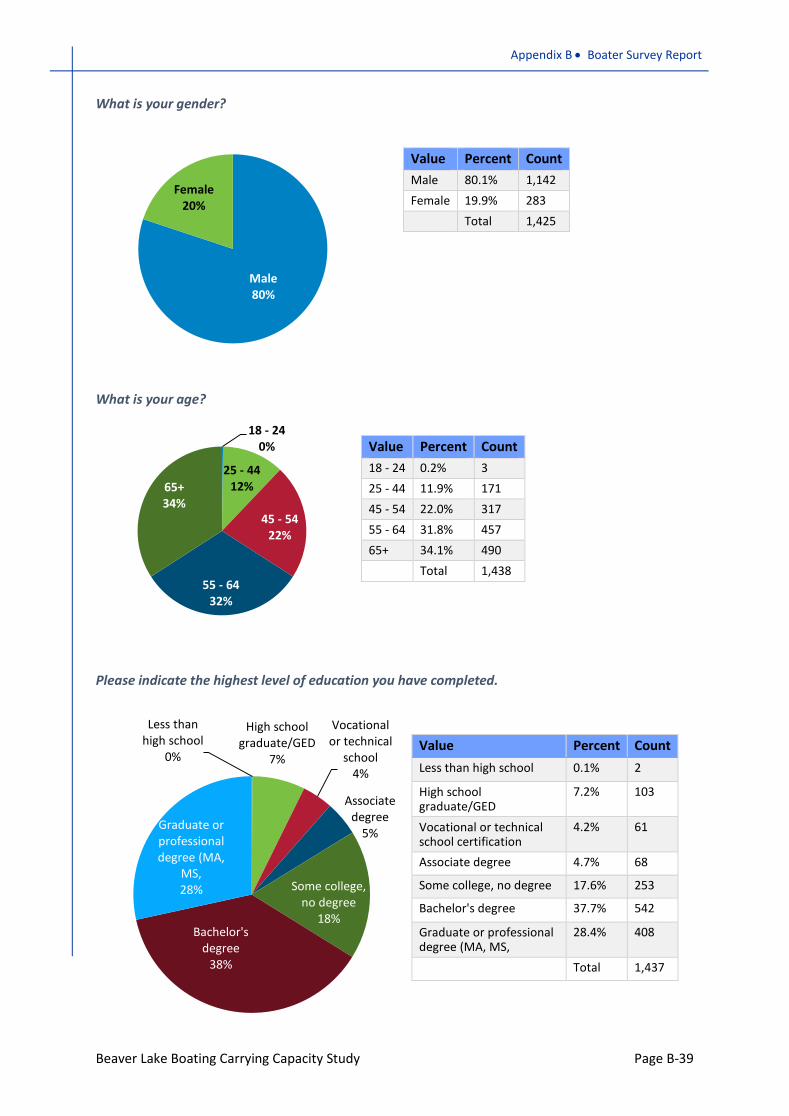
What is your gender?
What is your age?
Value Percent Count 18 - 24 0.2% 3 25 - 44 11.9% 171 45 - 54 22.0% 317 55 - 64 31.8% 457 65+ 34.1% 490
Total 1,438
Please indicate the highest level of education you have completed.
Value Percent Count Less than high school 0.1% 2
High school graduate/GED
7.2% 103
Vocational or technical school certification
4.2% 61
Associate degree 4.7% 68
Some college, no degree 17.6% 253
Bachelor's degree 37.7% 542
Graduate or professional degree (MA, MS,
28.4% 408
Total 1,437
Value Percent Count Male 80.1% 1,142 Female 19.9% 283
Total 1,425
Male80%
Female20%
18 - 240%
25 - 4412%
45 - 5422%
55 - 6432%
65+34%
Less than high school
0%
High school graduate/GED
7%
Vocational or technical
school4%
Associate degree
5%
Some college, no degree
18%Bachelor's
degree38%
Graduate or professional degree (MA,
MS,28%
Appendix B • Boater Survey Report
Beaver Lake Boating Carrying Capacity Study Page B-40
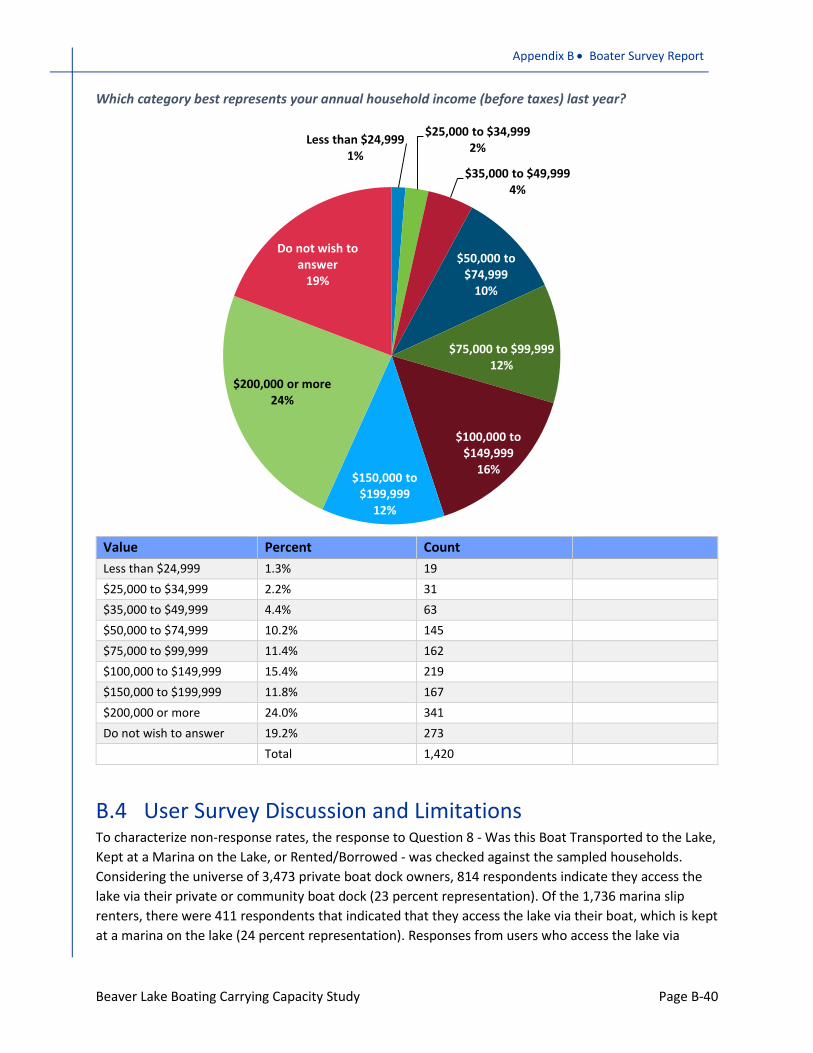
Which category best represents your annual household income (before taxes) last year?
Value Percent Count Less than $24,999 1.3% 19 $25,000 to $34,999 2.2% 31 $35,000 to $49,999 4.4% 63 $50,000 to $74,999 10.2% 145 $75,000 to $99,999 11.4% 162 $100,000 to $149,999 15.4% 219 $150,000 to $199,999 11.8% 167 $200,000 or more 24.0% 341 Do not wish to answer 19.2% 273
Total 1,420
B.4 User Survey Discussion and LimitationsTo characterize non-response rates, the response to Question 8 - Was this Boat Transported to the Lake, Kept at a Marina on the Lake, or Rented/Borrowed - was checked against the sampled households. Considering the universe of 3,473 private boat dock owners, 814 respondents indicate they access the lake via their private or community boat dock (23 percent representation). Of the 1,736 marina slip renters, there were 411 respondents that indicated that they access the lake via their boat, which is kept at a marina on the lake (24 percent representation). Responses from users who access the lake via
Less than $24,9991%
$25,000 to $34,9992%
$35,000 to $49,9994%
$50,000 to $74,999
10%
$75,000 to $99,99912%
$100,000 to $149,999
16%$150,000 to $199,999
12%
$200,000 or more24%
Do not wish to answer
19%
Appendix B • Boater Survey Report
Beaver Lake Boating Carrying Capacity Study Page B-41
public launch sites or other categories (rented, borrowed, or from a resort) is likely underrepresented, with only 192 responses. This category of users is difficult to quantify and target. Responses by access type were checked and responses are noted where there are significant differences between groups of users (slip renters, public launch users, private/community dock owners).
Non-response count for any question ranged between 41 and 60, or under 5 percent, with a few notable exceptions. The question asking for the primary zone where boating activities occurred had a non-response rate of 5.2 percent. No difference was measurable between those completing the survey online or via paper mail back. The slightly higher nonresponse rate is likely due to respondents simply not knowing or possibly that they perceived their use as equally distributed between two or more zones. The question asking for respondents to indicate the date of their last outing had a non-response response rate of 8.9 percent. This is likely because the survey was administered in October and the respondents simply could not identify the date.