appendix a summary of historical documents trout …
TRANSCRIPT

APPENDIX A
SUMMARY OF HISTORICAL DOCUMENTS
TROUT BROOK WATERSHED-BASED MANAGEMENT PLAN
SOUTH PORTLAND & CAPE ELIZABETH, ME
Page 1 of 15
DOCUMENT
TITLE
PREPARED BY DOCUMENT
DATE
MAJOR FINDINGS
Trout Brook Watershed Survey
South Portland Land Trust & MEDEP
Survey: Apr-Jun 2003 Report: January 2006
86 sources/types of pollution. Pollutants: sediments (67.8%), Nutrients (36.8%), Toxics (8%), Bacteria (4.6%). Sources:
Residential (32%): Nutrient pollution from lawns & piles of clippings, bare soil and streambank erosion, erosive roof runoff, polluted runoff from driveways.
Dump sites (23%): Junk yards, trash dumping, large piles of grass clippings & yard debris, uncovered soil piles, pet waste.
Recreation (16%): Bank & shoreline erosion, bare soil, road runoff Construction (9%) Trails (7%) Town roads (13%)
Findings: Immediate solutions to pollution, including outreach/education for the
following: stormwater runoff reduction, storm drain awareness, car/lawn/garden care, septic systems, animal waste, proper chemical storage.
Minimize impervious surfaces in watershed (code changes, conversion of existing surfaces, new technologies, impervious cover/stormwater utility fee, promote LID)
Stabilize and buffer riparian shoreland areas Eliminate bacterial contamination sources Manage stormwater outfalls Eliminate hazardous and toxics drainage or dumping into the brook. Investigate pesticide/herbicide use in watershed (test for residue) Restore natural channel morphology.
Measuring the Impact of Development on Maine Surface
Chandler Morse and Steve Kahl
January 2003 (also referenced in TB Watershed Survey) The study concluded that below a percentage of total impervious area (PTIA) of 6%, degradation to a stream was minimal. A PTIA 6-10% is the threshold over which water quality, biology, and habitat are degraded. TB had a PTIA of 14% at the time

Trout Brook Document Summary 9/1/2011
Page 2 of 15s:\0 watershed protection\rivers & streams\trout brook\management plan\trout brook wmp draft\appendices\summary_of_historical_reports.docx
Waters of the study.
Urban Streams Nonpoint Source Assessments in Maine, Final Report
Susanne Meidel (Partnership for Environmental Technology Education) & MEDEP
February 2005 Detailed Urban Stream Assessment. General list of remedial actions recommended for Trout Brook include:
Reduce impervious surfaces & stormwater runoff Improve stormwater treatment practices on existing developments Reduce hazardous substance/toxic spills and illicit discharges Reduce air pollution Improve channel morphology. Replant riparian shoreland buffers Reduce or eliminate fertilizer use. Minimize bacterial contributions (pet waste, sewage)
South Portland Conservation Commission Wetland Compensation Fund Planning Report
Sebago Technics March 11, 2010 General: Develop a set of criteria to evaluate, rank, and prioritize wetland
compensation fund projects Periodically review and assess the potential projects for additional
investigation Conservation Commission should develop a plan to create public awareness
of (this) report for the benefit of the citizens of South Portland. Trout Brook Watershed Specific:
Mahoney Middle School, Trout Brook Crossing at Highland Avenue. Conservation, stormwater improvement, wetland (restoration?) project.
Trout Brook TMDL Report
Susanne Meidel (Partnership for Environmental Technology Education) & MEDEP
September 2007 IC target is 11% (IC was estimated at 15% as of the date of the report) Subwatershed survey needed to evaluate “effective” versus “total” IC
(interconnected versus disconnected surfaces). Immediate stormwater remediation may provide good short term results—
disconnect hot spots and install bioretention structures (more ‘bang for buck’ than subwatershed IC survey)
Maintain or restore the riparian buffer Reclaim flood plains where possible and maintain intact flood plains.

Trout Brook Document Summary 9/1/2011
Page 3 of 15s:\0 watershed protection\rivers & streams\trout brook\management plan\trout brook wmp draft\appendices\summary_of_historical_reports.docx
Improve channel morphology Reduce spills Reduce road sand/road dirt input. Pick up pet waste Minimize landscaping runoff. Eliminate sewer/septic leaks. Eliminate illicit discharges. Reduce erosion (use mulches, vegetated overs, geotextile, riprap) Education & outreach efforts. Promotes Smart Growth or Low Impact Development guidelines. Reduce new IC (promote shared parking areas) Reduce discharge temperature from detention structures. Expand muni sewer to eliminate septic systems. Eliminate CSO.
Trout Brook Culvert Analysis
Wright-Pierce April 2003 All of the culverts on Trout Brook between Fessenden Avenue and Sawyer Street with the exception of the Saywer Street culvert are undersized and do not have sufficient hydraulic capacity to convey peak flows associated with a 25-year storm event. A brief review of the 1984 Flood Insurance Study suggests that capacity issues downstream will likely result in flooding at Highland Avenue, Broadway, and the former Boston & Maine Railroad. Improvements to the upstream (Trout Brook) capacity will most likely exacerbate problems at these downstream hydraulic restrictions.
City of South Portland Comprehensive Plan
City of South Portland
July 20, 1992 (Rev 7/7/2003)
Separate CSOs “preserve unique and critical water resources” (Trout Brook named)
Prepare strategy for preservation/protection of water resources Determine appropriate buffer Eliminate problems as identified in Nat’l Estuary Program. Develop zoning standards to limit amount of impervious permitted &
encourage natural site drainage. “Residents consider Trout Brook…to be of value as fishery habitat.” (Low)
Preserve & identify unique and critical natural resources Request that the Conservation Commission conduct an indepth inventory and

Trout Brook Document Summary 9/1/2011
Page 4 of 15s:\0 watershed protection\rivers & streams\trout brook\management plan\trout brook wmp draft\appendices\summary_of_historical_reports.docx
analysis of existing wildlife and fisheries habitats Adopt a local wetlands protection ordinance Review/revise environmental criteria included in “net residential acreage”
Balance community benefit of preserving open space with rights of private developers and landowners. Preserve environmentally sensitive areas and areas of critical natural resources such as wetlands and steep slopes.
Develop zoning regulations to limit development in environmentally sensitive areas.
Expand/strengthen the Resource Protection District and ordinances to preserve areas of SP’s vital ecosystems.
Expand the definition of ‘net residential acreage’’ to subtract wetlands, surface waterbodies, and very poorly drained soils to decrease permitted residential density.
Encourage cluster housing on parcels with significant open space or natural features.
Cape Elizabeth Comprehensive Plan
Town of Cape Elizabeth
2007 Trout Brook is located along the northeastern Cape Elizabeth/South Portland boundary where most of the abutting land is densely developed. Trout Brook has been identified as an urban impaired watershed. The portion of Trout Brook located in Cape Elizabeth is currently listed as Class B, and is designated as not meeting State water quality standards. The South Portland section is classified as Class C, also not meeting standards. The Town is considering adoption of a Community Fee Utilization Plan approved by the Maine Department of Environmental Protection, which would allow the Town to collect a fee from significant new development that could be used to fund projects that will improve the water quality of Trout Brook.
Periodic water quality testing should continue and be expanded to monitor local water quality in order to identify potential problems in the early stages and also to assist in priority setting for infrastructure policy and improvements. Very little water quality data are generated, except as funded by the Town. As funding permits and opportunities arise, the Town should look to itself as the primary collector of water quality testing data necessary to stop possible water quality degradation at its earliest stages.
Expand the periodic water quality testing of Great Pond to a town-wide
Trout Brook Document Summary 9/1/2011
Page 5 of 15s:\0 watershed protection\rivers & streams\trout brook\management plan\trout brook wmp draft\appendices\summary_of_historical_reports.docx
program that includes identifying standard water quality testing sites throughout town which are tested every 5 -10 years on a standard set of parameters.
The Town shall support the continuation of farming and management of woodland areas by working with farmers and land owners to provide for financial rewards and preservation of significant agricultural and forestry areas.
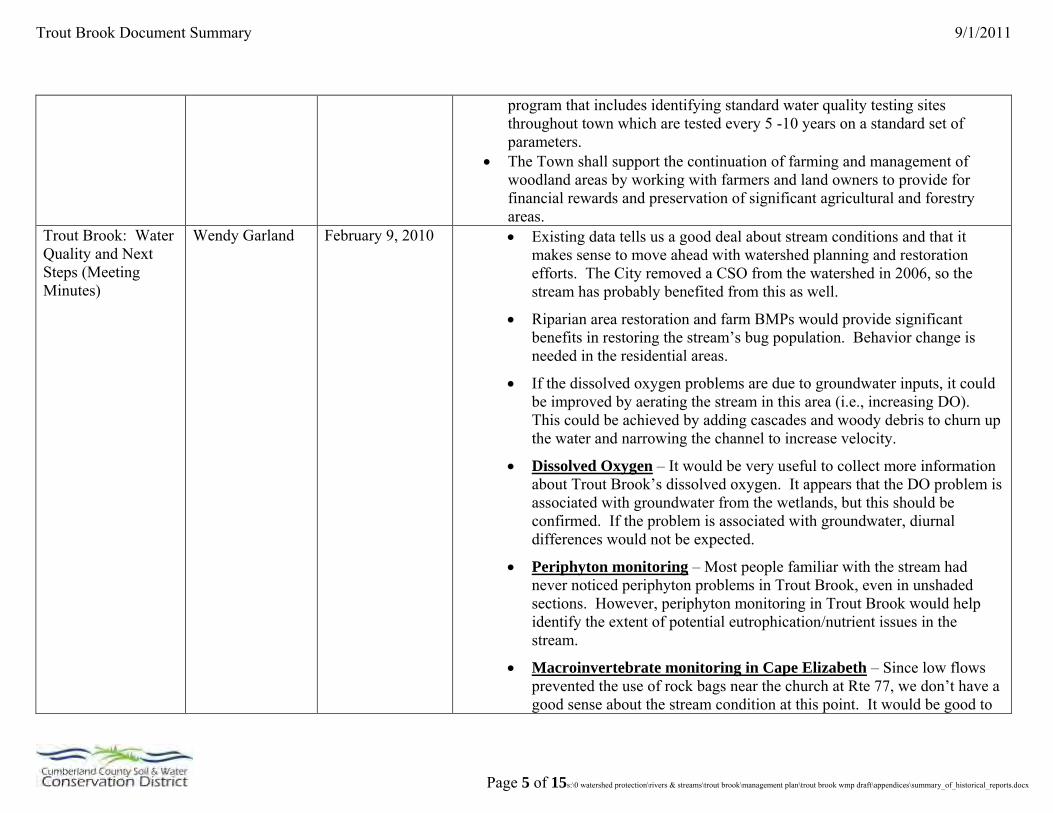
Trout Brook: Water Quality and Next Steps (Meeting Minutes)
Wendy Garland February 9, 2010 Existing data tells us a good deal about stream conditions and that it makes sense to move ahead with watershed planning and restoration efforts. The City removed a CSO from the watershed in 2006, so the stream has probably benefited from this as well.
Riparian area restoration and farm BMPs would provide significant benefits in restoring the stream’s bug population. Behavior change is needed in the residential areas.
If the dissolved oxygen problems are due to groundwater inputs, it could be improved by aerating the stream in this area (i.e., increasing DO). This could be achieved by adding cascades and woody debris to churn up the water and narrowing the channel to increase velocity.
Dissolved Oxygen – It would be very useful to collect more information about Trout Brook’s dissolved oxygen. It appears that the DO problem is associated with groundwater from the wetlands, but this should be confirmed. If the problem is associated with groundwater, diurnal differences would not be expected.
Periphyton monitoring – Most people familiar with the stream had never noticed periphyton problems in Trout Brook, even in unshaded sections. However, periphyton monitoring in Trout Brook would help identify the extent of potential eutrophication/nutrient issues in the stream.
Macroinvertebrate monitoring in Cape Elizabeth – Since low flows prevented the use of rock bags near the church at Rte 77, we don’t have a good sense about the stream condition at this point. It would be good to

Trout Brook Document Summary 9/1/2011
Page 6 of 15s:\0 watershed protection\rivers & streams\trout brook\management plan\trout brook wmp draft\appendices\summary_of_historical_reports.docx
collect bug data here, either using rock bags or kick nets (looking for sensitive taxa). This would help us assess how much the farm (and the area above it) impact the stream.
Cape Elizabeth Compensation Fee Utilization Program
Maureen O’Meara, Town Planner, Town of Cape Elizabeth
August 1, 2007 Data Collection in Cape Elizabeth portion of watershed. Data to include pesticide/herbicide sampling downstream of farm.
Riparian Buffer restoration Stormwater Outfall Erosion Control (Norman Street, Providence Ave/Marsh
Rd, above Highland Ave, below Broadway, all in South Portland, and State Ave/Queen Acres in Cape Elizabeth.)
Sinuosity Restoration Street Sweeping Upgrade (vacuum or regenerative air system) Road stormwater runoff treatment including a study by municipal engineers
that inventory all road stormwater discharge points to Trout Brook and then design treatment using Stormwater BMPs.
South Portland, Cape Elizabeth, and MEDEP GIS data
emailed by Wendy Garland, ME DEP
Various 2003_Stream_Habitat_Survey.dbf 2003_Stream_Habitat_Survey.prj 2003_Stream_Habitat_Survey.sbn 2003_Stream_Habitat_Survey.sbx 2003_Stream_Habitat_Survey.shp 2003_Stream_Habitat_Survey.xml 2003_Stream_Habitat_Survey.shx Cape_CFUP_sites.dbf Cape_CFUP_sites.prj Cape_CFUP_sites.sbn Cape_CFUP_sites.sbx Cape_CFUP_sites.shp Cape_CFUP_sites.shx TB_watershed_survey_sites.dbf TB_watershed_survey_sites.prj TB_watershed_survey_sites.sbn TB_watershed_survey_sites.sbx

Trout Brook Document Summary 9/1/2011
Page 7 of 15s:\0 watershed protection\rivers & streams\trout brook\management plan\trout brook wmp draft\appendices\summary_of_historical_reports.docx
TB_watershed_survey_sites.shp TB_watershed_survey_sites.shx
MDEP Water Quality & Macroinvertebrate Data
ME DEP 1997-2010
See Tables 1 & 2 and Figures 1A-1D (2011 data to be evaluated at a later date)
Table 1. Maine DEP Biomonitoring Data, Trout Brook
STATUTORY
CLASS
STATION
ID
SAMPLE ID SAMPLE TYPE SAMPLE
DATE
ATTAINMENT
C S-302 SA-302-2003 algae 9-Jul-2003 n/a C S-302 SA-302-2003(207) algae 9-Jul-2003 n/a C S-302 SA-302-2004 algae 6-Jul-2004 n/a C S-302 SA-302-2004(266) algae 6-Jul-2004 n/a C S-302 642 macroinvertebrate 8-Sep-1997 no C S-302 798 macroinvertebrate 23-Aug-1999 yes C S-302 911 macroinvertebrate 30-Aug-2000 indeterminate C S-302 1257 macroinvertebrate 25-Aug-2003 no C S-302 1257 macroinvertebrate 25-Aug-2003 no C S-302 1396 macroinvertebrate 23-Aug-2004 no C S-302 1396 macroinvertebrate 23-Aug-2004 no C S-454 916 macroinvertebrate 30-Aug-2000 no C S-675 SA-675-2010 algae 23-Jun-2010 n/a C S-675 SA-675-2010(936) algae 23-Jun-2010 n/a C S-675 1276 macroinvertebrate 9-Sep-2003 no C S-675 1397 macroinvertebrate 23-Aug-2004 no C S-675 1320 macroinvertebrate 9-Aug-2005 no C S-675 1505 macroinvertebrate 20-Sep-2005 no C S-675 1928 macroinvertebrate 13-Aug-2010 no B W-093 2003-093 wetland 12-Jun-2003 n/a

Trout Brook Document Summary 9/1/2011
Page 8 of 15s:\0 watershed protection\rivers & streams\trout brook\management plan\trout brook wmp draft\appendices\summary_of_historical_reports.docx
B W-093 DN-2003-093 wetland 12-Jun-2003 n/a B W-093 WA-093-2003Y(453) wetland 12-Jun-2003 n/a

Trout Brook Document Summary 9/1/2011
Page 9 of 15s:\0 watershed protection\rivers & streams\trout brook\management plan\trout brook wmp draft\appendices\summary_of_historical_reports.docx
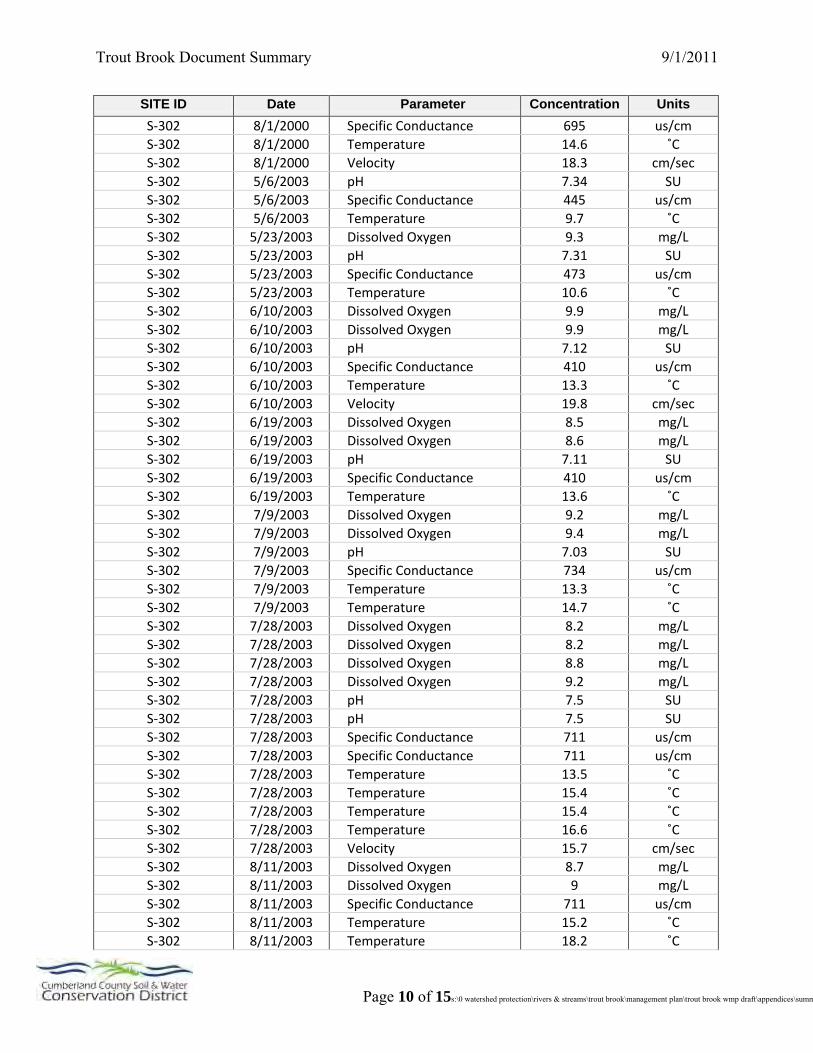
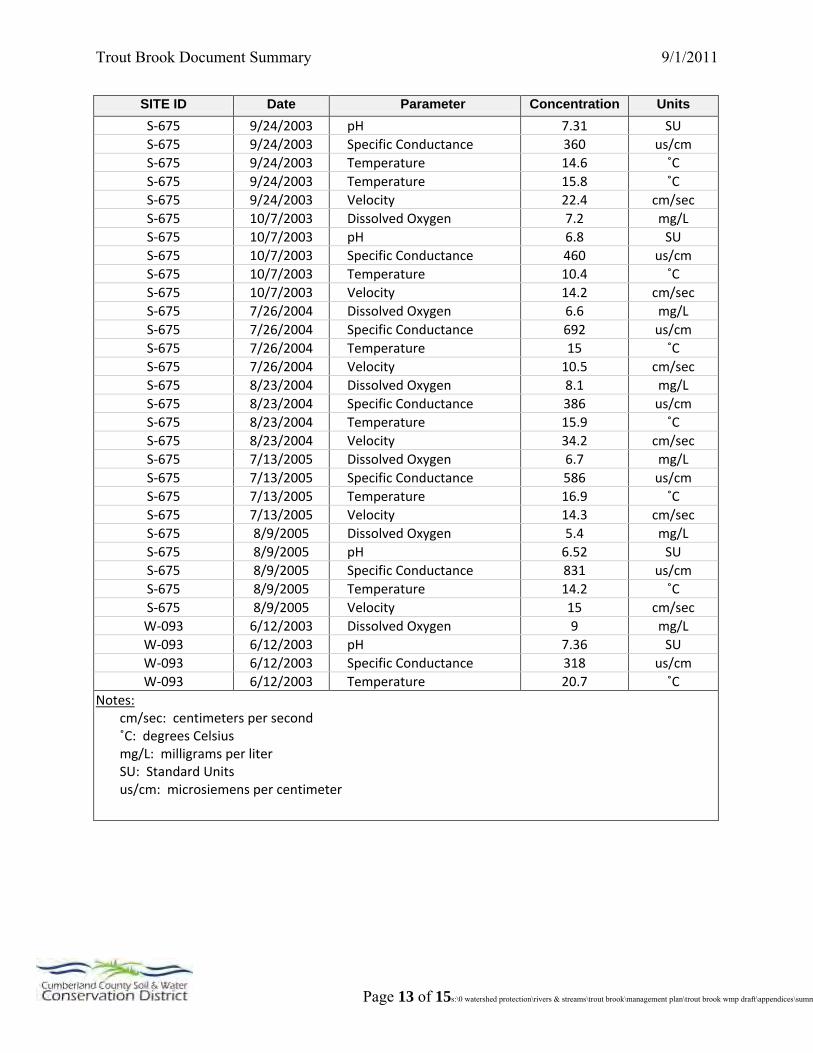
Table 2. Maine DEP Water Quality Data, Trout Brook
SITE ID Date Parameter Concentration Units
RFRKMTB03 7/21/2003 Dissolved Oxygen 9.38 mg/L
RFRKMTB03 7/21/2003 Temperature 15.1 ˚C
RFRKMTB03 7/24/2003 Dissolved Oxygen 9.64 mg/L
RFRKMTB03 7/24/2003 Temperature 17 ˚C
RFRKMTB03 7/24/2003 Turbidity 2.21 NTU
RFRKMTB03 8/4/2003 Dissolved Oxygen 8.58 mg/L
RFRKMTB03 8/4/2003 pH 7.31 SU
RFRKMTB03 8/4/2003 Temperature 16.8 ˚C
RFRKMTB03 8/4/2003 Turbidity 26.5 NTU
RFRKMTB03 2/11/2004 Dissolved Oxygen 13.8 mg/L
RFRKMTB03 2/11/2004 Temperature 4 ˚C
RFRKMTB03 2/11/2004 Turbidity 5.34 NTU
RFRKMTB03 2/17/2004 Dissolved Oxygen 15 mg/L
RFRKMTB03 2/17/2004 Temperature 0.4 ˚C
RFRKMTB03 2/17/2004 Turbidity 3.5 NTU
RFRKMTB03 2/20/2004 Dissolved Oxygen 14.47 mg/L
RFRKMTB03 2/20/2004 Temperature 4.6 ˚C
RFRKMTB03 2/20/2004 Turbidity 5.02 NTU
RFRKMTB03 2/23/2004 Dissolved Oxygen 14.71 mg/L
RFRKMTB03 2/23/2004 Temperature 2.3 ˚C
RFRKMTB03 2/23/2004 Turbidity 14.3 NTU
RFRKMTB03 2/24/2004 Dissolved Oxygen 14.01 mg/L
RFRKMTB03 2/24/2004 Temperature 4.8 ˚C
RFRKMTB03 2/24/2004 Turbidity 38 NTU
RFRKMTB03 2/26/2004 Dissolved Oxygen 13.7 mg/L
RFRKMTB03 2/26/2004 Temperature 4.7 ˚C
RFRKMTB03 2/26/2004 Turbidity 8.43 NTU
RFRKMTB03 3/17/2004 Dissolved Oxygen 15.54 mg/L
RFRKMTB03 3/17/2004 Temperature 2 ˚C
RFRKMTB03 3/17/2004 Turbidity 8.59 NTU
RFRKMTB03 3/24/2004 Dissolved Oxygen 14.99 mg/L
RFRKMTB03 3/24/2004 Temperature 5.4 ˚C
RFRKMTB03 4/7/2004 Dissolved Oxygen 15.35 mg/L
RFRKMTB03 4/7/2004 Temperature 3.4 ˚C
S-302 8/13/1997 Dissolved Oxygen 7.1 mg/L
S-302 8/13/1997 Specific Conductance 792 us/cm
S-302 8/13/1997 Temperature 13 ˚C
S-302 8/13/1997 Velocity 20 cm/sec
S-302 7/26/1999 Dissolved Oxygen 8.7 mg/L
S-302 7/26/1999 Specific Conductance 832 us/cm
S-302 7/26/1999 Temperature 15 ˚C
S-302 7/26/1999 Turbidity 10 NTU
S-302 8/1/2000 Dissolved Oxygen 9.2 mg/L
Trout Brook Document Summary 9/1/2011
Page 10 of 15s:\0 watershed protection\rivers & streams\trout brook\management plan\trout brook wmp draft\appendices\summary_of_historical_reports.docx
SITE ID Date Parameter Concentration Units
S-302 8/1/2000 Specific Conductance 695 us/cm
S-302 8/1/2000 Temperature 14.6 ˚C
S-302 8/1/2000 Velocity 18.3 cm/sec
S-302 5/6/2003 pH 7.34 SU
S-302 5/6/2003 Specific Conductance 445 us/cm
S-302 5/6/2003 Temperature 9.7 ˚C
S-302 5/23/2003 Dissolved Oxygen 9.3 mg/L
S-302 5/23/2003 pH 7.31 SU
S-302 5/23/2003 Specific Conductance 473 us/cm
S-302 5/23/2003 Temperature 10.6 ˚C
S-302 6/10/2003 Dissolved Oxygen 9.9 mg/L
S-302 6/10/2003 Dissolved Oxygen 9.9 mg/L
S-302 6/10/2003 pH 7.12 SU
S-302 6/10/2003 Specific Conductance 410 us/cm
S-302 6/10/2003 Temperature 13.3 ˚C
S-302 6/10/2003 Velocity 19.8 cm/sec
S-302 6/19/2003 Dissolved Oxygen 8.5 mg/L
S-302 6/19/2003 Dissolved Oxygen 8.6 mg/L
S-302 6/19/2003 pH 7.11 SU
S-302 6/19/2003 Specific Conductance 410 us/cm
S-302 6/19/2003 Temperature 13.6 ˚C
S-302 7/9/2003 Dissolved Oxygen 9.2 mg/L
S-302 7/9/2003 Dissolved Oxygen 9.4 mg/L
S-302 7/9/2003 pH 7.03 SU
S-302 7/9/2003 Specific Conductance 734 us/cm
S-302 7/9/2003 Temperature 13.3 ˚C
S-302 7/9/2003 Temperature 14.7 ˚C
S-302 7/28/2003 Dissolved Oxygen 8.2 mg/L
S-302 7/28/2003 Dissolved Oxygen 8.2 mg/L
S-302 7/28/2003 Dissolved Oxygen 8.8 mg/L
S-302 7/28/2003 Dissolved Oxygen 9.2 mg/L
S-302 7/28/2003 pH 7.5 SU
S-302 7/28/2003 pH 7.5 SU
S-302 7/28/2003 Specific Conductance 711 us/cm
S-302 7/28/2003 Specific Conductance 711 us/cm
S-302 7/28/2003 Temperature 13.5 ˚C
S-302 7/28/2003 Temperature 15.4 ˚C
S-302 7/28/2003 Temperature 15.4 ˚C
S-302 7/28/2003 Temperature 16.6 ˚C
S-302 7/28/2003 Velocity 15.7 cm/sec
S-302 8/11/2003 Dissolved Oxygen 8.7 mg/L
S-302 8/11/2003 Dissolved Oxygen 9 mg/L
S-302 8/11/2003 Specific Conductance 711 us/cm
S-302 8/11/2003 Temperature 15.2 ˚C
S-302 8/11/2003 Temperature 18.2 ˚C

Trout Brook Document Summary 9/1/2011
Page 11 of 15s:\0 watershed protection\rivers & streams\trout brook\management plan\trout brook wmp draft\appendices\summary_of_historical_reports.docx
SITE ID Date Parameter Concentration Units
S-302 8/11/2003 Velocity 11.65 cm/sec
S-302 8/25/2003 Dissolved Oxygen 8.9 mg/L
S-302 8/25/2003 Dissolved Oxygen 9.32 mg/L
S-302 8/25/2003 Dissolved Oxygen 9.32 mg/L
S-302 8/25/2003 Dissolved Oxygen 9.4 mg/L
S-302 8/25/2003 pH 7.15 SU
S-302 8/25/2003 pH 7.29 SU
S-302 8/25/2003 Specific Conductance 665 us/cm
S-302 8/25/2003 Specific Conductance 679 us/cm
S-302 8/25/2003 Temperature 12.7 ˚C
S-302 8/25/2003 Temperature 13.9 ˚C
S-302 8/25/2003 Temperature 14 ˚C
S-302 8/25/2003 Temperature 14.5 ˚C
S-302 8/25/2003 Velocity 12.55 cm/sec
S-302 9/9/2003 Dissolved Oxygen 8.4 mg/L
S-302 9/9/2003 Dissolved Oxygen 8.6 mg/L
S-302 9/9/2003 pH 7.21 SU
S-302 9/9/2003 Specific Conductance 685 us/cm
S-302 9/9/2003 Temperature 12.2 ˚C
S-302 9/9/2003 Temperature 14.6 ˚C
S-302 9/9/2003 Velocity 12.4 cm/sec
S-302 9/24/2003 Dissolved Oxygen 7.7 mg/L
S-302 9/24/2003 Dissolved Oxygen 7.8 mg/L
S-302 9/24/2003 Dissolved Oxygen 8.3 mg/L
S-302 9/24/2003 pH 7.31 SU
S-302 9/24/2003 Specific Conductance 346 us/cm
S-302 9/24/2003 Temperature 14.8 ˚C
S-302 9/24/2003 Temperature 16.4 ˚C
S-302 9/24/2003 Velocity 24.2 cm/sec
S-302 10/7/2003 Dissolved Oxygen 10 mg/L
S-302 10/7/2003 Dissolved Oxygen 10 mg/L
S-302 10/7/2003 pH 7.35 SU
S-302 10/7/2003 Specific Conductance 461 us/cm
S-302 10/7/2003 Temperature 8.8 ˚C
S-302 10/7/2003 Velocity 18.25 cm/sec
S-302 7/6/2004 Dissolved Oxygen 9.2 mg/L
S-302 7/6/2004 pH 7.18 SU
S-302 7/6/2004 Specific Conductance 673 us/cm
S-302 7/6/2004 Temperature 16 ˚C
S-302 7/6/2004 Velocity 45.8 cm/sec
S-302 7/26/2004 Dissolved Oxygen 9.1 mg/L
S-302 7/26/2004 Specific Conductance 687 us/cm
S-302 7/26/2004 Temperature 14.9 ˚C
S-302 7/26/2004 Velocity 29.7 cm/sec
S-302 8/23/2004 Dissolved Oxygen 8.9 mg/L

Trout Brook Document Summary 9/1/2011
Page 12 of 15s:\0 watershed protection\rivers & streams\trout brook\management plan\trout brook wmp draft\appendices\summary_of_historical_reports.docx
SITE ID Date Parameter Concentration Units
S-302 8/23/2004 Specific Conductance 389 us/cm
S-302 8/23/2004 Temperature 14.8 ˚C
S-302 8/23/2004 Velocity 40.7 cm/sec
S-454 8/1/2000 Specific Conductance 693 us/cm
S-454 8/1/2000 Temperature 14.4 ˚C
S-454 8/1/2000 Velocity 11.5 cm/sec
S-675 7/28/2003 Dissolved Oxygen 4.5 mg/L
S-675 7/28/2003 Dissolved Oxygen 5 mg/L
S-675 7/28/2003 Dissolved Oxygen 5.5 mg/L
S-675 7/28/2003 pH 6.57 SU
S-675 7/28/2003 Specific Conductance 714 us/cm
S-675 7/28/2003 Temperature 14.5 ˚C
S-675 7/28/2003 Temperature 16.1 ˚C
S-675 7/28/2003 Velocity 15.7 cm/sec
S-675 8/11/2003 Dissolved Oxygen 5.1 mg/L
S-675 8/11/2003 Dissolved Oxygen 6.1 mg/L
S-675 8/11/2003 Dissolved Oxygen 6.38 mg/L
S-675 8/11/2003 Specific Conductance 685 us/cm
S-675 8/11/2003 Temperature 14 ˚C
S-675 8/11/2003 Temperature 17 ˚C
S-675 8/11/2003 Temperature 17.1 ˚C
S-675 8/11/2003 Velocity 10.65 cm/sec
S-675 8/12/2003 Dissolved Oxygen 5.5 mg/L
S-675 8/12/2003 Specific Conductance 685 us/cm
S-675 8/12/2003 Temperature 17.1 ˚C
S-675 8/12/2003 Velocity 11.7 cm/sec
S-675 8/25/2003 Dissolved Oxygen 4.1 mg/L
S-675 8/25/2003 Dissolved Oxygen 922 mg/L
S-675 8/25/2003 Dissolved Oxygen Saturation 4.63 %
S-675 8/25/2003 Temperature 11.6 ˚C
S-675 8/25/2003 Temperature 13 ˚C
S-675 9/9/2003 Dissolved Oxygen 2.8 mg/L
S-675 9/9/2003 Dissolved Oxygen 4.2 mg/L
S-675 9/9/2003 Dissolved Oxygen 4.4 mg/L
S-675 9/9/2003 pH 7.21 SU
S-675 9/9/2003 pH 7.3 SU
S-675 9/9/2003 Specific Conductance 716 us/cm
S-675 9/9/2003 Specific Conductance 718 us/cm
S-675 9/9/2003 Temperature 11.8 ˚C
S-675 9/9/2003 Temperature 14.5 ˚C
S-675 9/9/2003 Temperature 15 ˚C
S-675 9/9/2003 Velocity 9.6 cm/sec
S-675 9/9/2003 Velocity 9.6 cm/sec
S-675 9/24/2003 Dissolved Oxygen 5.1 mg/L
S-675 9/24/2003 Dissolved Oxygen 5.9 mg/L
Trout Brook Document Summary 9/1/2011
Page 13 of 15s:\0 watershed protection\rivers & streams\trout brook\management plan\trout brook wmp draft\appendices\summary_of_historical_reports.docx
SITE ID Date Parameter Concentration Units
S-675 9/24/2003 pH 7.31 SU
S-675 9/24/2003 Specific Conductance 360 us/cm
S-675 9/24/2003 Temperature 14.6 ˚C
S-675 9/24/2003 Temperature 15.8 ˚C
S-675 9/24/2003 Velocity 22.4 cm/sec
S-675 10/7/2003 Dissolved Oxygen 7.2 mg/L
S-675 10/7/2003 pH 6.8 SU
S-675 10/7/2003 Specific Conductance 460 us/cm
S-675 10/7/2003 Temperature 10.4 ˚C
S-675 10/7/2003 Velocity 14.2 cm/sec
S-675 7/26/2004 Dissolved Oxygen 6.6 mg/L
S-675 7/26/2004 Specific Conductance 692 us/cm
S-675 7/26/2004 Temperature 15 ˚C
S-675 7/26/2004 Velocity 10.5 cm/sec
S-675 8/23/2004 Dissolved Oxygen 8.1 mg/L
S-675 8/23/2004 Specific Conductance 386 us/cm
S-675 8/23/2004 Temperature 15.9 ˚C
S-675 8/23/2004 Velocity 34.2 cm/sec
S-675 7/13/2005 Dissolved Oxygen 6.7 mg/L
S-675 7/13/2005 Specific Conductance 586 us/cm
S-675 7/13/2005 Temperature 16.9 ˚C
S-675 7/13/2005 Velocity 14.3 cm/sec
S-675 8/9/2005 Dissolved Oxygen 5.4 mg/L
S-675 8/9/2005 pH 6.52 SU
S-675 8/9/2005 Specific Conductance 831 us/cm
S-675 8/9/2005 Temperature 14.2 ˚C
S-675 8/9/2005 Velocity 15 cm/sec
W-093 6/12/2003 Dissolved Oxygen 9 mg/L
W-093 6/12/2003 pH 7.36 SU
W-093 6/12/2003 Specific Conductance 318 us/cm
W-093 6/12/2003 Temperature 20.7 ˚C
Notes: cm/sec: centimeters per second ˚C: degrees Celsius mg/L: milligrams per liter SU: Standard Units us/cm: microsiemens per centimeter

Trout Brook Document Summary 9/1/2011
Page 14 of 15s:\0 watershed protection\rivers & streams\trout brook\management plan\trout brook wmp draft\appendices\summary_of_historical_reports.docx
Figure 1A. Dissolved Oxygen and Temperature at Site RFRKMTB03, MEDEP Data, 2003-
2004
Figure 1B. Dissolved Oxygen and Temperature at Site 302, MEDEP Data, 1997-2004
0
2
4
6
8
10
12
14
16
18
0
2
4
6
8
10
12
14
16
18
6/28/2003 8/17/2003 10/6/2003 11/25/2003 1/14/2004 3/4/2004 4/23/2004
Dissolved Oxygen
Temperature
0
2
4
6
8
10
12
14
16
18
20
0
2
4
6
8
10
12
3/11/1997 7/24/1998 12/6/1999 4/19/2001 9/1/2002 1/14/2004 5/28/2005
Dissolved Oxygen
Temperature
Trout Brook Document Summary 9/1/2011
Page 15 of 15s:\0 watershed protection\rivers & streams\trout brook\management plan\trout brook wmp draft\appendices\summary_of_historical_reports.docx
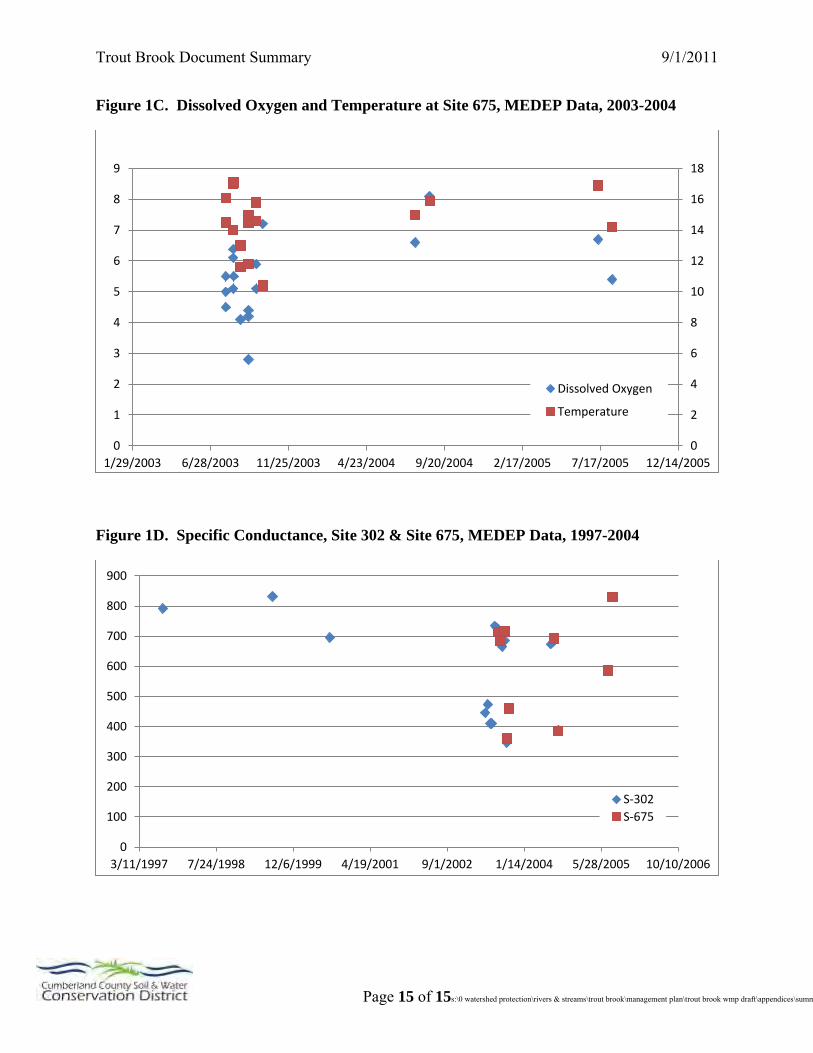
Figure 1C. Dissolved Oxygen and Temperature at Site 675, MEDEP Data, 2003-2004
Figure 1D. Specific Conductance, Site 302 & Site 675, MEDEP Data, 1997-2004
0
2
4
6
8
10
12
14
16
18
0
1
2
3
4
5
6
7
8
9
1/29/2003 6/28/2003 11/25/2003 4/23/2004 9/20/2004 2/17/2005 7/17/2005 12/14/2005
Dissolved Oxygen
Temperature
0
100
200
300
400
500
600
700
800
900
3/11/1997 7/24/1998 12/6/1999 4/19/2001 9/1/2002 1/14/2004 5/28/2005 10/10/2006
S-302
S-675

Trout Brook Watershed Management Plan Appendix B – Stream Channel Assessment Reports
Page 1 of 8
1.0 Stream Channel Assessments
Current and past project partners have completed several stream channel assessments in the Trout
Brook Watershed. The evaluation methods and criteria as well as the findings are summarized in the
following sections.
1.1 Fish Barrier Assessment
The Casco Bay Estuary Partnership (CBEP) conducted a fish barrier survey of the Trout Brook watershed
in 2009 using the Maine Stream Road Crossing Survey Manual (2008). Surveyors assessed all stream –
road culverts and measured culvert size, outlet drop, pool depth and several other parameters. CBEP
staff evaluated the data and rated fish culverts as passable, severe barriers or potential barriers. Of the
18 culverts, three were
rated as passable, 11 were
rated as potential barriers
and 4 were rated as severe
barriers (Figure 1). The
Hinckley Park ponds on
Kimball Brook were not
evaluated through the study
since they are not road
culverts. However, the
lower pond presents a
severe fish barrier since
there is a drop of several
feet between the dam
outlet and the stream
channel below.
The watershed’s fish
barriers were also
associated with flooding
concerns and undersized
culverts. The CBEP study
found that all three severe
barriers on Trout Brook
were also considered flood
hazards by Cumberland
County Emergency
Trout Brook Watershed Management Plan Appendix B – Stream Channel Assessment Reports
Page 2 of 8
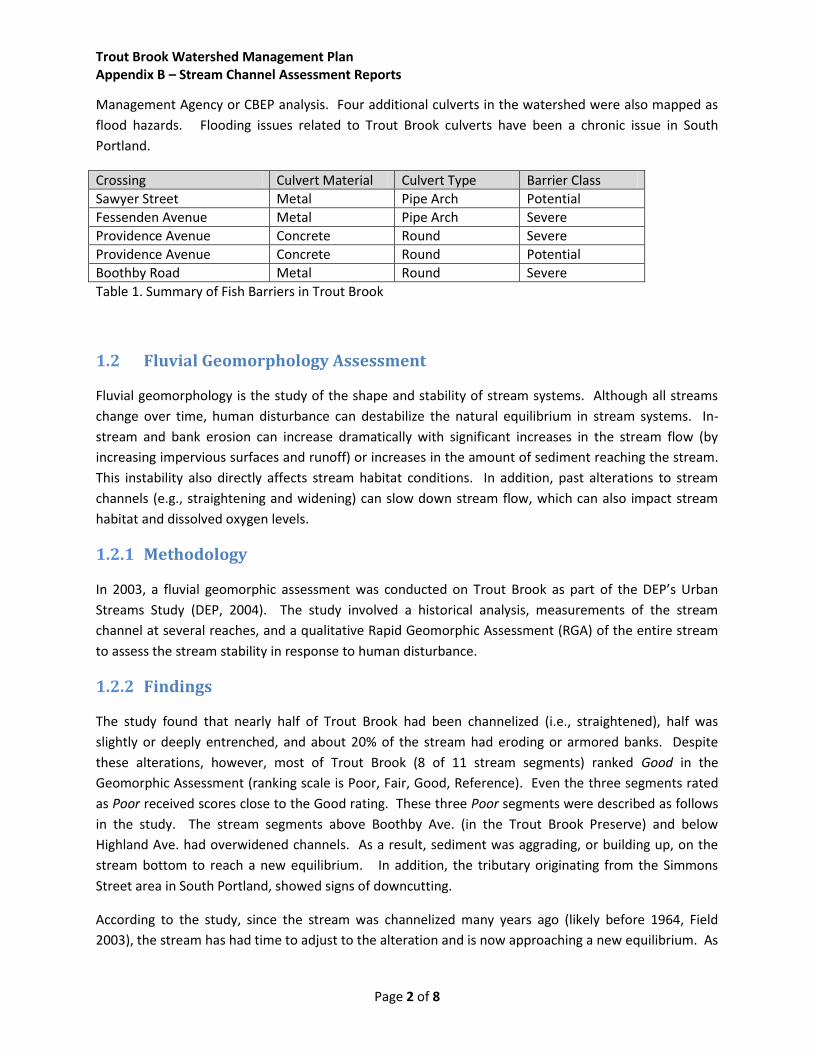
Management Agency or CBEP analysis. Four additional culverts in the watershed were also mapped as
flood hazards. Flooding issues related to Trout Brook culverts have been a chronic issue in South
Portland.
Crossing Culvert Material Culvert Type Barrier Class
Sawyer Street Metal Pipe Arch Potential
Fessenden Avenue Metal Pipe Arch Severe
Providence Avenue Concrete Round Severe
Providence Avenue Concrete Round Potential
Boothby Road Metal Round Severe
Table 1. Summary of Fish Barriers in Trout Brook
1.2 Fluvial Geomorphology Assessment
Fluvial geomorphology is the study of the shape and stability of stream systems. Although all streams
change over time, human disturbance can destabilize the natural equilibrium in stream systems. In-
stream and bank erosion can increase dramatically with significant increases in the stream flow (by
increasing impervious surfaces and runoff) or increases in the amount of sediment reaching the stream.
This instability also directly affects stream habitat conditions. In addition, past alterations to stream
channels (e.g., straightening and widening) can slow down stream flow, which can also impact stream
habitat and dissolved oxygen levels.
1.2.1 Methodology
In 2003, a fluvial geomorphic assessment was conducted on Trout Brook as part of the DEP’s Urban
Streams Study (DEP, 2004). The study involved a historical analysis, measurements of the stream
channel at several reaches, and a qualitative Rapid Geomorphic Assessment (RGA) of the entire stream
to assess the stream stability in response to human disturbance.
1.2.2 Findings
The study found that nearly half of Trout Brook had been channelized (i.e., straightened), half was
slightly or deeply entrenched, and about 20% of the stream had eroding or armored banks. Despite
these alterations, however, most of Trout Brook (8 of 11 stream segments) ranked Good in the
Geomorphic Assessment (ranking scale is Poor, Fair, Good, Reference). Even the three segments rated
as Poor received scores close to the Good rating. These three Poor segments were described as follows
in the study. The stream segments above Boothby Ave. (in the Trout Brook Preserve) and below
Highland Ave. had overwidened channels. As a result, sediment was aggrading, or building up, on the
stream bottom to reach a new equilibrium. In addition, the tributary originating from the Simmons
Street area in South Portland, showed signs of downcutting.
According to the study, since the stream was channelized many years ago (likely before 1964, Field
2003), the stream has had time to adjust to the alteration and is now approaching a new equilibrium. As

Trout Brook Watershed Management Plan Appendix B – Stream Channel Assessment Reports
Page 3 of 8
a result, there are good opportunities to improve the geomorphology of the three segments currently
rated as Poor (unless peak storm flows are expected to change significantly). Both the aggrading
sections mentioned above (Trout Brook Preserve1 and below Highland Ave.) would be good candidates
for reestablishing sinuosity and habitat with logs and/or boulders. The tributary that is downcutting has
a high potential for rapid natural recovery, but recovery could also be accelerated with restoration
activities.
1.3 Stream Corridor Survey
In September 2011, project staff conducted a Stream Corridor Assessment Survey along most of Trout
and Kimball Brooks. The SCA survey method (Maryland DNR, 2001) rapidly assesses the general physical
condition of the stream and identifies the location of a variety of environmental problems and
restoration opportunities within the stream corridor. The primary types of problems sites documented
in Trout Brook included erosion sites, inadequate stream buffers, yard waste dumping sites, stream
channel alterations and exposed or discharging pipes.2 Survey teams collected information about the
size, location and severity of each site and also rated the relative cost and feasibility of restoration.
Stream Corridor Survey locations and findings are summarized on Table 2.
1.3.1 Methodology
The Maryland Department of Natural Resources (DNR) developed a Stream Corridor Assessment Survey
handbook (Maryland DNR 2001) that provides detailed survey and ranking methods. The Maryland DNR
protocols include the following:
Identify Environmental Problems: identify environmental problems that can be seen by
walking along a stream and observing conditions. Water chemistry and other scientific data is
not collected as part of the survey. The problems identified in the SCA survey may include, but
are not limited to: pipe outfalls, trash and yard waste dumping, exposed pipes, fish barriers,
erosion, downcut banks, sedimentation, evidence of nutrient enrichment (excessive algae
growth), and unusual odors.
Assign a Site Number: Establish a system to assign field identification numbers to problem and
representative sites. Give each survey site a unique number so that it can be entered into the
project database.
Record the Problem Locations using field maps, photography, field data sheets, and other
appropriate recording strategies. Record enough accurate information so that the sites can be
1 Some of the recommended geomorphic restoration work was completed in September 2012 in this segment with
funding from a Casco Bay Estuary Partnership grant.
2 The 2003 Trout Brook Watershed Survey Report (South Portland Land Trust, 2003) also documented some of
these erosion and yard waste dumping sites, but this report was not mentioned in depth since the SCA was more
recent and collected more detailed information about each problem site.

Trout Brook Watershed Management Plan Appendix B – Stream Channel Assessment Reports
Page 4 of 8
revisited for follow-up assessment(s) and restoration as necessary. The Trout Brook survey
team used a Trimble GPS unit to geolocate identified sites and record their coordinates on the
project GIS maps.
Severity, Correctability, and Access Ratings are developed for each site in order to prioritize
restoration work.
o Severity is ranked 1 (most severe) through 5 (minor problems). A ranking of 1 indicates
that the problem is among the worst that the field team has seen or would expect to
see. Example: a pipe discharge that was visibly impacting a long stretch of stream (>1/2
mile).
o Correctability is ranked 1 (minor problems) through 5 (major restoration) problems. A
ranking of 5 would require a large expensive effort to correct using heavy equipment, a
large amount of funding, and more than a month of construction time. Example: fish
barrier caused by a dam.
o Accessibility is the relative measure of how difficult it is to reach an identified site and is
ranked 1 (easily accessible by car or foot) through 5 (difficult to access both by foot and
vehicle). Examples of a site that could be ranked “5” include access over steep or
heavily wooded terrain with no trails or roads nearby.
Analyze & Prioritize Projects: Tabulate the problem site data by entering information into the
project database. The tables should include the Site Identification Table, the Problem
Identification Table, and the Representative Site Table (detailed description of each provided in
Maryland DNR 2001).
Develop the Final Stream Corridor Assessment Report to provide a list of the environmental
problems and recommendations on possible steps that could be taken to improve
environmental conditions.
Except where noted herein, project staff completed the stream corridor assessment using the
methodology summarized above.
1.3.2 Findings
Stream Corridor Survey locations and findings are summarized on Table 2 and described in detail in the
following sections.
1.3.2.1 Erosion Sites
Streams naturally transport a certain amount of sediment through their systems, but excess sediment
can be harmful to both stream habitat and water quality. Excess sediments can fill in the spaces
between gravels and other rocks in stream bottoms, eliminating spawning areas, suffocating eggs, and
eliminating habitat for aquatic insects (Maine DEP Stream Survey Manual, 2010). Nutrients and other
pollutants attached to soil particles can impair water quality.
The SCA survey documented 66 soil erosion problems in and adjacent to the stream (see attached
tables). Some sites were limited in size (10-15’ long), and others extended over 100’ in length. The total

Trout Brook Watershed Management Plan Appendix B – Stream Channel Assessment Reports
Page 5 of 8
length of eroded sites was over 4,700 feet. Many of the erosion sites were associated with areas of
inadequate buffers with lawn growing along the streambanks. Other erosion sites were associated with
stormwater outfall pipes, road crossings or footpaths (primarily in Hinckley Park). In terms of severity,
11 sites were rated as high severity, 39 were medium severity and 16 were rated low severity.
1.3.2.2 Inadequate Buffers
Trees and shrubs alongside streams, known as buffers or riparian
areas, provide many stream benefits. These plants provide shade
to keep water temperatures cool and filter out pollutants carried
by stormwater. The deep roots of trees and shrubs help stabilize
streambanks and reduce erosion. In terms of stream habitat, the
leaves and twigs from buffer plants provide food for aquatic life in
the stream. Large wood that falls into the stream channel also
captures this food, provides cover for fish, and helps create pools
and other diverse habitats of aquatic life.
The SCA survey documented 28 areas where the stream buffer was
absent or inadequate. The length of inadequate buffer was just over
2,000 feet on each side of the stream. In terms of relative severity,
there were 4 high, 12 medium and 12 low severity sites. As
mentioned above, many of these were associated with other types
of problems. 21 of the inadequate buffer sites were also associated
with erosion. In many cases, lawn or invasive Japanese knotweed
left streambanks vulnerable to bank streambank erosion. Seven of
the sites were also locations with yard waste dumping, where the piles of debris had likely smothered
the natural streamside vegetation.
1.3.2.3 Yard Waste Dumping Sites
Although yard waste piles located outside the buffer area are usually benign, dumping on streambanks
can impact stream health. Grass clippings can carry excess nutrients and pesticides into the stream.
Piles of yard waste also destroy natural vegetation and leave the stream vulnerable to bank erosion.

Trout Brook Watershed Management Plan Appendix B – Stream Channel Assessment Reports
Page 6 of 8
Dumping was documented at 25 sites adjacent to the stream.
24 of the sites were piles of grass clippings and brush. One site
was used for dumping sand and other debris was documented
next to the stream adjacent to Mahoney Middle School.3 There
were two sites with evidence of grass clippings being dumped
directly into the stream, four large neighborhood dumping sites
(approximately 10 truckloads) and numerous small to medium-
sized debris piles on private lots. In terms of severity of the
sites, there were 14 medium, 10 low and zero high severity sites.
As mentioned above, many of these sites were also associated
with bank erosion and inadequate buffers since the piles tended to smother natural vegetation and
leave areas vulnerable to erosion. It would be relatively easy to remove all of the accumulated debris;
however, landowner education and alternatives would need to be provided to help change the long
term behavior.
1.3.2.4 Stream Channel Alteration
Stream channel alterations include any human-made changes to
the stream course or channel shape (such as straightening or
widening the stream). Alterations can also include additions of
dams, retaining walls or other channel armoring. Such structures
and alterations can block fish passage, impair stream habitat, slow
down stream flow and create channel instability.
14 channel alteration sites were identified in the SCA survey
(Figure _).4 Three of these sites were located in the Trout Brook
Preserve, which was a former gravel pit and significantly altered in the past.5 Seven other sites had
retaining walls armoring the streambanks, two sites in Kimball Brook had corroding metal pipes lying in
the stream and one site had concrete abutments from a former road crossing or dam. The section of
stream running through Sawyer Marsh was also documented since it was channelized many years ago.
3 School staff was made aware of the negative impacts from this and have since changed their practices. In May
2012, students planted vegetation along this streambank with a stewardship grant from the Maine DEP.
4 Note that five sites identified in the Urban Streams Study were added to the maps and spreadsheet for this
category. These are noted in the Site Type on the spreadsheet.
5 Three of these sites were fixed in September 2012. Cobble dams were removed from two parts of the stream; a
opening was cut in the streamside berm to connect the stream to its floodplain; and root wads were added to help
narrow this channelized section of stream.
Cobble dam in Trout Brook Preserve.
Trout Brook Watershed Management Plan Appendix B – Stream Channel Assessment Reports
Page 7 of 8
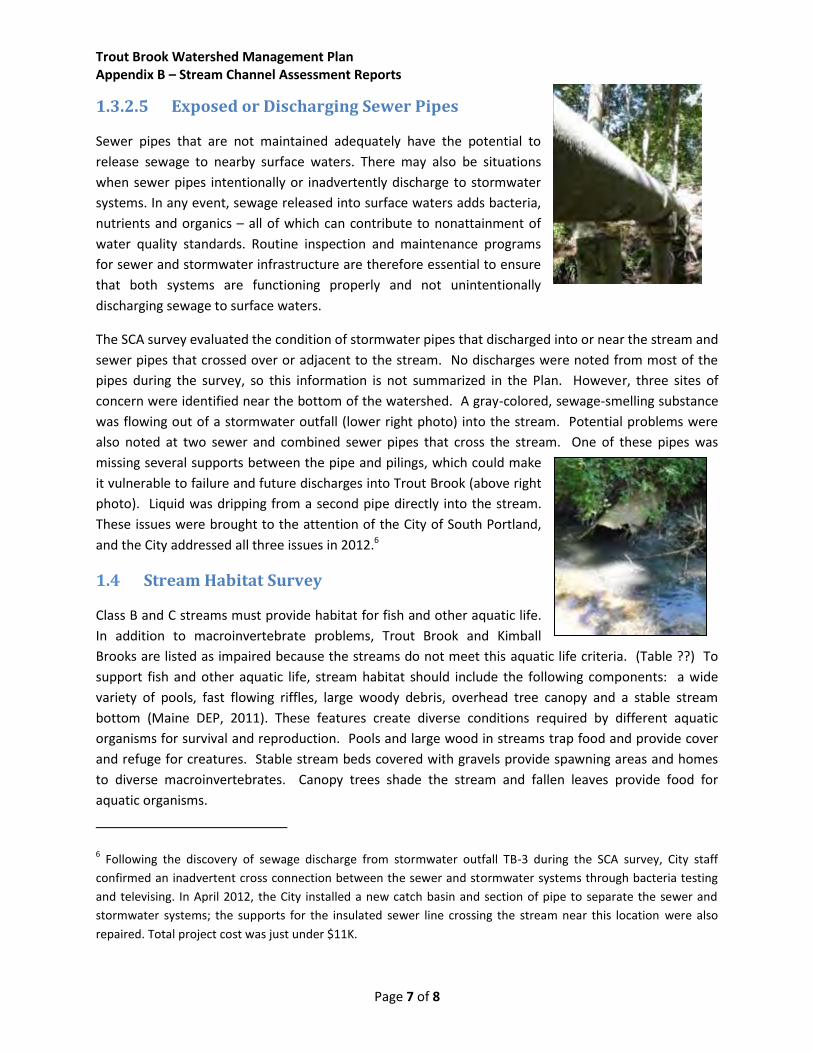
1.3.2.5 Exposed or Discharging Sewer Pipes
Sewer pipes that are not maintained adequately have the potential to
release sewage to nearby surface waters. There may also be situations
when sewer pipes intentionally or inadvertently discharge to stormwater
systems. In any event, sewage released into surface waters adds bacteria,
nutrients and organics – all of which can contribute to nonattainment of
water quality standards. Routine inspection and maintenance programs
for sewer and stormwater infrastructure are therefore essential to ensure
that both systems are functioning properly and not unintentionally
discharging sewage to surface waters.
The SCA survey evaluated the condition of stormwater pipes that discharged into or near the stream and
sewer pipes that crossed over or adjacent to the stream. No discharges were noted from most of the
pipes during the survey, so this information is not summarized in the Plan. However, three sites of
concern were identified near the bottom of the watershed. A gray-colored, sewage-smelling substance
was flowing out of a stormwater outfall (lower right photo) into the stream. Potential problems were
also noted at two sewer and combined sewer pipes that cross the stream. One of these pipes was
missing several supports between the pipe and pilings, which could make
it vulnerable to failure and future discharges into Trout Brook (above right
photo). Liquid was dripping from a second pipe directly into the stream.
These issues were brought to the attention of the City of South Portland,
and the City addressed all three issues in 2012.6
1.4 Stream Habitat Survey
Class B and C streams must provide habitat for fish and other aquatic life.
In addition to macroinvertebrate problems, Trout Brook and Kimball
Brooks are listed as impaired because the streams do not meet this aquatic life criteria. (Table ??) To
support fish and other aquatic life, stream habitat should include the following components: a wide
variety of pools, fast flowing riffles, large woody debris, overhead tree canopy and a stable stream
bottom (Maine DEP, 2011). These features create diverse conditions required by different aquatic
organisms for survival and reproduction. Pools and large wood in streams trap food and provide cover
and refuge for creatures. Stable stream beds covered with gravels provide spawning areas and homes
to diverse macroinvertebrates. Canopy trees shade the stream and fallen leaves provide food for
aquatic organisms.
6 Following the discovery of sewage discharge from stormwater outfall TB-3 during the SCA survey, City staff
confirmed an inadvertent cross connection between the sewer and stormwater systems through bacteria testing
and televising. In April 2012, the City installed a new catch basin and section of pipe to separate the sewer and
stormwater systems; the supports for the insulated sewer line crossing the stream near this location were also
repaired. Total project cost was just under $11K.
Trout Brook Watershed Management Plan Appendix B – Stream Channel Assessment Reports
Page 8 of 8
As watersheds become more urbanized, stream habitat is often degraded and destabilized.
Construction activities adjacent to streams can remove tree canopy and relocate and artificially armor
stream channels. As impervious surfaces increase in the watershed the changing flow regime can
increase streambank erosion; increase sedimentation in pools and spawning areas; and destabilize the
stream bottom and large woody debris. Several assessments have been conducted to evaluate the
quality of Trout Brook’s stream habitat. Maine DEP and local volunteers conducted a Stream Corridor
Survey in conjunction with the South Portland Land Trust’s watershed survey in June, 2003. A
qualitative Rapid Habitat Survey was also conducted in 2003 in conjunction with the Rapid Geomorphic
Survey. In addition, the MDEP Urban Streams Study evaluated habitat conditions such as flow regime,
substrate, pool variability and woody debris at two reaches.
In contrast to the relatively good geomorphology ratings, Trout Brook only had only one segment with a
Good rating in the Rapid Habitat Assessment (RHA). The remaining 10 segments were rated as having
Poor habitat. Approximately 95% of the stream was completely lacking in large woody debris (greater
than 8” in diameter), and the remaining 5% of the stream only had 1-2 pieces of large woody debris per
100 feet.
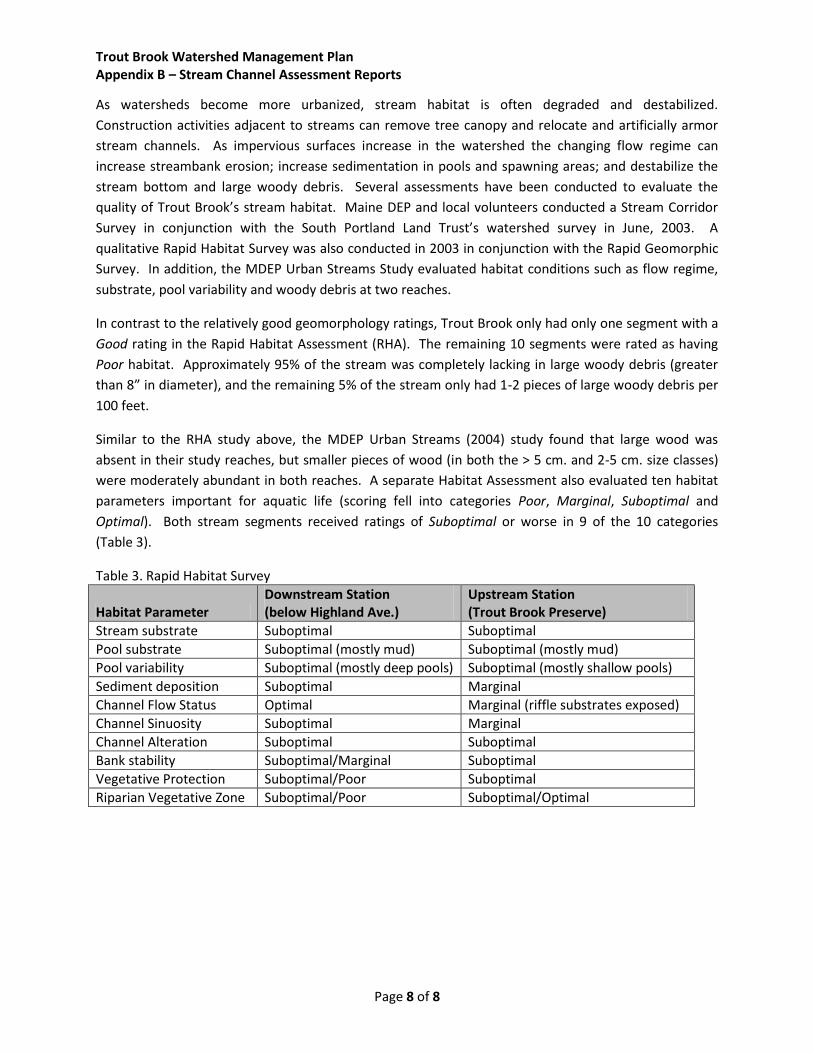
Similar to the RHA study above, the MDEP Urban Streams (2004) study found that large wood was
absent in their study reaches, but smaller pieces of wood (in both the > 5 cm. and 2-5 cm. size classes)
were moderately abundant in both reaches. A separate Habitat Assessment also evaluated ten habitat
parameters important for aquatic life (scoring fell into categories Poor, Marginal, Suboptimal and
Optimal). Both stream segments received ratings of Suboptimal or worse in 9 of the 10 categories
(Table 3).
Table 3. Rapid Habitat Survey
Habitat Parameter Downstream Station (below Highland Ave.)
Upstream Station (Trout Brook Preserve)
Stream substrate Suboptimal Suboptimal
Pool substrate Suboptimal (mostly mud) Suboptimal (mostly mud)
Pool variability Suboptimal (mostly deep pools) Suboptimal (mostly shallow pools)
Sediment deposition Suboptimal Marginal
Channel Flow Status Optimal Marginal (riffle substrates exposed)
Channel Sinuosity Suboptimal Marginal
Channel Alteration Suboptimal Suboptimal
Bank stability Suboptimal/Marginal Suboptimal
Vegetative Protection Suboptimal/Poor Suboptimal
Riparian Vegetative Zone Suboptimal/Poor Suboptimal/Optimal

Table 1. Catchment Scoring Summary
Page 1 of 5
Map ID Stormwater Outfall Catchment
Impact Benefit Retrofit
Feasibility Cost
Priority Ranking
Description of Potential Retrofits and Limitations
Phase I Retrofits
M 29 Ocean House Road (near Site TB)
Medium High High Medium 16 Connect runoff from upper parking lot and horse paddocks with existing stormwater pond and/or gravel wetland. Retrofit pond to provide better treatment
G Rte 77 & Harrison
Medium Medium Medium Low 14 Work with business owner to explore installing treatment/infiltration system and/or using P-free products.
O 29 Ocean House Road (near Site TB)
Low Low High Low 12 Create series of curb cuts and install wildflower buffer in grassed area to treat parking lot runoff.
Z Office building on Spurwink
Medium Medium Medium Medium 12
Possible bioretention cell; close off catch basin and install level spreader to grass filter strip; or remove berm adjacent to building to allow sheet flow into grass/field. Catchment not mapped yet.
Z2 Pleasant Ave. neighborhood
Medium Medium Medium Medium 12 Large part of neighborhood drains to stream. Retrofit would be beneficial since impact to small stream could be significant. Catchment not mapped yet.
DD Wildrose (Kimball)
Medium Low Medium Medium 12 Stabilize large gully.

Table 1. Catchment Scoring Summary
Page 2 of 5
Map ID Stormwater Outfall Catchment
Impact Benefit Retrofit
Feasibility Cost
Priority Ranking
Description of Potential Retrofits and Limitations
Phase II Retrofits
D Sawyer/Parrot Low Low High Medium 10
Manhole on public path ROW with pipe leaving manhole ~5-6' to invert. Could replace with shallower pipe, daylight @ edge of property and install a buffer, spreader system along 300' x 100' area @ low cost/high treatment if salt infiltration is not a concern. If there are salt infiltration concerns, install system(s) that do(es) not infiltrate water . Need to complete basic geological assessment as part of design.
E Rte 77 and State Mediu
m Medium Medium High 10
Tree boxes and rain gardens. Neighborhood also interested in rain gardens and Yardscaping. Need to consider chronic water/flooding problems in neighborhood.
G Rte 77 & Harrison
Medium
Medium Medium High 10
Install tree box filters above each catch basin on Route 77 (about 4 total, two on each side of street). Could also install linear underdrained filter under the swale in front of the building. Could possibly be designed to cover catch basins, build up bump at top of driveway and cut curbing to treat large amount of road. Better storage and treatment than tree boxes.
B Rte 77 and Bellaire
Medium
Medium Medium High 10
Tree box filters would address nutrients and flow issues (possible location @ #72). If infiltration of road salt is a concern, rain gardens should only capture driveway and roof runoff.

Table 1. Catchment Scoring Summary
Page 3 of 5
Map ID Stormwater Outfall Catchment
Impact Benefit Retrofit
Feasibility Cost
Priority Ranking
Description of Potential Retrofits and Limitations
Q Wilton Ln -off State
Low Medium Low Medium 8
Evaluated possibility of installing a shallow culvert out of existing catch basin or a paved swale to send runoff into existing buffer and a level spreader. Low feasibility since this neighborhood has chronic flooding issues.
H Bellaire/Beaufort
Low Low High High 8 Could install tree boxes on each side of catch basins on corner of Beaufort and Fessenden and one near stream on either side of road (6 total).
I Boothby Mediu
m Medium Low High 8
Small gravel wetland could treat first flush and bypass larger flows. Adjacent neighbors concerned about flooding, aesthetics and City maintenance of existing ROW, exposed pipe and brush.
K Waterhouse Low Low Medium Medium 8 Stable outfall outlet. Does not appear to be large flows & buffer to stream.
L Walnut Cul de Sac
Low Medium Low Medium 8 1 tree box possible above catch basin (by basketball hoop), but would need to remove one pine tree.
U Fessenden Low Low Medium Medium 8 One tree box possible across from residence next to catch basin.
A Kaler/Clifford Mediu
m Low Low High 6
Stormwater outfall retrofits not feasible since outfall drains into wetland. No space or elevation for BMP installation and NRPA restrictions. Yardscaping campaign to reduce phosphorus and salt.

Table 1. Catchment Scoring Summary
Page 4 of 5
Map ID Stormwater Outfall Catchment
Impact Benefit Retrofit
Feasibility Cost
Priority Ranking
Description of Potential Retrofits and Limitations
F Mitchell Low Low Low Medium 6 Road and new development drains to and blows out intermittent stream, but flow disperses into Sawyer Marsh before reaching Trout Brook.
R Linwood Low Low Low Medium 6 Outfall drains into Sawyer Marsh. Low priority since no channelized flow to stream. No room for tree boxes.
S Waterhouse Cul de sac
Low Low Low Medium 6 Did not evaluate yet, but deemed low priority since small area discharges via sheet flow to Sawyer Marsh.
T Sawyer and Marsh (south)
Low Low Low Medium 6 Did not evaluate yet, but deemed low priority since small size.
V Marsh/Sawyer Low Low Low Medium 6 Did not evaluate yet, but deemed low priority since small size.
W Marsh Rd Low Low Low Medium 6 Did not evaluate yet, but deemed low priority since small size.
X Norman/Spear Low Low Low Medium 6 Outfall drains into Sawyer Marsh. Low priority since no channelized flow to stream and permitting restrictions.
Y Linwood 2 Low Low Low Medium 6 Small drainage area. Outfall drains into wetland. Low priority since no channelized flow to stream.
Z1 Pleasant Ave. tributary
Low Low Low Medium 6 Did not delineate yet. Pleasant Ave. drainage to stream trib. No retrofit opportunities evident.
C Florence/Somerset
Low Low Low High 4 Outfall drains into Sawyer Marsh so difficult to install retrofits. Low priority since no channelized flow to stream.
J Sawyer/Marsh (north)
Low Low Low High 4 No possibilities evident due to sidewalks, slope and walls etc. at catch basin locations.
N Sawyer Brook Circle
Low Low Low High 4 No possibilities evident.
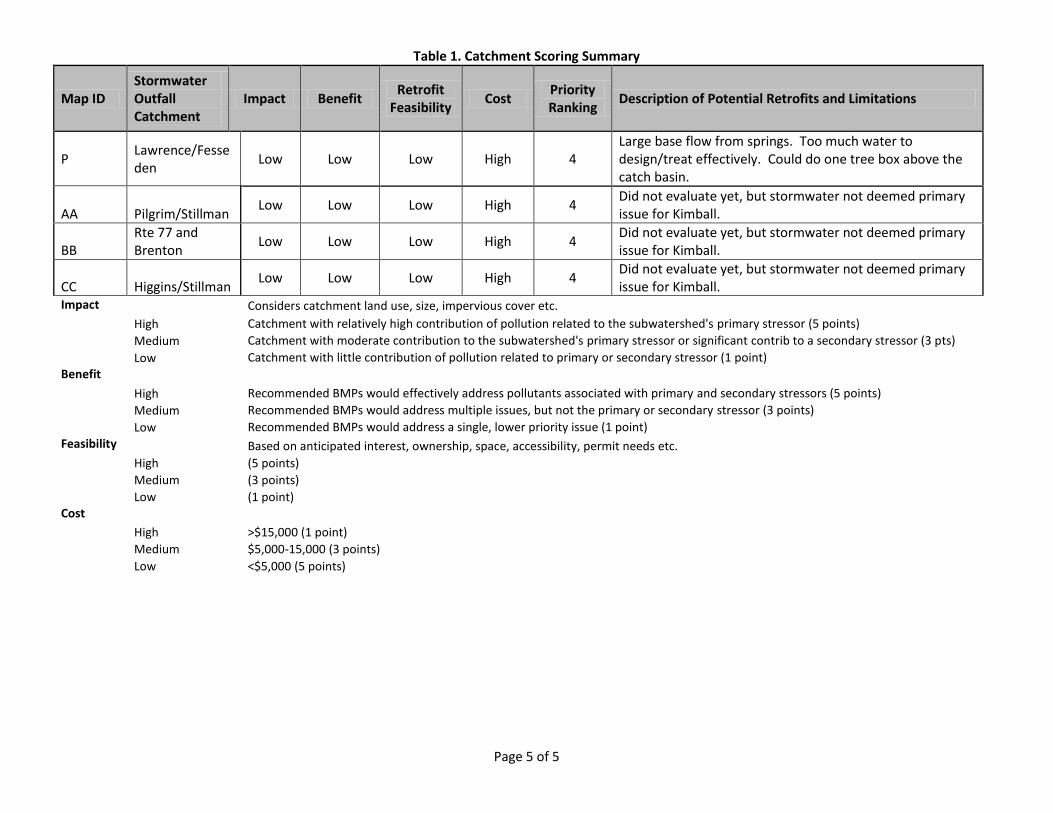
Table 1. Catchment Scoring Summary
Page 5 of 5
Map ID Stormwater Outfall Catchment
Impact Benefit Retrofit
Feasibility Cost
Priority Ranking
Description of Potential Retrofits and Limitations
P Lawrence/Fesseden
Low Low Low High 4 Large base flow from springs. Too much water to design/treat effectively. Could do one tree box above the catch basin.
AA Pilgrim/Stillman Low Low Low High 4
Did not evaluate yet, but stormwater not deemed primary issue for Kimball.
BB Rte 77 and Brenton
Low Low Low High 4 Did not evaluate yet, but stormwater not deemed primary issue for Kimball.
CC Higgins/Stillman Low Low Low High 4
Did not evaluate yet, but stormwater not deemed primary issue for Kimball.
Impact
Considers catchment land use, size, impervious cover etc.
High Catchment with relatively high contribution of pollution related to the subwatershed's primary stressor (5 points)
Medium Catchment with moderate contribution to the subwatershed's primary stressor or significant contrib to a secondary stressor (3 pts)
Low Catchment with little contribution of pollution related to primary or secondary stressor (1 point)
Benefit
High Recommended BMPs would effectively address pollutants associated with primary and secondary stressors (5 points)
Medium Recommended BMPs would address multiple issues, but not the primary or secondary stressor (3 points)
Low Recommended BMPs would address a single, lower priority issue (1 point)
Feasibility
Based on anticipated interest, ownership, space, accessibility, permit needs etc.
High (5 points)
Medium (3 points)
Low (1 point)
Cost
High >$15,000 (1 point)
Medium $5,000-15,000 (3 points)
Low <$5,000 (5 points)

Data Sources: CoSP, Maine GIS, MDEPMap Date: 10/7/12
_̂_̂
_̂_̂̂__̂̂_
_̂̂_
_̂_̂
_̂_̂
_̂̂_
_̂̂_̂_
_̂̂__̂̂_ _̂̂__̂
_̂_̂
_̂ _̂
_̂_̂
_̂
_̂̂_
_̂
_̂̂_̂_̂__̂
_̂_̂̂_
_̂
_̂_̂_̂_̂̂_
_̂
_̂_̂
_̂
_̂
_̂
_̂_̂̂_
_̂
_̂_̂
_̂
_̂_̂
_̂̂__̂
T r o u t
B r
o o
k
K i m b a
l l
B r o o k
S A W
Y E
R
S T R
E E
T
S P
U R
W I
N K
R
O A
D
M I T C H E L L R O A D
H I G H L A N D A
V E
S T I L L M A N S T
C O T T A G E R O A D
T r o u t B r o o k
O C E A N H O U S E R D
SawyerMarshHinkley
Park
Maxwell'sFarm
MillCreekPark Providence Ave
6665
51
47 45
31
36
13 242319 21
9 87
654
321
67
6463
62
6160
5958
5756
5554
53
52
504948
464443
4241
4039 38
37
353433
32
30
2928
27
26
25222018
1716
1514
12 1110
2012 Trout Brook Watershed Management PlanStream Corridor Erosion Sites
0 0.25 0.5 0.75Miles
E
MAINE
Project Area
M A I N E
Type of SiteStream Corridor Erosion_̂

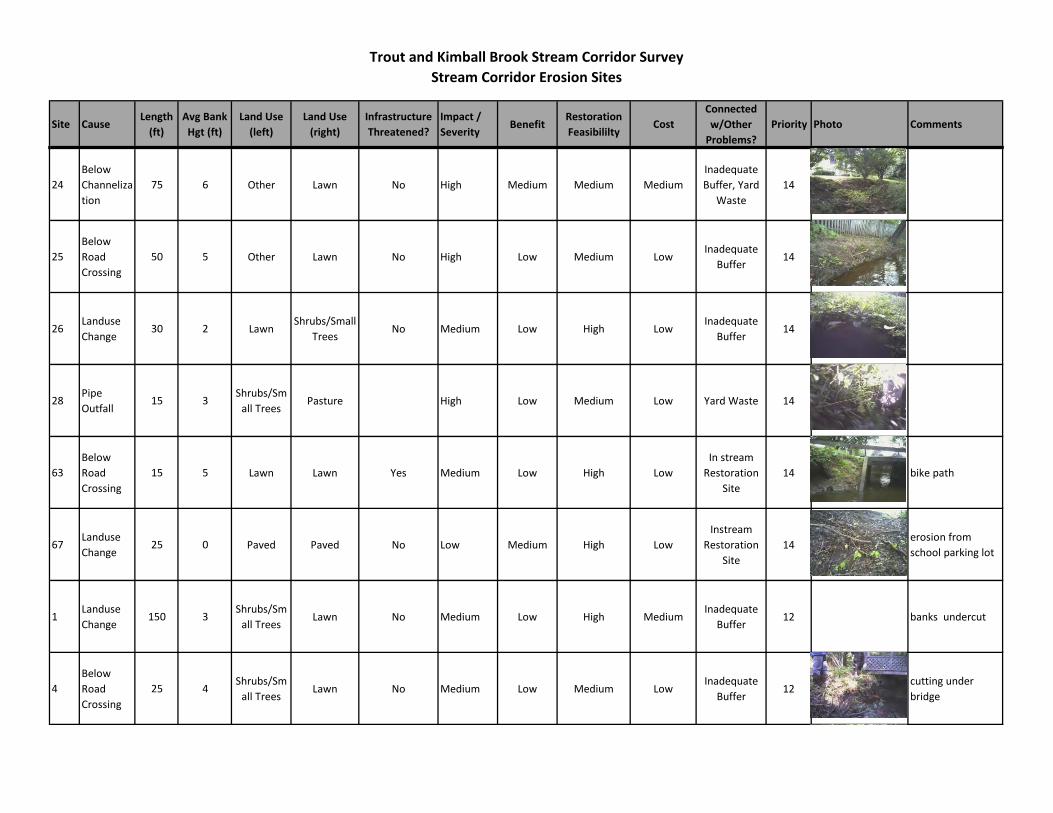
Trout and Kimball Brook Stream Corridor Survey
Stream Corridor Erosion Sites
Site CauseLength
(ft)
Avg Bank
Hgt (ft)
Land Use
(left)
Land Use
(right)
Infrastructure
Threatened?
Impact /
SeverityBenefit
Restoration
FeasibililtyCost
Connected
w/Other
Problems?
Priority Photo Comments
65Landuse
Change15 6 Lawn Paved No Medium Low High Low
Instream
Restoration
Site
14
3Pipe
Outfall25 2 Invasives Lawn Yes High High Medium High
Possible
Bacteria
Source
14
large silt deposit in
stream from pipe,
sewage?
7Pipe
Outfall50 4 Forest Forest Yes High High Medium High
Pipe break,
possible
bacteria
source
14 located at pipeline
crossing
12Landuse
Change20 3 Forest Lawn No Medium Medium Medium Low
Inadequate
Buffer 14
17Pipe
Outfall6 5
Multiflora
RoseLow No Medium Low High Low 14 knotweed
18Pipe
Outfall6 8
Multiflora
RoseLow No Medium Low High Low 14 knotweed
21
Below
Road
Crossing
10 4 Forest Forest No High Medium Medium Medium
Instream
Restoration
Site
14 old trail xing
23Landuse
Change75 5 Forest Forest No Medium Low High Low 14
trail erosion,
coordinate with
Preserve Plan
Phase I Restoration Sites
Trout and Kimball Brook Stream Corridor Survey
Stream Corridor Erosion Sites
Site CauseLength
(ft)
Avg Bank
Hgt (ft)
Land Use
(left)
Land Use
(right)
Infrastructure
Threatened?
Impact /
SeverityBenefit
Restoration
FeasibililtyCost
Connected
w/Other
Problems?
Priority Photo Comments
Phase I Restoration Sites24
Below
Channeliza
tion
75 6 Other Lawn No High Medium Medium Medium
Inadequate
Buffer, Yard
Waste
14
25
Below
Road
Crossing
50 5 Other Lawn No High Low Medium LowInadequate
Buffer14
26Landuse
Change30 2 Lawn
Shrubs/Small
TreesNo Medium Low High Low
Inadequate
Buffer14
28Pipe
Outfall15 3
Shrubs/Sm
all TreesPasture High Low Medium Low Yard Waste 14
63
Below
Road
Crossing
15 5 Lawn Lawn Yes Medium Low High Low
In stream
Restoration
Site
14 bike path
67Landuse
Change25 0 Paved Paved No Low Medium High Low
Instream
Restoration
Site
14 erosion from
school parking lot
1Landuse
Change150 3
Shrubs/Sm
all TreesLawn No Medium Low High Medium
Inadequate
Buffer12 banks undercut
4
Below
Road
Crossing
25 4Shrubs/Sm
all TreesLawn No Medium Low Medium Low
Inadequate
Buffer12
cutting under
bridge
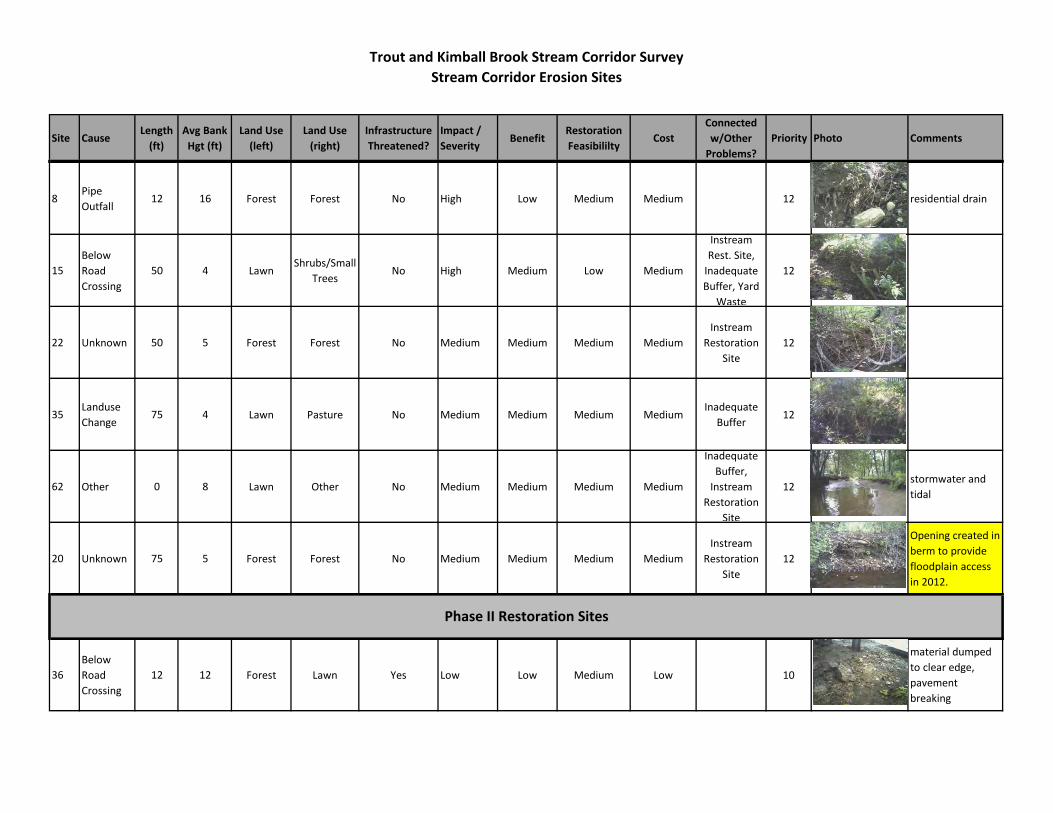
Trout and Kimball Brook Stream Corridor Survey
Stream Corridor Erosion Sites
Site CauseLength
(ft)
Avg Bank
Hgt (ft)
Land Use
(left)
Land Use
(right)
Infrastructure
Threatened?
Impact /
SeverityBenefit
Restoration
FeasibililtyCost
Connected
w/Other
Problems?
Priority Photo Comments
Phase I Restoration Sites8
Pipe
Outfall12 16 Forest Forest No High Low Medium Medium 12 residential drain
15
Below
Road
Crossing
50 4 LawnShrubs/Small
TreesNo High Medium Low Medium
Instream
Rest. Site,
Inadequate
Buffer, Yard
Waste
12
22 Unknown 50 5 Forest Forest No Medium Medium Medium Medium
Instream
Restoration
Site
12
35Landuse
Change75 4 Lawn Pasture No Medium Medium Medium Medium
Inadequate
Buffer12
62 Other 0 8 Lawn Other No Medium Medium Medium Medium
Inadequate
Buffer,
Instream
Restoration
Site
12 stormwater and
tidal
20 Unknown 75 5 Forest Forest No Medium Medium Medium Medium
Instream
Restoration
Site
12
Opening created in
berm to provide
floodplain access
in 2012.
36
Below
Road
Crossing
12 12 Forest Lawn Yes Low Low Medium Low 10
material dumped
to clear edge,
pavement
breaking
Phase II Restoration Sites

Trout and Kimball Brook Stream Corridor Survey
Stream Corridor Erosion Sites
Site CauseLength
(ft)
Avg Bank
Hgt (ft)
Land Use
(left)
Land Use
(right)
Infrastructure
Threatened?
Impact /
SeverityBenefit
Restoration
FeasibililtyCost
Connected
w/Other
Problems?
Priority Photo Comments
Phase I Restoration Sites39
Landuse
Change100 3 Lawn
Shrubs/Small
TreesNo Medium Low Medium Medium
Metal
deflectors in
stream,
Inadequate
buffer
10 Kimball Brook
40 Unknown 40 2 LawnMultiflora
RoseNo Low Low Medium Low
Inadequate
Buffer10
Kimball Brook -
eroded runoff rill
entering stream
2
Below
Road
Crossing
15 12 Lawn Other Yes Low Low Medium Low 10pavement
breaking above
37
Bend at
steep
Slope
50 4Shrubs/Sm
all Trees
Shrubs/Small
TreesNo Medium Low Low Low
Inadequate
Buffer10 Kimball Brook
38
Bend at
steep
Slope
50 4Shrubs/Sm
all Trees
Shrubs/Small
TreesNo Medium Low Low Low
Inadequate
Buffer10 Kimball Brook
47
Below
Road
Crossing
150 1 Forest Forest No Low Low Medium Low 10
Kimball Brook.
Hinckley Park -
install trail
waterbars
41
Bend at
steep
Slope
75 3Multiflora
RoseLawn No Medium Low Medium Medium
Inadequate
Buffer,
Retaining
Walls along
edge
10 Kimball Brook -
knotweed
45
Below
Road
Crossing
300 2 Forest Forest No Medium Low Medium Medium 10
Kimball Brook -
gully from wild
rose
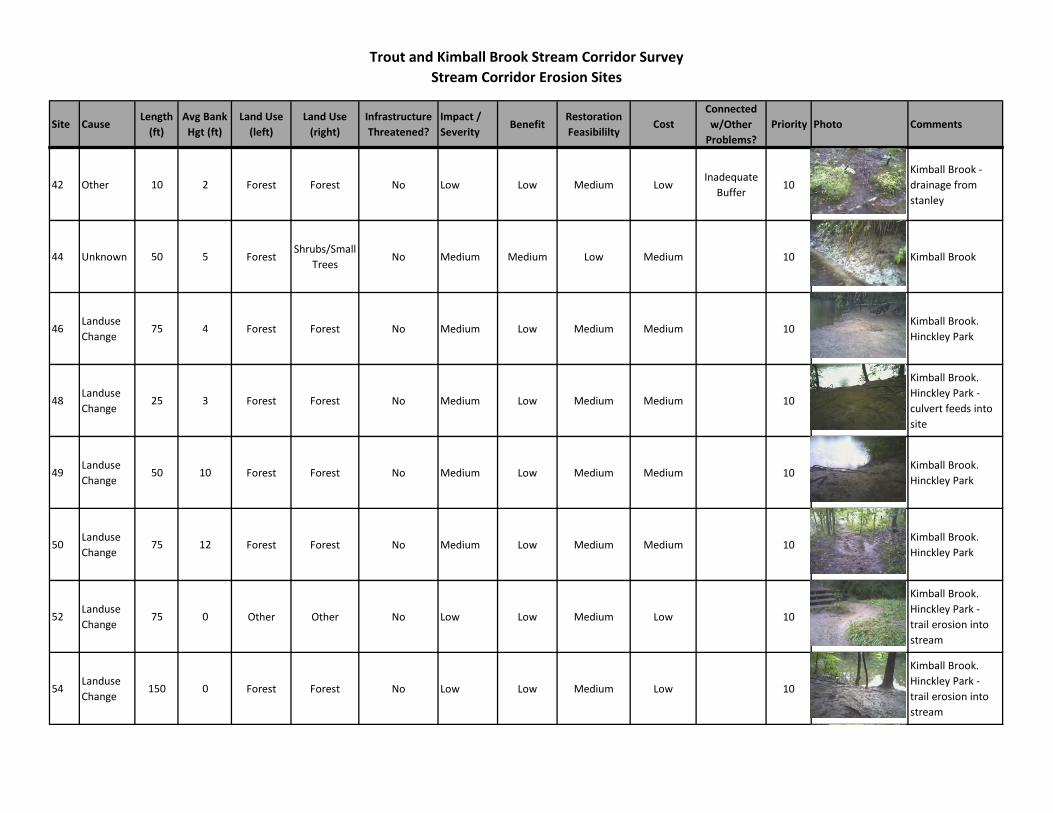
Trout and Kimball Brook Stream Corridor Survey
Stream Corridor Erosion Sites
Site CauseLength
(ft)
Avg Bank
Hgt (ft)
Land Use
(left)
Land Use
(right)
Infrastructure
Threatened?
Impact /
SeverityBenefit
Restoration
FeasibililtyCost
Connected
w/Other
Problems?
Priority Photo Comments
Phase I Restoration Sites42 Other 10 2 Forest Forest No Low Low Medium Low
Inadequate
Buffer10
Kimball Brook -
drainage from
stanley
44 Unknown 50 5 ForestShrubs/Small
TreesNo Medium Medium Low Medium 10 Kimball Brook
46Landuse
Change75 4 Forest Forest No Medium Low Medium Medium 10
Kimball Brook.
Hinckley Park
48Landuse
Change25 3 Forest Forest No Medium Low Medium Medium 10
Kimball Brook.
Hinckley Park -
culvert feeds into
site
49Landuse
Change50 10 Forest Forest No Medium Low Medium Medium 10
Kimball Brook.
Hinckley Park
50Landuse
Change75 12 Forest Forest No Medium Low Medium Medium 10
Kimball Brook.
Hinckley Park
52Landuse
Change75 0 Other Other No Low Low Medium Low 10
Kimball Brook.
Hinckley Park -
trail erosion into
stream
54Landuse
Change150 0 Forest Forest No Low Low Medium Low 10
Kimball Brook.
Hinckley Park -
trail erosion into
stream

Trout and Kimball Brook Stream Corridor Survey
Stream Corridor Erosion Sites
Site CauseLength
(ft)
Avg Bank
Hgt (ft)
Land Use
(left)
Land Use
(right)
Infrastructure
Threatened?
Impact /
SeverityBenefit
Restoration
FeasibililtyCost
Connected
w/Other
Problems?
Priority Photo Comments
Phase I Restoration Sites
57Landuse
Change15 0
Shrubs/Sm
all Trees
Shrubs/Small
TreesNo Low Low Medium Low 10
Kimball Brook.
Hinckley Park -
trail ford
60
Below
Road
Crossing
50 4 Lawn Forest No Medium Medium Medium HighInadequate
Buffer10 Kimball Brook
10Landuse
Change100 3
Shrubs/Sm
all TreesLawn No Medium Low Medium Medium
Inadequate
Buffer10
11Landuse
Change100 3 Crop field
Shrubs/Small
TreesNo Medium Low Medium Medium
Inadequate
Buffer10
29Pipe
Outfall150 4 Forest Forest No Medium Low Medium Medium 10
31 Unknown 75 2Shrubs/Sm
all Trees
Shrubs/Small
TreesNo Medium Low Medium Medium
Inadequate
Buffer10
32 Unknown 75 3Shrubs/Sm
all TreesPasture No Medium Low Medium Medium
Inadequate
Buffer10
33 Unknown 75 3Shrubs/Sm
all Trees
Shrubs/Small
TreesNo Medium Low Medium Medium 10

Trout and Kimball Brook Stream Corridor Survey
Stream Corridor Erosion Sites
Site CauseLength
(ft)
Avg Bank
Hgt (ft)
Land Use
(left)
Land Use
(right)
Infrastructure
Threatened?
Impact /
SeverityBenefit
Restoration
FeasibililtyCost
Connected
w/Other
Problems?
Priority Photo Comments
Phase I Restoration Sites53
Landuse
Change25 0 Forest Forest No Low Low Medium Low 10
Kimball Brook -
crushed stone
placed down
56Landuse
Change25 0 Forest Forest No Low Low Medium Low 10
Kimball Brook -
Hinckley Park
64
Below
Road
Crossing
75 8 Lawn Lawn No Medium Medium Medium High
Inadequate
Buffer,
Instream
Restoration
Site
10
66
Below
Road
Crossing
300 8 Paved Lawn No Medium Medium Medium High
Instream
Restoration
Site
10
14
Below
Road
Crossing
75 3 PastureShrubs/Small
TreesNo High Medium Low
Inadequate
Buffer,
Instream
Rest. Site
Instream
Rest. Site,
Inadequate
Buffer
9
43Landuse
Change75 3
Multiflora
Rose
Multiflora
RoseNo Low Low Medium Medium 8 Kimball Brook
59Landuse
Change100 3
Shrubs/Sm
all Trees
Shrubs/Small
TreesNo Low Low Medium Medium
Inadequate
Buffer8
Kimball Brook -
knotweed
55Landuse
Change50 5 Forest Forest No Medium Low Low Medium 8
Kimball Brook -
Hinckley Park

Trout and Kimball Brook Stream Corridor Survey
Stream Corridor Erosion Sites
Site CauseLength
(ft)
Avg Bank
Hgt (ft)
Land Use
(left)
Land Use
(right)
Infrastructure
Threatened?
Impact /
SeverityBenefit
Restoration
FeasibililtyCost
Connected
w/Other
Problems?
Priority Photo Comments
Phase I Restoration Sites58
Landuse
Change45 0
Shrubs/Sm
all Trees
Shrubs/Small
TreesNo Low Low Medium Medium 8
Kimball Brook -
Hinckley Park
61
Below
Channeliza
tion
25 15 Lawn Forest No Medium Low Low Medium 8
Kimball Brook -
Hinckley Park -
knotweed
5 Unknown 250 3 Invasives Invasives No High Low Low HighInadequate
Buffer8
undercut right
bank
6Landuse
Change250 3 Invasives Invasives No Medium Low Medium High
Inadequate
Buffer8
knotweed vertical
banks
9Landuse
Change100 20 Forest Forest No Medium Low Medium High 8
erosion on steep
banks
13 Unknown 200 4 Forest Forest No High Low Low HighInstream
Rest. Site8
16Landuse
Change40 5
Shrubs/Sm
all Trees
Multiflora
RoseNo Medium Low Low Medium 8 knotweed
27 Unknown 30 3Shrubs/Sm
all Trees
Shrubs/Small
TreesNo Low Low Medium Medium 8
Trout and Kimball Brook Stream Corridor Survey
Stream Corridor Erosion Sites
Site CauseLength
(ft)
Avg Bank
Hgt (ft)
Land Use
(left)
Land Use
(right)
Infrastructure
Threatened?
Impact /
SeverityBenefit
Restoration
FeasibililtyCost
Connected
w/Other
Problems?
Priority Photo Comments
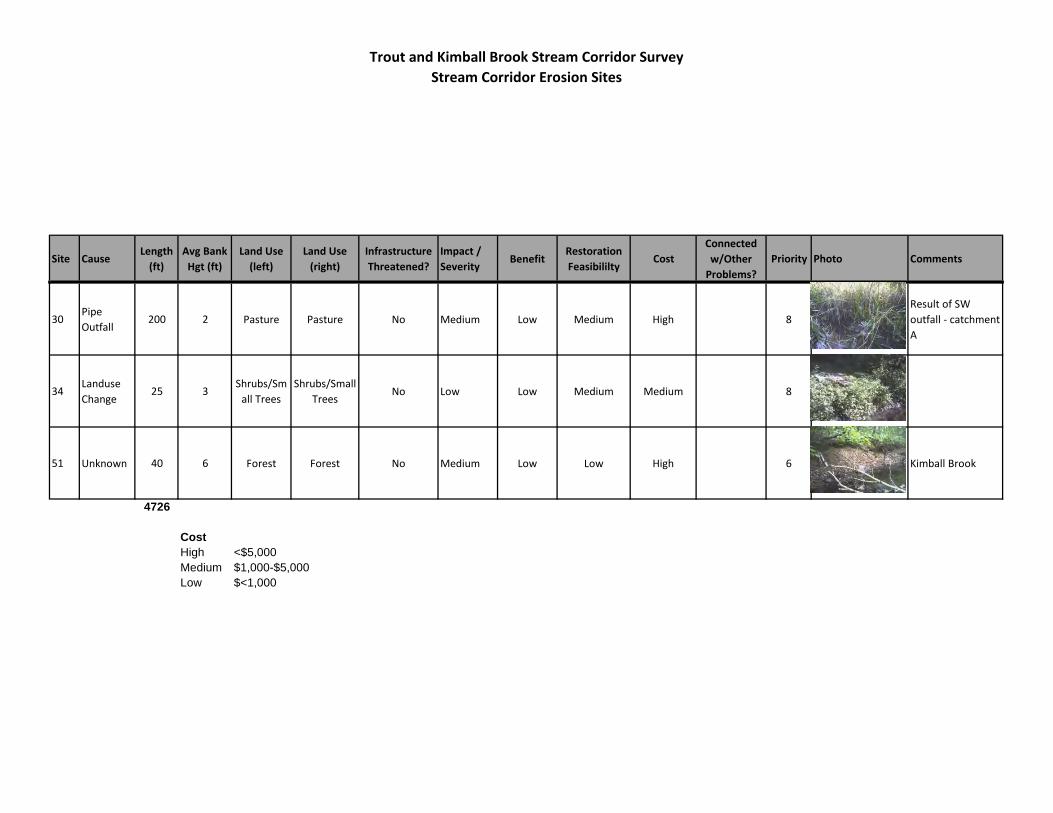
Phase I Restoration Sites30
Pipe
Outfall200 2 Pasture Pasture No Medium Low Medium High 8
Result of SW
outfall - catchment
A
34Landuse
Change25 3
Shrubs/Sm
all Trees
Shrubs/Small
TreesNo Low Low Medium Medium 8
51 Unknown 40 6 Forest Forest No Medium Low Low High 6 Kimball Brook
4726
Cost
High <$5,000
Medium $1,000-$5,000
Low $<1,000

Trout and Kimball Brook Stream Corridor Survey
Exposed Pipe Sites
Pipe
LocationType
Diameter
(inches)
Length
Exposed
(ft)
DischargeImpact/
SeverityBenefit
Restoration
FeasibilityCost
Connect w/
Other
Problems?
Priority Photo Comments
Adjacent
to streamMetal Yes High High High High Bacteria 20
Sewer pipe in road
connected to outfall,
drains to stream. City
repaired in 2012.
Above
streamConcrete 24 30 Yes Medium High High High Bacteria 18
Combined sewer pipe
leaking into stream.
Above
streamConcrete 24 30 No Low Medium High Low Bacteria 10
Pilings in stream
missing 2 supports.
City repaired in 2012.
Phase I Restoration Sites
Data Sources: CoSP, Maine GIS, MDEPMap Date: 10/7/12
!?
!?!?
!?!?!?!?!?
!?
!?!?!?
!?
!?
!?!?
!?
!?!?!?
!?!?
!?!?
!?
!?
!?
!?
T r o u t
B r
o o
k
K i m b a
l l
B r o o k
S A W
Y E
R
S T R
E E
T
S P
U R
W I
N K
R
O A
D
M I T C H E L L R O A D
H I G H L A N D A
V E
S T I L L M A N S T
C O T T A G E R O A D
T r o u t B r o o k
O C E A N H O U S E R D
SawyerMarshHinkley
Park
Maxwell'sFarm
MillCreekPark Providence Ave
23
11
15
9 8
76
54
32
1
28
27
26
25
24
2221
2019
18
17 16
14
13
1210
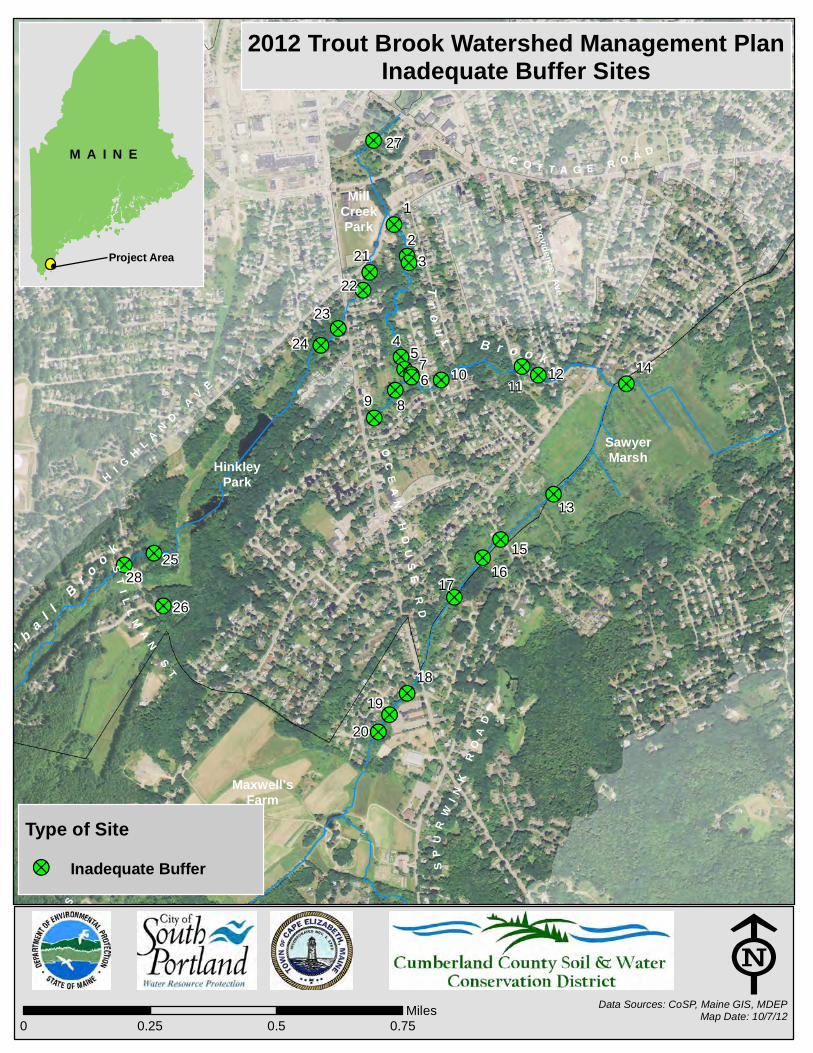
2012 Trout Brook Watershed Management PlanInadequate Buffer Sites
0 0.25 0.5 0.75Miles
E
MAINE
Project Area
M A I N E
Type of SiteInadequate Buffer!?

Trout and Kimball Brook Stream Corridor Assessment
Inadequate Buffer Sites
SiteSide(s) of
Stream
Buffer
Width
Left (ft)
Buffer
Width
Right (ft)
Length
Left (ft)
Length
Right (ft)
Land Use
Left
Land Use
Right
Impact/
SeverityBenefit
Restoration
FeasilityCost
Connected
w/ Other
Problems?
Priority Photo Comments
20 Left 0 0 75 0 Lawn
Shrubs/
Small
Trees
High High High Medium
Bank
Erosion,
Lawn
Nutrients
18
Multiple
landowners.
Interested in
plantings.
9 Left 0 0 50 0 Lawn
Shrubs/S
mall
Trees
Medium Medium High LowBank Erosion,
Yard Waste,
Instream
16
19 Left 10 0 75 0 Lawn
Shrubs/
Small
Trees
Low High High LowYard Waste,
Erosion, Lawn
Nutrients
16
Multiple
landowners.
Interested in
plantings.
18 Both 10 15 100 100 LawnParking
LotHigh Medium High Medium
Nutrients,
Bank
erosion,
Shading
16
Multiple
landowners.
Interested in
plantings.
2 Right 0 0 0 50 Invasives Lawn Medium Low High Low Bank Erosion 14
4 Right 200 0 0 25 Lawn Invasives Medium Low High Low Bank Erosion 14
8 Right 0 0 0 50 Forest Lawn Low Medium High Low Bank Erosion 14
11 Right 10 0 150 150 Other Lawn Medium Medium High Medium
Bank
Erosion,
Yard Waste
14
Phase I Restoration Sites

Trout and Kimball Brook Stream Corridor Assessment
Inadequate Buffer Sites
SiteSide(s) of
Stream
Buffer
Width
Left (ft)
Buffer
Width
Right (ft)
Length
Left (ft)
Length
Right (ft)
Land Use
Left
Land Use
Right
Impact/
SeverityBenefit
Restoration
FeasilityCost
Connected
w/ Other
Problems?
Priority Photo Comments
Phase I Restoration Sites14 Right 4 0 0 40
Shrubs/Sm
all TreesLawn Medium Low High Low Yard Waste 14
1 Both 0 25 0 75Invasives
KnotweedLawn Medium Low High Medium Bank Erosion 12 knotweed
6 Right 0 0 0 100Shrubs/Sm
all TreesLawn Medium Low High Medium Bank Erosion 12
10 Right 0 2 50 100Shrubs/Sm
all TreesLawn High Low High High Bank Erosion 12
Recent planting
with help from
City and DEP
12 Both 3 5 150 150 Other
Shrubs/S
mall
Trees
Medium Medium Medium Medium Yard Waste 12roadside, extend
to Sawyer Rd.
13 Left 0 0 25 0 Lawn
Shrubs/S
mall
Trees
Low Low High Low Yard Waste 12
27 Both 5 5 250 250 Lawn Lawn Medium Medium High High
Bank
Erosion, In
stream
12
Adjacent to Mill
Creek Park,
extends to
Hannaford
28 Left 5 0 25 0 Lawn
Shrubs/
Small
Trees
Low Low Medium Low 10
Phase II Restoration Sites

Trout and Kimball Brook Stream Corridor Assessment
Inadequate Buffer Sites
SiteSide(s) of
Stream
Buffer
Width
Left (ft)
Buffer
Width
Right (ft)
Length
Left (ft)
Length
Right (ft)
Land Use
Left
Land Use
Right
Impact/
SeverityBenefit
Restoration
FeasilityCost
Connected
w/ Other
Problems?
Priority Photo Comments
Phase I Restoration Sites5 Left 0 5 90 90 Pasture Invasives Low Low High Medium Bank Erosion 10
7 Left 5 15 75 0 Pasture
Shrubs/S
mall
Trees
Low Low High Medium 10
15 Left 6 0 75 0 Paved Pasture Low Low High Medium Bank Erosion 10
22 Both 5 5 75 75 Lawn Lawn Medium Low High High Bank Erosion 10
extends to
highland ave,
knotweed 75'
23 Right 50 10 100 100 Invasives Lawn High Low Medium High Bank Erosion 10
knotweed ,
extend another
75' upstream
21 Left 0 0 100 0 Lawn
Shrubs/
Small
Trees
Low Low High Medium Bank Erosion 10 Kimball Brook
26 Left 0 0 100 0 Lawn Forest Low Low High Medium Bank Erosion 10 Kimball Brook
17 Right 100 0 0 150Shrubs/Sm
all TreesPasture Low Low Medium Medium Bank Erosion 8
no shrubs or trees
only forbs buffer,
extends towards
spear ave [not quite
to 77]

Trout and Kimball Brook Stream Corridor Assessment
Inadequate Buffer Sites
SiteSide(s) of
Stream
Buffer
Width
Left (ft)
Buffer
Width
Right (ft)
Length
Left (ft)
Length
Right (ft)
Land Use
Left
Land Use
Right
Impact/
SeverityBenefit
Restoration
FeasilityCost
Connected
w/ Other
Problems?
Priority Photo Comments
Phase I Restoration Sites3 Both 50 50 200 200 Invasives Invasives Medium Low Low High 6 all invasives
16 Both 100 100 300 300 Pasture Pasture Low Low Medium High Bank Erosion 6
extends to sawyer
rd, no shrubs or
trees only forbs
buffer
24 Right 0 20 0 100 Invasives Forest Medium Low Low High Bank Erosion 6
lots knotweed
some lawn,
extend another
75' upstream
25 Both 0 0 200 200 Invasives Invasives Low Low Low High
Bank
Erosion,
Yark Waste
4
Kimball Brook - all
knotweed down
to trib
2065 2105
Cost Assumes $5.00/sf for landscaped buffer, including plants, labor and 10 foot wide buffer
High >$5,000 Assumes $3.00/sf for forested buffer, including plants, labor and 20 foot wide buffer
Medium $2,500-$5,000 Assumes high cost to remove invasives and do long term control and replanting
Low <$2,500
Total Length

Data Sources: CoSP, Maine GIS, MDEPMap Date: 10/7/12
!.!.!.!. !.
!.
!.!.!.!.
!.
!.
!.!.
!.!.
!.
!.
!.
!.
!.!.!.
S O U T H PO R T L A N D
T r o
u t
B r
o o k
K i m b a
l l
B r o o k
S A W
Y E
R
S T R
E E
T
S P
U R
W I
N K
R O
A D
M I T C H E L L R O A D
H I G H L A N D A
V E
S T I L L M A N S T
C O T T A G E R O A D
O C E A N H O U S E R D
SawyerMarshHinkley
Park
Maxwell'sFarm
MillCreekPark
Eastman Rd
Providence Ave
T r o u t
B r o o k
C A P E EL I Z
A B E T HSouth Portland
987
6
54321
1517
16
21
20
23
2219
181413
12
11 10
2012 Trout Brook Watershed Management PlanStream Channel Alteration Sites
0 0.5 1 1.5Miles
E
MAINE
Project Area
M A I N E
Type of SiteStream Channel Alteration!.

Trout and Kimball Brook
Stream Channel Alterations, Fish Barriers and Restoration Sites
Site Survey Description
Bottom
Width
(ft)
Length
(ft)
Impact/S
everityBenefit
Restoration
FeasbilityCost
Connected
w/Other
Problems?
Priority Photo Comments
Phase I Restoration Sites
1
Stre
am C
orr
ido
r
Ass
essm
ent
Rocks placed across stream 13 3 Low Medium High LowLowers aeration
and DO14
Cobble dam removed in 9/12
as part of CBEP habitat
restoration project.
2
Stre
am C
orr
ido
r
Ass
essm
ent
Rocks placed across stream 13 6 Low Medium High LowLowers aeration
and DO14
Cobble dam removed in 9/12
as part of CBEP habitat
restoration project.
19
Urb
an S
trea
ms
Stu
dy
TB Preserve (above
Boothby) - Channel
straightened, overwidened
and aggrading.
200' Medium High Medium MediumLow velocity and
DO, lack of pools14
Partially fixed in 9/12 as part
of CBEP habitat restoration
project. Added root
wads/woody debris and
created opening in
streamside berm to
reconnect stream with
floodplain.
18
Urb
an S
trea
ms
Stu
dy Braided Channel in TB
Preserve150' Medium High Medium High
Undefined
channel, poor flow
velocity, less
favorable habitat,
lack of pools, low
DO area
12
Restore in conjunction with
Site CA 3. Add LWD and
narrow channel to create
pools.
5
Stre
am C
orr
ido
r
Ass
essm
ent Marsh Road between
Richland and Sawyer. Fence
and armor in stream; low
gradient and channelized
15 150 Medium Medium Medium Medium
Silt, Iron bacteria,
petroleum sheen
and sewage smell.
12
Work with landowner to
restore, narrow channel and
increase velocity (e.g.,
possible Colonel Westbrook -
type project)

Trout and Kimball Brook
Stream Channel Alterations, Fish Barriers and Restoration Sites
Site Survey Description
Bottom
Width
(ft)
Length
(ft)
Impact/S
everityBenefit
Restoration
FeasbilityCost
Connected
w/Other
Problems?
Priority Photo Comments
Phase II Restoration Sites
8760
CB
EP F
ish
Bar
rier
Surv
ey Fessenden Ave. - Severe fish
barrier in CBEP Survey.High Medium Medium Very High 11
All culvert replacements will
require hydrologic study.
Conduct work in conjunction
with Site CA3. Move to
Phase III if Phase I
restoration goals are not
met.
8458
CB
EP F
ish
Bar
rier
Su
rvey
Boothby Ave. - Severe fish
barrier in CBEP Survey.High Medium Medium Very High 11
All culvert replacements will
require hydrologic study.
Move to Phase III if Phase I
restoration goals are not
met.
8230
CB
EP F
ish
Bar
rier
Su
rvey
Providence Ave. - Severe
fish barrier in CBEP Survey.High Medium Medium Very High
Habitat impacts
below culvert.11
All culvert replacements will
require hydrologic study.
Conduct work in conjunction
with Site 3 (below). Move to
Phase III if Phase I
restoration goals are not
met.
3
Stre
am C
orr
ido
r
Ass
essm
ent
Rip rap from culvert washed
into stream. No defined
channel.
25 75 Medium Medium Medium High
Fish barrier, causes
braiding of channel
below
10
Create step pools as part of
final fish passage restoration.
Due to sewer lines, would
need to build up to current
culvert height.
22
Urb
an S
trea
ms
Stu
dy Tributary @ Simmons Road
outfall12 800 Medium Medium Medium High
Channel actively
incising10
Urban Streams Study noted
that channel may be
reaching equilibrium, but
restoration work could speed
progress.

Trout and Kimball Brook
Stream Channel Alterations, Fish Barriers and Restoration Sites
Site Survey Description
Bottom
Width
(ft)
Length
(ft)
Impact/S
everityBenefit
Restoration
FeasbilityCost
Connected
w/Other
Problems?
Priority Photo Comments
13
Stre
am C
orr
ido
r
Ass
essm
ent
Kimball Brook. Corroded
pipe lying in stream (3'
diameter)
40 Low Low Medium Low
Erosion in stream
channel &
streambanks
associated with
pipes
10
14
Stre
am C
orr
ido
r
Ass
essm
ent
Kimball Brook. Corroded
pipe lying in stream (3'
diameter)
75 Low Low Medium Low
Erosion in stream
channel &
streambanks
associated with
pipes
10
20
Urb
an S
trea
ms
Stu
dy
Mill Creek (Highland to
Broadway) - Channel
straightened, overwidened
and aggrading.
350' Medium Low Medium MediumLack of buffer,
bank erosion10
Restoration can involve
addition of woody debris to
narrow channel and increase
sinuosity.
21
Urb
an S
trea
ms
Stu
dy
Mill Creek (Broadway to
Cottage) - Channel
straightened, overwidened
and aggrading.
850' Medium Low Medium MediumLack of buffer,
bank erosion10
Restoration same as Site JF3.
Restoration project in
conjunction with Site CA 12.
Part of Mill Creek Park Plan
to create salt marsh system.
23
Stre
am C
orr
ido
r
Ass
essm
ent
Sawyer Marsh 1000' Medium Low Medium High 8
Need to evaluate
cost/benefit, but could
remove berms along
mainstem to connect
floodplain. Close off
drainage ditches.
6
Stre
am C
orr
ido
r
Ass
essm
ent
Retaining wall on stream
bank0 15 Low Low Medium Medium Lack of buffer 8
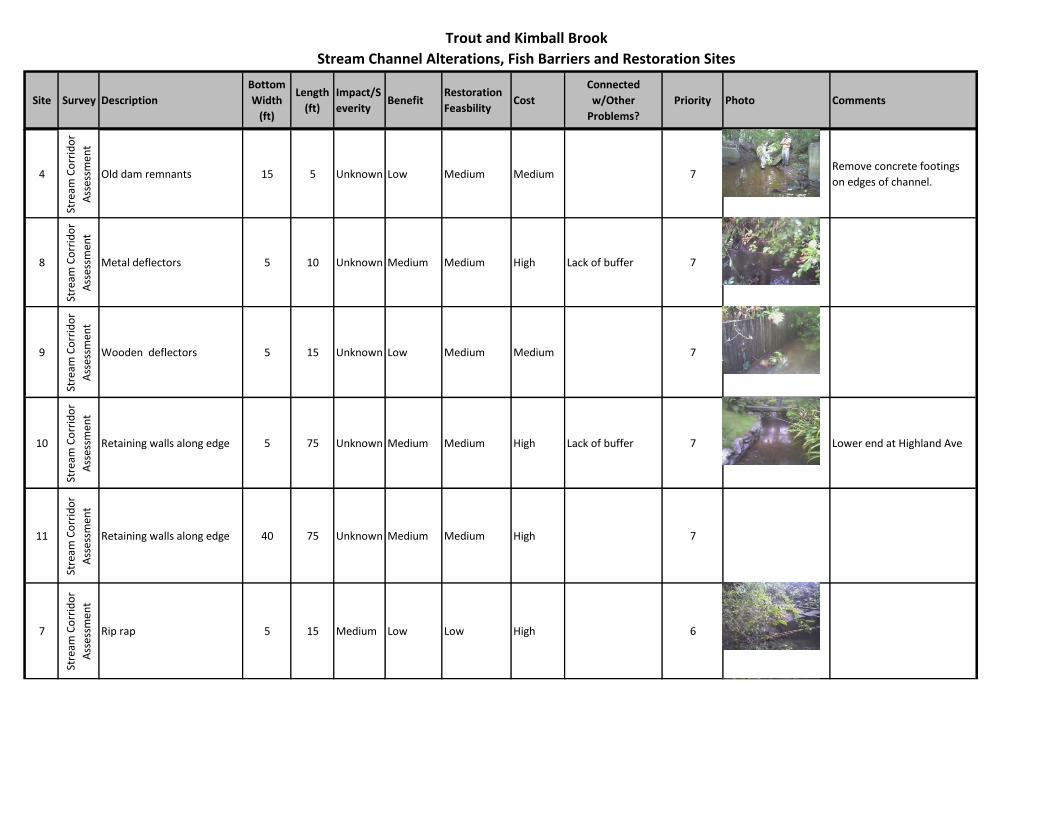
Trout and Kimball Brook
Stream Channel Alterations, Fish Barriers and Restoration Sites
Site Survey Description
Bottom
Width
(ft)
Length
(ft)
Impact/S
everityBenefit
Restoration
FeasbilityCost
Connected
w/Other
Problems?
Priority Photo Comments
4
Stre
am C
orr
ido
r
Ass
essm
ent
Old dam remnants 15 5 Unknown Low Medium Medium 7Remove concrete footings
on edges of channel.
8
Stre
am C
orr
ido
r
Ass
essm
ent
Metal deflectors 5 10 Unknown Medium Medium High Lack of buffer 7
9
Stre
am C
orr
ido
r
Ass
essm
ent
Wooden deflectors 5 15 Unknown Low Medium Medium 7
10
Stre
am C
orr
ido
r
Ass
essm
ent
Retaining walls along edge 5 75 Unknown Medium Medium High Lack of buffer 7 Lower end at Highland Ave
11
Stre
am C
orr
ido
r
Ass
essm
ent
Retaining walls along edge 40 75 Unknown Medium Medium High 7
7
Stre
am C
orr
ido
r
Ass
essm
ent
Rip rap 5 15 Medium Low Low High 6

Trout and Kimball Brook
Stream Channel Alterations, Fish Barriers and Restoration Sites
Site Survey Description
Bottom
Width
(ft)
Length
(ft)
Impact/S
everityBenefit
Restoration
FeasbilityCost
Connected
w/Other
Problems?
Priority Photo Comments
16
Stre
am C
orr
ido
r
Ass
essm
ent
Kimball Brook. Concrete
structure and pipe in streamUnknown Low Medium High 5
17
Stre
am C
orr
ido
r
Ass
essm
ent
Kimball Brook. Pipe in
streamUnknown Low Medium High 5
12
Stre
am C
orr
ido
r
Ass
essm
ent
Metal deflectors 15 100 Unknown Low Low High
Stream channel
realignment, Lack
of buffer
3
Would need to realign and
stabilize this sharp bend in
stream.
15
Stre
am C
orr
ido
r
Ass
essm
ent
Concrete structure Unknown Low Low High 3
Cost
High Over $7,500
Medium Between $2,500 - $7,500
Low Less than $2,500

Data Sources: CoSP, Maine GIS, MDEPMap Date: 10/7/12
#*#*
#*#*#*
#*
#*#*#* #*#*#*
#*
#*
#*#*#*
#*#*
#*
#*
#*
#*#*
S O U T H PO R T L A N D
T r o
u t
B r
o o k
K i m b a
l l
B r o o k
S A W
Y E
R
S T R
E E
T
S P
U R
W I
N K
R O
A D
M I T C H E L L R O A D
H I G H L A N D A
V E
S T I L L M A N S T
C O T T A G E R O A D
T r o u t B r o o k
O C E A N H O U S E R DSawyerMarshHinkley
Park
Maxwell'sFarm
MillCreekPark
Eastman Rd
Providence Ave
23
8 10 11
22
C A P E EL I Z
A B E T H
South Portland
976
543
21
2421
20
1918
1716
15
14
13
12
2012 Trout Brook Watershed Management PlanTrash and Yard Waste Dumping Sites
0 0.5 1 1.5Miles
E
MAINE
Project Area
M A I N E
Type of Site#0 Yard Waste Dumping Site

Trout and Kimball Brook Stream Corridor Assessment
Trash and Yard Waste Dumping Sites
Site Type AmountGood for
Volunteers
Land
Owner
Impact /
SeverityBenefit
Restoration
FeasibilityCost
Connected w/
Other Problems?Priority Photo Comments
15 Yard Waste 4 pick up trucks Yes Private Medium High High MediumInadequate Buffer,
Nutrient Source16
6 Yard Waste0.5 pick up
trucksYes Private Medium High High Low
Bank Erosion,
Inadequate Buffer,
Instream restoration
site
14
16 Yard Waste 2 pick up trucks Yes Private Medium High High LowInadequate Buffer,
Nutrient Source14
8 Yard Waste 0.5 cubic yard Yes Private Medium Medium High LowBank Erosion,
Inadequate Buffer12
9 Yard Waste 5 pick up trucks Yes Private Medium Low High MediumInadequate Buffer,
In Stream Habitat12
owners might be
trying to armor
banks
17 Yard Waste0.5 pick up
trucksYes Private Low High High Low
Inadequate Buffer,
Nutrient Source12
22
Other - old
sand pile or
plow bank
possibly
NA No Public Medium Medium High LowBank Erosion,
Instream Restoration
Site
12
Fixed - City and
School removed
and planted in
2012.
1 Yard Waste 1 cubic yard No Private Medium Medium High LowBank Erosion
Inadequate Buffer12
grass clippings
dumped in
stream, BOD
Phase I Restoration Sites
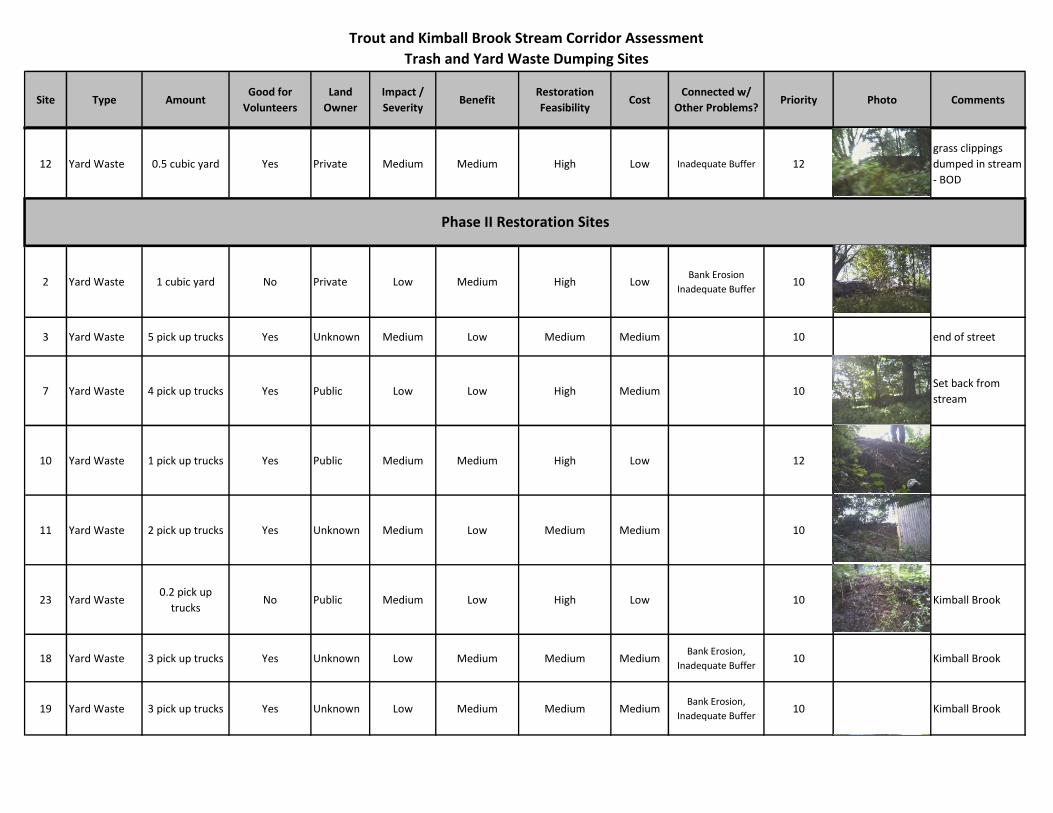
Trout and Kimball Brook Stream Corridor Assessment
Trash and Yard Waste Dumping Sites
Site Type AmountGood for
Volunteers
Land
Owner
Impact /
SeverityBenefit
Restoration
FeasibilityCost
Connected w/
Other Problems?Priority Photo Comments
Phase I Restoration Sites12 Yard Waste 0.5 cubic yard Yes Private Medium Medium High Low Inadequate Buffer 12
grass clippings
dumped in stream
- BOD
2 Yard Waste 1 cubic yard No Private Low Medium High LowBank Erosion
Inadequate Buffer10
3 Yard Waste 5 pick up trucks Yes Unknown Medium Low Medium Medium 10 end of street
7 Yard Waste 4 pick up trucks Yes Public Low Low High Medium 10Set back from
stream
10 Yard Waste 1 pick up trucks Yes Public Medium Medium High Low 12
11 Yard Waste 2 pick up trucks Yes Unknown Medium Low Medium Medium 10
23 Yard Waste0.2 pick up
trucksNo Public Medium Low High Low 10 Kimball Brook
18 Yard Waste 3 pick up trucks Yes Unknown Low Medium Medium MediumBank Erosion,
Inadequate Buffer10 Kimball Brook
19 Yard Waste 3 pick up trucks Yes Unknown Low Medium Medium MediumBank Erosion,
Inadequate Buffer10 Kimball Brook
Phase II Restoration Sites

Trout and Kimball Brook Stream Corridor Assessment
Trash and Yard Waste Dumping Sites
Site Type AmountGood for
Volunteers
Land
Owner
Impact /
SeverityBenefit
Restoration
FeasibilityCost
Connected w/
Other Problems?Priority Photo Comments
Phase I Restoration Sites20 Yard Waste 10 pick up trucks Yes Public Low Low Medium High Bank Erosion 10 Kimball Brook
21 Yard Waste 3 pick up trucks Yes Public Low Low High Medium Inadequate Buffer 10 Kimball Brook
4 Yard Waste 3 pickup trucks Yes Public Low Low Medium Medium 8 end of street
5 Yard Waste 2 pick up trucks Yes Public Medium Low Medium Low 8next to foot
bridge
14 Yard Waste 0.5 cubic yard Yes Private Low Low High Low 8
24 Yard Waste0.5 pick up
trucksNo Public Medium Low Medium Low 8 Kimball Brook
13 Yard Waste 2 pick up trucks Yes Private Low Low Medium Low 6
Cost
High >$1,000Medium $500-$1,000Low <$500
Benefit
High Can contribute to primary stressor for the subwatershedMedium Can contribute to secondary stressor for the subwatershed or site associated with more than one other problem sites (e.g., erosion, inadequate buffer etc.)Low Associated with one or none other problem sites
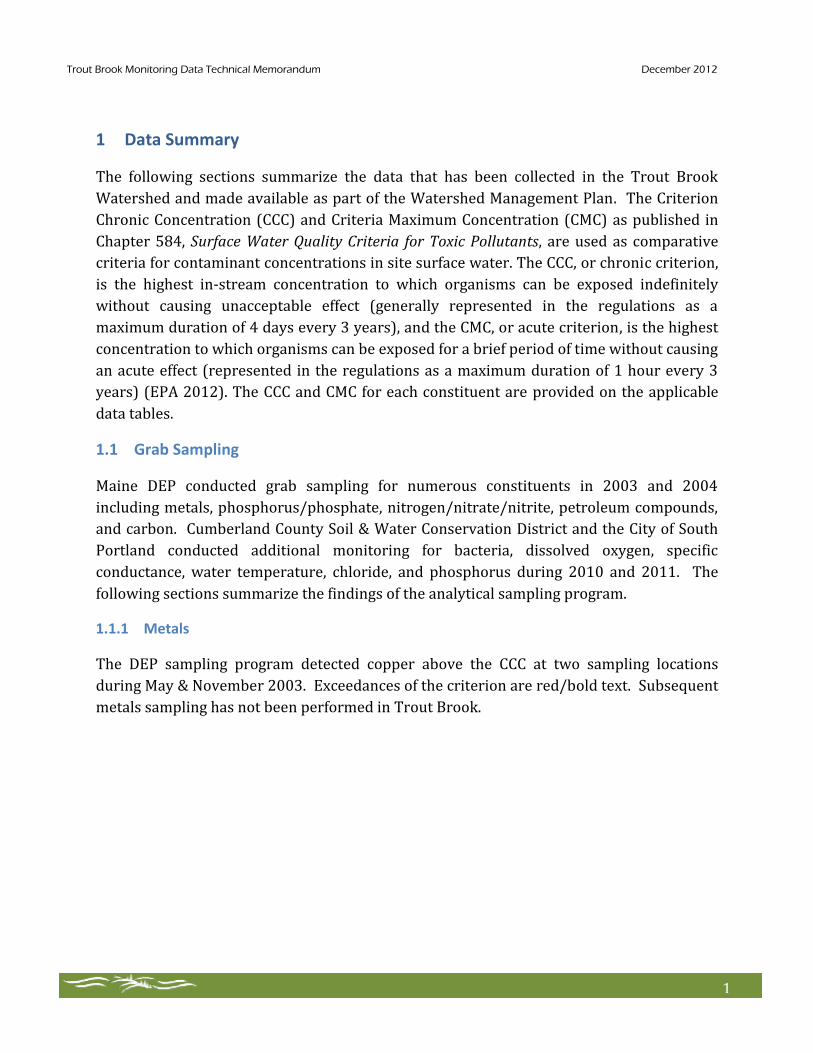
Trout Brook Monitoring Data Technical Memorandum December 2012
1
1 Data Summary
The following sections summarize the data that has been collected in the Trout Brook
Watershed and made available as part of the Watershed Management Plan. The Criterion
Chronic Concentration (CCC) and Criteria Maximum Concentration (CMC) as published in
Chapter 584, Surface Water Quality Criteria for Toxic Pollutants, are used as comparative
criteria for contaminant concentrations in site surface water. The CCC, or chronic criterion,
is the highest in-stream concentration to which organisms can be exposed indefinitely
without causing unacceptable effect (generally represented in the regulations as a
maximum duration of 4 days every 3 years), and the CMC, or acute criterion, is the highest
concentration to which organisms can be exposed for a brief period of time without causing
an acute effect (represented in the regulations as a maximum duration of 1 hour every 3
years) (EPA 2012). The CCC and CMC for each constituent are provided on the applicable
data tables.
1.1 Grab Sampling
Maine DEP conducted grab sampling for numerous constituents in 2003 and 2004
including metals, phosphorus/phosphate, nitrogen/nitrate/nitrite, petroleum compounds,
and carbon. Cumberland County Soil & Water Conservation District and the City of South
Portland conducted additional monitoring for bacteria, dissolved oxygen, specific
conductance, water temperature, chloride, and phosphorus during 2010 and 2011. The
following sections summarize the findings of the analytical sampling program.
1.1.1 Metals
The DEP sampling program detected copper above the CCC at two sampling locations
during May & November 2003. Exceedances of the criterion are red/bold text. Subsequent
metals sampling has not been performed in Trout Brook.

Trout Brook Monitoring Data Technical Memorandum December 2012
2
Table 1. Metals concentrations exceeding criterion in Trout Brook Sample Location Sample Date Aluminum1 Copper2 Zinc
units (mg/L) (mg/L) (mg/L) Criterion Continuous Concentration 0.087 0.00236 0.0306 S-675 5/27/2003 2.000 0.007 0.0313 S-302 5/27/2003 0.970 0.006 0.022 S-675 11/21/2003 0.850 ND 0.016 S-302 11/21/2003 0.500 ND 0.010
Metals sampling was completed in Kimball Brook during 2005 and 2006 and is
summarized on Table 2. Exceedances of the criterion are red/bold text.
Table 2. Metals concentrations exceeding criterion in Kimball Brook Sample Location Sample Date Aluminum Iron Lead Zinc
units (mg/L) (mg/L) (mg/L) (mg/L) Criterion Continuous Concentration 0.087 1.000 0.0025 0.0306 S-795 8/30/2005 0.080 1.100 ND not sampled S-795 9/8/2005 0.190 2.700 0.004 not sampled S-795 10/24/2005 0.480 10.000 0.029 0.013 S-795 11/6/2005 0.100 0.500 0.009 0.048 S-795 8/30/2006 0.100 1.400 ND 0.012 S-795 11/17/2006 0.330 6.400 0.020 0.080
1.1.2 Chloride
Chloride was identified as a possible constituent of concern due to slightly elevated specific
conductance readings identified at DEP Monitoring Site S-454 (located at the downstream
end of the Trout Preserve near Fessenden Avenue). Monitoring at S-675 (located upstream
of two springs that discharge into the stream) did not identify elevated chloride (less than
50 mg/L in June and July 2012 and less than 150 mg/L in August 2003 and July 2003). The
two springs were sampled in July 2012 and Spring 1 contained chloride at concentrations
slightly above the CCC during two baseflow monitoring events. This suggests a possible
groundwater source of chloride to Trout Brook near Site 454.
1 Aluminum is a Non-Priority Pollutant Pollutants pursuant to Chapter 584, Surface Water Quality Criteria for
Toxic Pollutants.
2 Copper and Zinc are Priority Pollutants pursuant to Chapter 584, Surface Water Quality Criteria for Toxic
Pollutants.
3 Estimated value, from MDEP Urban Streams Report.

Trout Brook Monitoring Data Technical Memorandum December 2012
3
Table 3. Chloride samples exceeding criterion Sample Location Sample Date Chloride
units (mg/L) Criterion Continuous Concentration 230 Spring 1 7/26/2012 250 Spring 1 7/31/2012 260
Additional information correlating chloride concentrations to specific conductivity in the
Watershed is discussed below.
The chloride data suggest that there may be a chloride source located hydrogeologically
upgradient of site S-454. There has been speculation that the municipal salt storage facility
(located outside of the watershed to the northwest) may be a source. These data (and the
specific conductance data presented below) suggest that SP-1 is contributing to chronic
low-levels of chloride in the stream, and further work should be done to identify and
address (if possible) the source of chloride to SP-1.
1.1.3 Nutrients
Total phosphorus was collected throughout the watershed in order to evaluate nutrient
impacts to Trout Brook. The water quality criterion for phosphorus is 0.030 mg/L, which
was derived from the 25th percentile of EPA’s Reference Conditions for Aggregate Ecoregion
XIV Streams (EPA 2000).
Total phosphorus data collected between 2000 and 2004 ranged from 0.011 mg/L to 0.22
mg/L with an average concentration of 0.05 mg/L (standard deviation of 0.05 mg/L). The
2012 total phosphorus data was collected over a variety of hydrological conditions (storm
flow and baseflow), and from a variety of locations within the watershed. The data
reflected this differing sampling strategy. In 2012, the total phosphorus concentrations
ranged from 0.01 to 0.79 mg/L with an average concentration of 0.09 mg/L (standard
deviation of 0.14 mg/L).
Table 4 summarizes the phosphorus data collected in the watershed. Each site had at least
one sample that exceeded the phosphorus criterion of 0.03 mg/L and the average total
phosphorus for each site also exceeded the criterion. For all sites except for site TF
(located in the Upper Subwatershed), the maximum phosphorus concentration was
observed during stormflow conditions. Site TF was not sampled during stormflow
conditions.

Trout Brook Monitoring Data Technical Memorandum December 2012
4
Table 4. Total phosphorus data summary
Site ID
Maximum Phosphorus
Concentration Sample
Date
Average Phosphorus
Concentration Standard Deviation
Maximum Storm
Concentration
Maximum Baseflow
Concentration
(mg/L) (mg/L) (mg/L) (mg/L)
S-302 0.15 5/27/2003 0.04 0.04 unknown unknown
S-454 0.10 6/13/2012 0.05 0.03 0.10 0.04
S-675 0.35 6/25/2012 0.09 0.10 0.35 0.06
KA 0.07 6/13/2012 0.03 0.03 0.07 0.02
TB 0.79 6/25/2012 0.17 0.28 0.79 0.05
TC 0.30 6/25/2012 0.09 0.11 0.30 0.05
TD 0.06 6/13/2012 0.05 0.004 0.06 0.05
TE 0.29 6/25/2012 0.10 0.09 0.29 0.05
TF 0.05 7/31/2012 0.04 0.02 n.s. 0.05
W-093 0.04 6/12/2003 0.04 -- unknown unknown
Due to the low frequency and variability of data collection, definitive conclusions cannot be
drawn from these data. These data suggest, however, that nutrients may be contributing to
water quality degradation within the watershed. While phosphorus tends to be elevated
during stormflow conditions, baseflow sampling suggests that the high concentrations pass
through the system quickly. While this may pose a water quality concern for the receiving
waterbody (Casco Bay), it is unlikely that phosphorus concentrations are the primary
source of impairment in Trout Brook. For this reason, the following actions are
appropriate for addressing nutrients within the watershed:
Education and outreach to residential landowners to encourage proper fertilizer application techniques, appropriate yard waste disposal, and alternatives to chemical fertilizers.
Outreach to agricultural landowners to ensure that they are receiving adequate support for nutrient management planning, fertilizer BMPs, and farm conservation planning activities. Provide additional support as necessary to ensure continued buffer protection and water quality protection.
Outreach to other commercial property owners to encourage proper fertilizer application techniques and alternatives to chemical fertilizers.
1.2 Sonde Deployments
Two Yellow Springs Instruments Company (YSI) model 6600 OMS water quality
monitoring sondes were deployed in the watershed during 2010, 2011, and 2012. The
sondes monitored DO, water temperature, and specific conductance continuously at Sites
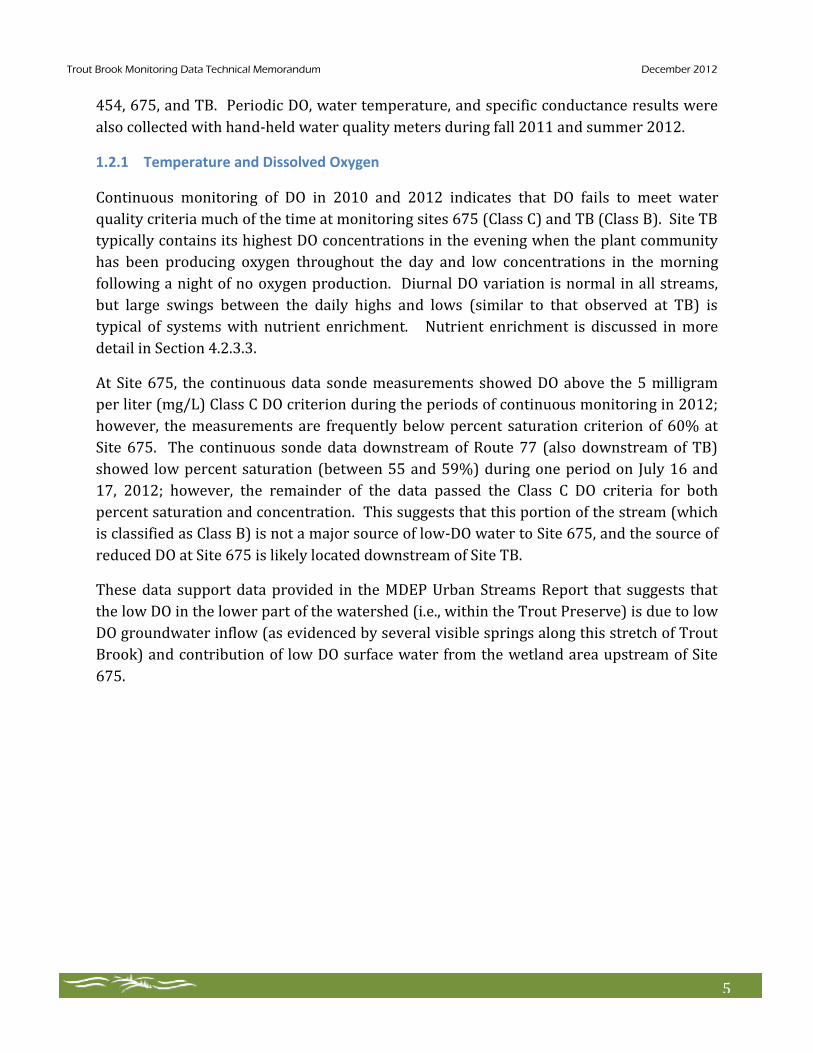
Trout Brook Monitoring Data Technical Memorandum December 2012
5
454, 675, and TB. Periodic DO, water temperature, and specific conductance results were
also collected with hand-held water quality meters during fall 2011 and summer 2012.
1.2.1 Temperature and Dissolved Oxygen
Continuous monitoring of DO in 2010 and 2012 indicates that DO fails to meet water
quality criteria much of the time at monitoring sites 675 (Class C) and TB (Class B). Site TB
typically contains its highest DO concentrations in the evening when the plant community
has been producing oxygen throughout the day and low concentrations in the morning
following a night of no oxygen production. Diurnal DO variation is normal in all streams,
but large swings between the daily highs and lows (similar to that observed at TB) is
typical of systems with nutrient enrichment. Nutrient enrichment is discussed in more
detail in Section 4.2.3.3.
At Site 675, the continuous data sonde measurements showed DO above the 5 milligram
per liter (mg/L) Class C DO criterion during the periods of continuous monitoring in 2012;
however, the measurements are frequently below percent saturation criterion of 60% at
Site 675. The continuous sonde data downstream of Route 77 (also downstream of TB)
showed low percent saturation (between 55 and 59%) during one period on July 16 and
17, 2012; however, the remainder of the data passed the Class C DO criteria for both
percent saturation and concentration. This suggests that this portion of the stream (which
is classified as Class B) is not a major source of low-DO water to Site 675, and the source of
reduced DO at Site 675 is likely located downstream of Site TB.
These data support data provided in the MDEP Urban Streams Report that suggests that
the low DO in the lower part of the watershed (i.e., within the Trout Preserve) is due to low
DO groundwater inflow (as evidenced by several visible springs along this stretch of Trout
Brook) and contribution of low DO surface water from the wetland area upstream of Site
675.
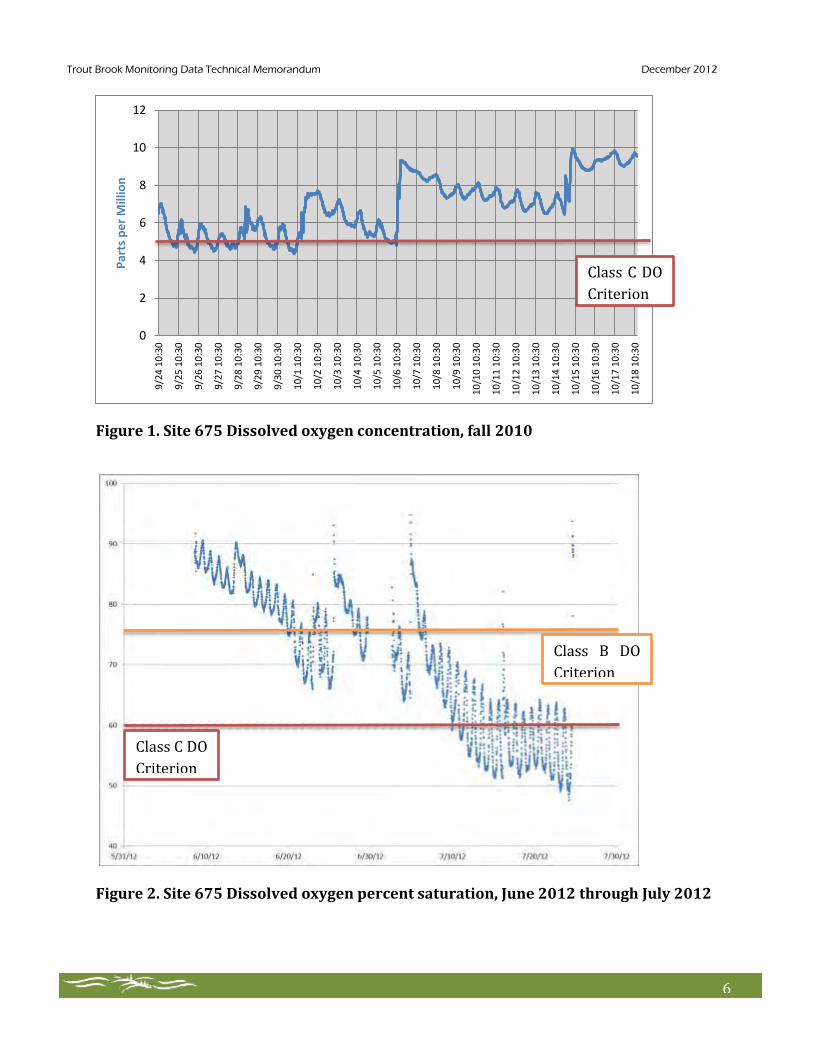
Trout Brook Monitoring Data Technical Memorandum December 2012
6
Figure 1. Site 675 Dissolved oxygen concentration, fall 2010
Figure 2. Site 675 Dissolved oxygen percent saturation, June 2012 through July 2012
0
2
4
6
8
10
12
9/2
4 1
0:3
0
9/2
5 1
0:3
0
9/2
6 1
0:3
0
9/2
7 1
0:3
0
9/2
8 1
0:3
0
9/2
9 1
0:3
0
9/3
0 1
0:3
0
10
/1 1
0:3
0
10
/2 1
0:3
0
10
/3 1
0:3
0
10
/4 1
0:3
0
10
/5 1
0:3
0
10
/6 1
0:3
0
10
/7 1
0:3
0
10
/8 1
0:3
0
10
/9 1
0:3
0
10
/10
10
:30
10
/11
10
:30
10
/12
10
:30
10
/13
10
:30
10
/14
10
:30
10
/15
10
:30
10
/16
10
:30
10
/17
10
:30
10
/18
10
:30
Par
ts p
er
Mill
ion
Class B DO
Criterion
Class C DO
Criterion
Class C DO
Criterion
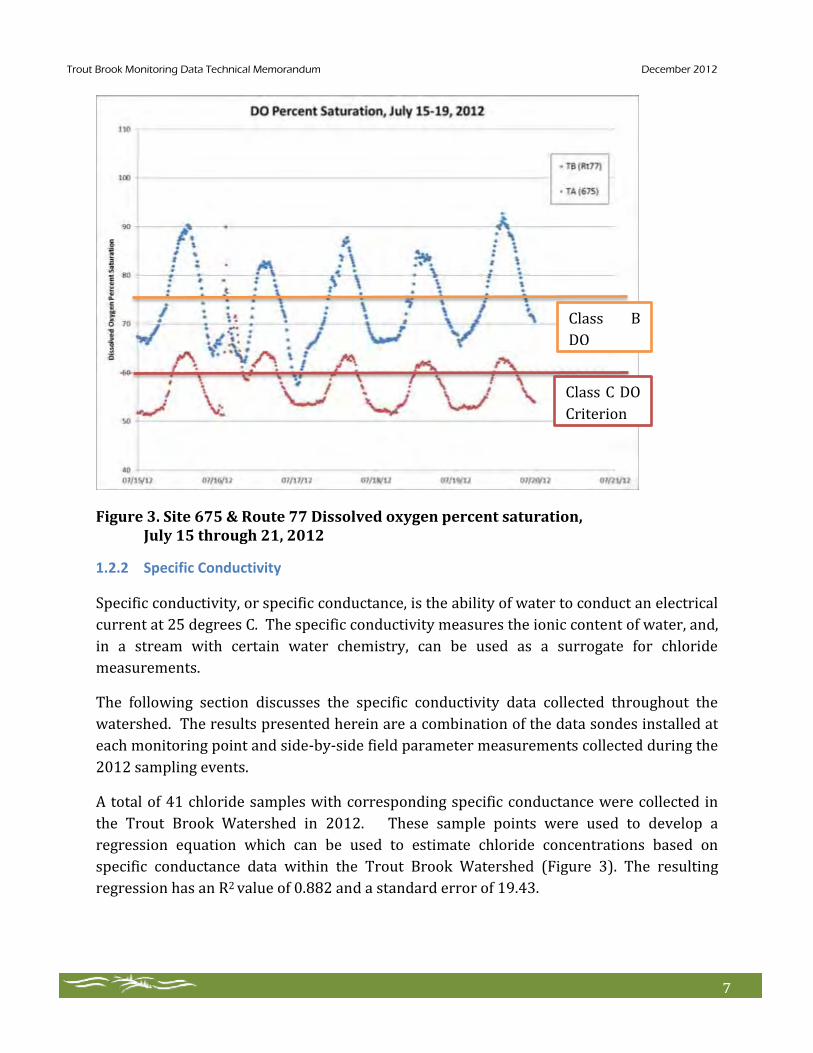
Trout Brook Monitoring Data Technical Memorandum December 2012
7
Figure 3. Site 675 & Route 77 Dissolved oxygen percent saturation, July 15 through 21, 2012
1.2.2 Specific Conductivity
Specific conductivity, or specific conductance, is the ability of water to conduct an electrical
current at 25 degrees C. The specific conductivity measures the ionic content of water, and,
in a stream with certain water chemistry, can be used as a surrogate for chloride
measurements.
The following section discusses the specific conductivity data collected throughout the
watershed. The results presented herein are a combination of the data sondes installed at
each monitoring point and side-by-side field parameter measurements collected during the
2012 sampling events.
A total of 41 chloride samples with corresponding specific conductance were collected in
the Trout Brook Watershed in 2012. These sample points were used to develop a
regression equation which can be used to estimate chloride concentrations based on
specific conductance data within the Trout Brook Watershed (Figure 3). The resulting
regression has an R2 value of 0.882 and a standard error of 19.43.
Class B
DO
Criterion
Class C DO
Criterion
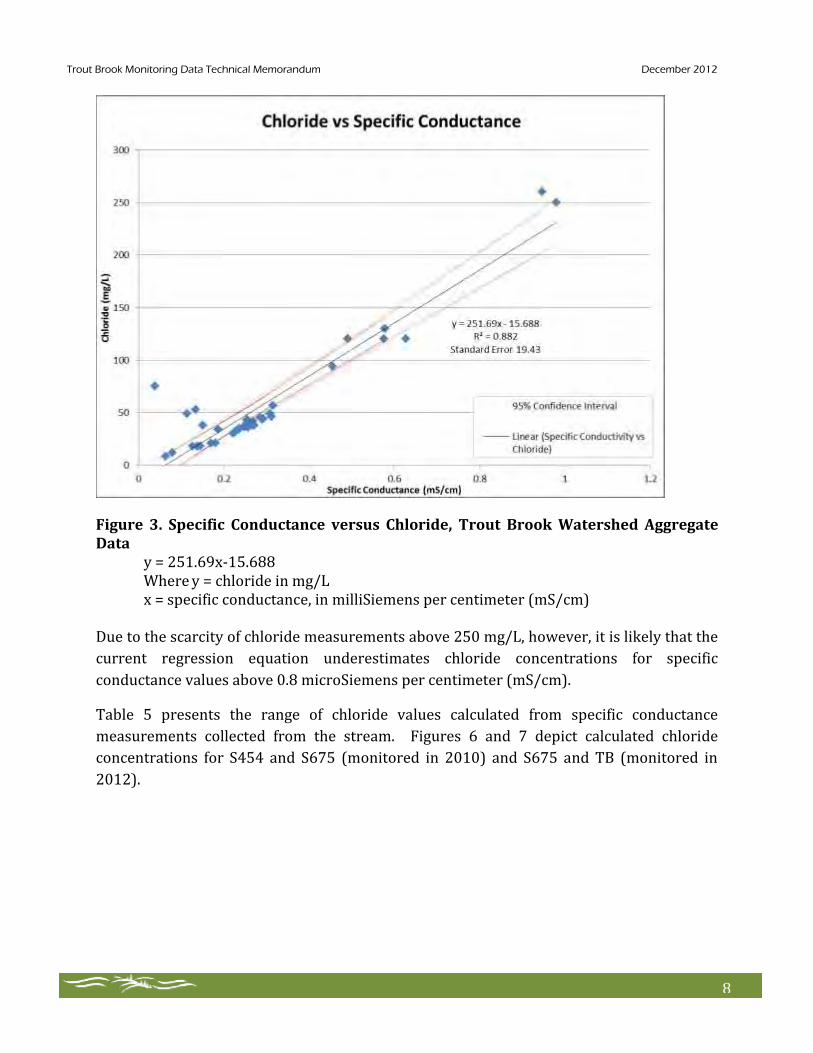
Trout Brook Monitoring Data Technical Memorandum December 2012
8
Figure 3. Specific Conductance versus Chloride, Trout Brook Watershed Aggregate Data y = 251.69x-15.688 Where y = chloride in mg/L x = specific conductance, in milliSiemens per centimeter (mS/cm) Due to the scarcity of chloride measurements above 250 mg/L, however, it is likely that the
current regression equation underestimates chloride concentrations for specific
conductance values above 0.8 microSiemens per centimeter (mS/cm).
Table 5 presents the range of chloride values calculated from specific conductance
measurements collected from the stream. Figures 6 and 7 depict calculated chloride
concentrations for S454 and S675 (monitored in 2010) and S675 and TB (monitored in
2012).

Trout Brook Monitoring Data Technical Memorandum December 2012
9
Table 5. Range of Mean Chloride Values Calculated from Specific Conductance Data (2012)
Site
Number of Data Points
Mean Minimum Chloride (mg/L)
Mean Maximum Chloride (mg/L)
675 4117 7.23 158.12
TB 4135 2.20 109.00
Table 6. Range of Mean Chloride Values Calculated from Specific Conductance Data (2010 & 2012)
Site
Number of Data Points
Mean Minimum Chloride (mg/L)
Mean Maximum Chloride (mg/L)
675 6436 2.20 506.25
TB 4135 7.23 158.12
6a. Calculated Chloride at S675, Sept. & Oct. 2010
6b. Calculated Chloride at S454, Sept. & Oct. 2010
7a. Calculated Chloride at S675, June & July 2012
7b. Calculated Chloride at Site TB (Upstream of S675), June & July 2012
The 2010 and 2012 data suggest that Trout Brook does not always exceed the chloride
criterion during summer baseflow and storm conditions. This is probably due to a
heterogeneous contaminant plume. It is likely that periods of rain cause higher
concentrations of chloride to infiltrate to groundwater and during dry periods, the
groundwater is relatively unimpacted by the chloride source. This would explain the high
chloride concentrations observed in 2010 at Site 675 and the relatively low in-stream

Trout Brook Monitoring Data Technical Memorandum December 2012
10
concentrations observed in 2012. Based on data observed in other similar watersheds as
well as the watershed’s runoff patterns, it is likely that runoff from winter salt application
to municipal roads and private driveways causes elevated chloride in the late winter/early
spring runoff period.
The South Portland Public Works Department is in the process of evaluation solutions for
the sand-salt storage pile. Since Trout Brook does not appear to have a chronic chloride
contamination problem due to road salt, it is in the best interests of the watershed
stakeholders to ensure that the Brook doesn’t add chronic chloride to its list of
impairments. Therefore, landowner and municipal outreach should be conducted to
educate stakeholders on the importance of reduced and targeted salt use, salt application
BMPs, and minimizing the amount of chloride-contaminated snow that is stored on
pervious surfaces wherever possible.

Cumberland County Soil & Water Conservation District
35 Main Street, Suite 3 Phone: 207.892.4700
Windham, ME 04062 Fax: 207.892.4773
Assist and educate the public to promote stewardship of soil and water resources.
TECHNICAL MEMORANDUM
TO: Maureen O’Meara, Town Planner, Town of Cape Elizabeth
Fred Dillon, Stormwater Program Coordinator, City of South Portland
FROM: Kate McDonald, Project Scientist
DATE: October 15, 2012
RE: Phosphorus Sampling, Trout Brook Watershed, South Portland & Cape Elizabeth, Maine
Cumberland County Soil & Water Conservation District collected total phosphorus throughout the Trout Brook watershed in order to evaluate nutrient impacts to the brook and support development of the Watershed Management Plan. The water quality criterion for phosphorus is 0.030 mg/L, which was derived from the 25th percentile of EPA’s Reference Conditions for Aggregate Ecoregion XIV Streams (EPA 2000). Total phosphorus data collected between 2000 and 2004 ranged from 0.011 mg/L to 0.22 mg/L with an average concentration of 0.05 mg/L (standard deviation of 0.05 mg/L). The 2012 total phosphorus data was collected over a variety of hydrological conditions (stormflow and baseflow), and from a variety of locations within the watershed. The data reflected this differing sampling strategy. In 2012, the total phosphorus concentrations ranged from 0.01 to 0.79 mg/L with an average concentration of 0.09 mg/L (standard deviation of 0.14 mg/L). Figure 1 depicts the sampling locations, and Table 1 summarizes the phosphorus data collected within the watershed. Each site had at least one sample that exceeded the phosphorus criterion of 0.03 mg/L and the average total phosphorus for each site also exceeded the criterion. For all sites except for site TF (located in the Upper Subwatershed), the maximum phosphorus concentration was observed during stormflow conditions. Site TF was not sampled during stormflow conditions.
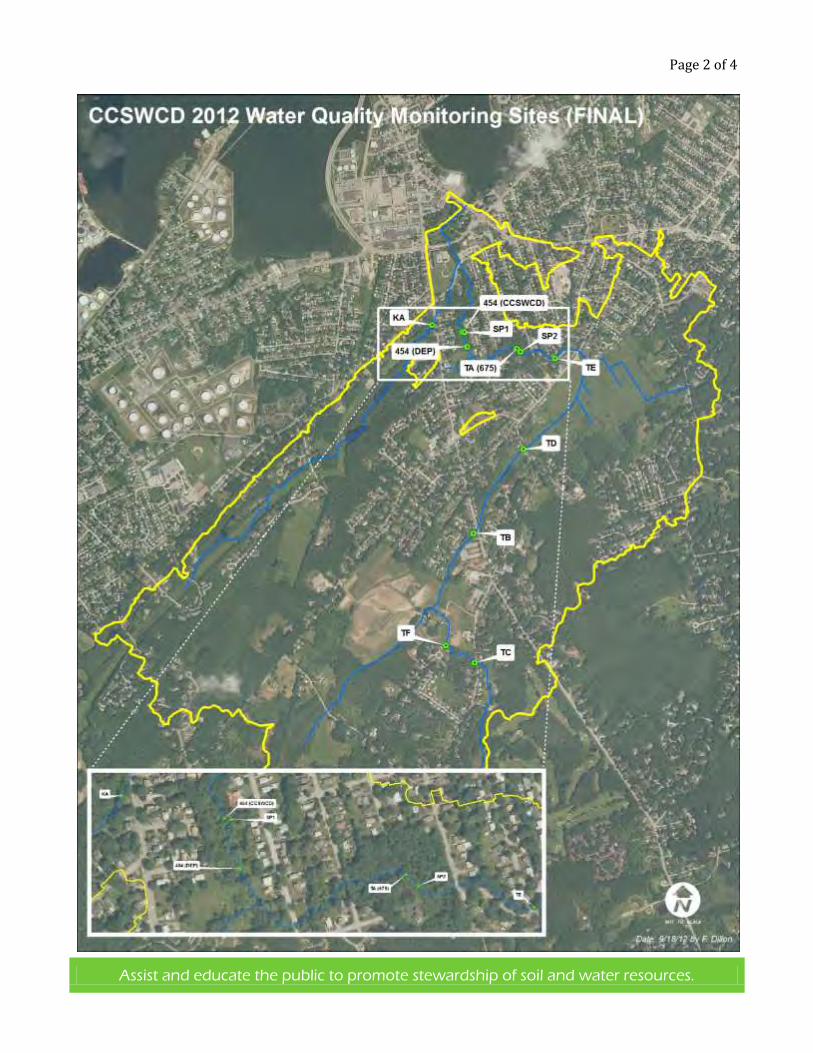
Page 2 of 4
Assist and educate the public to promote stewardship of soil and water resources.

Page 3 of 4
Assist and educate the public to promote stewardship of soil and water resources.
Table 1. Total Phosphorus Data Summary
Site ID Sample Date
Maximum Phosphorus
Concentration
Average Phosphorus
Concentration Standard Deviation
Maximum Storm
Concentration
Maximum Baseflow
Concentration
(mg/L) (mg/L) (mg/L) (mg/L)
S-302* 5/27/2003 0.15 0.04 0.04 n.s. n.s.
S-454 6/13/2012 0.10 0.05 0.03 0.10 0.04
S-675 6/25/2012 0.35 0.09 0.10 0.35 0.06
KA 6/13/2012 0.07 0.03 0.03 0.07 0.02
TB 6/25/2012 0.79 0.146 0.201 0.79 0.05
TC 6/25/2012 0.30 0.09 0.11 0.30 0.05
TD 6/13/2012 0.06 0.05 0.004 0.06 0.05
TE 6/25/2012 0.29 0.10 0.09 0.29 0.05
TF 7/31/2012 0.05 0.04 0.02 n.s. 0.05
W-093 6/12/2003 0.04 0.04 -- n.s. n.s. * Site 302 was discontinued by MDEP when it was discovered that it is tidally influenced at times. n.s.: Not Sampled
The elevated phosphorus concentrations observed at sample site TB during stormflow sampling prompted additional stormflow sampling near site TB in early October. The summer 2012 stormflow samples were collected on the rising stage to ascertain “first flush” conditions (i.e., the period when the highest concentrations of contaminants are entering the stream). The October storm samples were collected after the first flush and when ground conditions were saturated. The saturated ground conditions allowed us to observe phosphorus concentrations that might typically enter the stream during a prolonged rain event rather than the “worst case scenario” that we observed with the first flush samples. The October 2-3, 2012 storm event saw 0.7 inches of rain over approximately 48 hours. Approximately 0.5 inches of rain had fallen at the time of sampling. There was no channelized runoff observed during sampling.
Table 2. Supplemental Phosphorus Sampling
Sample Sampling
Phosphorus Concentration
Site ID Date Conditions (mg/L)
TB 10/3/12 End of storm 0.09
TB1 10/3/12 End of storm 0.08
TB1 (duplicate) 10/3/12 End of storm 0.09
TB2 10/3/12 End of storm 0.04
Sample location TB is located in Trout Brook upstream of Route 77. Sample location TB1 is located approximately 400 feet upstream of TB and sample location TB2 is located approximately 800 feet upstream of TB. All samples were collected from within the stream channel.

Page 4 of 4
Assist and educate the public to promote stewardship of soil and water resources.
The supplemental data suggest that during certain types of storm events, the horse paddocks located southeast of the brook are a source of nutrients in the stream. Overall, the sampling data suggest that the high concentrations observed in stormflow pass through the system quickly. The stream also appears to have persistent elevated phosphorus (i.e., above 0.03 mg/L) even during baseflow conditions. This poses a water quality concern for the receiving waterbody (Casco Bay), and the elevated phosphorus concentrations are likely contributing to depressed dissolved oxygen within Trout Brook. Based on the data collected during the Watershed Management Plan development process, nutrient enrichment within Trout Brook should be addressed to the extent practicable as part of the Watershed Management Plan. We propose including the following items in Watershed Management Plan to ensure that continued agricultural land uses are supported and watershed stakeholders are also able to move forward with the Trout Brook restoration process:
Education and outreach to residential landowners to encourage proper fertilizer application
techniques, appropriate yard waste disposal, and alternatives to chemical fertilizers.
Outreach to agricultural landowners to ensure that they are receiving adequate support for nutrient
management planning, fertilizer BMPs, and farm conservation planning activities. Provide additional
support as necessary to ensure continued buffer protection and water quality protection.
o Identify the area between TB and TB2 as a restoration site. Restore the flood plain and
address erosion issues.
o Install BMPs to adjacent landowners to minimize parking lot and agricultural runoff and flood
plain erosion.
o Identify specific nutrient management BMPs for livestock sites adjacent to the Brook.
Outreach to other commercial property owners to encourage proper fertilizer application techniques
and alternatives to chemical fertilizers.

Appendix E - Impervious Analysis for Watershed and Outfall Catchments
Map ID Catchment Location
Total Area of
Basin
(Acres)
Total
Impervious
Area
%
Imperviousness
of Subbbasin
% of Total Watershed
Imperviousness
Trout Brook Watershed (without Kimball)(1) 1133.11 153.52 13.55% 10.47%
A Kaler/Clifford 61.61 17.80 28.88% 11.59%B Rte 77 and Bellaire 58.39 16.52 28.29% 10.76%C Florence/Somerset 27.74 9.93 35.79% 6.47%
D Sawyer/Parrot 14.06 5.35 38.03% 3.48%
E Rte 77 and State 15.24 4.47 29.30% 2.91%
F Mitchell 18.84 4.00 21.23% 2.61%
G Rte 77and Harrison (Spurwink) 8.86 2.91 32.84% 1.90%
H Bellaire/Beaufort 8.36 2.44 29.21% 1.59%
I Boothby 7.01 2.35 33.47% 1.53%
J Sawyer/Marsh (north) 4.18 1.45 34.75% 0.95%
K Waterhouse 3.64 1.07 29.42% 0.70%
L Walnut Cul de Sac 1.83 1.04 57.14% 0.68%
M LDS Church on 77 2.65 1.03 38.89% 0.67%
N Sawyer Brook Circle 1.50 0.72 47.86% 0.47%
O LDS Church (2) on 77 0.77 0.66 86.26% 0.43%
P Lawrence/Fesseden 2.22 0.62 28.09% 0.41%
Q Wilton Ln -off State 1.51 0.62 41.02% 0.40%
R Linwood 1.23 0.52 42.43% 0.34%
S Waterhouse Cul de sac 1.63 0.44 27.14% 0.29%
T Sawyer and Marsh (south) 0.68 0.43 63.67% 0.28%
U Fessenden 0.91 0.36 38.94% 0.23%
V Marsh/Sawyer 1.04 0.28 26.75% 0.18%
W Marsh Rd 0.76 0.26 34.28% 0.17%
X Norman/Spear 0.58 0.18 31.55% 0.12%
Y Linwood 2 0.15 0.08 48.64% 0.05%
Kimball Watershed(2)
333.43 22.64 6.79 1.54%
AA Pilgrim/Stillman 6.65 2.97 44.74% 13.14%
BB Rte 77 and Brenton 4.28 2.37 55.41% 10.46%
CC Higgins/Stillman 6.84 1.66 24.33% 7.35%DD Wildrose 1.73 0.43 24.75% 1.89%
Overall Watershed (Trout + Kimball)(2)
1466.55 176.17 12.01 12.01%
NOTES:
1 This excludes the tidal portion of the watershed, which consists of approximately 44 acres.
2 Total watershed area based on DEP's delineation is 1509 acres (including tidal portion of watershed).