appendix 14a turkey point plant unit 3 cycle 29 reload ... · - τ1 = 0s, τ2 = 0s lead/lag...
TRANSCRIPT

APPENDIX 14A TURKEY POINT PLANT UNIT 3 CYCLE 29 RELOAD CHARACTERISTICS AND PARAMETERS
14A-i Revised 04/06/2018
C29
TABLE OF CONTENTS
Section Title Page 1.0 INTRODUCTION AND SUMMARY ........................................................ 14A-1 1.1 Introduction ............................................................................... 14A-1 1.2 General Description .................................................................. 14A-1 Appendix A Turkey Point Unit 3 Cycle 29................................................................. 14A-A1 Core Operating Limits Report (COLR)
14A-ii Revised 04/06/2018
C29

LIST OF TABLES Table Title Page 14A-1 Fuel Assembly Design Parameters ......................…………………………….14A-2 Turkey Point Unit 3 - Cycle 29 14A-2 Kinetics Characteristics.............. .................................................................... 14A-3 Turkey Point Unit 3 - Cycle 29 14A-3 Shutdown Requirements and Margins .........................................................14A-4 Turkey Point Unit 3 - Cycles 28 and 29 LIST OF FIGURES Figure 14A-1 Reference Core Loading Pattern .................................................................. 14A-6 Turkey Point Unit 3 Cycle 29 14A-2 Burnable Absorber Locations ......................................................................... 14A-7 Turkey Point Unit 3 Cycle 29
14A-iii Revised 04/06/2018
C29
C29
C29
C29
C29
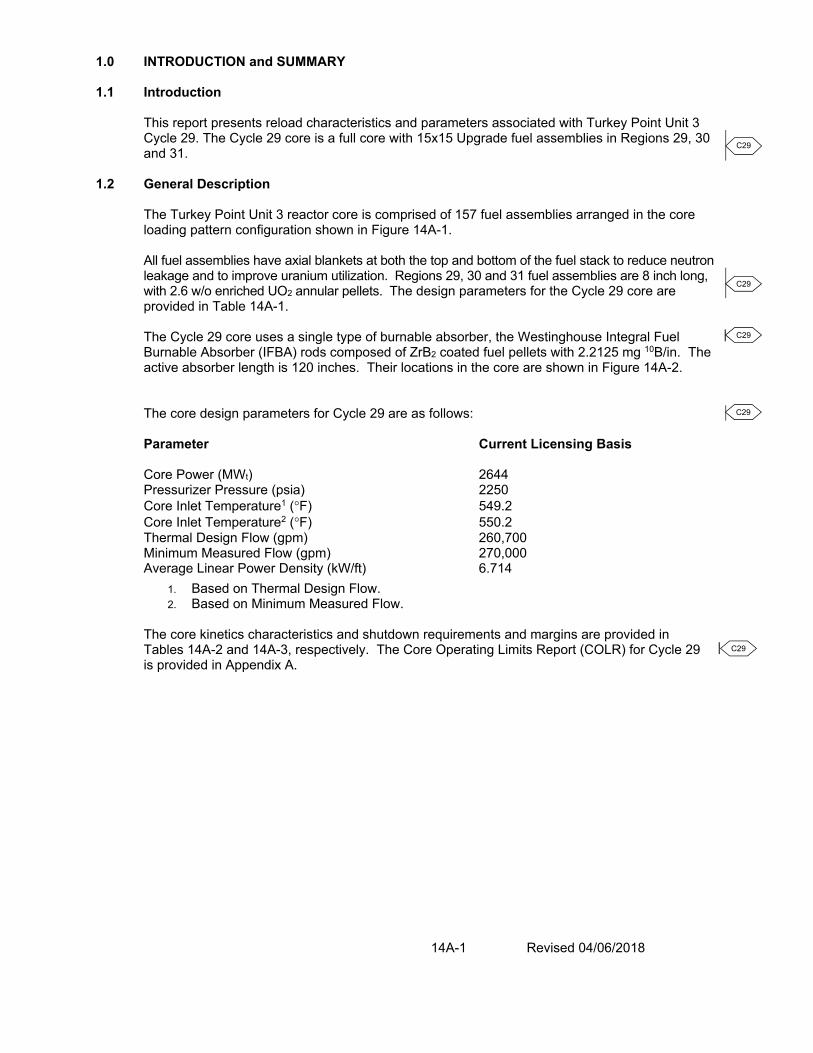
1.0 INTRODUCTION and SUMMARY 1.1 Introduction
This report presents reload characteristics and parameters associated with Turkey Point Unit 3 Cycle 29. The Cycle 29 core is a full core with 15x15 Upgrade fuel assemblies in Regions 29, 30 and 31.
1.2 General Description
The Turkey Point Unit 3 reactor core is comprised of 157 fuel assemblies arranged in the core loading pattern configuration shown in Figure 14A-1.
All fuel assemblies have axial blankets at both the top and bottom of the fuel stack to reduce neutron leakage and to improve uranium utilization. Regions 29, 30 and 31 fuel assemblies are 8 inch long, with 2.6 w/o enriched UO2 annular pellets. The design parameters for the Cycle 29 core are provided in Table 14A-1.
The Cycle 29 core uses a single type of burnable absorber, the Westinghouse Integral Fuel
Burnable Absorber (IFBA) rods composed of ZrB2 coated fuel pellets with 2.2125 mg 10B/in. The active absorber length is 120 inches. Their locations in the core are shown in Figure 14A-2.
The core design parameters for Cycle 29 are as follows: Parameter Current Licensing Basis Core Power (MWt) 2644 Pressurizer Pressure (psia) 2250 Core Inlet Temperature1 (°F) 549.2 Core Inlet Temperature2 (°F) 550.2 Thermal Design Flow (gpm) 260,700 Minimum Measured Flow (gpm) 270,000 Average Linear Power Density (kW/ft) 6.714
1. Based on Thermal Design Flow. 2. Based on Minimum Measured Flow.
The core kinetics characteristics and shutdown requirements and margins are provided in Tables 14A-2 and 14A-3, respectively. The Core Operating Limits Report (COLR) for Cycle 29 is provided in Appendix A.
14A-1 Revised 04/06/2018
C29
C29
C29
C29
C29
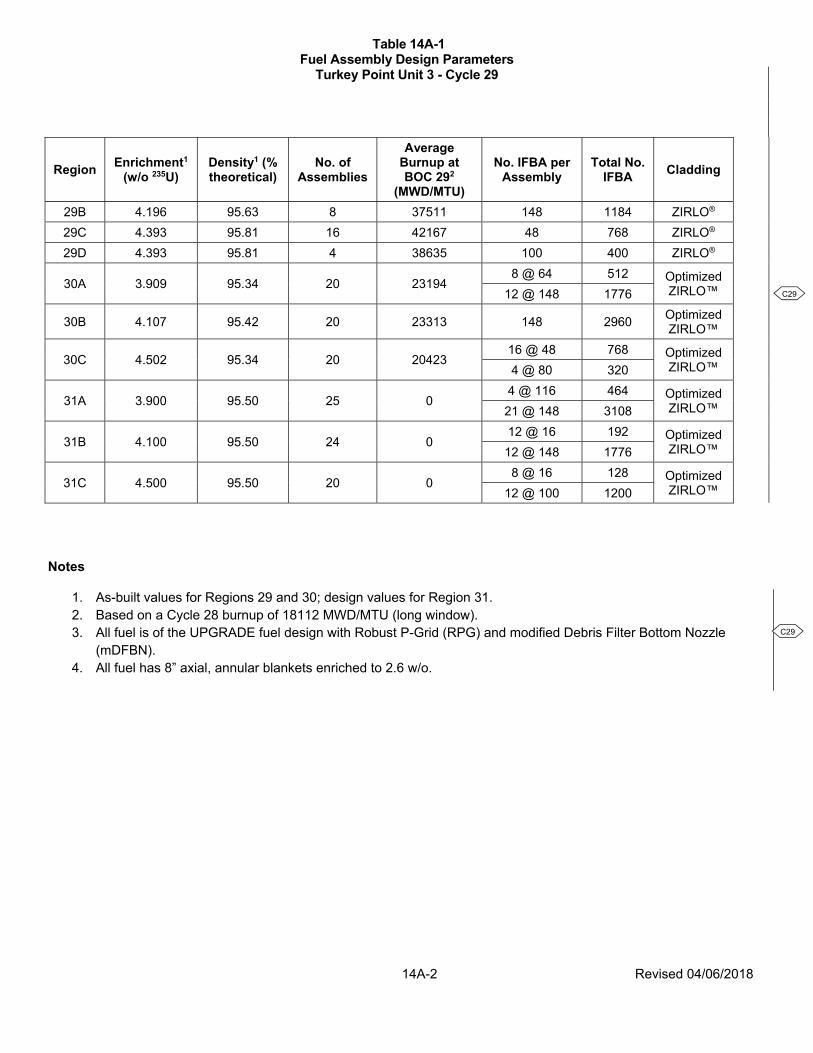
Table 14A-1 Fuel Assembly Design Parameters
Turkey Point Unit 3 - Cycle 29
Region Enrichment1 (w/o 235U)
Density1 (% theoretical)
No. of Assemblies
Average Burnup at BOC 292
(MWD/MTU)
No. IFBA per Assembly
Total No. IFBA Cladding
29B 4.196 95.63 8 37511 148 1184 ZIRLO® 29C 4.393 95.81 16 42167 48 768 ZIRLO® 29D 4.393 95.81 4 38635 100 400 ZIRLO®
30A 3.909 95.34 20 23194 8 @ 64 512 Optimized
ZIRLO™
12 @ 148 1776
30B 4.107 95.42 20 23313 148 2960 Optimized ZIRLO™
30C 4.502 95.34 20 20423 16 @ 48 768 Optimized
ZIRLO™
4 @ 80 320
31A 3.900 95.50 25 0 4 @ 116 464 Optimized
ZIRLO™
21 @ 148 3108
31B 4.100 95.50 24 0 12 @ 16 192 Optimized
ZIRLO™
12 @ 148 1776
31C 4.500 95.50 20 0 8 @ 16 128 Optimized
ZIRLO™
12 @ 100 1200
Notes
1. As-built values for Regions 29 and 30; design values for Region 31. 2. Based on a Cycle 28 burnup of 18112 MWD/MTU (long window). 3. All fuel is of the UPGRADE fuel design with Robust P-Grid (RPG) and modified Debris Filter Bottom Nozzle
(mDFBN). 4. All fuel has 8” axial, annular blankets enriched to 2.6 w/o.
14A-2 Revised 04/06/2018
C29
C29

Table 14A-2
KINETICS CHARACTERISTICS TURKEY POINT UNIT 3 - Cycle 29
Moderator Temperature Current Limit Cycle 29 Coefficient (pcm/°F) a. Most positive +5.0 (≤ 70% RTP) +1.6 (HZP, 541°F, (linear ramp to 0 at 3000MWD/MTU), linear ramp 100% RTP) to 0 at 100% RTP b. Most negative -41 -36.1 Doppler Coefficient (pcm/°F) -2.9 to -1.0 -1.93 to -1.21 Most Negative to Least Negative Delayed Neutron Fraction, ßeff 0.0044 to 0.0075 0.0049 to 0.0065 Minimum to Maximum Maximum Differential Rod <100 56.1 Worth of Two Banks Moving Together at HZP (pcm/in) Shutdown Margin (pcm) a. BOC ≥1000* 3557 ≥1770** b. EOC ≥1770 2042 * MODES 1 through 4 with at least 1 RCP running ** MODE 4 without RCPs running and MODE 5 14A-3 Revised 04/06/2018
C29
C29
C29
C29
C29
C29
C29
C29
C29
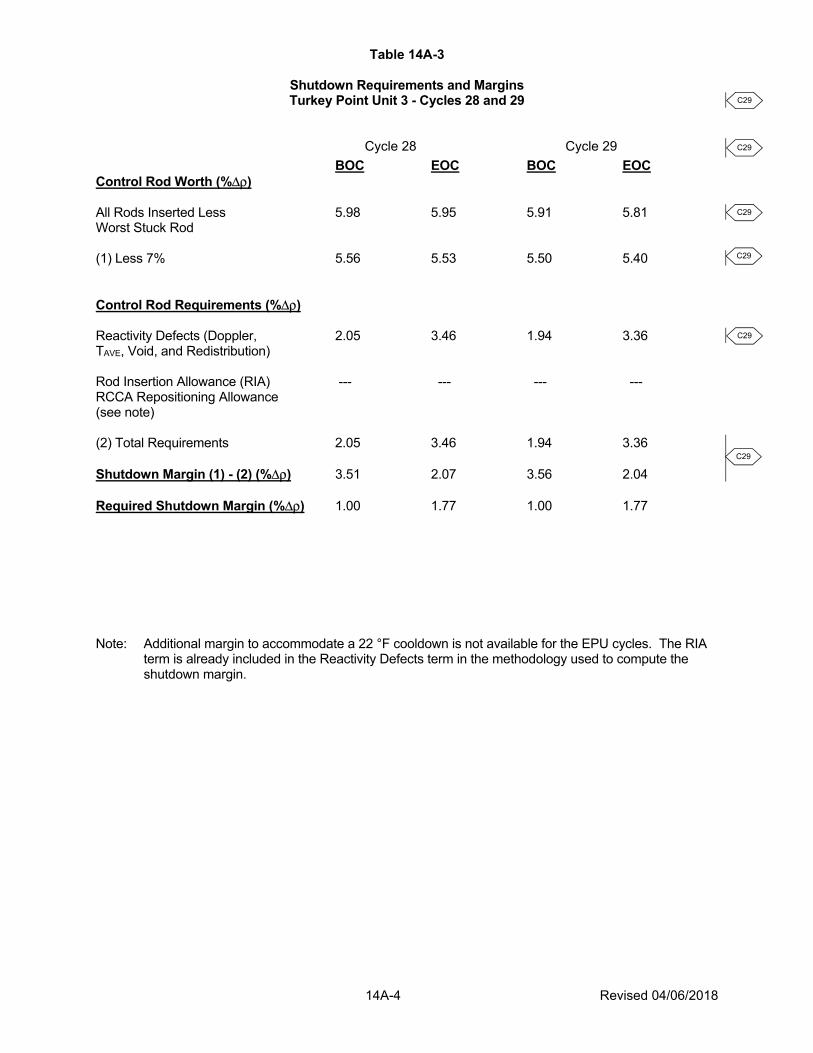
Table 14A-3
Shutdown Requirements and Margins Turkey Point Unit 3 - Cycles 28 and 29
Cycle 28 Cycle 29 BOC EOC BOC EOC Control Rod Worth (%Δρ) All Rods Inserted Less 5.98 5.95 5.91 5.81 Worst Stuck Rod (1) Less 7% 5.56 5.53 5.50 5.40 Control Rod Requirements (%Δρ) Reactivity Defects (Doppler, 2.05 3.46 1.94 3.36 TAVE, Void, and Redistribution) Rod Insertion Allowance (RIA) --- --- --- --- RCCA Repositioning Allowance (see note) (2) Total Requirements 2.05 3.46 1.94 3.36 Shutdown Margin (1) - (2) (%Δρ) 3.51 2.07 3.56 2.04 Required Shutdown Margin (%Δρ) 1.00 1.77 1.00 1.77 Note: Additional margin to accommodate a 22 °F cooldown is not available for the EPU cycles. The RIA
term is already included in the Reactivity Defects term in the methodology used to compute the shutdown margin.
14A-4 Revised 04/06/2018
C29
C29
C29
C29
C29
C29

Table 14A-4
DELETED 14A-5 Revised 03/11/2016
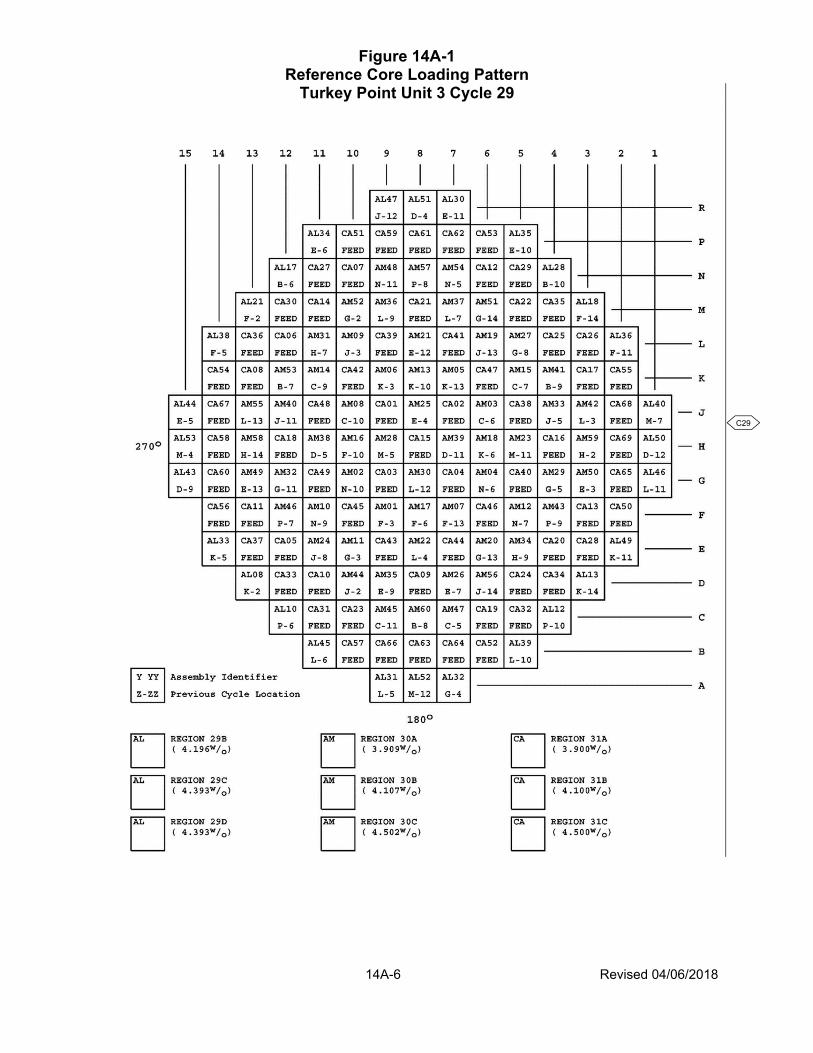
Figure 14A-1
Reference Core Loading Pattern Turkey Point Unit 3 Cycle 29
14A-6 Revised 04/06/2018
C29
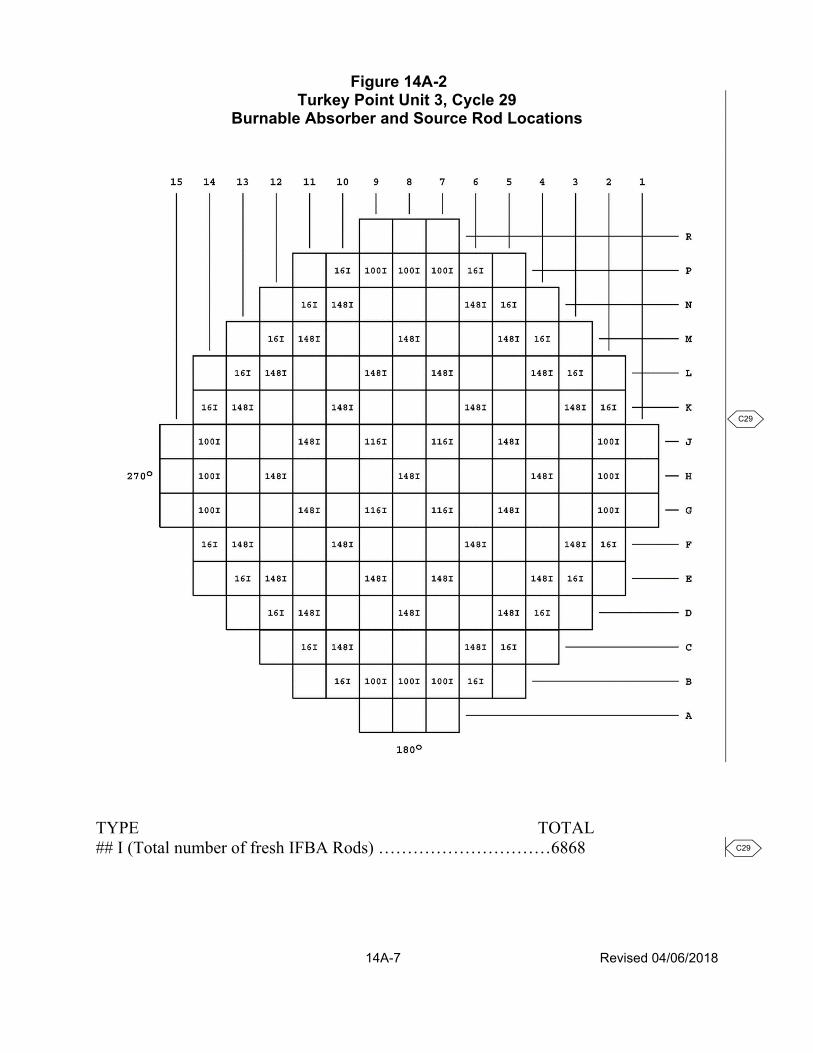
Figure 14A-2
Turkey Point Unit 3, Cycle 29 Burnable Absorber and Source Rod Locations
TYPE TOTAL ## I (Total number of fresh IFBA Rods) …………………………6868
14A-7 Revised 04/06/2018
C29
C29

Appendix A
Turkey Point Unit 3 Cycle 29 Core Operating Limits Report (COLR)
14A-A1 Revised 04/06/2018
C29
Turkey Point Unit 3 Cycle 29 Core Operating Limits Report (COLR)
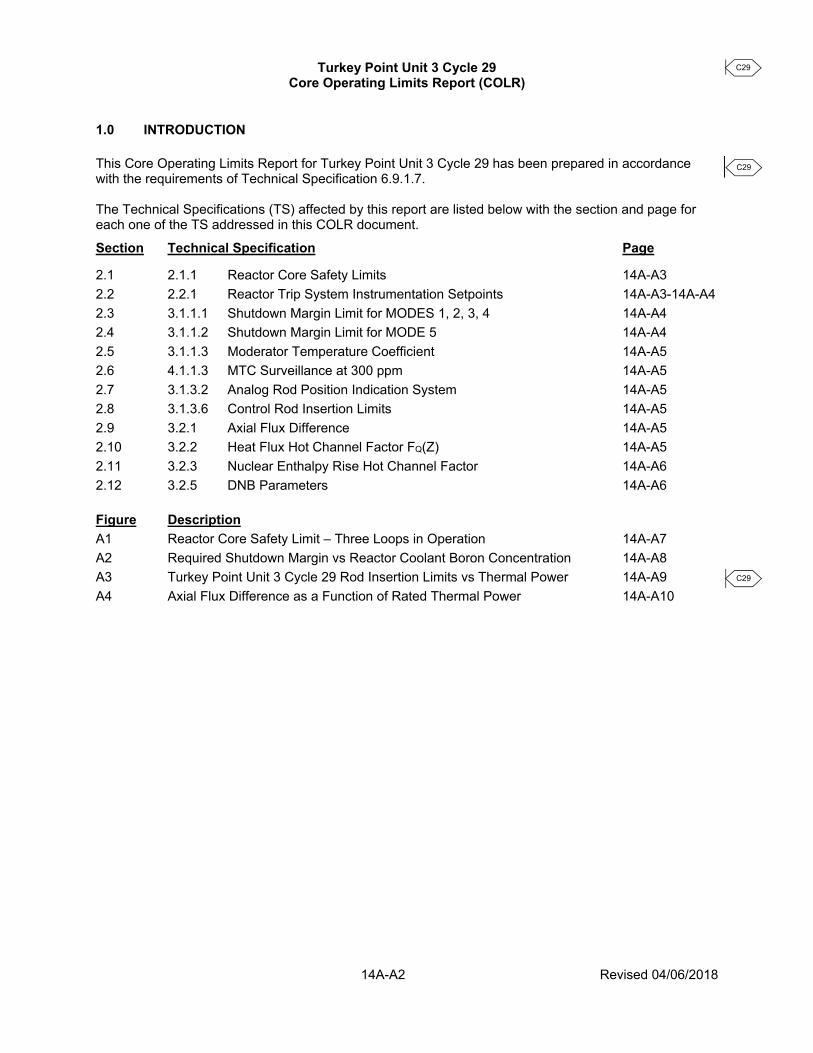
1.0 INTRODUCTION This Core Operating Limits Report for Turkey Point Unit 3 Cycle 29 has been prepared in accordance with the requirements of Technical Specification 6.9.1.7. The Technical Specifications (TS) affected by this report are listed below with the section and page for each one of the TS addressed in this COLR document.
Section Technical Specification Page
2.1 2.1.1 Reactor Core Safety Limits 14A-A3 2.2 2.2.1 Reactor Trip System Instrumentation Setpoints 14A-A3-14A-A4 2.3 3.1.1.1 Shutdown Margin Limit for MODES 1, 2, 3, 4 14A-A4 2.4 3.1.1.2 Shutdown Margin Limit for MODE 5 14A-A4 2.5 3.1.1.3 Moderator Temperature Coefficient 14A-A5 2.6 4.1.1.3 MTC Surveillance at 300 ppm 14A-A5 2.7 3.1.3.2 Analog Rod Position Indication System 14A-A5 2.8 3.1.3.6 Control Rod Insertion Limits 14A-A5 2.9 3.2.1 Axial Flux Difference 14A-A5 2.10 3.2.2 Heat Flux Hot Channel Factor FQ(Z) 14A-A5 2.11 3.2.3 Nuclear Enthalpy Rise Hot Channel Factor 14A-A6 2.12 3.2.5 DNB Parameters 14A-A6 Figure Description A1 Reactor Core Safety Limit – Three Loops in Operation 14A-A7 A2 Required Shutdown Margin vs Reactor Coolant Boron Concentration 14A-A8 A3 Turkey Point Unit 3 Cycle 29 Rod Insertion Limits vs Thermal Power 14A-A9 A4 Axial Flux Difference as a Function of Rated Thermal Power 14A-A10 14A-A2 Revised 04/06/2018
C29
C29
C29
Turkey Point Unit 3 Cycle 29 Core Operating Limits Report (COLR)
2.0 Operating Limits The cycle-specific parameter limits for the specifications listed in the Introduction are presented
below and listed sequentially by Technical Specification (TS). These limits have been developed using the NRC-approved methodologies specified in TS 6.9.1.7.
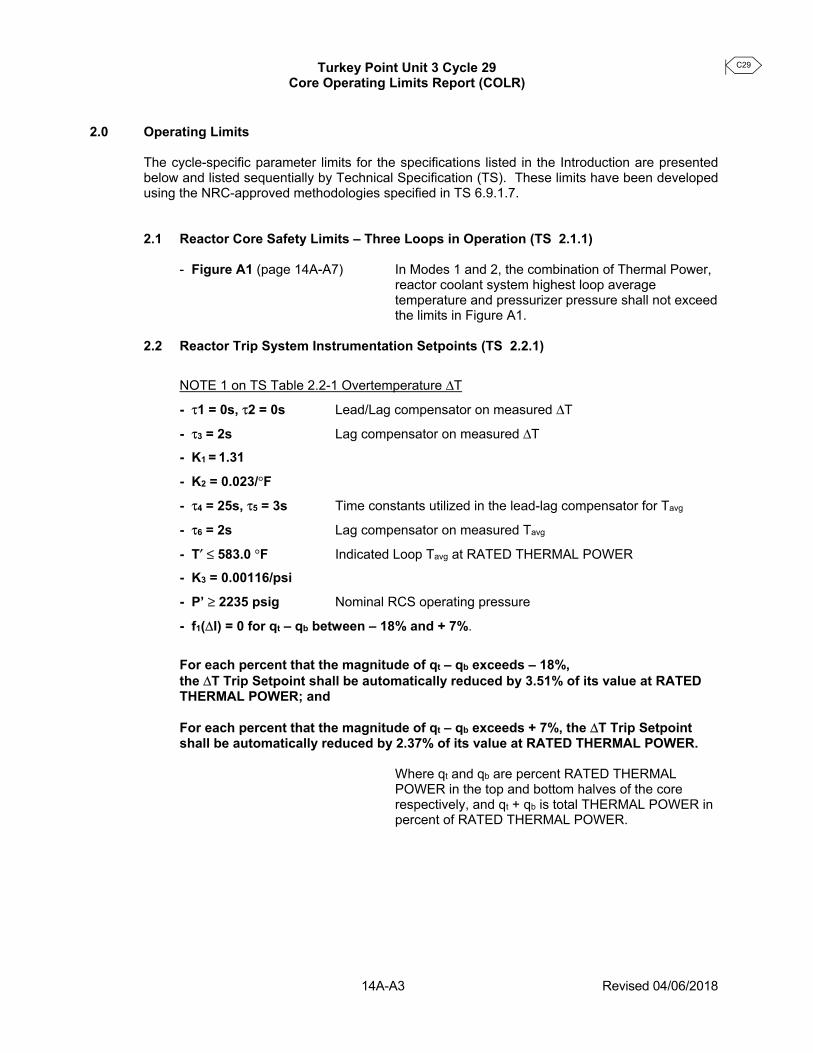
2.1 Reactor Core Safety Limits – Three Loops in Operation (TS 2.1.1) - Figure A1 (page 14A-A7) In Modes 1 and 2, the combination of Thermal Power,
reactor coolant system highest loop average temperature and pressurizer pressure shall not exceed the limits in Figure A1.
2.2 Reactor Trip System Instrumentation Setpoints (TS 2.2.1)
NOTE 1 on TS Table 2.2-1 Overtemperature ΔT
- τ1 = 0s, τ2 = 0s Lead/Lag compensator on measured ΔT
- τ3 = 2s Lag compensator on measured ΔT - K1 = 1.31
- K2 = 0.023/°F
- τ4 = 25s, τ5 = 3s Time constants utilized in the lead-lag compensator for Tavg
- τ6 = 2s Lag compensator on measured Tavg
- T′ ≤ 583.0 °F Indicated Loop Tavg at RATED THERMAL POWER - K3 = 0.00116/psi
- P’ ≥ 2235 psig Nominal RCS operating pressure
- f1(ΔI) = 0 for qt – qb between – 18% and + 7%.
For each percent that the magnitude of qt – qb exceeds – 18%, the ΔT Trip Setpoint shall be automatically reduced by 3.51% of its value at RATED THERMAL POWER; and
For each percent that the magnitude of qt – qb exceeds + 7%, the ΔT Trip Setpoint
shall be automatically reduced by 2.37% of its value at RATED THERMAL POWER.
Where qt and qb are percent RATED THERMAL POWER in the top and bottom halves of the core respectively, and qt + qb is total THERMAL POWER in percent of RATED THERMAL POWER.
14A-A3 Revised 04/06/2018
C29
Turkey Point Unit 3 Cycle 29 Core Operating Limits Report (COLR)
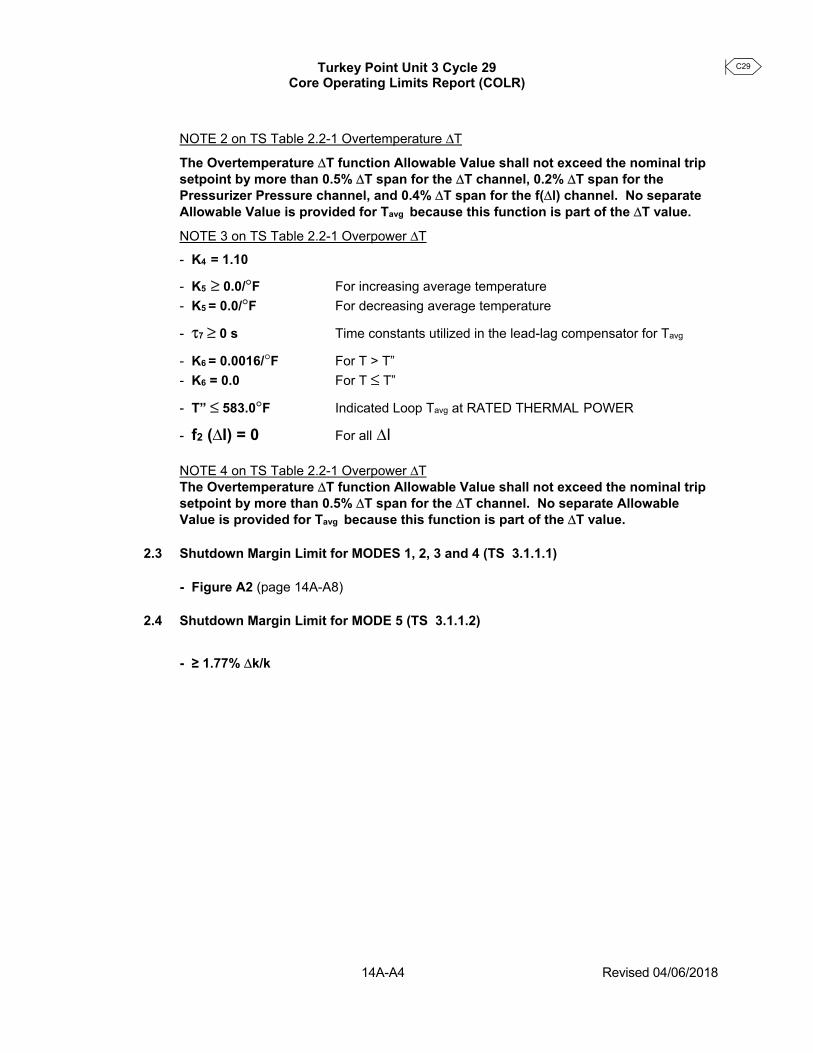
NOTE 2 on TS Table 2.2-1 Overtemperature ΔT
The Overtemperature ΔT function Allowable Value shall not exceed the nominal trip setpoint by more than 0.5% ΔT span for the ΔT channel, 0.2% ΔT span for the Pressurizer Pressure channel, and 0.4% ΔT span for the f(Δl) channel. No separate Allowable Value is provided for Tavg because this function is part of the ΔT value.
NOTE 3 on TS Table 2.2-1 Overpower ΔT - K4 = 1.10
- K5 ≥ 0.0/°F For increasing average temperature - K5 = 0.0/°F For decreasing average temperature
- τ7 ≥ 0 s Time constants utilized in the lead-lag compensator for Tavg
- K6 = 0.0016/°F For T > T” - K6 = 0.0 For T ≤ T”
- T” ≤ 583.0°F Indicated Loop Tavg at RATED THERMAL POWER
- f2 (ΔI) = 0 For all ΔI
NOTE 4 on TS Table 2.2-1 Overpower ΔT The Overtemperature ΔT function Allowable Value shall not exceed the nominal trip
setpoint by more than 0.5% ΔT span for the ΔT channel. No separate Allowable Value is provided for Tavg because this function is part of the ΔT value.
2.3 Shutdown Margin Limit for MODES 1, 2, 3 and 4 (TS 3.1.1.1)
- Figure A2 (page 14A-A8) 2.4 Shutdown Margin Limit for MODE 5 (TS 3.1.1.2) - ≥ 1.77% Δk/k 14A-A4 Revised 04/06/2018
C29
Turkey Point Unit 3 Cycle 29 Core Operating Limits Report (COLR)
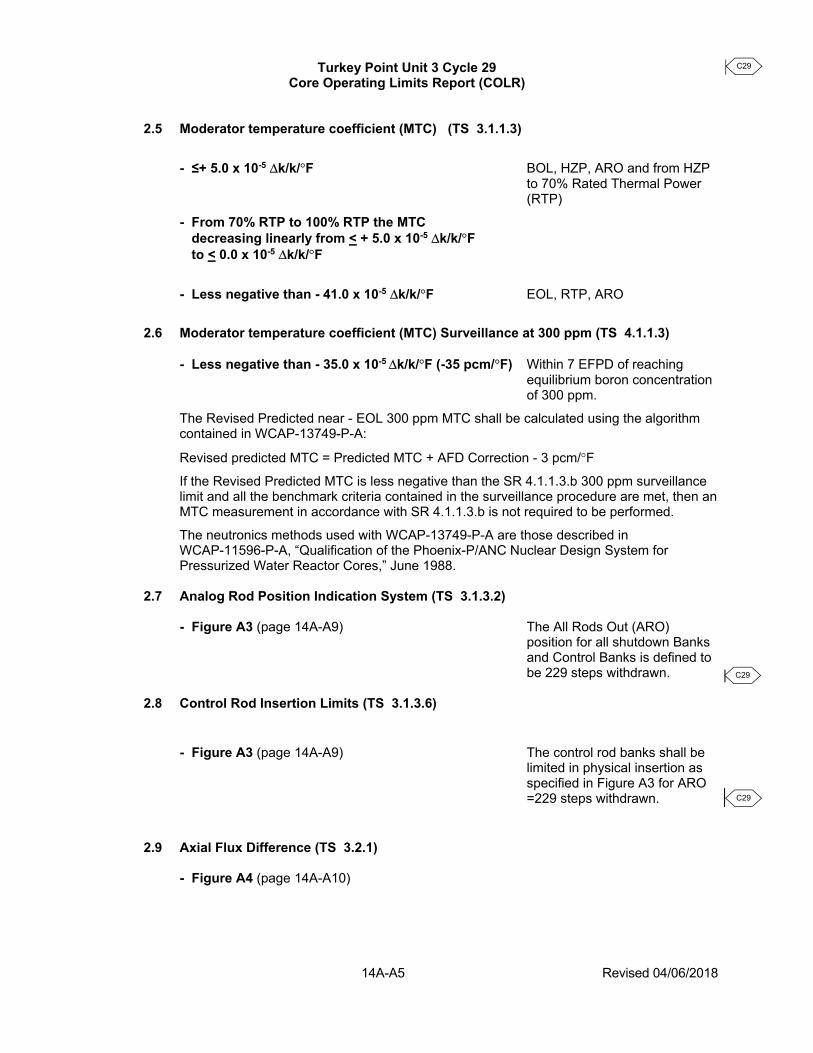
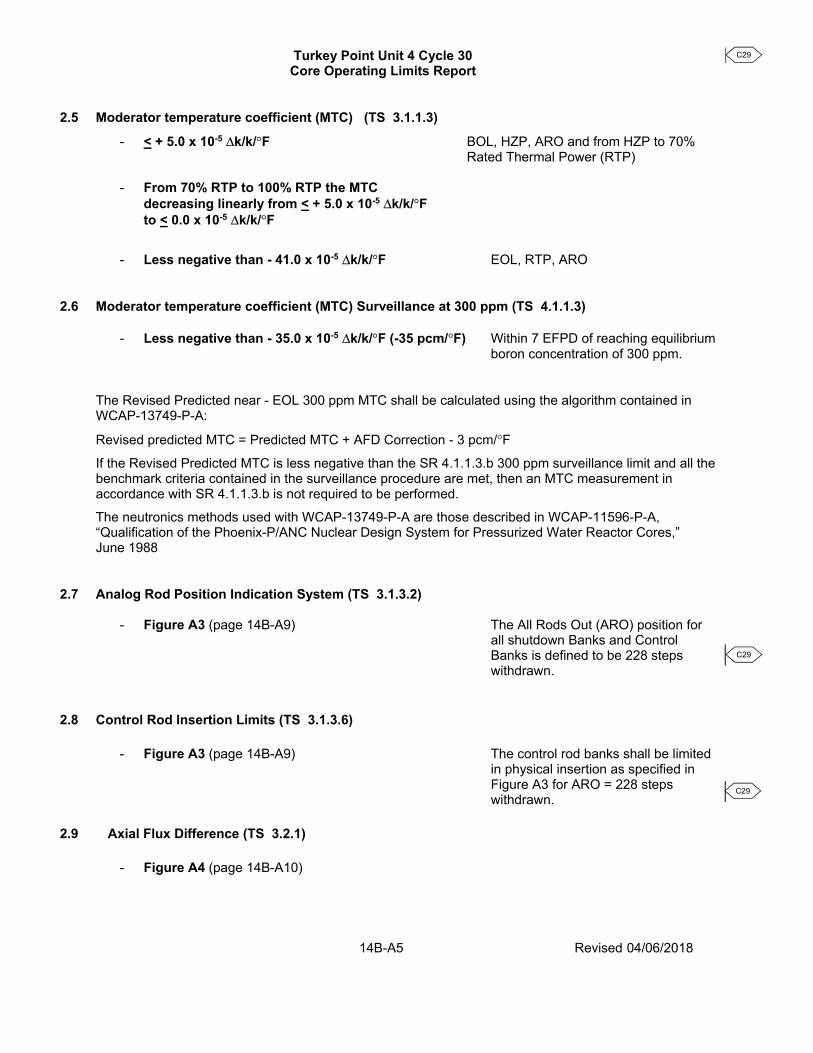
2.5 Moderator temperature coefficient (MTC) (TS 3.1.1.3)
- ≤+ 5.0 x 10⁻⁵ Δk/k/°F BOL, HZP, ARO and from HZP to 70% Rated Thermal Power (RTP)
- From 70% RTP to 100% RTP the MTC decreasing linearly from < + 5.0 x 10⁻⁵ Δk/k/°F to < 0.0 x 10⁻⁵ Δk/k/°F
- Less negative than - 41.0 x 10⁻⁵ Δk/k/°F EOL, RTP, ARO 2.6 Moderator temperature coefficient (MTC) Surveillance at 300 ppm (TS 4.1.1.3)
- Less negative than - 35.0 x 10⁻⁵ Δk/k/°F (-35 pcm/°F) Within 7 EFPD of reaching equilibrium boron concentration of 300 ppm.
The Revised Predicted near - EOL 300 ppm MTC shall be calculated using the algorithm contained in WCAP-13749-P-A:
Revised predicted MTC = Predicted MTC + AFD Correction - 3 pcm/°F
If the Revised Predicted MTC is less negative than the SR 4.1.1.3.b 300 ppm surveillance limit and all the benchmark criteria contained in the surveillance procedure are met, then an MTC measurement in accordance with SR 4.1.1.3.b is not required to be performed.
The neutronics methods used with WCAP-13749-P-A are those described in WCAP-11596-P-A, “Qualification of the Phoenix-P/ANC Nuclear Design System for Pressurized Water Reactor Cores,” June 1988.
2.7 Analog Rod Position Indication System (TS 3.1.3.2)
- Figure A3 (page 14A-A9) The All Rods Out (ARO) position for all shutdown Banks and Control Banks is defined to be 229 steps withdrawn.
2.8 Control Rod Insertion Limits (TS 3.1.3.6)
- Figure A3 (page 14A-A9) The control rod banks shall be limited in physical insertion as specified in Figure A3 for ARO =229 steps withdrawn.
2.9 Axial Flux Difference (TS 3.2.1) - Figure A4 (page 14A-A10)
14A-A5 Revised 04/06/2018
C29
C29
C29

Turkey Point Unit 3 Cycle 29 Core Operating Limits Report (COLR)
2.10 Heat Flux Hot Channel Factor FQ(Z) (TS 3.2.2) - [FQ]L = 2.30
- K(z) = 1.0 For 0’ ≤ z ≤ 12’ where z is core height in ft 2.11 Nuclear Enthalpy Rise Hot Channel Factor (TS 3.2.3) - FΔHRTP = 1.600 PFΔH = 0.3 2.12 DNB Parameters (TS 3.2.5) - RCS Tavg < 585.0 oF - Pressurizer Pressure > 2204 psig 14A-A6 Revised 04/06/2018
C29
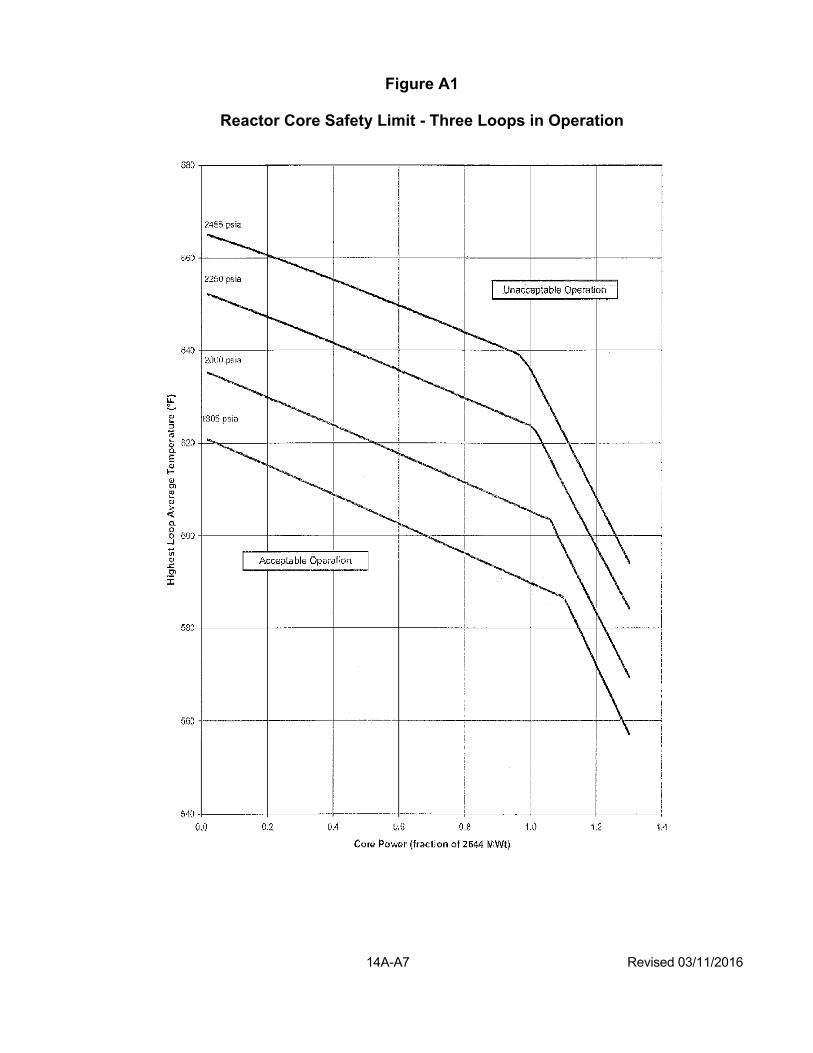
Figure A1
Reactor Core Safety Limit - Three Loops in Operation
14A-A7 Revised 03/11/2016
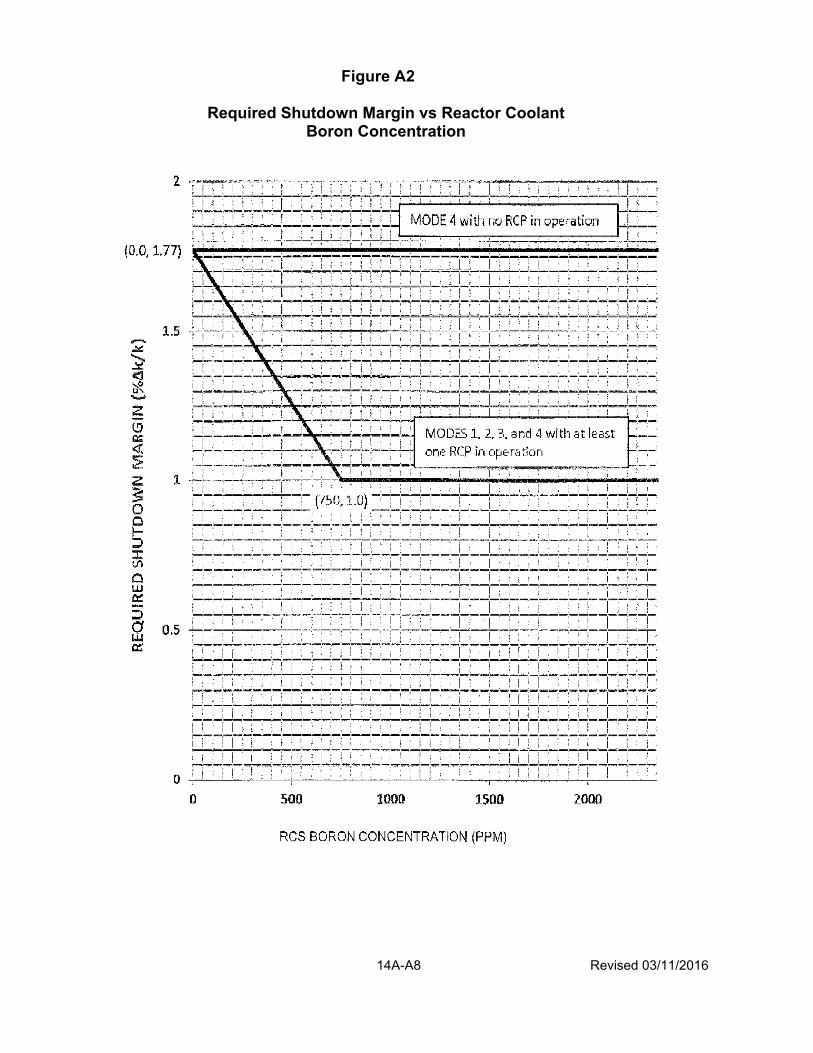
Figure A2
Required Shutdown Margin vs Reactor Coolant Boron Concentration
14A-A8 Revised 03/11/2016

FIGURE A3
Turkey Point Unit 3 Cycle 29 Rod Insertion Limits vs Thermal Power ARO = 229 Steps Withdrawn, Overlap = 101 Steps
14A-A9 Revised 04/06/2018
C29
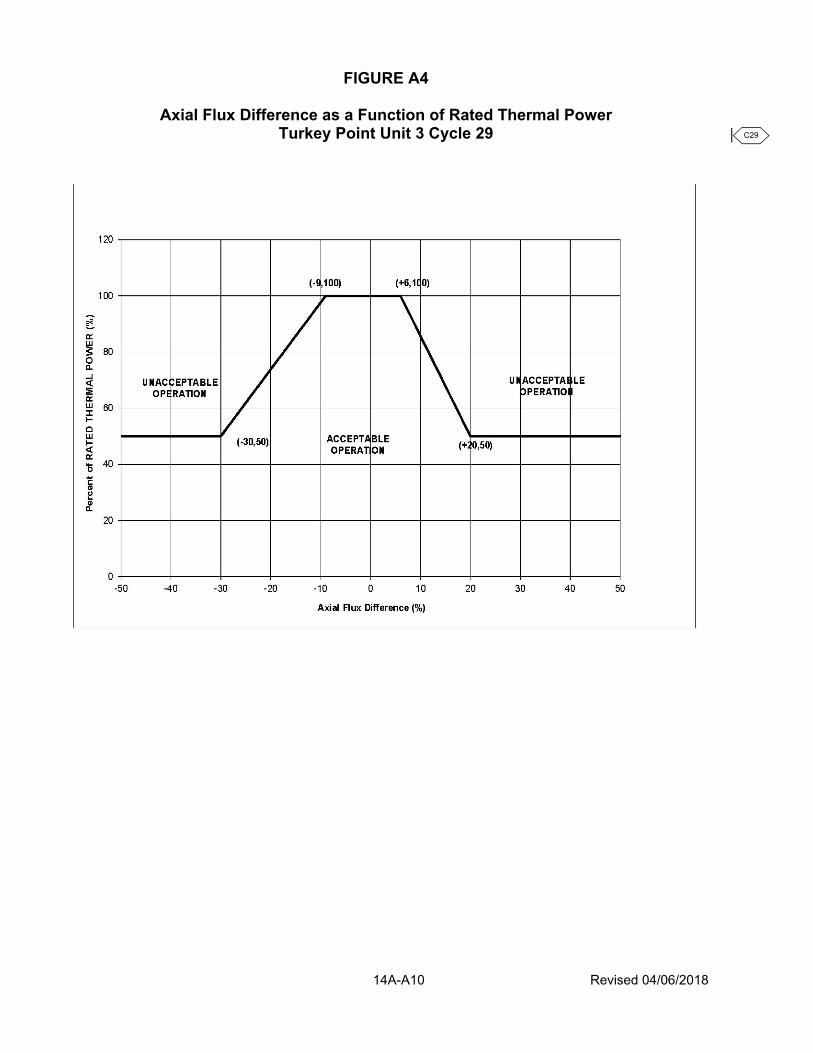
FIGURE A4
Axial Flux Difference as a Function of Rated Thermal Power
Turkey Point Unit 3 Cycle 29
14A-A10 Revised 04/06/2018
C29

APPENDIX 14B
TURKEY POINT PLANT UNIT 4 CYCLE 30 RELOAD CHARACTERISTICS AND PARAMETERS
14B-i Revised 04/06/2018
C29
TABLE OF CONTENTS Section Title Page 1.0 INTRODUCTION AND SUMMARY ......................................................................14B-1 1.1 Introduction ................................................................................................14B-1 1.2 General Description ...................................................................................14B-1 Appendix A Turkey Point Unit 4 Cycle 30 .................................................................................14B-A1 Core Operating Limits Report (COLR)
14B-ii Revised 04/06/2018
C29
LIST OF TABLES
Table Title Page 14B-1 Fuel Assembly Design Parameters................................................................................ 14B-2 Turkey Point Unit 4 - Cycle 30 14B-2 Kinetics Characteristics.................................................................................................. 14B-3 Turkey Point Unit 4 - Cycle 30 14B-3 Shutdown Requirements and Margins........................................................................... 14B-4 Turkey Point Unit 4 - Cycles 29 and 30
LIST OF FIGURES Figure 14B-1 Reference Core Loading Pattern.................................................................................... 14B-6 Turkey Point Unit 4 Cycle 30 14B-2 Burnable Absorber Locations........................................................................................ 14B-7 Turkey Point Unit 4 Cycle 30 14B-iii Revised 04/06/2018
C29
C29
C29
C29
C29

1.0 INTRODUCTION and SUMMARY 1.1 Introduction
This report presents reload characteristics and parameters associated with Turkey Point Unit 4 Cycle 30. The Cycle 30 core is a full core of 15x15 Upgrade fuel assemblies in Region 28, 29, 30, 31, and 32.
1.2 General Description
The Turkey Point Unit 4 reactor core is comprised of 157 fuel assemblies arranged in the core loading pattern configuration shown in Figure 14B-1.
All fuel assemblies have axial blankets at both the top and bottom of the stack to reduce neutron leakage and to improve uranium utilization. Regions 28, 29, 30, 31, and 32 fuel assembly blankets are 8 inches long, with Natural UO2 annular pellets in Region 28 and 2.6 w/o enriched UO2 annular pellets in the other regions. The design parameters for the Cycle 30 core are provided in Table 14B-1.
The Cycle 30 core uses a single type of burnable absorber, the Westinghouse Integral Fuel Burnable Absorber (IFBA) rods composed of ZrB2 coated fuel pellets with 2.2125 mg 10B/in. The active absorber length is 120 inches. Their locations in the core are shown in Figure 14B-2.
The core design parameters for Cycle 30 are as follows: Parameter Current Licensing Basis Core Power (MWt) 2644 Pressurizer Pressure (psia) 2250 Core Inlet Temperature1 (°F) 549.2 Core Inlet Temperature2 (°F) 550.2 Thermal Design Flow (gpm) 260,700 Minimum Measured Flow 270,000 Average Linear Power Density3 (kW/ft) 6.714 1. Based on Thermal Design Flow. 2. Based on Minimum Measured Flow.
The core kinetics characteristics and shutdown requirements and margins are provided in Tables 14B-2 and 14B-3, respectively. The Core Operating Limits Report (COLR) for Cycle 30 is provided in Appendix A.
14B-1 Revised 04/06/2018
C29
C29
C29
C29
C29
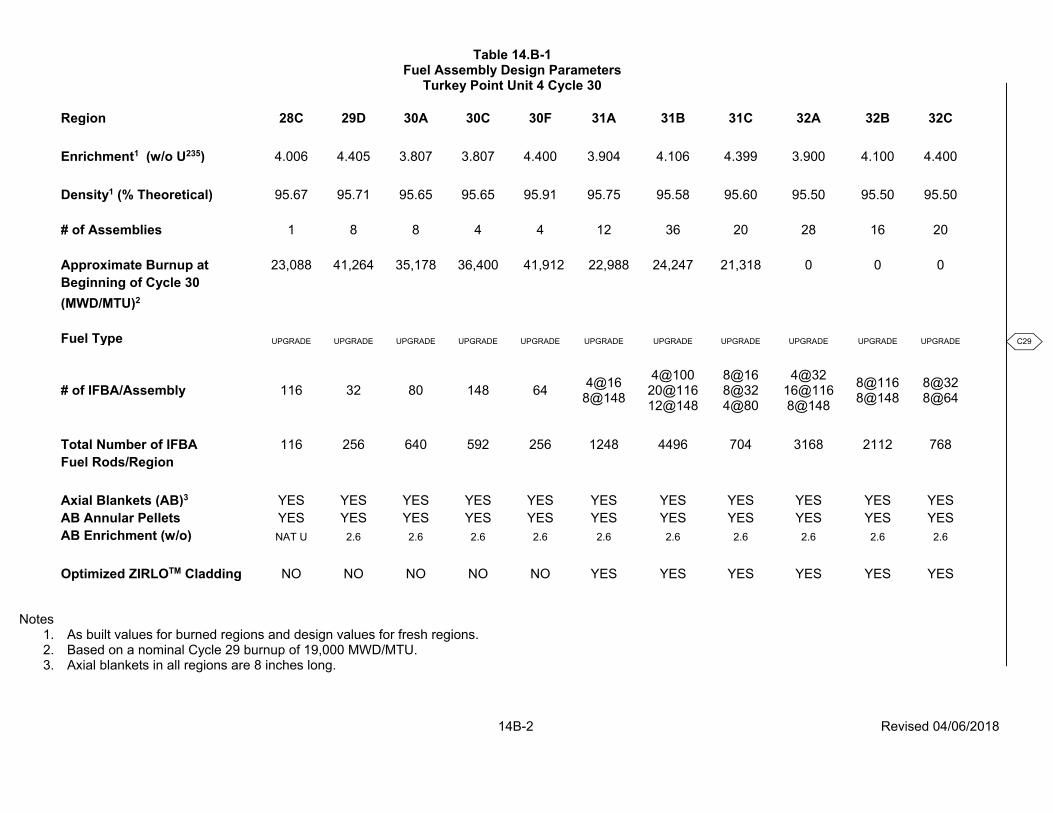
Table 14.B-1 Fuel Assembly Design Parameters
Turkey Point Unit 4 Cycle 30
Region 28C 29D 30A 30C 30F 31A 31B 31C 32A 32B 32C
Enrichment1 (w/o U235) 4.006 4.405 3.807 3.807 4.400 3.904 4.106 4.399 3.900 4.100 4.400
Density1 (% Theoretical) 95.67 95.71 95.65 95.65 95.91 95.75 95.58 95.60 95.50 95.50 95.50
# of Assemblies 1 8 8 4 4 12 36 20 28 16 20
Approximate Burnup at 23,088 41,264 35,178 36,400 41,912 22,988 24,247 21,318 0 0 0Beginning of Cycle 30 (MWD/MTU)2
Fuel Type UPGRADE UPGRADE UPGRADE UPGRADE UPGRADE UPGRADE UPGRADE UPGRADE UPGRADE UPGRADE UPGRADE
# of IFBA/Assembly 116 32 80 148 64 4@16 8@148
4@100 20@116 12@148
8@16 8@32 4@80
4@32 16@1168@148
8@1168@148
8@32 8@64
Total Number of IFBA 116 256 640 592 256 1248 4496 704 3168 2112 768Fuel Rods/Region
Axial Blankets (AB)3 YES YES YES YES YES YES YES YES YES YES YESAB Annular Pellets YES YES YES YES YES YES YES YES YES YES YESAB Enrichment (w/o) NAT U 2.6 2.6 2.6 2.6 2.6 2.6 2.6 2.6 2.6 2.6
Optimized ZIRLOTM Cladding NO NO NO NO NO YES YES YES YES YES YES Notes
1. As built values for burned regions and design values for fresh regions. 2. Based on a nominal Cycle 29 burnup of 19,000 MWD/MTU. 3. Axial blankets in all regions are 8 inches long.
14B-2 Revised 04/06/2018
C29
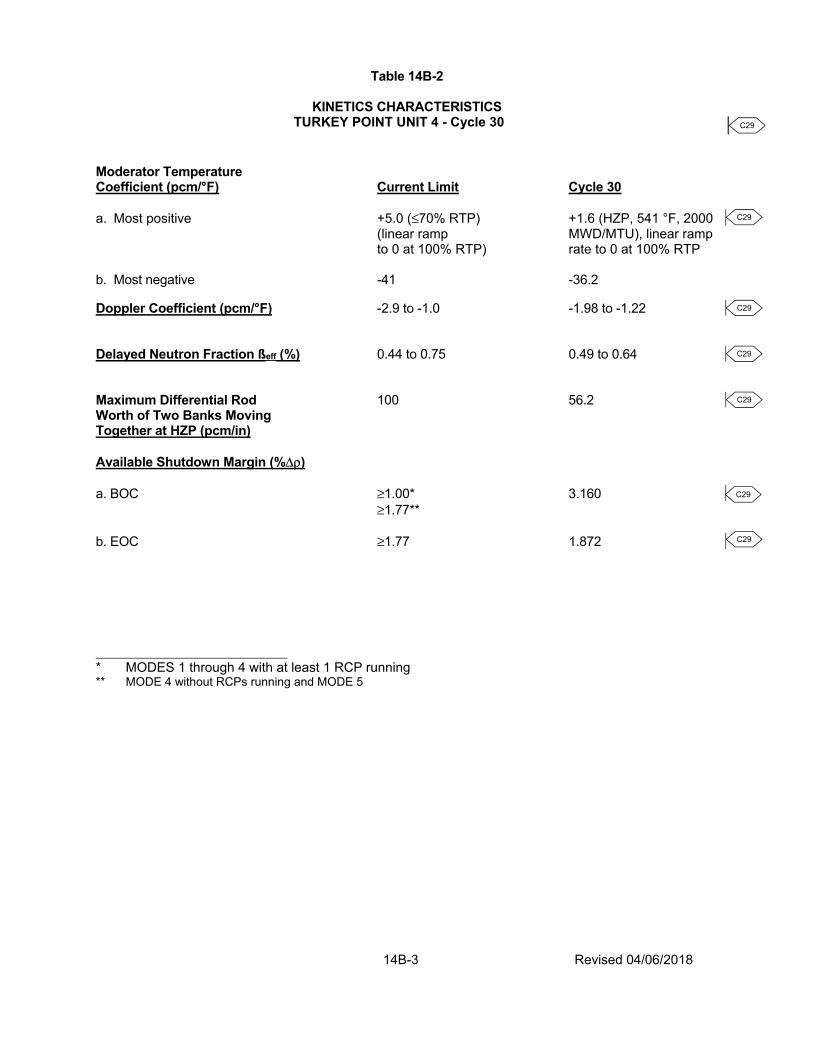
Table 14B-2
KINETICS CHARACTERISTICS
TURKEY POINT UNIT 4 - Cycle 30 Moderator Temperature Coefficient (pcm/°F) Current Limit Cycle 30 a. Most positive +5.0 (≤70% RTP) +1.6 (HZP, 541 °F, 2000 (linear ramp MWD/MTU), linear ramp to 0 at 100% RTP) rate to 0 at 100% RTP b. Most negative -41 -36.2 Doppler Coefficient (pcm/°F) -2.9 to -1.0 -1.98 to -1.22 Delayed Neutron Fraction ßeff (%) 0.44 to 0.75 0.49 to 0.64 Maximum Differential Rod 100 56.2 Worth of Two Banks Moving Together at HZP (pcm/in) Available Shutdown Margin (%Δρ) a. BOC ≥1.00* 3.160 ≥1.77** b. EOC ≥1.77 1.872 * MODES 1 through 4 with at least 1 RCP running ** MODE 4 without RCPs running and MODE 5
14B-3 Revised 04/06/2018
C29
C29
C29
C29
C29
C29
C29

Table 14B-3
Shutdown Requirements and Margins Turkey Point Unit 4 - Cycles 29 and 30
Cycle 29 Cycle 30
BOC EOC BOC EOC Control Rod Worth (%Δρ) All Rods Inserted Less 5.47 5.68 5.53 5.69 Worst Stuck Rod (1) Less 7% 5.09 5.29 5.14 5.30 Control Rod Requirements (%Δρ) Reactivity Defects (Doppler, 1.89 3.42 1.98 3.42 TAVE, Void, and Redistribution) Rod Insertion Allowance (RIA) --- --- --- --- RCCA Repositioning Allowance (see note) (2) Total Requirements 1.89 3.42 1.98 3.42 Shutdown Margin (1) - (2) (%Δρ) 3.20 1.87 3.16 1.88 Required Shutdown Margin (%Δρ) 1.00 1.77 1.00 1.77 Note: Additional margin to accommodate a 22 °F cooldown is not available for EPU cycles. The RIA
term is already included in the Reactivity Defects term in the methodology used to compute the shutdown margin.
14B-4 Revised 04/06/2018
C29
C29
C29
C29
C29
C29
C29

Figure 14B-1
Turkey Point Unit 4, Cycle 30 Reference Core Loading Pattern
14B-5 Revised 04/06/2018
C29

Figure 14B-2
Turkey Point Unit 4, Cycle 30 Burnable Absorber and Source Rod Locations
14B-6 Revised 04/06/2018
C29
Appendix A
Turkey Point Unit 4 Cycle 30 Core Operating Limits Report (COLR)
14B-A1 Revised 04/06/2018
C29
Turkey Point Unit 4 Cycle 30 Core Operating Limits Report
1.0 Introduction
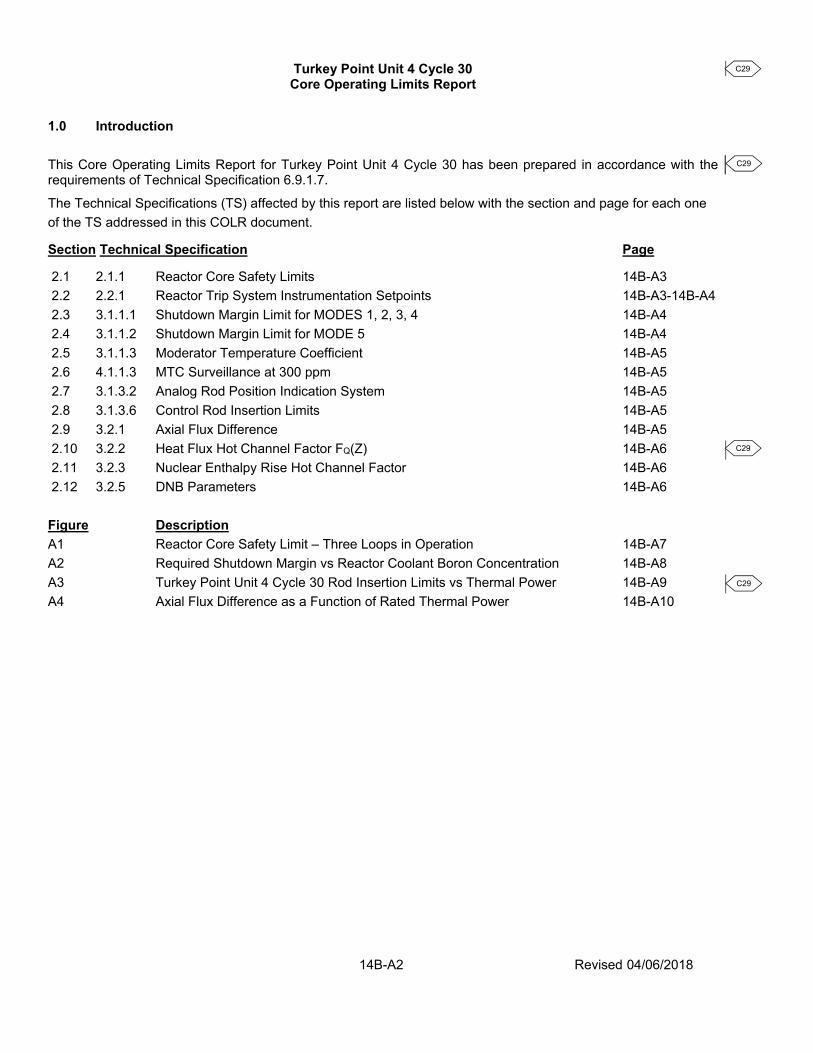
This Core Operating Limits Report for Turkey Point Unit 4 Cycle 30 has been prepared in accordance with the requirements of Technical Specification 6.9.1.7.
The Technical Specifications (TS) affected by this report are listed below with the section and page for each one of the TS addressed in this COLR document.
Section Technical Specification Page
2.1 2.1.1 Reactor Core Safety Limits 14B-A3 2.2 2.2.1 Reactor Trip System Instrumentation Setpoints 14B-A3-14B-A4 2.3 3.1.1.1 Shutdown Margin Limit for MODES 1, 2, 3, 4 14B-A4 2.4 3.1.1.2 Shutdown Margin Limit for MODE 5 14B-A4 2.5 3.1.1.3 Moderator Temperature Coefficient 14B-A5 2.6 4.1.1.3 MTC Surveillance at 300 ppm 14B-A5 2.7 3.1.3.2 Analog Rod Position Indication System 14B-A5 2.8 3.1.3.6 Control Rod Insertion Limits 14B-A5 2.9 3.2.1 Axial Flux Difference 14B-A5 2.10 3.2.2 Heat Flux Hot Channel Factor FQ(Z) 14B-A6 2.11 3.2.3 Nuclear Enthalpy Rise Hot Channel Factor 14B-A6 2.12 3.2.5 DNB Parameters 14B-A6 Figure Description A1 Reactor Core Safety Limit – Three Loops in Operation 14B-A7 A2 Required Shutdown Margin vs Reactor Coolant Boron Concentration 14B-A8 A3 Turkey Point Unit 4 Cycle 30 Rod Insertion Limits vs Thermal Power 14B-A9 A4 Axial Flux Difference as a Function of Rated Thermal Power 14B-A10 14B-A2 Revised 04/06/2018
C29
C29
C29
C29

Turkey Point Unit 4 Cycle 30 Core Operating Limits Report
2.0 OPERATING LIMITS
The cycle-specific parameter limits for the specifications listed in the Introduction are presented below and listed sequentially by Technical Specification (TS). These limits have been developed using the NRC-approved methodologies specified in TS 6.9.1.7.
2.1 Reactor Core Safety Limits – Three Loops in Operation (TS 2.1.1) - Figure A1(page 14B-A7) In Modes 1 and 2, the combination of Thermal Power, reactor
coolant system highest loop average temperature and pressurizer pressure shall not exceed the limits in Figure A1.
2.2 Reactor Trip System Instrumentation Setpoints (TS 2.2.1)
NOTE 1 on TS Table 2.2-1 Overtemperature ΔT
- τ1 = 0s, τ2 = 0s Lead/Lag compensator on measured ΔT
- τ3 = 2s Lag compensator on measured ΔT - K1 = 1.31
- K2 = 0.023/°F
- τ4 = 25s, τ5 = 3s Time constants utilized in the lead-lag compensator for Tavg
- τ6 = 2s Lag compensator on measured Tavg
- T′ ≤ 583.0 °F Indicated Loop Tavg at RATED THERMAL POWER - K3 = 0.00116/psi
- P’ ≥ 2235 psig Nominal RCS operating pressure
- f1(ΔI) = 0 for qt – qb between – 18% and + 7%. For each percent that the magnitude of qt – qb exceeds – 18%, the ΔT Trip Setpoint shall be automatically reduced by 3.51% of its value at RATED
THERMAL POWER; and
For each percent that the magnitude of qt – qb exceeds +7%, the ΔT Trip Setpoint shall be automatically reduced by 2.37% of its value at RATED THERMAL POWER.
Where qt and qb are percent RATED THERMAL POWER in the top and bottom halves of the core respectively, and qt + qb is total THERMAL POWER in percent of RATED THERMAL POWER.
14B-A3 Revised 04/06/2018
C29
Turkey Point Unit 4 Cycle 30 Core Operating Limits Report
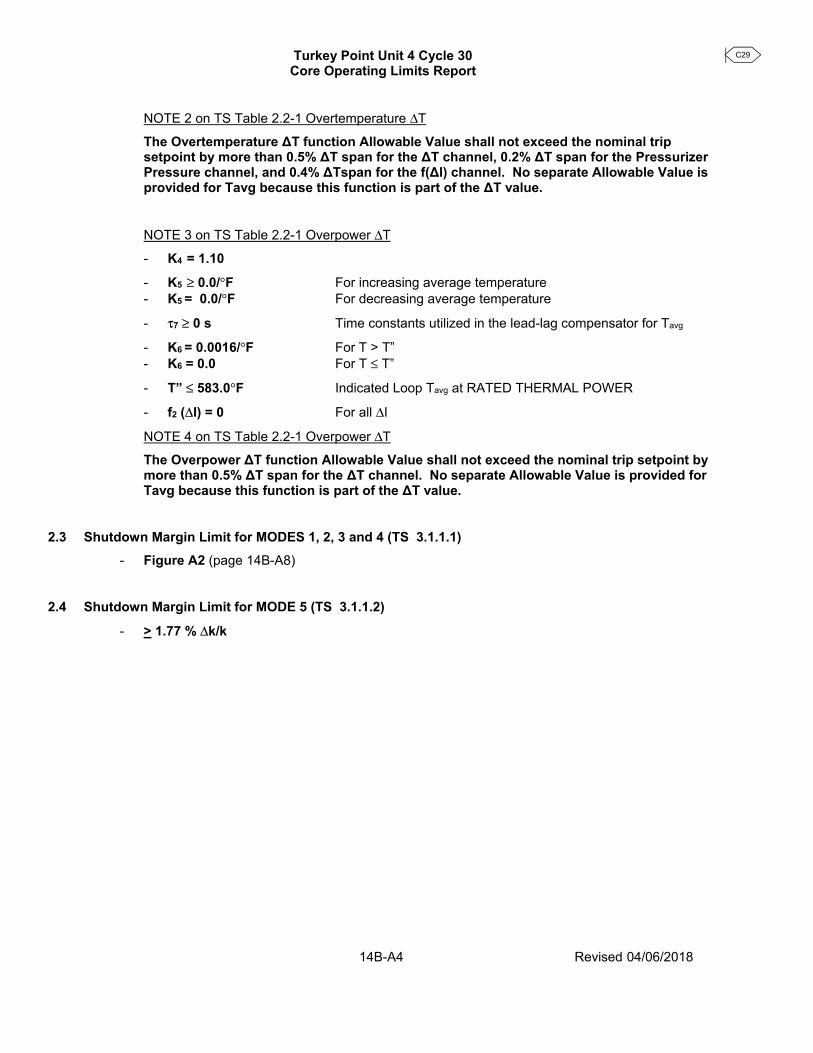
NOTE 2 on TS Table 2.2-1 Overtemperature ΔT The Overtemperature ΔT function Allowable Value shall not exceed the nominal trip setpoint by more than 0.5% ΔT span for the ΔT channel, 0.2% ΔT span for the Pressurizer Pressure channel, and 0.4% ΔTspan for the f(ΔI) channel. No separate Allowable Value is provided for Tavg because this function is part of the ΔT value.
NOTE 3 on TS Table 2.2-1 Overpower ΔT - K4 = 1.10
- K5 ≥ 0.0/°F For increasing average temperature - K5 = 0.0/°F For decreasing average temperature
- τ7 ≥ 0 s Time constants utilized in the lead-lag compensator for Tavg
- K6 = 0.0016/°F For T > T” - K6 = 0.0 For T ≤ T”
- T” ≤ 583.0°F Indicated Loop Tavg at RATED THERMAL POWER
- f2 (ΔI) = 0 For all ΔI
NOTE 4 on TS Table 2.2-1 Overpower ΔT
The Overpower ΔT function Allowable Value shall not exceed the nominal trip setpoint by more than 0.5% ΔT span for the ΔT channel. No separate Allowable Value is provided for Tavg because this function is part of the ΔT value.
2.3 Shutdown Margin Limit for MODES 1, 2, 3 and 4 (TS 3.1.1.1)
- Figure A2 (page 14B-A8)
2.4 Shutdown Margin Limit for MODE 5 (TS 3.1.1.2)
- > 1.77 % Δk/k
14B-A4 Revised 04/06/2018
C29
Turkey Point Unit 4 Cycle 30 Core Operating Limits Report
2.5 Moderator temperature coefficient (MTC) (TS 3.1.1.3)
- < + 5.0 x 10⁻⁵ Δk/k/°F BOL, HZP, ARO and from HZP to 70% Rated Thermal Power (RTP)
- From 70% RTP to 100% RTP the MTC
decreasing linearly from < + 5.0 x 10⁻⁵ Δk/k/°F to < 0.0 x 10⁻⁵ Δk/k/°F
- Less negative than - 41.0 x 10⁻⁵ Δk/k/°F EOL, RTP, ARO
2.6 Moderator temperature coefficient (MTC) Surveillance at 300 ppm (TS 4.1.1.3)
- Less negative than - 35.0 x 10⁻⁵ Δk/k/°F (-35 pcm/°F) Within 7 EFPD of reaching equilibrium boron concentration of 300 ppm.
The Revised Predicted near - EOL 300 ppm MTC shall be calculated using the algorithm contained in WCAP-13749-P-A:
Revised predicted MTC = Predicted MTC + AFD Correction - 3 pcm/°F
If the Revised Predicted MTC is less negative than the SR 4.1.1.3.b 300 ppm surveillance limit and all the benchmark criteria contained in the surveillance procedure are met, then an MTC measurement in accordance with SR 4.1.1.3.b is not required to be performed.
The neutronics methods used with WCAP-13749-P-A are those described in WCAP-11596-P-A, “Qualification of the Phoenix-P/ANC Nuclear Design System for Pressurized Water Reactor Cores,” June 1988
2.7 Analog Rod Position Indication System (TS 3.1.3.2)
- Figure A3 (page 14B-A9) The All Rods Out (ARO) position for all shutdown Banks and Control Banks is defined to be 228 steps withdrawn.
2.8 Control Rod Insertion Limits (TS 3.1.3.6)
- Figure A3 (page 14B-A9) The control rod banks shall be limited in physical insertion as specified in Figure A3 for ARO = 228 steps withdrawn.
2.9 Axial Flux Difference (TS 3.2.1)
- Figure A4 (page 14B-A10)
14B-A5 Revised 04/06/2018
C29
C29
C29

Turkey Point Unit 4 Cycle 30 Core Operating Limits Report
2.10 Heat Flux Hot Channel Factor FQ(Z) (TS 3.2.2)
- [FQ]L = 2.30
- K(z) = 1.0 For 0’ < z < 12’ where z is core height in ft
2.11 Nuclear Enthalpy Rise Hot Channel Factor (TS 3.2.3)
- FΔHRTP = 1.600 PFΔH = 0.3
2.12 DNB Parameters (TS 3.2.5) - RCS Tavg < 585.0 oF - Pressurizer Pressure > 2204 psig
14B-A6 Revised 04/06/2018
C29
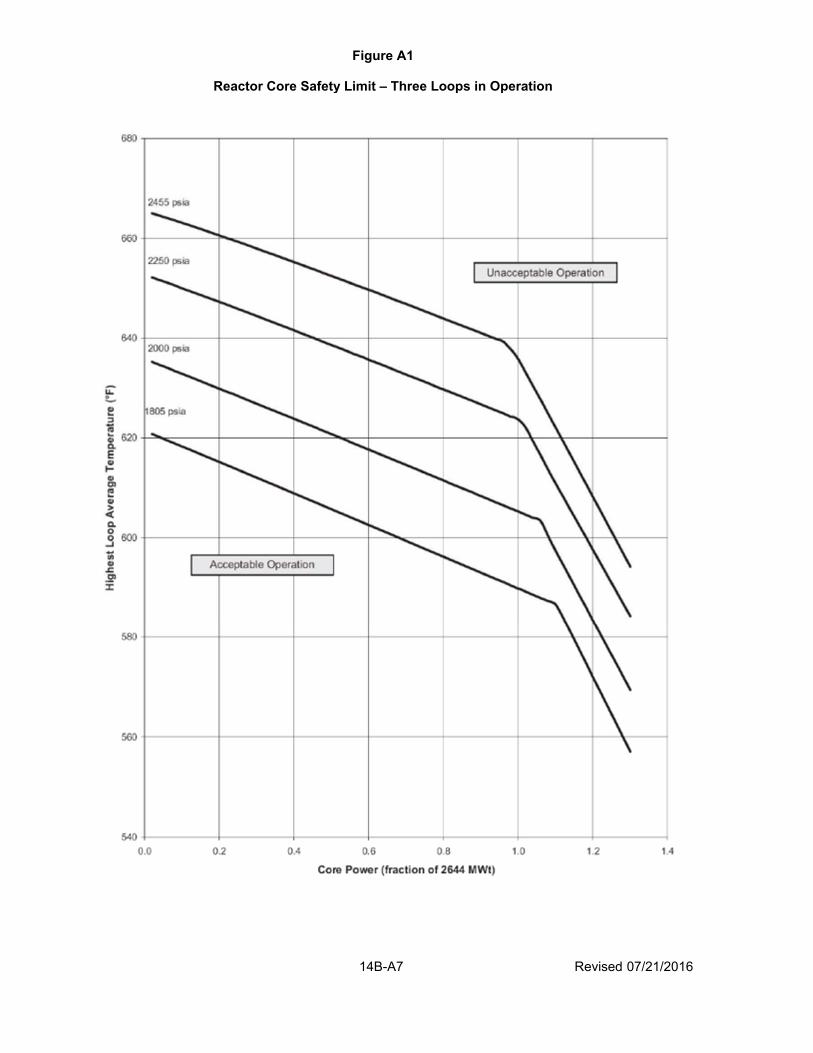
Figure A1
Reactor Core Safety Limit – Three Loops in Operation
14B-A7 Revised 07/21/2016
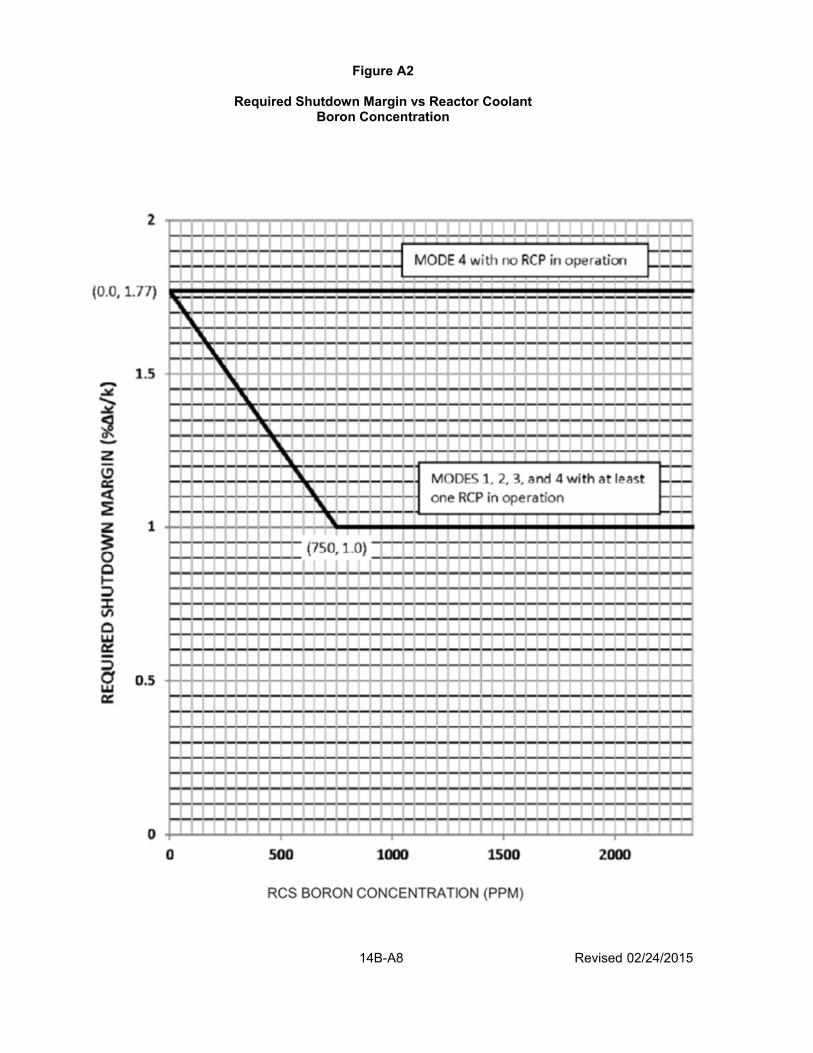
Figure A2
Required Shutdown Margin vs Reactor Coolant
Boron Concentration
14B-A8 Revised 02/24/2015

Figure A3
Turkey Point Unit 4 Cycle 30 Rod Insertion Limits vs Thermal Power
ARO = 228 Steps Withdrawn, Overlap = 100 Steps
14B-A9 Revised 04/06/2018
C29
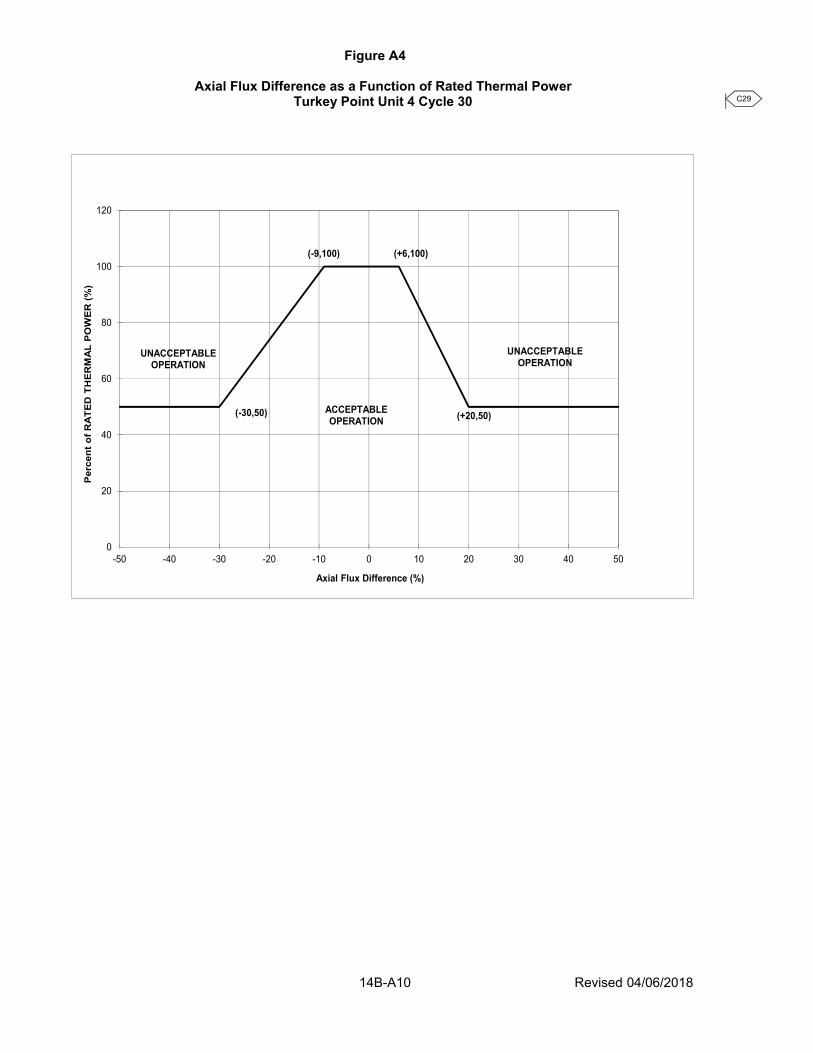
Figure A4
Axial Flux Difference as a Function of Rated Thermal Power Turkey Point Unit 4 Cycle 30
14B-A10 Revised 04/06/2018
0
20
40
60
80
100
120
-50 -40 -30 -20 -10 0 10 20 30 40 50
Per
cent
of R
ATE
D T
HE
RM
AL
PO
WE
R (%
)
Axial Flux Difference (%)
(-9,100) (+6,100)
(-30,50) (+20,50)
UNACCEPTABLE OPERATION
UNACCEPTABLE OPERATION
ACCEPTABLE OPERATION
C29
APPENDIX 14 C TURKEY POINT UNITS 3 AND 4 UPDATED FSAR MODIFICATION OF THE TURBINE RUNBACK SYSTEM THIS APPENDIX HAS BEEN ENTIRELY DELETED
SEE SECTION 10.2.2 “Turbine Runback (Load Cutback) Function” FLORIDA POWER AND LIGHT COMPANY 14C-1 Revised 04/06/2018
C29

APPENDIX 14D FLORIDA POWER AND LIGHT COMPANY TURKEY POINT UNITS 3 AND 4
DELETED IN ITS ENTIRETY
REFER TO CHAPTER 9, SECTION 9.5
AND CHAPTER 14, SECTION 14.2.1.3
HIGH DENSITY SPENT FUEL STORAGE RACKS 14D-1 Revised 09/29/2005
APPENDIX 14E FLORIDA POWER AND LIGHT COMPANY TURKEY POINT UNITS 3 AND 4
DELETED IN ITS ENTIRETY
REFER TO CHAPTER 9, SECTION 9.5
AND CHAPTER 14, SECTION 14.2.1.3
SPENT FUEL STORAGE FACILITY MODIFICATION SAFETY ANALYSIS REPORT 14E-i Revised 09/29/2005
APPENDIX 14F
ENVIRONMENTAL CONSEQUENCES OF A LOSS-OF-COOLANT ACCIDENT
This appendix contains the original licensing basis LOCA dose analysis. This
analysis has been replaced with a revised analysis that can be found in
Section 14.3.5.
The results of analyses described in this section demonstrate that the
amounts of radioactivity released to the environment in the event of a
loss-of-coolant accident (which has an exceedingly low probability of
occurrence) are substantially less than the guidelines specified in 10 CFR
100. In summary, the computed thyroid dose values are (using the release
assumption of TID-14844):
North Boundary South Low Population
Exclusion Radius Boundary Distance
Integrated Dose 4164 ft 5582 ft 5 miles
0-2 hour dose, rem 93 65 9
0-31 day dose, rem 109 75 10
Loss-of-Coolant Accident
The loss-of-coolant accident has the potential for the highest off site
doses, compared to all other accidents. The loss of coolant accident may
result in a significant amount of clad rupture; however, since the fuel does
not melt, only a limited quantity of fission products are released. If it is
assumed that all the rods fail and that all the fission products in the gap
spaces were released, the total release from the core would be less than 5%
of the saturation quantities of the radioactive iodines and noble gases.
For analytical purposes the amount of radioactive fission products that could
be released from the core have been calculated according to the fundamental
assumptions given in Reference 1 (TID 14844). This calculational model has
been widely used in evaluating the capability of PWR containment systems in
the event of the core melt down. However, it should be pointed out that no
accident of this magnitude has been described for these units; in fact, an
accident of this magnitude is not considered credible.
14F-1 Rev. 10 7/92
The TID 14844 model assumes that 50% of the total core iodine inventory is
released, and that one half of this amount becomes plated out onto surfaces
within the containment. The remaining one half, or 25% of the total core
iodine inventory, is assumed to be in the containment atmosphere and
available for leakage. As a function of time the charcoal filter system
collects and retains the iodine, and thereby the amount of iodine available
for leakage is substantially reduced.
The TID 14844 model also assumes that 100% of the total core noble gas
inventory and 1% of the total core solid fission product inventory are
released into the containment.
Core Inventory of Iodines and Noble Gases
The total core inventory was calculated on the basis of the reactor having
been operated as follows: (1) 2300 MW(t), (2) 625 days of full-power
operation to produce 1-129 and the stable isotopes, and (3) except for I-129,
full-power operation to reach the saturation inventory of the radioactive
isotopes. Table 14F-1 gives information on the major iodine isotopes
computed for the Turkey Point core, based on data given in TID 14844. Table
14F-2 gives information on the major noble gas isotopes.
Iodines and Noble Gases in Containment Atmosphere
The amount of noble gases in the containment atmosphere at time zero
(according to the TID 14844 model) is the total amount listed in Table 14F-2.
These gases are assumed to be completely mixed in the atmosphere, and
available for leakage.
The amount of iodine in the containment atmosphere at time zero (according to
the TID 14844 model, 25% of total) adds up to the following:
Total of I-127 and I-129 2,550 grams, stable
Total of I-131, I-132, I-133,
I-134 and 1-135 152 grams, radioactive
Total Iodine in Containment 2,702 grams
14F-2 Rev. 10 7/92
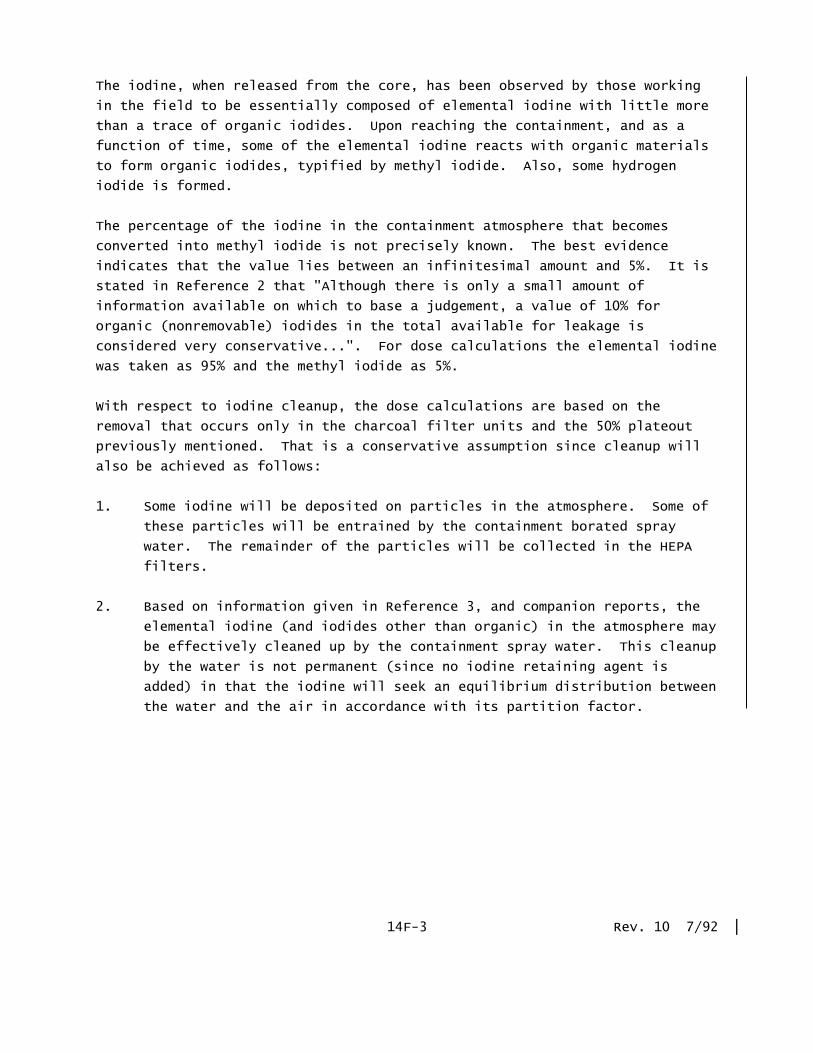
The iodine, when released from the core, has been observed by those working
in the field to be essentially composed of elemental iodine with little more
than a trace of organic iodides. Upon reaching the containment, and as a
function of time, some of the elemental iodine reacts with organic materials
to form organic iodides, typified by methyl iodide. Also, some hydrogen
iodide is formed.
The percentage of the iodine in the containment atmosphere that becomes
converted into methyl iodide is not precisely known. The best evidence
indicates that the value lies between an infinitesimal amount and 5%. It is
stated in Reference 2 that "Although there is only a small amount of
information available on which to base a judgement, a value of 10% for
organic (nonremovable) iodides in the total available for leakage is
considered very conservative...". For dose calculations the elemental iodine
was taken as 95% and the methyl iodide as 5%.
With respect to iodine cleanup, the dose calculations are based on the
removal that occurs only in the charcoal filter units and the 50% plateout
previously mentioned. That is a conservative assumption since cleanup will
also be achieved as follows:
1. Some iodine will be deposited on particles in the atmosphere. Some of
these particles will be entrained by the containment borated spray
water. The remainder of the particles will be collected in the HEPA
filters.
2. Based on information given in Reference 3, and companion reports, the
elemental iodine (and iodides other than organic) in the atmosphere may
be effectively cleaned up by the containment spray water. This cleanup
by the water is not permanent (since no iodine retaining agent is
added) in that the iodine will seek an equilibrium distribution between
the water and the air in accordance with its partition factor.
14F-3 Rev. 10 7/92
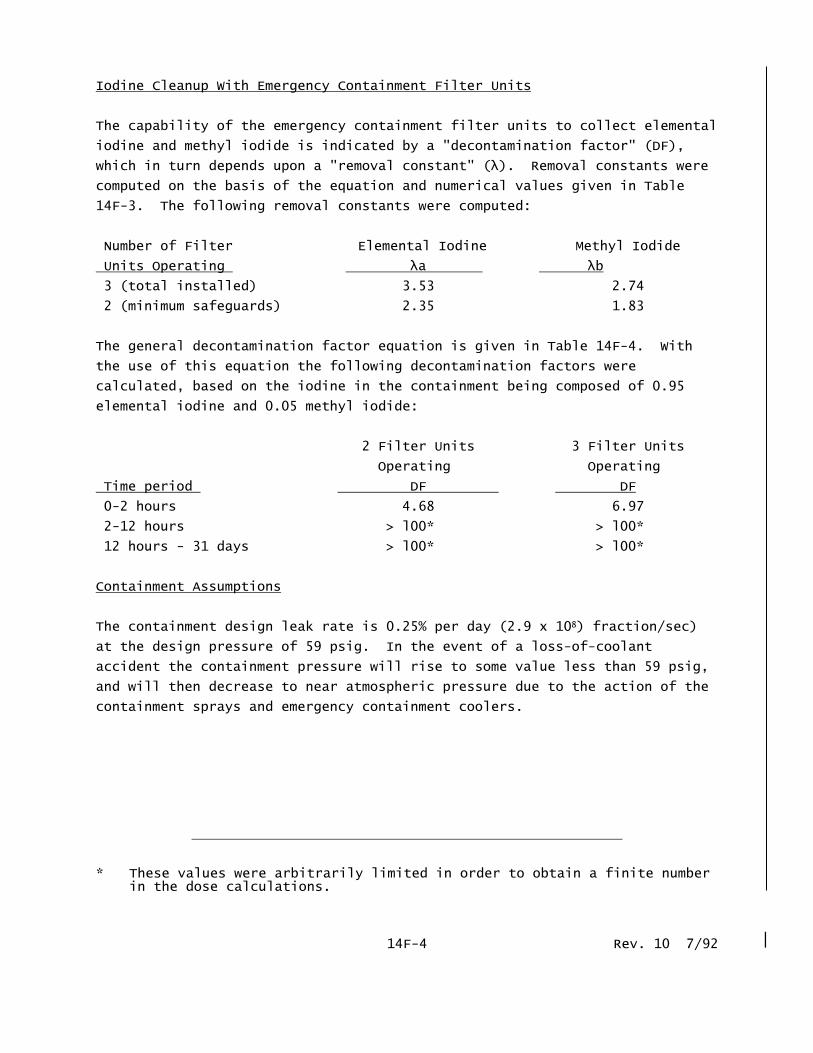
Iodine Cleanup With Emergency Containment Filter Units
The capability of the emergency containment filter units to collect elemental
iodine and methyl iodide is indicated by a "decontamination factor" (DF),
which in turn depends upon a "removal constant" (λ). Removal constants were
computed on the basis of the equation and numerical values given in Table
14F-3. The following removal constants were computed:
Number of Filter Elemental Iodine Methyl Iodide
Units Operating λa λb
3 (total installed) 3.53 2.74
2 (minimum safeguards) 2.35 1.83
The general decontamination factor equation is given in Table 14F-4. With
the use of this equation the following decontamination factors were
calculated, based on the iodine in the containment being composed of 0.95
elemental iodine and 0.05 methyl iodide:
2 Filter Units 3 Filter Units
Operating Operating
Time period DF DF
0-2 hours 4.68 6.97
2-12 hours > l00* > l00*
12 hours - 31 days > l00* > l00*
Containment Assumptions
The containment design leak rate is 0.25% per day (2.9 x 10⁸) fraction/sec)
at the design pressure of 59 psig. In the event of a loss-of-coolant
accident the containment pressure will rise to some value less than 59 psig,
and will then decrease to near atmospheric pressure due to the action of the
containment sprays and emergency containment coolers.
* These values were arbitrarily limited in order to obtain a finite number
in the dose calculations.
14F-4 Rev. 10 7/92
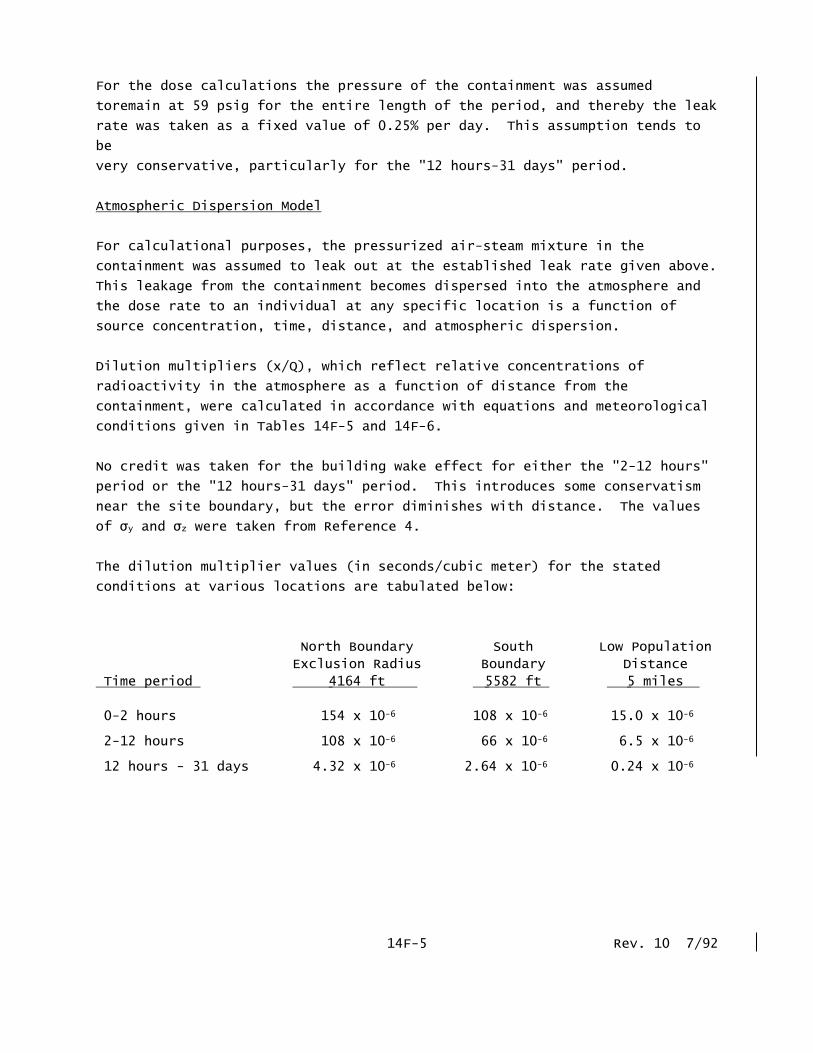
For the dose calculations the pressure of the containment was assumed
toremain at 59 psig for the entire length of the period, and thereby the leak
rate was taken as a fixed value of 0.25% per day. This assumption tends to
be
very conservative, particularly for the "12 hours-31 days" period.
Atmospheric Dispersion Model
For calculational purposes, the pressurized air-steam mixture in the
containment was assumed to leak out at the established leak rate given above.
This leakage from the containment becomes dispersed into the atmosphere and
the dose rate to an individual at any specific location is a function of
source concentration, time, distance, and atmospheric dispersion.
Dilution multipliers (x/Q), which reflect relative concentrations of
radioactivity in the atmosphere as a function of distance from the
containment, were calculated in accordance with equations and meteorological
conditions given in Tables 14F-5 and 14F-6.
No credit was taken for the building wake effect for either the "2-12 hours"
period or the "12 hours-31 days" period. This introduces some conservatism
near the site boundary, but the error diminishes with distance. The values
of σy and σz were taken from Reference 4.
The dilution multiplier values (in seconds/cubic meter) for the stated
conditions at various locations are tabulated below:
North Boundary South Low Population
Exclusion Radius Boundary Distance
Time period 4164 ft 5582 ft 5 miles
0-2 hours 154 x 10-6 108 x 10-6 15.0 x 10⁻⁶
2-12 hours 108 x 10-6 66 x 10-6 6.5 x 10⁻⁶
12 hours - 31 days 4.32 x 10⁻⁶ 2.64 x 10⁻⁶ 0.24 x 10⁻⁶
14F-5 Rev. 10 7/92
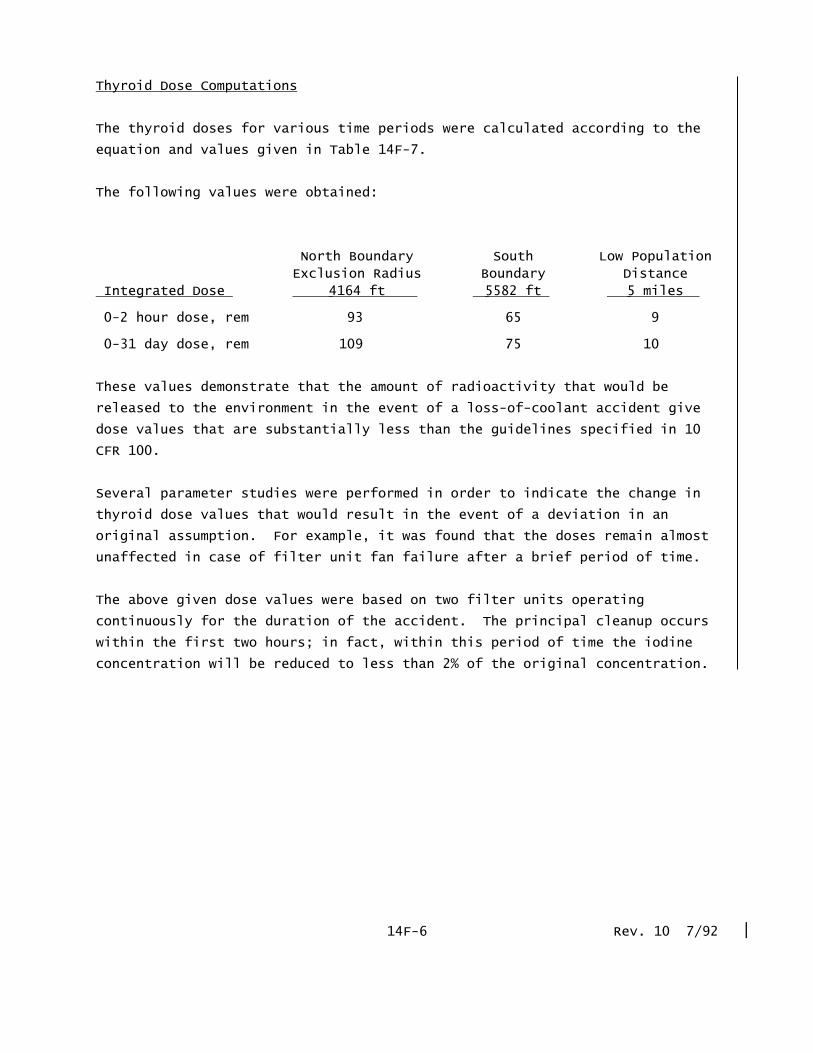
Thyroid Dose Computations
The thyroid doses for various time periods were calculated according to the
equation and values given in Table 14F-7.
The following values were obtained:
North Boundary South Low Population
Exclusion Radius Boundary Distance
Integrated Dose 4164 ft 5582 ft 5 miles 0-2 hour dose, rem 93 65 9 0-31 day dose, rem 109 75 10
These values demonstrate that the amount of radioactivity that would be
released to the environment in the event of a loss-of-coolant accident give
dose values that are substantially less than the guidelines specified in 10
CFR 100.
Several parameter studies were performed in order to indicate the change in
thyroid dose values that would result in the event of a deviation in an
original assumption. For example, it was found that the doses remain almost
unaffected in case of filter unit fan failure after a brief period of time.
The above given dose values were based on two filter units operating
continuously for the duration of the accident. The principal cleanup occurs
within the first two hours; in fact, within this period of time the iodine
concentration will be reduced to less than 2% of the original concentration.
14F-6 Rev. 10 7/92
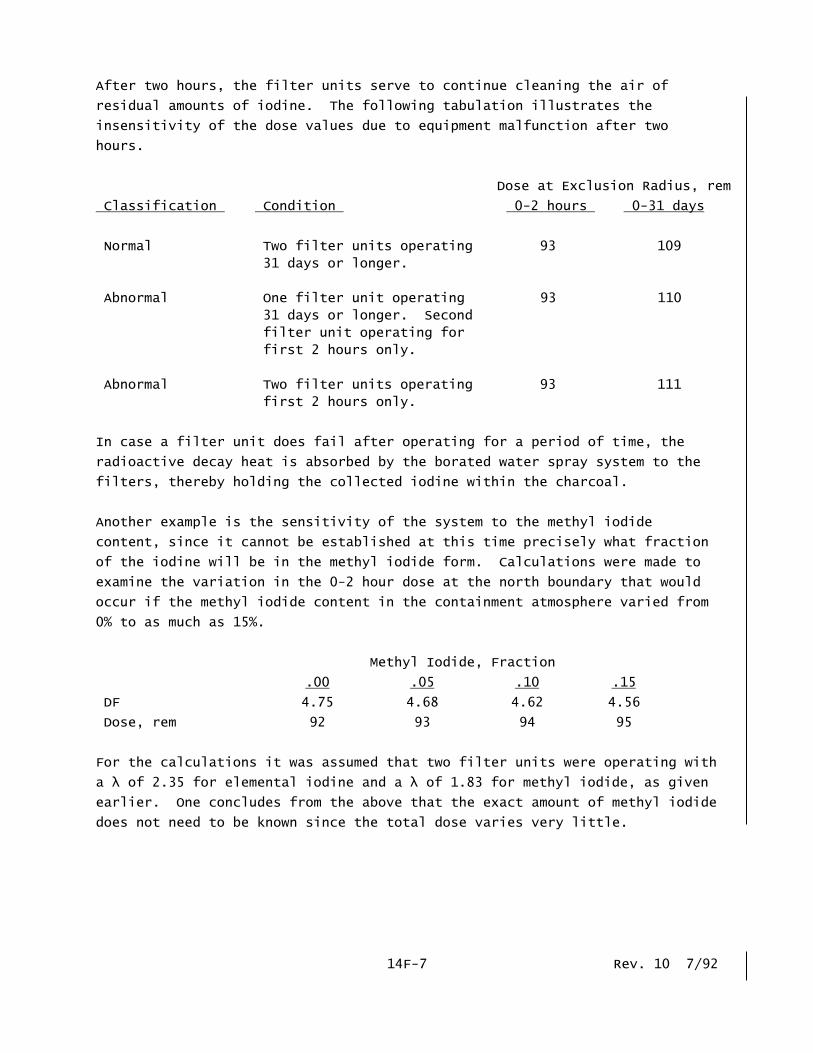
After two hours, the filter units serve to continue cleaning the air of
residual amounts of iodine. The following tabulation illustrates the
insensitivity of the dose values due to equipment malfunction after two
hours.
Dose at Exclusion Radius, rem
Classification Condition 0-2 hours 0-31 days
Normal Two filter units operating 93 109
31 days or longer.
Abnormal One filter unit operating 93 110
31 days or longer. Second
filter unit operating for
first 2 hours only.
Abnormal Two filter units operating 93 111
first 2 hours only.
In case a filter unit does fail after operating for a period of time, the
radioactive decay heat is absorbed by the borated water spray system to the
filters, thereby holding the collected iodine within the charcoal.
Another example is the sensitivity of the system to the methyl iodide
content, since it cannot be established at this time precisely what fraction
of the iodine will be in the methyl iodide form. Calculations were made to
examine the variation in the 0-2 hour dose at the north boundary that would
occur if the methyl iodide content in the containment atmosphere varied from
0% to as much as 15%.
Methyl Iodide, Fraction
.00 .05 .10 .15
DF 4.75 4.68 4.62 4.56
Dose, rem 92 93 94 95
For the calculations it was assumed that two filter units were operating with
a λ of 2.35 for elemental iodine and a λ of 1.83 for methyl iodide, as given
earlier. One concludes from the above that the exact amount of methyl iodide
does not need to be known since the total dose varies very little.
14F-7 Rev. 10 7/92
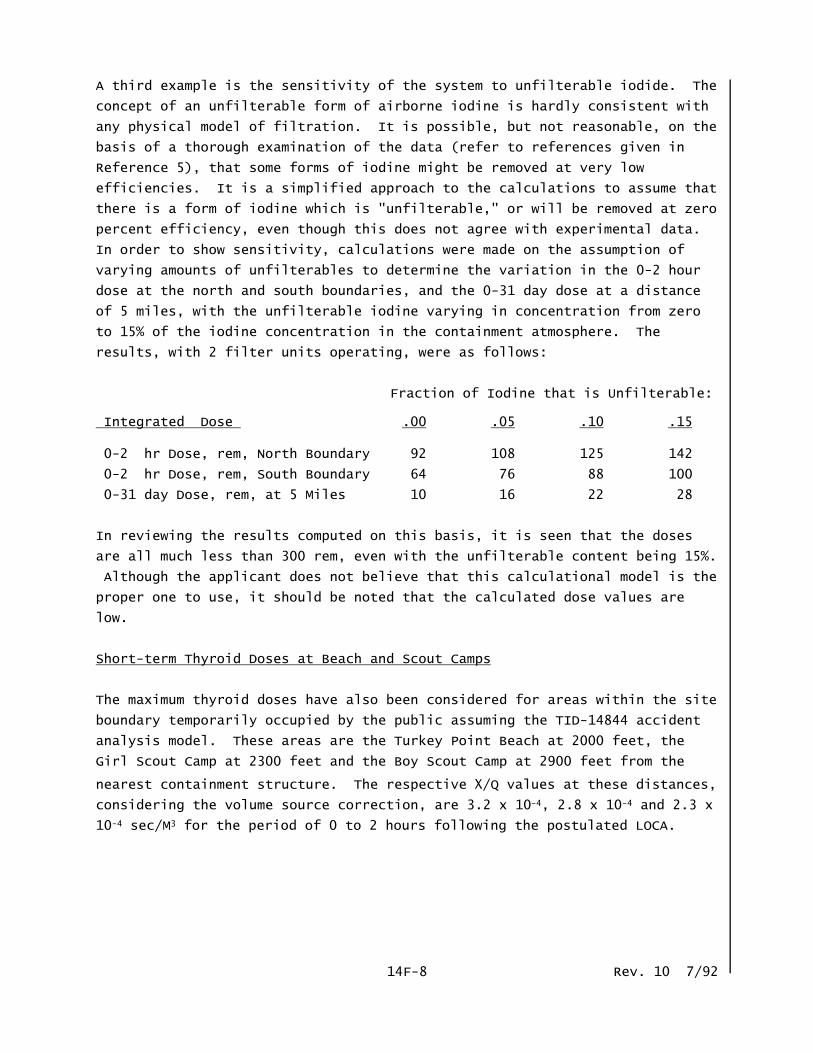
A third example is the sensitivity of the system to unfilterable iodide. The
concept of an unfilterable form of airborne iodine is hardly consistent with
any physical model of filtration. It is possible, but not reasonable, on the
basis of a thorough examination of the data (refer to references given in
Reference 5), that some forms of iodine might be removed at very low
efficiencies. It is a simplified approach to the calculations to assume that
there is a form of iodine which is "unfilterable," or will be removed at zero
percent efficiency, even though this does not agree with experimental data.
In order to show sensitivity, calculations were made on the assumption of
varying amounts of unfilterables to determine the variation in the 0-2 hour
dose at the north and south boundaries, and the 0-31 day dose at a distance
of 5 miles, with the unfilterable iodine varying in concentration from zero
to 15% of the iodine concentration in the containment atmosphere. The
results, with 2 filter units operating, were as follows:
Fraction of Iodine that is Unfilterable:
Integrated Dose .00 .05 .10 .15 0-2 hr Dose, rem, North Boundary 92 108 125 142
0-2 hr Dose, rem, South Boundary 64 76 88 100
0-31 day Dose, rem, at 5 Miles 10 16 22 28
In reviewing the results computed on this basis, it is seen that the doses
are all much less than 300 rem, even with the unfilterable content being 15%.
Although the applicant does not believe that this calculational model is the
proper one to use, it should be noted that the calculated dose values are
low.
Short-term Thyroid Doses at Beach and Scout Camps
The maximum thyroid doses have also been considered for areas within the site
boundary temporarily occupied by the public assuming the TID-14844 accident
analysis model. These areas are the Turkey Point Beach at 2000 feet, the
Girl Scout Camp at 2300 feet and the Boy Scout Camp at 2900 feet from the
nearest containment structure. The respective χ/Q values at these distances,
considering the volume source correction, are 3.2 x 10⁻⁴, 2.8 x 10⁻⁴ and 2.3 x
10-4 sec/M3 for the period of 0 to 2 hours following the postulated LOCA.
14F-8 Rev. 10 7/92

By selection of a very conservative value of 59 psig maximum containment
pressure for the leakage driving function over the entire initial two hours,
the effective maximum containment leak rate is 0.25% / day. The resultant
maximum two hour thyroid dose at the indicated locations, generated from an
initial 95% elemental iodine and 5% methyl iodide atmospheric constituency,
are:
Turkey Point Beach 190 rem
Girl Scout Camp 170 rem
Boy Scout Camp 138 rem
These values point out the requirement for the site evacuation procedure to
be implemented within the initial 2 hour period, which will be provided and
followed.
Whole Body Dose Computations
Whole body doses resulting from the accident were also computed. The major
contribution is the dose from immersion in the plume. The direct radiation
dose from the containment is insignificant due to the shielding provided by
its walls.
Direct doses were calculated assuming immersion in a semi-infinite cloud
containing a uniform distribution of the gas isotopes which have leaked from
the containment. Cloud concentrations assumed were those actually calculated
at the centerline of the plume.
The following whole body doses from the passing cloud were computed:
North Boundary South Low Population
Exclusion Radius Boundary Distance
Integrated Dose 4164 ft 5582 ft 5 miles 0-2 hour dose, rem 3.1 2.2 0.4
0-31 day dose, rem 5.2 3.5 0.6
These values are small compared to the guidelines specified in 10 CFR 100.
14F-9 Rev. 10 7/92
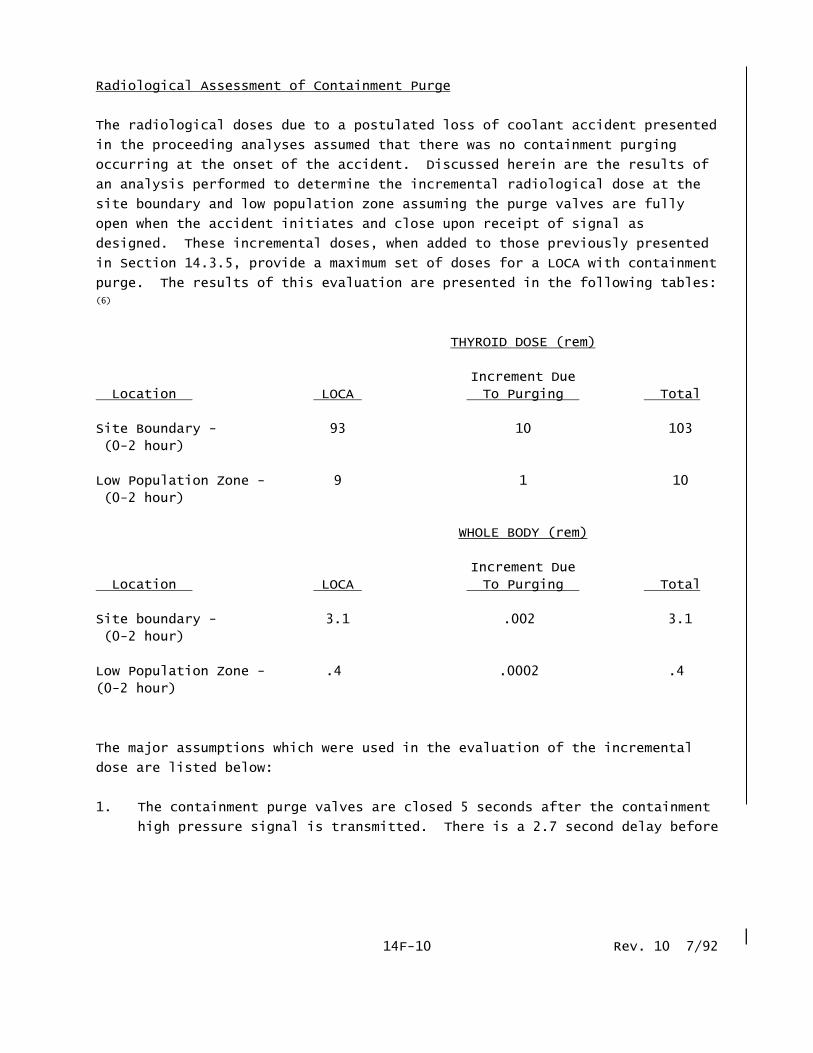
Radiological Assessment of Containment Purge
The radiological doses due to a postulated loss of coolant accident presented
in the proceeding analyses assumed that there was no containment purging
occurring at the onset of the accident. Discussed herein are the results of
an analysis performed to determine the incremental radiological dose at the
site boundary and low population zone assuming the purge valves are fully
open when the accident initiates and close upon receipt of signal as
designed. These incremental doses, when added to those previously presented
in Section 14.3.5, provide a maximum set of doses for a LOCA with containment
purge. The results of this evaluation are presented in the following tables: (6)
THYROID DOSE (rem)
Increment Due
Location LOCA To Purging Total
Site Boundary - 93 10 103
(0-2 hour)
Low Population Zone - 9 1 10
(0-2 hour)
WHOLE BODY (rem)
Increment Due
Location LOCA To Purging Total
Site boundary - 3.1 .002 3.1
(0-2 hour)
Low Population Zone - .4 .0002 .4
(0-2 hour)
The major assumptions which were used in the evaluation of the incremental
dose are listed below:
1. The containment purge valves are closed 5 seconds after the containment
high pressure signal is transmitted. There is a 2.7 second delay before
14F-10 Rev. 10 7/92
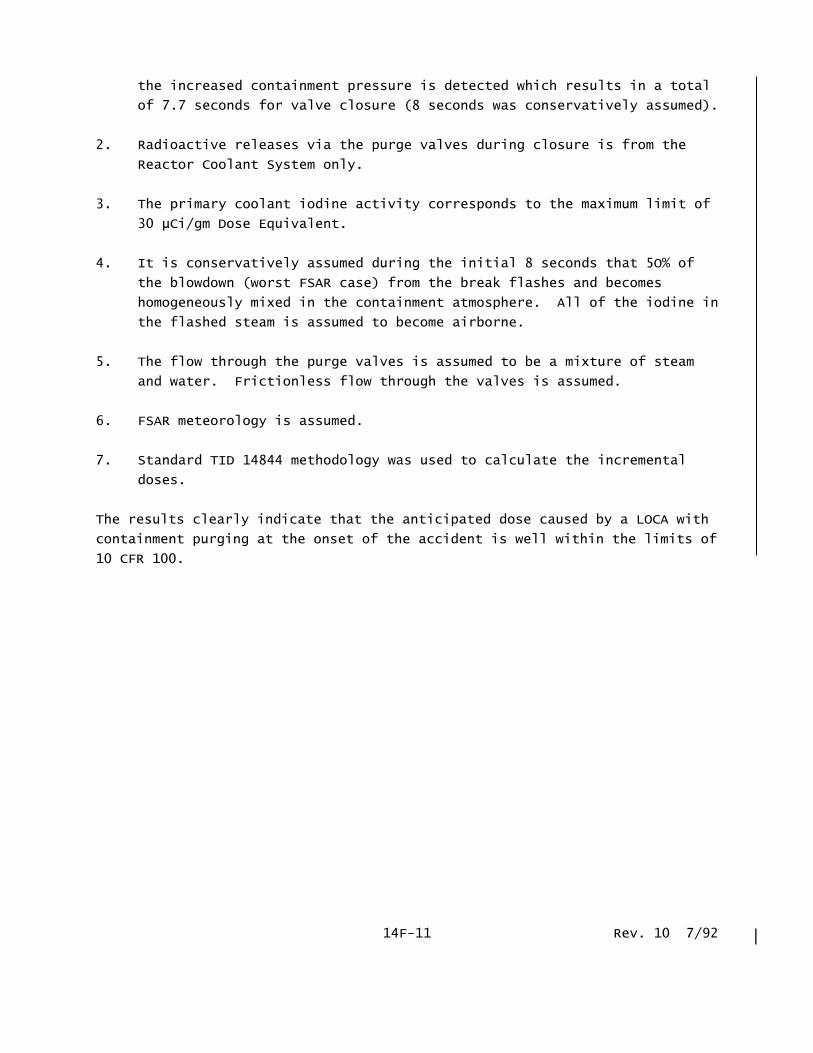
the increased containment pressure is detected which results in a total
of 7.7 seconds for valve closure (8 seconds was conservatively assumed).
2. Radioactive releases via the purge valves during closure is from the
Reactor Coolant System only.
3. The primary coolant iodine activity corresponds to the maximum limit of
30 μCi/gm Dose Equivalent.
4. It is conservatively assumed during the initial 8 seconds that 5O% of
the blowdown (worst FSAR case) from the break flashes and becomes
homogeneously mixed in the containment atmosphere. All of the iodine in
the flashed steam is assumed to become airborne.
5. The flow through the purge valves is assumed to be a mixture of steam
and water. Frictionless flow through the valves is assumed.
6. FSAR meteorology is assumed.
7. Standard TID 14844 methodology was used to calculate the incremental
doses.
The results clearly indicate that the anticipated dose caused by a LOCA with
containment purging at the onset of the accident is well within the limits of
10 CFR 100.
14F-11 Rev. 10 7/92
References
1. J. J. DiNunno, F. D. Anderson, R. E. Baker, and R. L. Waterfield, Calculation of Distance Factors for Power and Test Reactor Sites, USAEC Report TID-14844, March 23, 1961.
2. Supplemental Safety Evaluations by the Division of Reactor Licensing,
United States Atomic Energy Commission, in the Matter of Florida Power and Light Company, Turkey Point Units 3 & 4, July 12, 1968.
3. Nuclear Safety Program Annual Progress Report for Period Ending December
31, 1967, Oak Ridge National Laboratory, ORNL-4228, April 1968. 4. W. F. Hilsmeier and F. A. Gifford, Jr., Graphs for Estimating
Atmospheric Dispersion, Report ORO-545, Weather Bureau Research Station, Oak Ridge, Tenn., August 23, 1962.
5. Supplement No. 14 to Application for Licenses, re Florida Power & Light
Company, Turkey Point Units 3 & 4, USAEC Docket Nos. 50-250, 50-251, March 14, 1968.
6. R. E. Uhrig (FPL) letter #L-79-346, to A. Schwencer (NRC), dated
December 13, 1979, "Containment Purge". 14F-12 Rev. 10 7/92

TABLE 14F-1 IODINE ISOTOPES AND THEIR ESTIMATED QUANTITIES FOR A FULL CORE INVENTORY AT TIME ZERO Isotope Half-Life Grams Curies I-127 Stable 2,040 0 I-129 1.72 x 10⁷ years 8,170 ~ 0 I-131 8.05 days 452 57.7 x 10⁶ I-132 2.4 hours 8.25 87.5 x 10⁶ I-133 20.8 hours 109.7 129.5 x 10⁶ I-134 52.5 minutes 5.35 151.3 x 10⁶ I-135 6.68 hours 31.9 117.2 x 10⁶ Lumping all radioactive isotopes
into an I-131 equivalent ≈109 x 106 Rev. 10 7/92

TABLE 14F-2 NOBLE GAS ISOTOPES AND THEIR ESTIMATED QUANTITIES FOR A FULL CORE INVENTORY AT TIME ZERO Isotope Half-Life Curies Kr-83m 114 minutes 10.6 x 10⁶ Kr-85 10.76 Years 0.83 x 10⁶ Kr-85m 4.36 hours 25.5 x 10⁶ Kr-87 78 minutes 47.3 x 10⁶ Kr-88 2.77 hours 64.3 x 10⁶ Xe-131m 12.0 days 0.46 x 10⁶ Xe-133m 2.3 days 3.08 x 10⁶ Xe-133 5.27 days 128.4 x 10⁶ Xe-135m 15.6 minutes 41.5 x 10⁶ Xe-135 9.13 hours 32.0 x 10⁶ Rev. 10 7/92

TABLE 14F-3 EQUATION FOR REMOVAL CONSTANT λ = n v e m 60 V λ = removal constant, per hour n = number of filter units operating v = atmosphere flow through each filter unit, cu ft/min e = charcoal filter efficiency, fraction m = atmosphere mixing factor, fraction V = free volume of containment, cu ft Elemental iodine Methyl iodide a b v 37,500 37,500 e 0.9 0.7 m 0.9 0.9 v 1.55 x 10⁶ 1.55 x 10⁶ Rev. 10 7/92
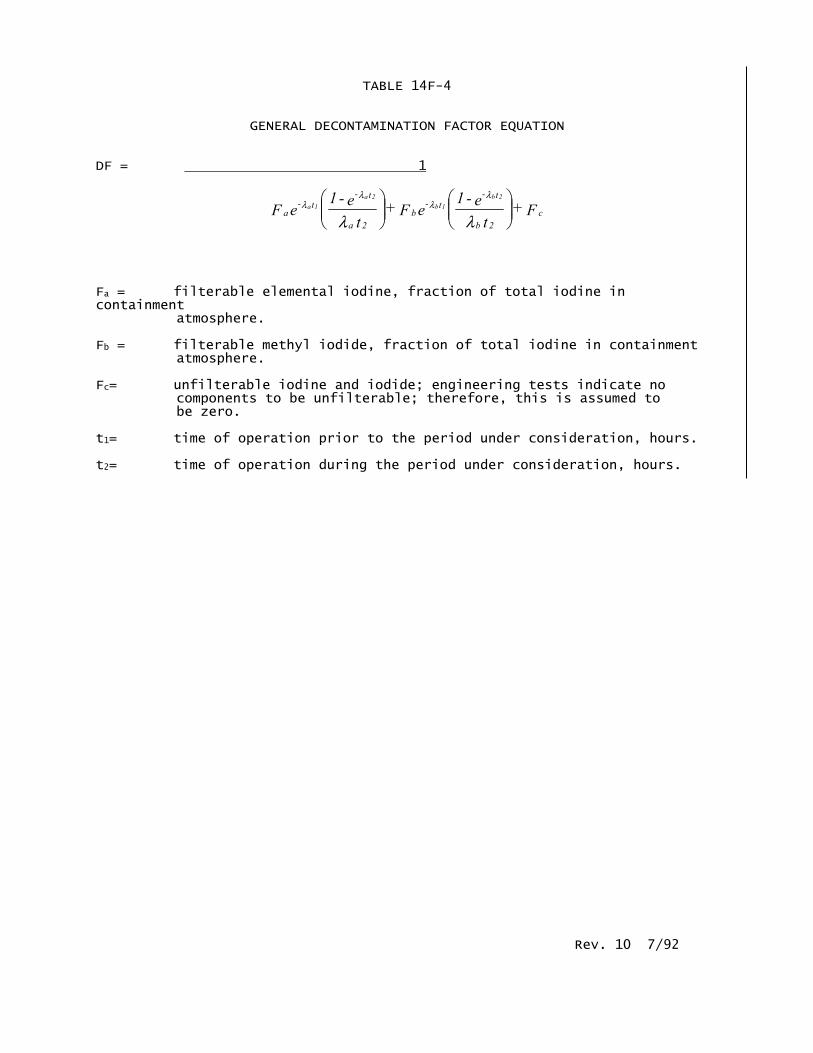
TABLE 14F-4 GENERAL DECONTAMINATION FACTOR EQUATION DF = 1
Fa = filterable elemental iodine, fraction of total iodine in containment atmosphere. Fb = filterable methyl iodide, fraction of total iodine in containment atmosphere. Fc= unfilterable iodine and iodide; engineering tests indicate no components to be unfilterable; therefore, this is assumed to be zero. t1= time of operation prior to the period under consideration, hours. t2= time of operation during the period under consideration, hours. Rev. 10 7/92
F + t
e - 1 eF + t
e - 1 eF c2b
t-t-
b2a
t-t-
a
2b1b
2a1a
λλ
λλ
λλ

TABLE 14F-5 DILUTION MULTIPLIER EQUATIONS Time period
X = concentration, curies/cu. meter
Q = source strength, curies/second
� = average wind speed, meters/second
�i = wind speed for condition i, meters/second
σy= horizontal dispersion parameter, meters
σz= vertical dispersion parameter, meters
σzi= vertical dispersion parameter for condition i, meters
c = building shape factor (selected as 0.5)
A = cross-sectional area of building normal to wind (1750 sq meters)
β = sector size, radians
x = distance from source, meters
f = fraction of time wind blows in sector
Fi= fraction of time condition i exists
Rev. 10 7/92
0-2 hours cA) + (
1 = Q
zy σσπμ
χ
2-12 hours x /2
1 = Q
zσπμβ
χ
12 hours - 31 days x /2
F f = Q
zi
i
iσπμβχ

TABLE 14F-6
METEOROLOGICAL CONDITIONS
Time period Condition
0-2 hours Stability category, Pasquill F;
Wind speed, 2 meters/sec;
Wind direction, unvarying.
2-12 hours Stability category, Pasquill F;
Wind speed, 2 meters/sec;
Wind direction,10 degree sector.
12 hours - 31 days Wind direction, 22.5 degree sector;
Wind blowing in this sector 25% of
the time with the following
variable conditions:
Stability Wind speed
Fraction category meters/sec
.25 F 2
.50 D 5
.25 C 4
Rev. 10 7/92
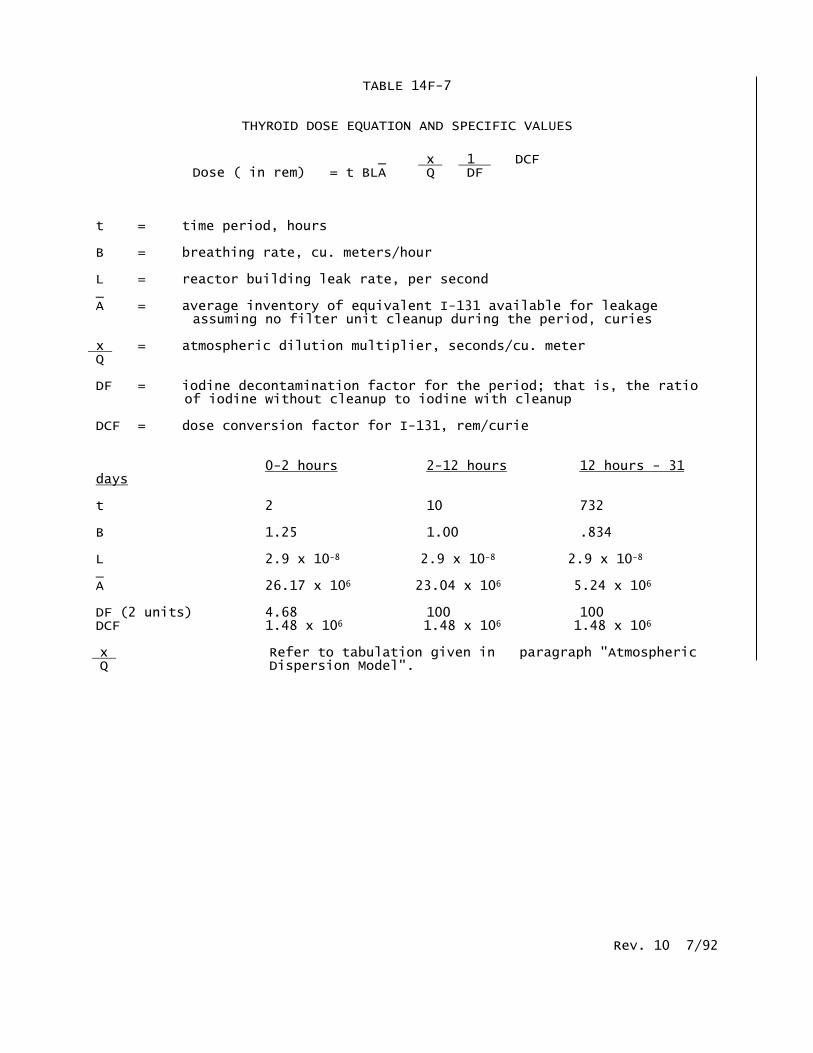
TABLE 14F-7
THYROID DOSE EQUATION AND SPECIFIC VALUES
_ x 1 DCF Dose ( in rem) = t BLA Q DF
t = time period, hours B = breathing rate, cu. meters/hour L = reactor building leak rate, per second _ A = average inventory of equivalent I-131 available for leakage assuming no filter unit cleanup during the period, curies
x = atmospheric dilution multiplier, seconds/cu. meter Q DF = iodine decontamination factor for the period; that is, the ratio of iodine without cleanup to iodine with cleanup DCF = dose conversion factor for I-131, rem/curie 0-2 hours 2-12 hours 12 hours - 31 days t 2 10 732 B 1.25 1.00 .834 L 2.9 x 10⁻⁸ 2.9 x 10⁻⁸ 2.9 x 10⁻⁸ _ A 26.17 x 10⁶ 23.04 x 10⁶ 5.24 x 10⁶ DF (2 units) 4.68 100 100 DCF 1.48 x 10⁶ 1.48 x 10⁶ 1.48 x 10⁶
x Refer to tabulation given in paragraph "Atmospheric Q Dispersion Model". Rev. 10 7/92

APPENDIX 14G HISTORICAL DISCUSSION OF CONTAINMENT PRESSURE TRANSIENT MARGINS
ASSOCIATED WITH CONTAINMENT STRUCTURAL PRESSURE OF 59 PSIG
INTRODUCTION
This appendix contains the original FSAR discussion of the containment design
pressure margins associated with the original containment structural
capability pressure of 59 psig. Since the original containment structural
capability pressure of 59 psig has been replaced with the licensed design
basis pressure (55 psig) approved by the Atomic Energy Commission (AEC)
during the operating license stage, this discussion is of historical
importance only and does not apply to the current licensed containment design
pressure or to the basis for calculating the minimum required prestress
forces for the containment post-tensioning system. Refer to the engineering
evaluation contained in Reference 1.
BACKGROUND
The licensed containment design basis pressure of 55 psig was established
during the very early stages of plant licensing and has carried through to
current licensing documents. The PSAR and FSAR indicated that a 55 psig
reference containment design pressure was conservatively established for the
design basis (29-inch double-ended pipe break) loss-of-coolant accident
(LOCA), based on a 49.9 psig calculated peak pressure plus a 10% safety
margin; and the structural proof test was conducted at 115% design pressure
to check structural integrity. Refer to PSAR Sections 5.4.1.a and 12.2.3
(Reference 2), and to original (1970) FSAR Section 5.1.1, (Reference 3).
Other LOCA study cases, assuming partial safeguards availability, were also
considered. These study cases did not constitute licensed design basis
accident scenarios, but rather provided an indication of potential
containment performance requirements beyond-the-licensing-basis for purposes
of establishing conservative design margins for the containment structures.
14G-1 Rev. 11 11/93
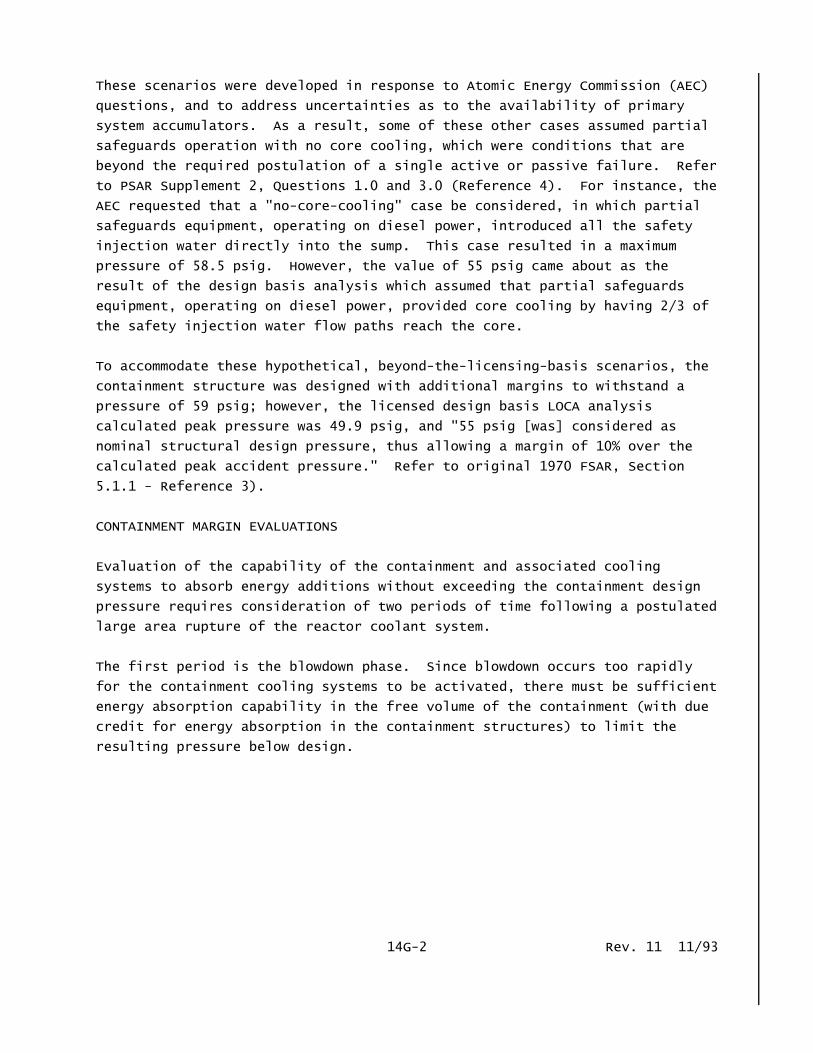
These scenarios were developed in response to Atomic Energy Commission (AEC)
questions, and to address uncertainties as to the availability of primary
system accumulators. As a result, some of these other cases assumed partial
safeguards operation with no core cooling, which were conditions that are
beyond the required postulation of a single active or passive failure. Refer
to PSAR Supplement 2, Questions 1.0 and 3.0 (Reference 4). For instance, the
AEC requested that a "no-core-cooling" case be considered, in which partial
safeguards equipment, operating on diesel power, introduced all the safety
injection water directly into the sump. This case resulted in a maximum
pressure of 58.5 psig. However, the value of 55 psig came about as the
result of the design basis analysis which assumed that partial safeguards
equipment, operating on diesel power, provided core cooling by having 2/3 of
the safety injection water flow paths reach the core.
To accommodate these hypothetical, beyond-the-licensing-basis scenarios, the
containment structure was designed with additional margins to withstand a
pressure of 59 psig; however, the licensed design basis LOCA analysis
calculated peak pressure was 49.9 psig, and "55 psig [was] considered as
nominal structural design pressure, thus allowing a margin of 10% over the
calculated peak accident pressure." Refer to original 1970 FSAR, Section
5.1.1 - Reference 3).
CONTAINMENT MARGIN EVALUATIONS
Evaluation of the capability of the containment and associated cooling
systems to absorb energy additions without exceeding the containment design
pressure requires consideration of two periods of time following a postulated
large area rupture of the reactor coolant system.
The first period is the blowdown phase. Since blowdown occurs too rapidly
for the containment cooling systems to be activated, there must be sufficient
energy absorption capability in the free volume of the containment (with due
credit for energy absorption in the containment structures) to limit the
resulting pressure below design.
14G-2 Rev. 11 11/93

The second period is the post-blowdown period where the containment cooling
systems must be able to absorb any postulated post-blowdown energy additions
and continue to limit the containment pressure below design.
Margin - Blowdown Peak to Design Pressure
Point A in Figure 14G-1 corresponds to the internal energy at the end of a DE
break blowdown, 195 x 106 Btu. In order for the pressure to increase to
design pressure (59 psig) the internal energy must be increased to 231 x 106
Btu (Point B). The allowed energy addition is therefore 36 x 106 Btu. Since
energy transferred to the containment from the core is in the form of steam
the total transferred core energy corresponding to allowed energy addition is
as follows:
hfg 921.9
Qcore = Qallowed = 36 x 106 x = 28.4 x 10⁶ Btu hg 1177.6 This allowable value of energy which could be transferred from the core to
the containment without increasing the transient containment pressure to
design pressure can be compared to the energy stored in the reactor vessel
and transferred to the steam generator during blowdown for the double ended
break. The thick metal of the reactor vessel was not considered since a
negligible amount of this energy can be transferred in the short blowdown
time.
Stored in the core 15.0 x 10⁶ Btu
Core internals Metal 0.3 x 10⁶ Btu
Transferred to Steam Generators 1.4 x 10⁶ Btu
16.7 x 10⁶ Btu
Thus, the containment has the capability to limit containment pressure below
design even if all of the available energy sources were transferred to the
containment at the end of blowdown. This would also include no credit for
14G-3 Rev. 11 11/93
energy absorption in the steam generator. For this to occur an extremely
high core to coolant heat transfer coefficient is necessary. This would
result in the core and internals being completely subcooled and limit the
potential for release of fission products.
Additional Energy Added as Superheat
Line A to C on Figure 14G-1 represents a constant mass line extended into the
superheated region. Comparison of the energy addition allowable for the
superheated case relative to the saturated case shows a lesser ability of the
containment to absorb an equivalent amount of energy as superheat. An
addition of 8.5 x 10⁶ Btu of energy after blowdown would cause the
containment pressure to increase to design. The recombination of hydrogen
and oxygen from 9.6% Zr-H2O reaction completed before the end of blowdown
would be required to generate 8.5 x 10⁶ Btu's of energy. For the case
analyzed, the core was assumed to be in a subcooled state, and no Zr-H2O
reaction would be possible. In order for Zr-H2O reaction to occur before the
end of blowdown all of the stored initial energy must remain in the core. If
this occurred a blowdown peak containment pressure of only 44.2 psig would be
reached instead of 49.9 psig in the case analyzed. Lines D and E on Figure
14G-1 represent the superheat energy addition required to increase the
pressure to the design pressure and this corresponds to the hydrogen oxygen
recombination energy from a 15.8% Zr-H2O reaction.
It is, therefore, concluded that the containment has the capability to absorb
the maximum energy addition from any loss-of-coolant accident without
reliance on the containment cooling system. In addition, a substantial
margin exists for energy additions from arbitrary energy sources much greater
than any possible.
Margin - Post Blowdown Energy Additions
The Safety Injection System is designed to rapidly cool the core and stop
significant addition of mass and energy to the containment.
14G-4 Rev. 11 11/93

However, the following cases are presented to demonstrate the capability of
the containment to withstand post accident energy additions without credit
for core cooling.
Case 1 : Blowdown from a large area rupture with continued addition of the
core residual energy and hot metal energy to the containment as
steam.
Case 2 : Same as Case I but with the energy addition from a maximum
Zirconium - water reaction.
Figure 14G-2 presents the containment pressure transient for Case 1. For
this case the decay heat generated for a 2300 MWt core operated for an
infinite time is conservatively assumed. This decay heat is added to the
containment in the form of steam by the boiling off of water in the reactor
vessel. For this case injection water merely serves as a mechanism to
transfer the residual energy to the containment as it is produced. Injection
water is in effect throttled at the required rate.
In addition, all the stored energy in the core and internals which is
calculated to remain at the end of blow down is added in the same way during
the time interval between 12.7 and 36.5 seconds (corresponds to accumulator
injection time). Also all the sensible heat of the reactor vessel is added
as steam exponentially over 2000 seconds time interval.
The containment cooling system capability assumed in the analysis was one of
two available containment spray pumps and two of three available emergency
containment coolers. This is the minimum equipment available considering the
single failure criterion in the emergency power system, the containment spray
system and the fan cooler system.
The containment heat removal capability started at 60 seconds exceeds the
energy addition rate and the pressure does not exceed the initial blowdown
value. An extended depressurization time results due to the increased heat
load on the containment coolers.
14G-5 Rev. 11 11/93
It should be emphasized that this situation is highly unrealistic in that
continued addition of steam to the containment after blowdown could not
occur. The accumulator and Safety Injection System acts to rapidly reflood
and cool the core.
Figure 14G-3 presents the containment pressure transient for Case 2. To
realistically account for the energy necessary to cause a metal-water
reaction, sufficient energy must be stored in the core. Storing the energy
in the core rather than transferring it to the coolant causes a decrease in
the blowdown peak.
The reaction was calculated using the parabolic rate equation developed by
Baker and assuming that the clad continues to react until zirconium oxide
melting temperature of 4800oF is reached. An additional 10% reaction of the
unreacted clad is assumed when the oxide melting temperature is reached. A
total reaction of 32.3% has occurred after 1000 seconds. If the reactions
were to be steam limited, they could result in a higher total reaction but at
a much later time. The reaction provided by the parabolic rate equation
therefore, imposes the greatest load on the containment cooling system.
As in Case 2, the residual heat and sensible heat is added to the containment
as steam. The energy from the Zr-H2O reaction is added to the containment as
it is produced. The hydrogen was assumed to burn as it entered the
containment from the break.
The blowdown peak was reduced to 44 psig and a peak pressure of 57.7 psig was
reached at 600 seconds. At this time the heat removal capability of the
containment cooling system assumed to be operating (one containment spray
pump and two fan coolers) exceeded the energy addition from all sources.
For comparison the containment pressure transients for Cases 1, 2 and the
double ended blowdown are replotted in Figure 14G-4. It is concluded that
operation of the minimum containment cooling system equipment provides the
capability of limiting the containment pressure below its design pressure
with the addition of all available energy sources and without credit for the
cooling effect from the safety injection system.
14G-6 Rev. 11 11/93

DISCUSSION OF ENERGY SOURCES USED IN CASES 1 AND 2
The following is a summary of the energy sources and the containment heat
removal capacities used in the containment capability study. Figure 14G-5
presents the rate of energy addition from core decay heat, Zr-H2O reaction
energy, and the hydrogen-oxygen recombination energy. The heat removal
capability for the partial containment cooling (one spray pump and two fan
coolers) is also presented. These heat removal values are for operation with
the containment at design pressure.
The integrated heat additions and heat removals for Cases 1 and 2 are plotted
in Figures 14G-6 and 14G-7, respectively. These curves are presented in a
manner that demonstrates the capability of the containment and the cooling
systems to absorb energy. The integrated heat removal capacity is started at
the internal energy corresponding to design pressure, while the integrated
heat additions begin from the internal energy calculated at the end of
blowdown for each case. The upper line on each curve is the containment
structures and containment cooling systems capability to absorb energy
additions without exceeding design pressure. The lower curve for each are
the energy addition curves, and since these energy additions are the maximum
possible with no credit for core cooling, there is more than adequate
capability to absorb arbitrary additions.
The curves in Figures 14G-8 and 14G-9 present the individual contribution of
the heat removal and heat addition source, respectively.
14G-7 Rev. 11 11/93
REFERENCES
1. Engineering Evaluation JPN-PTN-SENP-93-008,"No Significant Hazards
Evaluation Related to Containment Design Pressure Technical
Specification and UFSAR Changes," Revision 0, dated April 23, 1993.
2. Turkey Point Units 3 and 4 Preliminary Safety Analysis Report (PSAR),
Sections 5.4.1.a and 12.2.3, submitted by Application dated March 22,
1966.
3. Turkey Point Units 3 and 4 (original) Final Safety Analysis Report
(FSAR), Section 5.1.1, "Containment Structure Design Bases," Revision
4, dated August 12, 1970.
14G-8 Revised 05/14/2005