appendix 1 - oikos file2 table a2. thermal information for algal species observed on salt spring...
TRANSCRIPT

OIK-00806 Kordas, R. L., Dudgeon, S., Storey, S., and Harley, C. D. G. 2014. Intertidal community responses to field-based experimental warming. – Oikos doi: 10.1111/oik.00806
Appendix 1 Table A1. Thermal information for invertebrate species observed on Salt Spring Island, BC. Species name refers to the species identified in Salt Spring plots. If thermal information was unavailable for that species, information for a congeneric from same region is provided (species in parentheses). Response types were defined as; optimum - the temperature where a functional trait is maximized; critical - the mean temperature at which individuals lose some essential function (e.g. growth); lethal - temperature where a predefined percentage of individuals die after a fixed duration of exposure (e.g., LT50). Population refers to the location where individuals were collected for temperature experiments in the referenced study. Distribution and zonation information retrieved from (Invertebrates of the Salish Sea, EOL) or reference listed in entry below. Other abbreviations are: n/g - not given in paper, n/d - no data for this species (or congeneric from the same geographic region).
Invertebrate species Response Type Temp. (°C)
Medium Exposure time
Population Zone NE Pacific Distribution Reference
Amphipods (Gammaridea)
n/d for NE Pacific spp
low-high
many spp. worldwide
Balanus glandula max HSP production
critical
33
air
8.5 hrs
Charleston, OR
high N. Baja – Aleutian Is, AK
Berger and Emlet 2007
survival lethal 44 air 3 hrs Vancouver, BC Liao & Harley unpub Chthamalus dalli cirri beating optimum 28 water 1hr/ 5°C Puget Sound, WA high S. CA – S. Alaska Southward and Southward 1967
cirri beating lethal 35 water 1hr/ 5°C survival lethal 46 air 3 hrs Vancouver, BC Liao & Harley unpub
Emplectonema gracile n/d low-mid
Chile – Aleutian Islands, AK
Littorina plena n/d high Baja – S. Alaska
Littorina scutulata n/d high Baja – S. Alaska Lottia digitalis survival lethal 38-39 water 15 min Bodega Bay, CA high Pigeon Pt, CA – Aleutian
Is, AK Wolcott 1973
survival lethal 43-44 air 15min/ 2°C Lottia paradigitalis n/d high Pt. Conception, CA – S.
Alaska
Lottia pelta survival lethal 34-35 water 15 min Bodega Bay, CA low-mid
Baja – S. Alaska Wolcott 1973 survival lethal 39-40 air 15min/ 2°C
Lottia scutum survival lethal 35-36 water 15 min Bodega Bay, CA low-mid
Pt. Conception, CA – Bering Sea
Wolcott 1973 survival lethal 40-41 air 15min/ 2°C

2
Table A2. Thermal information for algal species observed on Salt Spring Island. Refer to Table A1 caption for description of terms.
Algal Species Morphology Response Type Temp. (°C)
Medium Exposure time
Population Intertidal Zone
Distribution Reference
Acrosiphonia spp. (A. arcta)
prostrate branches
growth optimum 15 water 35 days San Juan Island, WA
low-mid Oregon – Bering Sea Bischoff and Wiencke 1995b growth critical 20 water 35 days
survival lethal 22-23 water 14 days Analipus japonicus semi-upright
branches survival lethal 25 water 7 days San Juan Island,
WA low-mid Pt. Conception, CA –
Aleutian Islands, AK Lüning and Freshwater 1988
Colpomenia peregrina upright, globular
growth optimum 10-25 n/g Mediterranean Sea
low S. California – Aleutian Islands, AK
Orfanidis 1993
Fucus distichus (F. gardneri)
semi-upright blades
survival lethal 23 water 7 days San Juan Island, WA
low-high Cen. California – Arctic Ocean
Lüning and Freshwater 1988
Halosaccion glandiforme (H. americanum)
upright sac-like
survival lethal 18 water 7 days San Juan Island, WA
low-mid Pt. Conception, CA – Aleutian Islands, AK
Lüning and Freshwater 1988
Hildenbrandia rubra crust photosyn. reduced 27 water 24 hrs Nova Scotia low-high Panama – Aleutian Islands, AK
Kim and Garbary 2006
Mastocarpus papillatus upright blades / crust
survival
lethal
25-28
water
7 days
San Juan Island, WA
mid-high N. California – Aleutian Islands, AK
Lüning and Freshwater 1988
photosyn. critical 30 water 1-2 hrs Hopkins, CA Zupan and West 1990 photosyn. critical 35 air n/g Hopkins, CA Bell 1993
Mazzaella splendens prostrate sheets
n/d low Baja California – Southeast AK
Microcladia borealis prostrate filaments
n/d low-mid San Luis Obispo, CA – Aleutian Islands, AK
Navicula spp. (N. incerta)
prostrate cells growth optimum 11 water 10 days culture: San Francisco, CA
low-mid worldwide Teoh et al. 2012 growth critical 33 water 10 days
Other benthic diatoms prostrate cells low-high many spp. worldwide Petalonia fascia prostrate
blades growth optimum 16 water n/g n/g low-mid Baja California – Arctic
Ocean Hsiao 1970
growth critical 26-31 water n/g Polysiphonia spp. (P. pacifica)
prostrate filaments
n/d low Baja California – Aleutian Islands, AK
Pyropia spp. (P. perforata)
prostrate sheets
photosyn. optimum 29 water 10 min Hopkins, CA mid Baja California – Kodiak Island, AK
Smith and Berry 1986 photosyn. lethal 33 water 10 min
Ulothrix spp. (U. flacca)
prostrate filaments
n/d mid-high S. California – Arctic Ocean
Ulva spp. (U. lactuca)
prostrate sheets
survival lethal 25 water 7 days San Juan Island, WA
Lüning and Freshwater 1988
Urospora spp (U. penicilliformis)
prostrate filaments
growth optimum 5 water 35 days San Juan Island, WA
mid-high Cen. California – S. Alaska
Bischoff and Wiencke 1995a growth critical 20 water 35 days
survival lethal 24 water 14 days

3
Appendix 2 Supplementary methods Rationale for substratum warming During sunny days with calm low tides, organismal body temperatures can exceed air temperatures by 10-15°C (e.g. Denny and Harley 2006). Thus, body temperature provides a more useful proxy for thermal stress than air temperature (Helmuth et al. 2005). For many intertidal organisms, body temperature is tightly tied to the temperature of the substratum because the organismal heat budget is dominated by conduction rather than convection (Denny and Harley 2006). We took advantage of this to raise body temperatures in situ by warming the substratum and thus increasing the amount of heat transferred to an individual via conduction. This method is most appropriate for organisms with a high surface area in contact with the substratum, such as limpets and barnacles (Denny and Harley 2006). In addition, body temperatures of littorine snails more closely match substratum than air temperatures, but can exceed both (McMahon 1990). Experimental heating via conduction is less useful for erect algae such as Mastocarpus papillatus because convection and evaporation are more important to its heat budget (Bell 1995), although tropical seaweeds have surface body temperatures within 0.5-1.5°C of substratum temperatures (Cox and Smith 2011). Conductive heating is likely most important for prostrate algae such as crusts, diatoms, and green filamentous algae during emersion, which have a high surface area in contact with the rock. Settlement plate design Settlement plates (Fig. 1 in main text) were made of 0.56 cm thick black or white High-Density Polyethylene (HDPE) “puckboard”. Each HDPE plate was 15.25 x 15.25 cm with a centered 6.9 x 6.9 cm area of white epoxy (Sea Goin’® Poxy Putty HD; Permalite Plastics) 3 mm thick above the HDPE.
Several holes were drilled in the center of the HDPE plate and the surface was gouged to promote epoxy adherence to the surface, as it otherwise tended to peel up after months of field use. Previous studies have shown that textured detoxified epoxy putty is a good settlement surface for algal zygotes as well as invertebrates such as barnacles (Kordas and Dudgeon 2011). To create a textured settlement surface that was uniform across plates, we pressed a single layer of salt (sieved to 1-2 mm crystal size) into the surface of wet epoxy. Salt crystals were rinsed off after the epoxy set.
The plate design used two plates, the top one where organisms settled, screwed on to a second one, which was bolted into the intertidal rocky bench. This allowed the iButton to be sandwiched between plates (maintaining direct contact with the epoxy surface) and avoided protruding hardware on the settlement surface, which disproportionately encourages settlement (RLK, personal observation). Additional information Previous studies have found that subtidal barnacle settlement and recruitment appear to be higher on dark colored plates (Pomerat and Reiner 1942, Gregg 1945, James and Underwood 1994, Satheesh and Wesley 2010) although some studies have found similar settlement on different colors or rock types (Hurley 1973, Caffey 1982), and Gregg (1945) found that barnacle attachment was the same on surfaces with different black/white contrast. Further, Lathlean and Minchinton (2012) found that settlement (measured daily) of intertidal barnacles was higher on white plates than black plates, despite consistent survivorship and recruitment on both colors. Although it seems that there is variability in barnacle color attraction, most studies to date have found that barnacles are more attracted to black or dark colors. If this is so, our estimates of barnacle abundance (more on white plates) are
4
conservative. Further, the effect of temperature on barnacle vital rates (using this method) is the subject of a forthcoming manuscript.
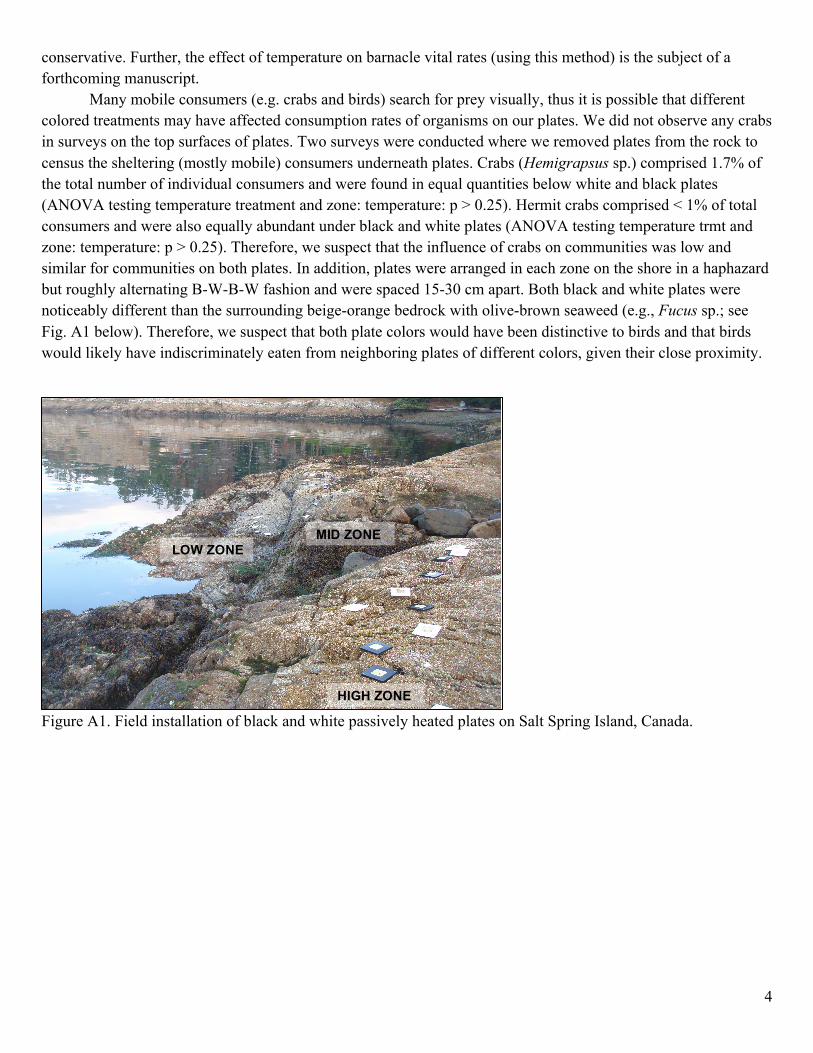
Many mobile consumers (e.g. crabs and birds) search for prey visually, thus it is possible that different colored treatments may have affected consumption rates of organisms on our plates. We did not observe any crabs in surveys on the top surfaces of plates. Two surveys were conducted where we removed plates from the rock to census the sheltering (mostly mobile) consumers underneath plates. Crabs (Hemigrapsus sp.) comprised 1.7% of the total number of individual consumers and were found in equal quantities below white and black plates (ANOVA testing temperature treatment and zone: temperature: p > 0.25). Hermit crabs comprised < 1% of total consumers and were also equally abundant under black and white plates (ANOVA testing temperature trmt and zone: temperature: p > 0.25). Therefore, we suspect that the influence of crabs on communities was low and similar for communities on both plates. In addition, plates were arranged in each zone on the shore in a haphazard but roughly alternating B-W-B-W fashion and were spaced 15-30 cm apart. Both black and white plates were noticeably different than the surrounding beige-orange bedrock with olive-brown seaweed (e.g., Fucus sp.; see Fig. A1 below). Therefore, we suspect that both plate colors would have been distinctive to birds and that birds would likely have indiscriminately eaten from neighboring plates of different colors, given their close proximity.
Figure A1. Field installation of black and white passively heated plates on Salt Spring Island, Canada.
MID ZONE
HIGH ZONE
LOW ZONE
5
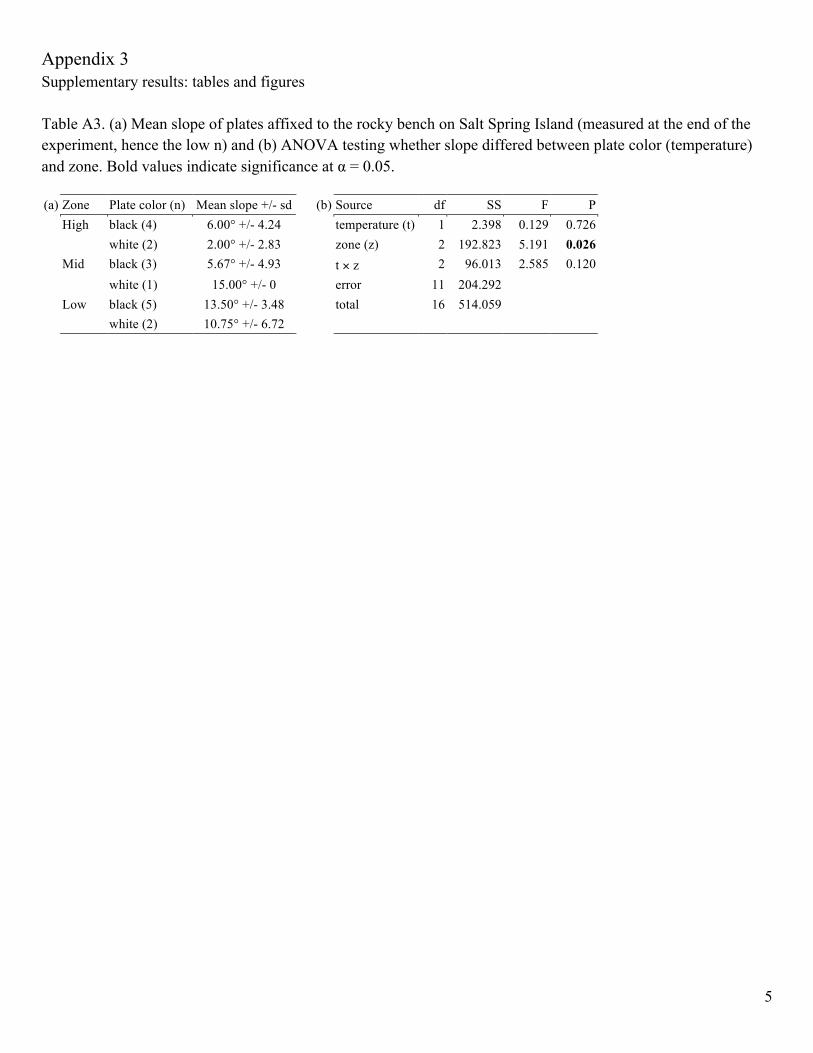
Appendix 3 Supplementary results: tables and figures Table A3. (a) Mean slope of plates affixed to the rocky bench on Salt Spring Island (measured at the end of the experiment, hence the low n) and (b) ANOVA testing whether slope differed between plate color (temperature) and zone. Bold values indicate significance at α = 0.05. (a) Zone Plate color (n) Mean slope +/- sd (b) Source df SS F P High black (4) 6.00° +/- 4.24 temperature (t) 1 2.398 0.129 0.726 white (2) 2.00° +/- 2.83 zone (z) 2 192.823 5.191 0.026 Mid black (3) 5.67° +/- 4.93 t × z 2 96.013 2.585 0.120 white (1) 15.00° +/- 0 error 11 204.292 Low black (5) 13.50° +/- 3.48 total 16 514.059 white (2) 10.75° +/- 6.72

6
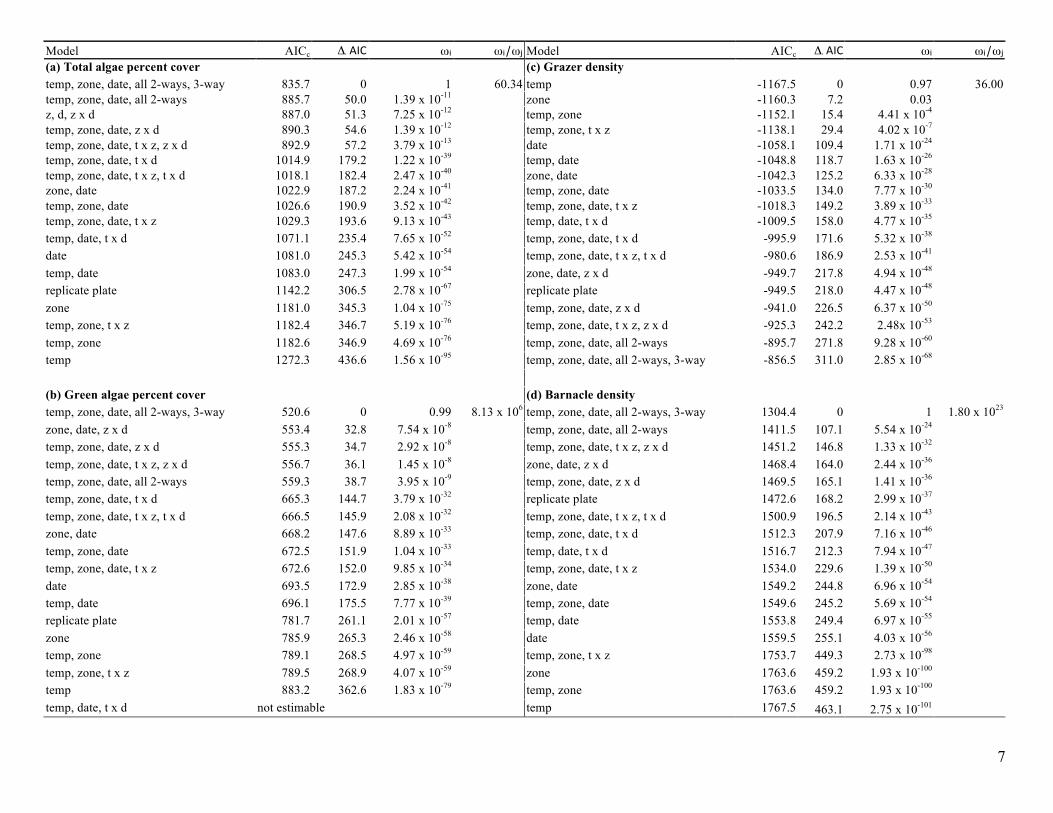
Table A4. (next page) Results from linear mixed effect model analyses. For each functional group response; (a) total algae cover, (b) green algae cover, (c) grazer density, (d) barnacle density, and (e) species richness - all 18 possible models are ranked by the lowest Corrected Akaike information criterion (AICc) score. Akaike weights (wi) were calculated from the differences (Di) between AICc’s for each model and the model with the minimum AICc. The relative likelihood of the best-fitting model to the next best, or any other model(s) was calculated from the evidence ratio of respective model weights (wi/wj). Abbreviations are: (t) temperature treatment, (z) zone, (d) date.
7
Model AICc Δι AIC ωi ωi/ωj Model AICc Δι AIC ωi ωi/ωj (a) Total algae percent cover (c) Grazer density temp, zone, date, all 2-ways, 3-way 835.7 0 1 60.34 temp -1167.5 0 0.97 36.00 temp, zone, date, all 2-ways 885.7 50.0 1.39 x 10⁻¹¹ zone -1160.3 7.2 0.03 z, d, z x d 887.0 51.3 7.25 x 10⁻¹² temp, zone -1152.1 15.4 4.41 x 10⁻⁴ temp, zone, date, z x d 890.3 54.6 1.39 x 10⁻¹² temp, zone, t x z -1138.1 29.4 4.02 x 10⁻⁷ temp, zone, date, t x z, z x d 892.9 57.2 3.79 x 10⁻¹³ date -1058.1 109.4 1.71 x 10⁻²⁴ temp, zone, date, t x d 1014.9 179.2 1.22 x 10-39 temp, date -1048.8 118.7 1.63 x 10⁻²⁶ temp, zone, date, t x z, t x d 1018.1 182.4 2.47 x 10-40 zone, date -1042.3 125.2 6.33 x 10⁻²⁸ zone, date 1022.9 187.2 2.24 x 10-41 temp, zone, date -1033.5 134.0 7.77 x 10⁻³⁰ temp, zone, date 1026.6 190.9 3.52 x 10-42 temp, zone, date, t x z -1018.3 149.2 3.89 x 10⁻³³ temp, zone, date, t x z 1029.3 193.6 9.13 x 10-43 temp, date, t x d -1009.5 158.0 4.77 x 10⁻³⁵ temp, date, t x d 1071.1 235.4 7.65 x 10-52 temp, zone, date, t x d -995.9 171.6 5.32 x 10-38 date 1081.0 245.3 5.42 x 10-54 temp, zone, date, t x z, t x d -980.6 186.9 2.53 x 10-41 temp, date 1083.0 247.3 1.99 x 10-54 zone, date, z x d -949.7 217.8 4.94 x 10-48 replicate plate 1142.2 306.5 2.78 x 10-67 replicate plate -949.5 218.0 4.47 x 10-48 zone 1181.0 345.3 1.04 x 10-75 temp, zone, date, z x d -941.0 226.5 6.37 x 10-50 temp, zone, t x z 1182.4 346.7 5.19 x 10-76 temp, zone, date, t x z, z x d -925.3 242.2 2.48x 10-53 temp, zone 1182.6 346.9 4.69 x 10-76 temp, zone, date, all 2-ways -895.7 271.8 9.28 x 10-60 temp 1272.3 436.6 1.56 x 10-95 temp, zone, date, all 2-ways, 3-way -856.5 311.0 2.85 x 10-68 (b) Green algae percent cover (d) Barnacle density temp, zone, date, all 2-ways, 3-way 520.6 0 0.99 8.13 x 10⁶ temp, zone, date, all 2-ways, 3-way 1304.4 0 1 1.80 x 10²³ zone, date, z x d 553.4 32.8 7.54 x 10⁻⁸ temp, zone, date, all 2-ways 1411.5 107.1 5.54 x 10⁻²⁴ temp, zone, date, z x d 555.3 34.7 2.92 x 10⁻⁸ temp, zone, date, t x z, z x d 1451.2 146.8 1.33 x 10⁻³² temp, zone, date, t x z, z x d 556.7 36.1 1.45 x 10⁻⁸ zone, date, z x d 1468.4 164.0 2.44 x 10-36 temp, zone, date, all 2-ways 559.3 38.7 3.95 x 10⁻⁹ temp, zone, date, z x d 1469.5 165.1 1.41 x 10-36 temp, zone, date, t x d 665.3 144.7 3.79 x 10⁻³² replicate plate 1472.6 168.2 2.99 x 10-37 temp, zone, date, t x z, t x d 666.5 145.9 2.08 x 10⁻³² temp, zone, date, t x z, t x d 1500.9 196.5 2.14 x 10-43 zone, date 668.2 147.6 8.89 x 10⁻³³ temp, zone, date, t x d 1512.3 207.9 7.16 x 10-46 temp, zone, date 672.5 151.9 1.04 x 10⁻³³ temp, date, t x d 1516.7 212.3 7.94 x 10-47 temp, zone, date, t x z 672.6 152.0 9.85 x 10⁻³⁴ temp, zone, date, t x z 1534.0 229.6 1.39 x 10-50 date 693.5 172.9 2.85 x 10-38 zone, date 1549.2 244.8 6.96 x 10-54 temp, date 696.1 175.5 7.77 x 10-39 temp, zone, date 1549.6 245.2 5.69 x 10-54 replicate plate 781.7 261.1 2.01 x 10-57 temp, date 1553.8 249.4 6.97 x 10-55 zone 785.9 265.3 2.46 x 10-58 date 1559.5 255.1 4.03 x 10-56 temp, zone 789.1 268.5 4.97 x 10-59 temp, zone, t x z 1753.7 449.3 2.73 x 10-98 temp, zone, t x z 789.5 268.9 4.07 x 10-59 zone 1763.6 459.2 1.93 x 10-100 temp 883.2 362.6 1.83 x 10-79 temp, zone 1763.6 459.2 1.93 x 10-100 temp, date, t x d not estimable temp 1767.5 463.1 2.75 x 10-101

8
Table A4. Continued Model AICc Δι AIC ωi ωi/ωj (e) Species Richness temp, zone, date, all 2-ways, 3-way 962.0 0 1 2.8 x 10⁹ temp, zone, date, all 2-ways 1005.5 43.5 3.58 x 10⁻¹⁰ temp, zone, date, z x d 1018.0 56.0 6.91 x 10⁻¹³ temp, zone, date, t x z, z x d 1018.9 56.9 4.41 x 10⁻¹³ zone, date, z x d 1025.2 63.2 1.89 x 10⁻¹⁴ temp, zone, date, t x z, t x d 1080.5 118.5 1.85 x 10⁻²⁶ temp, zone, date, t x d 1081.1 119.1 1.37 x 10⁻²⁶ temp, date 1083.0 121.0 5.31 x 10⁻²⁷ temp, zone, date, t x z 1094.5 132.5 1.69 x 10⁻²⁹ temp, zone, date 1094.9 132.9 1.38 x 10⁻²⁹ zone, date 1099.3 137.3 1.53 x 10⁻³⁰ temp, date, t x d 1103.9 141.9 1.54 x 10⁻³¹ temp, zone 1116.9 154.9 2.31 x 10⁻³⁴ date 1119.8 157.8 5.42 x 10⁻³⁵ replicate plate 1142.2 180.2 7.41 x 10-40 zone 1181.0 219.0 2.78 x 10-48 temp, zone, t x z 1182.4 220.4 1.38 x 10-48 temp 1272.3 310.3 4.16 x 10-68
9
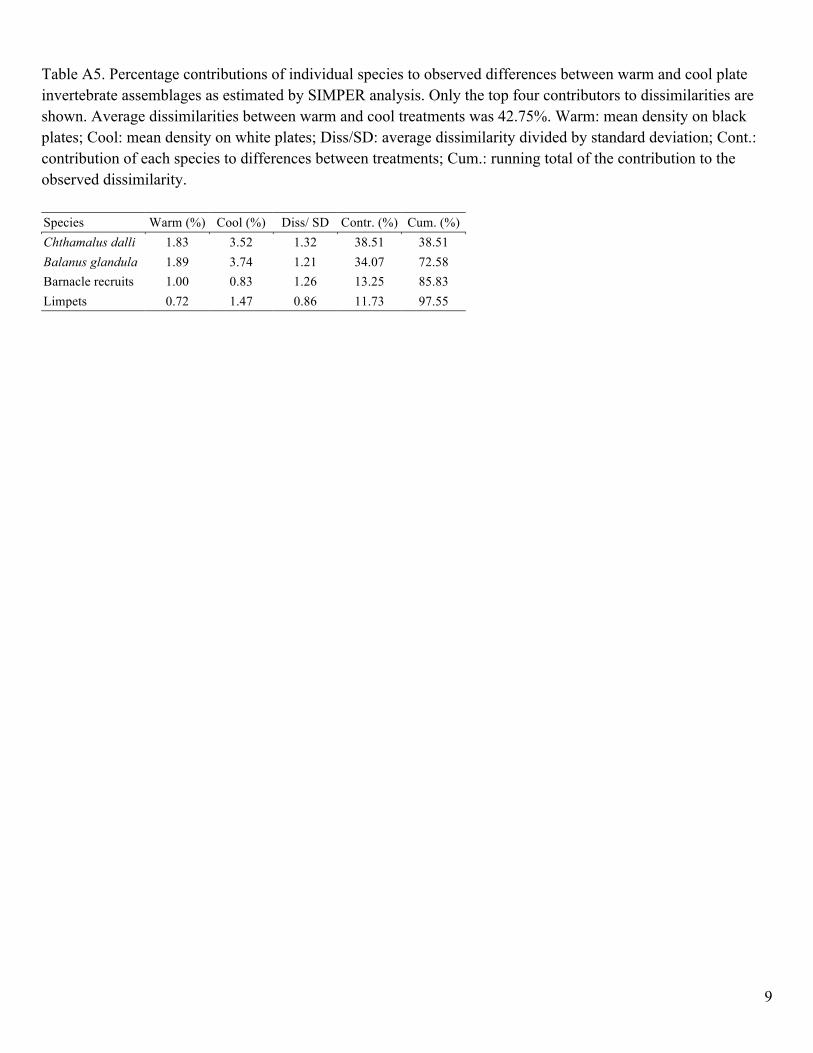
Table A5. Percentage contributions of individual species to observed differences between warm and cool plate invertebrate assemblages as estimated by SIMPER analysis. Only the top four contributors to dissimilarities are shown. Average dissimilarities between warm and cool treatments was 42.75%. Warm: mean density on black plates; Cool: mean density on white plates; Diss/SD: average dissimilarity divided by standard deviation; Cont.: contribution of each species to differences between treatments; Cum.: running total of the contribution to the observed dissimilarity. Species Warm (%) Cool (%) Diss/ SD Contr. (%) Cum. (%) Chthamalus dalli 1.83 3.52 1.32 38.51 38.51 Balanus glandula 1.89 3.74 1.21 34.07 72.58 Barnacle recruits 1.00 0.83 1.26 13.25 85.83 Limpets 0.72 1.47 0.86 11.73 97.55

10
Figure A2. Average daily maximum summer temperature for (a) high, (b) mid, and (c) low zones measured by temperature loggers sampling at 60 min intervals. Blue symbols represent cool (white) plates, red symbols represent warm (black) plates, and black symbols represent the temperature of the nearby rock. Error bars are se.

11
Figure A3. Mean (+/- se) percent cover of algal functional groups on cool plates (open symbol, dashed line) and warm plates (solid symbol, solid line) in (a) high, (b) mid, and (c) low zones. (d) The relative difference in green algae percent cover between temperature treatments (ln(warm/cool)) for each zone. Positive values indicate a positive effect of warming, negative values indicate a negative effect of warming in. Zeros indicate instances with zero percent cover in either treatment (rather than zero difference). Note the difference in x-axis spacing in top graphs compared to (d).

12
Figure A4. Mean (+/- se) density of grazer functional groups: limpets and littorine snails, on cool plates (open symbol, dashed line) and warm plates (solid symbol, solid line) in (a) high, (b) mid, and (c) low zone.

13
Appendix 4 Abundance and assemblage structure of community under plates Methods To determine if the community on top of the plates was influenced by mobile consumers sheltering under the plates, we quantified grazers and predators under plates during two census dates (July and September, 2009). Abundance of consumers found under plates was analyzed with a 3-factor ANOVA, testing the effects of temperature treatment, zone, and sampling date. We also visualized the assemblage using MDS plots, on Euclidean distance calculated from log transformed data, and used PERMANOVA to examine variation between temperature treatment, zone, and sampling date. Each term in the analysis was tested using 9999 random permutations of the appropriate units. Results The total abundance of consumers (grazers + predators) found under plates did not differ between temperature treatments, but was greater in lower zones and in July (ANOVA: temp F1,71 = 0.987, p = 0.324; zone F2,71 = 24.443, p < 0.001; date F1,71 = 14.660, p < 0.001; date × zone F2,71 = 5.195, p = 0.008; date × temp F1,71 = 1.254, p = 0.266; zone × temp F2,71 = 0.432, p = 0.651; 3-way F2,71 = 0.224, p = 0.800 ). Abundance of consumers was higher in July than September in the low and high zones, but was approximately equal between dates in the mid zone. We conducted similar analyses with limpets + chitons only, grazers alone, and predators alone, and found the same pattern of significance among treatments (data not shown). The results for the assemblage of consumers were similar to the results for abundance of consumers; MDS ordination indicated no partitioning due to temperature treatments (PERMANOVA: temp Pseudo-F1,71 = 0.505, p = 0.899; Fig. A4a), but did indicate partitioning in the structure due to zone and sampling date (Fig. A4b).
Figure A5. (a) Permutational multivariate analysis of variance of the effects of three crossed factors (temperature treatment, zone, sampling date) for log (x+1) abundance of organisms beneath plates. Bold p-values indicate significance at α = 0.05. (b) Non-metric multi-dimensional scaling ordination plots for the log (x+1) Euclidean distance for community structure beneath plates (n = 40 plates). Red symbols represent warm plates, blue symbols represent cool plates in the high (triangles), mid (circles), and low (squares) zones. Solid symbols are for the July survey and open symbols for the September survey.
(a) Source df Pseudo - F P(perm)
Temp 1 0.505 0.899 Zone 2 27.577 < 0.001 Date 1 10.120 < 0.001 Temp × Zone 2 0.545 0.950 Temp × Date 1 0.419 0.943 Zone × Date 2 4.605 < 0.001 3-way 2 0.592 0.926 Residual 71 Total 82

14
References for supplementary materials Bell, E. C. 1993. Photosynthetic response to temperature and desiccation of the intertidal alga Mastocarpus
papillatus. - Mar. Biol. 117: 337–346.
Bell, E. C. 1995. Environmental and morphological influences on thallus temperature and desiccation of the intertidal alga Mastocarpus papillatus Kützing. - Journal of Experimental Marine Biology and Ecology 191: 29–55.
Berger, M. S. and Emlet, R. B. 2007. Heat-shock response of the upper intertidal barnacle Balanus glandula: Thermal stress and acclimation. - Biol. Bull. 212: 232–241.
Bischoff, B. and Wiencke, C. 1995a. Temperature adaptation in strains of the amphi-equatorial green alga Urospora penicilliformis (Acrosiphoniales): biogeographical implications. - Mar. Biol. 122: 681–688.
Bischoff, B. and Wiencke, C. 1995b. Temperature ecotypes and biogeography of Acrosiphoniales (Chlorophyta) with Arctic-Antarctic disjunct and Arctic/cold-temperature distributions. - European Journal of Phycology 30: 19–27.
Caffey, H. M. 1982. No effect of naturally-occurring rock types on settlement or survival in the intertidal barnacle, Tesseropora rosea (Krauss). - Journal of Experimental Marine Biology and Ecology 63: 119–132.
Cowles, D. Invertebrates of the Salish Sea. - www.wallawalla.edu: accessed on October 27–2014.
Cox, T. E. and Smith, C. M. 2011. Thermal ecology on an exposed algal reef: infrared imagery a rapid tool to survey temperature at local spatial scales. - Coral Reefs 30: 1109–1120.
Denny, M. W. and Harley, C. D. G. 2006. Hot limpets: predicting body temperature in a conductance-mediated thermal system. - J. Exp. Biol. 209: 2409–2419.
EOL Encyclopedia of life. - www.eol.org: accessed on October 27–2014.
Gregg, J. H. 1945. Background illumination as a factor in the attachment of barnacle cyprids. - Biol. Bull. 88: 44–49.
Helmuth, B. et al. 2005. Biophysics, physiological ecology, and climate change: Does mechanism matter? - Annu Rev Physiol 67: 177–201.
Hsiao, S. I. 1970. Light and temperature effects on the growth, morphology, and reproduction of Petalonia fascia. - Canadian Journal of Botany 48: 1359–1361.
Hurley, A. C. 1973. Larval settling behaviour of the acorn barnacle (Balanus pacificus Pilsbry) and its relation to distribution. - The Journal of Animal Ecology 42: 599–609.
James, R. J. and Underwood, A. J. 1994. Influence of colour of substratum on recruitment of spirorbid tubeworms to different types of intertidal boulders. - Journal of Experimental Marine Biology and Ecology 181: 105–115.
Kim, K. Y. and Garbary, D. J. 2006. Fluorescence responses of photosynthesis to extremes of hyposalinity, freezing and desiccation in the intertidal crust Hildenbrandia rubra (Hildenbrandiales, Rhodophyta). - Phycologia 45: 680–686.
Kordas, R. L. and Dudgeon, S. 2011. Dynamics of species interaction strength in space, time and with developmental stage. - Proc. R. Soc. B 278: 1804–1813.
15
Lathlean, J. A. and Minchinton, T. E. 2012. Manipulating thermal stress on rocky shores to predict patterns of recruitment of marine invertebrates under a changing climate. - Marine Ecology Progress Series 467: 121–136.
Lüning, K. and Freshwater, W. 1988. Temperature tolerance of northeast Pacific marine algae. - Journal of Phycology 24: 310–315.
McMahon, R. F. 1990. Thermal tolerance, evaporative water loss, air-water oxygen consumption and zonation of intertidal prosobranchs: a new synthesis. - Hydrobiologia 193: 241–260.
Orfanidis, S. 1993. Temperature responses and distribution of several Mediterranean macroalgae belonging to different distribution groups. - Botanica Marina 36: 359–370.
Pomerat, C. M. and Reiner, E. R. 1942. The influence of surface angle and of light on the attachment of barnacles and other sedentary organisms. - Biol. Bull. 82: 14–25.
Satheesh, S. and Wesley, S. G. 2010. Influence of substratum colour on the recruitment of macrofouling communities. - Journal of the Marine Biological Association of the United Kingdom 90: 941–946.
Smith, C. M. and Berry, J. A. 1986. Recovery of photosynthesis after exposure of intertidal algae to osmotic and temperature stresses: comparative studies of species with differing distributional limits. - Oecologia 70: 6–12.
Southward, A. J. and Southward, E. C. 1967. On the biology of an intertidal chthamalid (Crustacea, Cirripedia) from the Chukchi Sea. - Arctic: 8–20.
Teoh, M.-L. et al. 2012. Response of Antarctic, temperate, and tropical microalgae to temperature stress. - Journal of Applied Phycology 25: 285–297.
Wolcott, T. G. 1973. Physiological ecology and intertidal zonation in limpets (Acmaea): a critical look at “limiting factors.” - Biol. Bull. 145: 389–422.
Zupan, J. R. and West, J. A. 1990. Photosynthetic responses to light and temperature of the heteromorphic marine alga Mastocarpus papillatus (Rhodophyta). - Journal of Phycology 26: 232–239.