apigee edge troubleshooting guide...apigee edge troubleshooting guide self d iagnose p roblems o n e...
TRANSCRIPT

Apigee Edge Troubleshooting Guide
Self diagnose problems on Edge Private Cloud

Contents
Preface 7 Apigee Edge 7 Why Did We Write This Guide 7 Who Should Use This Guide 8 How This Guide Is Organized 8 Authors 9 Acknowledgements 9
PART 1 - Troubleshooting 11
General Edge Troubleshooting 11 UI Trace 11
References 13 Debug Sessions 13 Component Logs 14
References 16
Troubleshooting Runtime Problems 17 500 Internal Server Error 17
Overview of 500 Internal Server Error 18 Execution Error in an Edge Policy 20 Error in the Backend Server 28
502 Bad Gateway 31 Overview of 502 Bad Gateway 31 Incorrectly configured Target Server 32 EOFException from the Backend Server 35
503 Service Unavailable 39 Overview of 503 Service Unavailable 39 Northbound and Southbound Connection 40
Determine whether the 503 Service Unavailable error occurred at northbound or southbound connection 40
Overloaded Server 42 Connection Errors 43
SSL Handshake Failures 45 Overview of SSL Handshake 45
(c)2017 Apigee Corp. All Rights Reserved 1

Protocol Mismatch 46 Cipher Mismatch 49 Incorrect Certificate 53
Hostname Mismatch 54 Incomplete or Incorrect certificate chain 56 Expired/Unknown Certificate sent by the Server/Client 58
SNI Enabled Server 63 504 Gateway Timeout 68
Overview of 504 Gateway Timeout 68 Slow Backend Server 70
Increase the timeout value on Router and Message Processor 81 Slow API Request Processing by Edge 83
Troubleshooting Analytics Problems 86 Data not showing up on analytics dashboards in Edge 86
No API Traffic for Organization-Environment 87 Data available in Postgres database, but not displaying in the Edge UI 88
Determine the availability of latest Analytics data in Postgres database 88 Analytics Data not being pushed to Postgres Database 91 Incorrect Analytics Deployment 93 Stale Analytics Server UUIDs 95
Custom variable not visible in analytics custom reports 97 Custom Variable not adhering to the standard guidelines 97 No traffic on API proxy implementing the Statistics Collector policy 98 Custom Variable not pushed to Postgres Server 99
Postgres Server running out of disk space 101 Inadequate disk space 101 Lack of Analytics Data Pruning 103
Analytics Reports timing out 105 Inadequate Hardware Configuration 106 Large amount of Analytics data in Postgres Database 106 Insufficient time to fetch Analytics data 107
Troubleshooting Deployment Errors 109 Deployment Error: "Call timed out; either server is down or server is not reachable" 109
Network Connectivity Issue 110 Large API Proxy Bundle 116
(c)2017 Apigee Corp. All Rights Reserved 2

Deployment Error: “Error while fetching children for path” 118 Deployment Error: "Error while accessing datastore" 122
Network Connectivity Issue between Message Processor and Cassandra 123 Deployment errors due to Cassandra restarts 125 Spike in read request latency on Cassandra 125 API Proxy Bundle larger than 15MB 127
Deployment Error: "Unexpected error occurred while processing the updates" 130 Out Of Memory 131 Error in API proxy bundle 133
Troubleshooting Developer Portal Problems 135 Overview of Apigee Developer Portal (Drupal) 135
How SmartDocs works 135 How the Developer Portal Communicates with Edge 136
API calls via Developer Portal fail with Internal Error 137 SmartDocs proxy misconfigured or network firewall restrictions 138 Portal configured over HTTPS, SmartDocs request over HTTP 139 SmartDocs proxy returning an exception 139 Edge Message Processors unable to call published API endpoint 140
Communication Issues between Developer Portal and Edge 143
Troubleshooting Edge Router Problems 147 Bad Config Files 147
Troubleshooting Monetization Problems 151 Developer suspended 151 Monetization setup issues 155
Monetization Limits Check Policy not used in API Proxy 156 API Product is not monetized 157 Transaction recording policy incorrectly defined 157 Developer has not purchased rate plan 159
Troubleshooting OpenLDAP Problems 160 SMTP is disabled and users need to reset password 160 LDAP is not Replicating 163 Unable to start OpenLDAP 165 OpenLDAP Data Corruption 167
(c)2017 Apigee Corp. All Rights Reserved 3

Troubleshooting ZooKeeper Problems 171 ZooKeeper Connection Loss Errors 171
Network connectivity issue across different data centers 174 ZooKeeper node not serving requests 177
Unable to start ZooKeeper 183 Misconfigured ZooKeeper MyId 184 ZooKeeper port in use 185 Incorrect process id in apigee-zookeeper.pid file 187 ZooKeeper Leader Election Failure 188
ZooKeeper Data Issues 189
PART 2 - Commands Quick Reference 192
Components Command Reference 192 apigee-all 192
apigee-all command reference table 192 References 192
apigee-service 193 component names reference table 193 apigee-service command reference table 194
References 195
Postgres Commands Reference 196 PostgreSQL (psql) utility 196
Verify existence of your org-env tables 196 List the columns in fact table 197 Get the Database Table Size 201 Get Latest Timestamp In Fact Table 202 Get the Oldest and Latest Timestamp in Fact Table 202 Get details about SQL queries running in Postgres Database 203 Get Replication Time Lag on Postgres Standby 205
Cassandra Commands Reference 207 Cassandra Query Language command-line (cqlsh) utility 207
Get information about all keyspaces in Cassandra datastore 207 Get Information about OAuth tokens 208 Get Information about Developer Apps 209
(c)2017 Apigee Corp. All Rights Reserved 4
Get Information about Apigee Cache 209 Cassandra nodetool Utility 210
Check Ring Status 210 Check compaction status 210 Check Gossip info 211 Check reads/writes/drops 212 Display statistics for every keyspace and column family 213 Status of the thrift server 214 Show Network Statistics 214 Repair tables 215
ZooKeeper Utilities 216 ZooKeeper Command Line Interface (zkCli) utility 216
List Data in a ZooKeeper Node 216 Get Data from a ZooKeeper Node 217
ZooKeeper Tree (zkTree) Utility 218 How to check if a ZooKeeper Node is leader? 219
Diagnostic Tools and Logs 221 TCP/IP packet sniffer (tcpdump) utility 221 Heap dumps 223 Thread dumps 225
PART 3 - APIs Quick Reference 227 Organization APIs 227 Environment APIs 228 API Proxy APIs 229 Deployment APIs 231 Virtual Host APIs 232 Keystore APIs 234 API Product/App/Developer APIs 236 Analytics APIs 238 Server in Pods/Region APIs 239 Server Info APIs 241 Debug APIs 243
PART 4 - Properties 244
(c)2017 Apigee Corp. All Rights Reserved 5
Message Processor Properties 244 http.properties 245 message-logging.properties 252 security-policy.properties 253 system.properties 254
(c)2017 Apigee Corp. All Rights Reserved 6
Preface The act of troubleshooting is both an art and a science. The constant effort of our technical support teams has been to demystify the art and expose the science behind problem identification and resolution. The value of this demystification is apparent to all the people involved.
➔ For customers using a service or a platform, it means quick and more effective solutions, and in many cases greater independence in solving problems - euphemistically termed as Self Serve.
➔ For Product Development and Support teams, it means a scalable and more efficient model of assisting customers and partnering in their success.
The Apigee Support team at Google constantly strives for this win-win situation through collaborative partnership with our customers. We offer this guide as the first step in demystifying the troubleshooting process for the Apigee Edge platform. Specifically, this document aids in troubleshooting problems that might occur with API requests flowing through Apigee Edge for Private Cloud Release 4.17.01 or higher. The document provides a description of tools, commands, and APIs that can help in analyzing a problem. It also provides information about properties that can be configured to get desired behaviour or optimum performance.
Apigee Edge Apigee Edge is a platform for developing and managing API proxies. Think of a proxy as an abstraction layer that "fronts" your backend service APIs and provides value-added features like security, rate limiting, quotas, analytics, and more.
Why Did We Write This Guide For many years, we have had the privilege of supporting hundreds of our customers who have used the Apigee Edge platform as a part of their Digital Transformation journey. During this time, we have gained knowledge and key perspectives on common issues that customers face when using the Apigee Edge Private Cloud and the diagnostics that are most useful to troubleshoot these issues.
(c)2017 Apigee Corp. All Rights Reserved 7
We have captured these insights in this guide and hope they will help you troubleshoot and resolve issues without having to contact Apigee customer support. While our customer support teams remain available to assist you, this guide will help you to:
- Determine the source of issues - Solve issues independently wherever feasible - Perform the relevant diagnostics so that support teams can help resolve issues
quicker If you are able to troubleshoot and resolve a majority of issues that you encounter on Apigee Edge using this guide, we would consider our mission accomplished.
Who Should Use This Guide The target audience for this document comprises developers who are working with Apigee Edge for Private Cloud Release 4.17.01 or higher, as well as support or administration personnel who maintain infrastructure and datastores that are associated with Apigee Edge. This document is intended for readers with a high-level understanding of Apigee Edge and its architecture, as well as some understanding of basic Edge concepts such as policies, analytics, monetization, and datastores such as Cassandra and Postgres. In addition, it is assumed that the reader is reasonably proficient with the operating system where Apigee Edge is installed.
How This Guide Is Organized This Troubleshooting Guide has been categorized into four parts: PART 1 - Troubleshooting
➔ This part introduces general debugging techniques such as using trace and debug sessions in Apigee Edge.
➔ It also contains procedures to try when you encounter a problem with your APIs at runtime or during deployment, or any problem with analytics, developer portal, monetization, OpenLDAP, or ZooKeeper.
(c)2017 Apigee Corp. All Rights Reserved 8

PART 2 - Commands Quick Reference
➔ This part provides information about some of the commonly used commands to start and stop Edge components, SQL queries in Postgres, and Cassandra datastores, or get information from ZooKeeper.
PART 3 - APIs Quick Reference
➔ This part provides information about some of the commonly used management APIs to get information about Edge entities, servers, or analytics.
PART 4 - Properties
➔ This part provides information about some of the important properties that can be configured on Edge components to get desired behaviour or optimum performance.
Authors The key contributors are: Amar Devegowda Janice Hunt Divya Achan Arun Kumar Gopalakrishnappa Alexander Toombs Phani Madgula Stephen Gilson
Acknowledgements We would like to acknowledge many people who have contributed their technical inputs to this guide - Rajesh Jadhav, Gregory Brail, Sriram Padmanabhan, Peter Johnson, Senthil Kumar Karuppiah, Senthil Kumar Tamizhselvan, Sribalaji Alagarasu, Chris Novak, Ken Chan, Rajanish GJ, Baba Krishnankutty, Rammohan Ganapavarapu, Dino Chiesa, Marsh
(c)2017 Apigee Corp. All Rights Reserved 9

Gardiner, Corinna Fu, Dave Newman, Jagjyot Hans, Karl Kalckstein, Russell Blewitt, Venkataraghavan Lakshminarayanachar. Special thanks to Stephen Gilson and Liz Lynch for their help in reviewing, proofreading, and shaping this guide.
(c)2017 Apigee Corp. All Rights Reserved 10
PART 1 - Troubleshooting
General Edge Troubleshooting This section does not describe how to solve a specific problem, but describes three general-purpose tools that can help you with many different problems:
● UI Trace ● Debug Sessions ● Component Logs
UI Trace UI Trace is a tool for troubleshooting and monitoring API proxies running on Apigee Edge. Trace lets you probe the details of each step through an API proxy flow. With Trace, you can record and inspect each step in the API proxy transaction. For example, you can view flow variables before and after a policy executes, inspect the request and response payloads, view headers and query parameters, and more. The Trace tool has two modes:
● Online mode where you make a request to an API proxy and then inspect the results right away. You can make several calls to the proxy before examining the trace. One Trace session can support 10 request/response transactions per Message Processor. With two Messages Processors handling traffic, 20 request/response transactions are supported. A trace session automatically stops after 10 minutes if you don't manually stop it.
● The Offline Trace tool lets you view and analyze trace sessions that were
previously saved. A saved trace session is essentially a "recording" of a trace
(c)2017 Apigee Corp. All Rights Reserved 11

session, and can be useful for cases where troubleshooting and further analysis is required. The UI for the Offline Trace tool is similar to the "live" Trace tool.
The trace tool has two main parts:
● The transaction map uses icons to mark each notable step that occurs during an API proxy transaction, including policy execution, conditional steps, and transitions. Hover over any icon to see summary information. The request flow steps appear along the top of the transaction map and response flow steps along the bottom. Here's a sample transaction map with the main proxy processing segments labeled:
For a complete description of all symbols shown in the trace window above, see Transaction map icons.
● The phase details section of the tool lists information about the proxy's internal
processing, including variables that were set or read, request and response headers, and much more. Click any icon to see the phase details for that step.
(c)2017 Apigee Corp. All Rights Reserved 12

Here's a sample of the phase details:
For a complete description of all information shown in the phase details above, see Understanding the phase details.
References Watch a video for an introduction to the Trace tool Using the Trace tool Using the Offline Trace tool
Debug Sessions A debug session records detailed information for each step in the API proxy transaction, such as flow variables before and after a policy executes, request and response payloads, headers and query parameters, and more. The data generated by a debug session is the same data that is used to generate the UI Trace display in the Edge UI. See UI Trace for more. The difference is that debug data is returned to you as an XML or JSON object that contains all the debug data for one call to an API proxy. By default, a debug session captures a maximum of 10 messages per Message Processor for a 10 minute interval, whichever comes first. For example, if you have two Message
(c)2017 Apigee Corp. All Rights Reserved 13
Processors, the the message maximum is 20 for a 10 minute interval. However, you can optionally extend the duration of the debug session. The following procedure describes how to create a debug session:
1. Use the Create a debug session API to create a debug session, specifying the API proxy and environment that you want to debug. Once created, all calls to the API proxy generate debug data. Alternatively, you can create a debug session that captures only API calls with specific query parameters and/or HTTP headers. Filtering is particularly useful for troubleshooting. For more information, see Create a debug session with a filter.
2. Make a request to a deployed API proxy. Each call to the API proxy creates a debug object with a unique ID.
3. Use the Get debug session transaction IDs API to get a list of all debug IDs for the debug session.
4. Use the Get debug session transaction data API to retrieve the debug data associated with a specific debug ID.
5. Call the Delete debug session API to explicitly close the debug session. Closing the debug session discards all the associated data. Alternatively, all data is discarded when the debug session expires.
Component Logs Apigee Edge is comprised of multiple processes, each of which emits messages into a system log. You can examine the logs to obtain information about the operation of the specific process, for example the management server, the UI server, or the message processor itself. The log files for each component are contained in the /opt/apigee/var/log directory on the node hosting the component. Each component has its own subdirectory. For example, the logs for the Management Server are in the directory: /opt/apigee/var/log/edge-management-server
(c)2017 Apigee Corp. All Rights Reserved 14
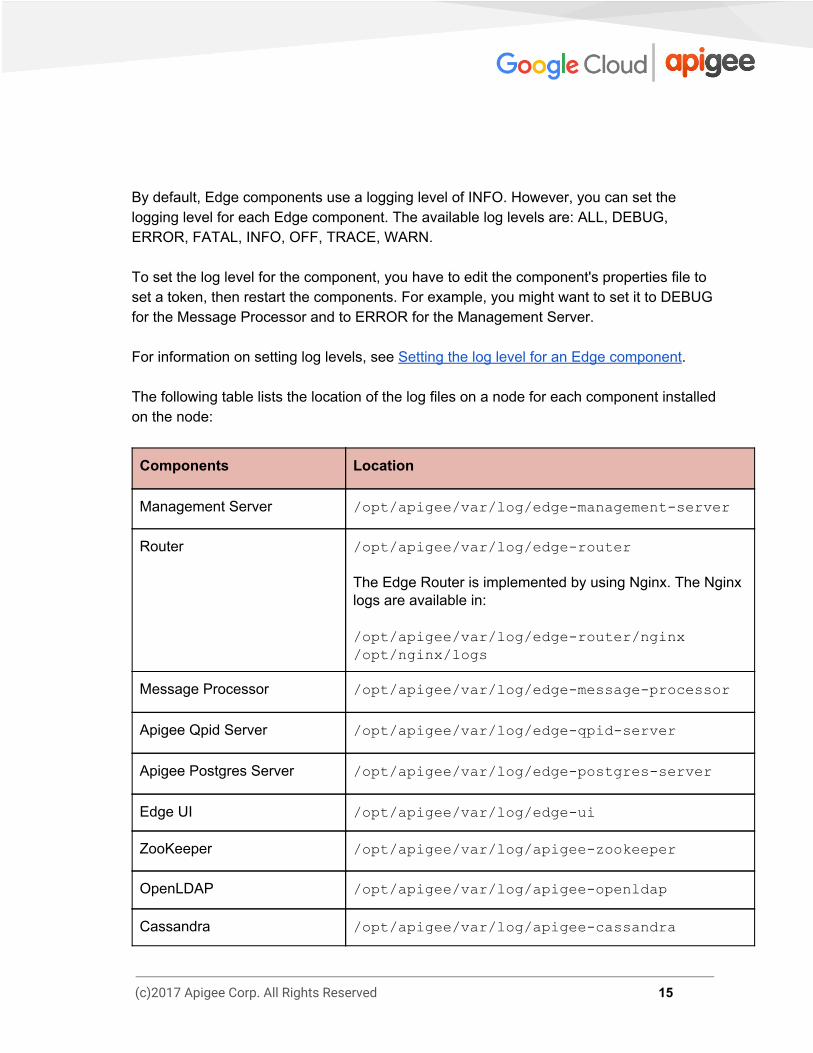
By default, Edge components use a logging level of INFO. However, you can set the logging level for each Edge component. The available log levels are: ALL, DEBUG, ERROR, FATAL, INFO, OFF, TRACE, WARN. To set the log level for the component, you have to edit the component's properties file to set a token, then restart the components. For example, you might want to set it to DEBUG for the Message Processor and to ERROR for the Management Server. For information on setting log levels, see Setting the log level for an Edge component. The following table lists the location of the log files on a node for each component installed on the node:
Components Location
Management Server /opt/apigee/var/log/edge-management-server
Router /opt/apigee/var/log/edge-router
The Edge Router is implemented by using Nginx. The Nginx logs are available in:
/opt/apigee/var/log/edge-router/nginx
/opt/nginx/logs
Message Processor /opt/apigee/var/log/edge-message-processor
Apigee Qpid Server /opt/apigee/var/log/edge-qpid-server
Apigee Postgres Server /opt/apigee/var/log/edge-postgres-server
Edge UI /opt/apigee/var/log/edge-ui
ZooKeeper /opt/apigee/var/log/apigee-zookeeper
OpenLDAP /opt/apigee/var/log/apigee-openldap
Cassandra /opt/apigee/var/log/apigee-cassandra
(c)2017 Apigee Corp. All Rights Reserved 15

Qpidd /opt/apigee/var/log/apigee-qpidd
PostgreSQL database /opt/apigee/var/log/apigee-postgresql
References Log files Setting the log level for an Edge component
(c)2017 Apigee Corp. All Rights Reserved 16
Troubleshooting Runtime Problems This section provides information and guidance on troubleshooting some commonly observed runtime problems such as 5XX Errors and SSL handshake failures in Apigee Edge.
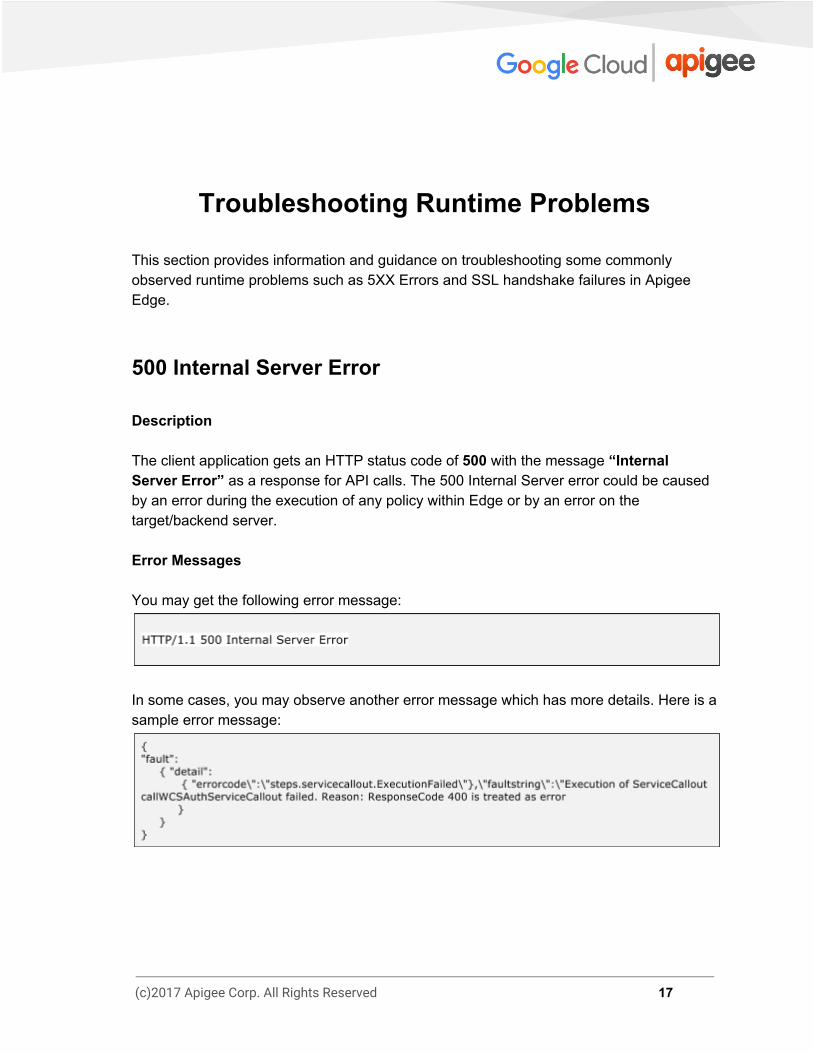
500 Internal Server Error Description The client application gets an HTTP status code of 500 with the message “Internal Server Error” as a response for API calls. The 500 Internal Server error could be caused by an error during the execution of any policy within Edge or by an error on the target/backend server. Error Messages You may get the following error message:
In some cases, you may observe another error message which has more details. Here is a sample error message:
(c)2017 Apigee Corp. All Rights Reserved 17

Overview of 500 Internal Server Error The HTTP status code 500 is a generic error response. It means that the server encountered an unexpected condition that prevented it from fulfilling the request. This error is usually returned by the server when no other error code is suitable. Causes The 500 Internal Server Error could be thrown due to a number of different causes. In Edge, the causes can be classified into two main categories based on where the error occurred:
Location of Error Details
Execution Error in an Edge Policy A Policy within the API proxy may fail for some reason.
Error in the Backend Server The backend server may fail for some reason.
Let’s now look at how to diagnose the situation further to determine the cause of the issue. Determine whether the error occurred in a policy or in the backend server As a first step, use one of the following procedures to determine if the 500 Internal Server Error was thrown during the execution of a policy within the API proxy or by the backend server. Procedure 1: Using Trace in UI
1. If the issue is still active, enable the trace in UI for the affected API.
2. Once you have captured the trace, select the API request that shows the response code as 500.
3. Navigate through all the phases of the failing API request and check which phase returns the 500 Internal Server Error:
a. If the error is thrown during the execution of a policy, then proceed to Execution Error in an Edge Policy.
(c)2017 Apigee Corp. All Rights Reserved 18

b. If the backend server has responded back with 500 Internal Server, then proceed to Error in the Backend Server.
Procedure 2: Using Nginx Access Logs You can also refer to Nginx Access logs to determine whether the 500 status code was thrown during the execution of a policy within the API proxy or by the backend server. This is particularly useful if the issue has occurred in the past or if the issue is intermittent and you are unable to capture the trace in UI. Use the following steps to determine this information from Nginx access logs:
1. Check the Nginx access logs (/opt/apigee/var/log/edge-router/nginx/<org>~<env>.<port#>_access_log ).
2. Search if there are any 500 Errors for the specific API proxy at the specific
duration.
3. If there are any 500 Errors, then check if the error is a policy or a target server error, as shown below:
Sample Entry showing a Policy Error
(c)2017 Apigee Corp. All Rights Reserved 19

Sample Entry showing a Target Server Error
4. Once you’ve identified whether it is a policy or target server error: a. Proceed to Execution Error in an Edge Policy if it is a policy error. b. Proceed to Error in Backend Server if it is a target server error.
Execution Error in an Edge Policy Steps to Diagnose If you have confirmed that one of the policies within the API proxy has failed, then perform the following steps:
1. If you have the trace UI session for the error, then:
a. Select the API request that is failing with 500 Internal Server Error in the trace.
b. Examine the request and select the specific policy that has failed or the flow named "Error" that is immediately following the failed policy in the trace.
c. Get more details about the error either by checking the “error” field under the Properties section or the Error content.
d. Using the details you’ve collected about the error, try to determine its cause.
e. Fix the issue with the policy, if possible.
2. If you don’t have the trace UI session, then:
(c)2017 Apigee Corp. All Rights Reserved 20

a. Use the Nginx access logs as explained in the previous section to determine the failing policy in the API proxy and also the unique request message id
b. Check the Message Processor logs (/opt/apigee/var/log/edge-message-processor/logs/system.log ) and search for the unique request message id in it.
c. If you do find the unique request message ID, see if you can get more information about the cause for the failure.
d. Fix the issue with the policy, if possible. Since 500 Internal Server Error can be caused for different reasons, the following examples illustrate how to determine the cause and resolution for different types of issues. Example 1: Failure in Service Callout policy due to an error in the backend server If the call to the backend server fails within the Service Callout policy with any error such as 4XX or 5XX, then it will be treated as 500 Internal Server Error.
1. Here’s an example where the backend service fails with a 404 error within the
Service Callout policy. The following error message is sent to the end user:
2. The following trace UI session shows 500 status code caused due to an error in Service Callout policy:
(c)2017 Apigee Corp. All Rights Reserved 21

3. In this example, the “error” property lists the reason for the Service Callout policy failure as “ResponseCode 404 is treated as error”. This error might occur if the resource being accessed via the backend server URL in the Service Callout policy is not available.
4. Check the availability of the resource on the backend server. It might not be available temporarily/permanently or it might have been moved to a different location.
Resolution
1. Check the availability of the resource on the backend server. It might not be available temporarily/permanently or it might have been moved to a different location.
2. Fix the backend server URL in the Service Callout policy. Example 2: Failure in Extract Variables Policy Let’s now look at an example, where 500 Internal Server Error is caused due to an error in Extract Variables and see how to troubleshoot and resolve the issue.
(c)2017 Apigee Corp. All Rights Reserved 22

1. The following trace in UI session shows 500 status code due to an error in Extract Variables policy:
2. Select the failing Extract Variables policy, scroll down and look at the “Error Content” section for more details:
3. The Error Content indicates that the“serviceCallout.oamCookieValidationResponse” variable is not available in the Extract Variables policy.
(c)2017 Apigee Corp. All Rights Reserved 23
As the name of the variable indicates, it is possible that the variable should have been set by the preceding Service Callout policy.
4. If you check the Service Callout policy, you might find that the “serviceCallout.oamCookieValidationResponse” variable was not set. This indicates that the call to the backend service failed, resulting in an empty response variable.
5. Though the Service Callout policy has failed, the execution of the policies after Service Callout policy continue because the “continueOnError” flag in the Service Callout policy is set to true.
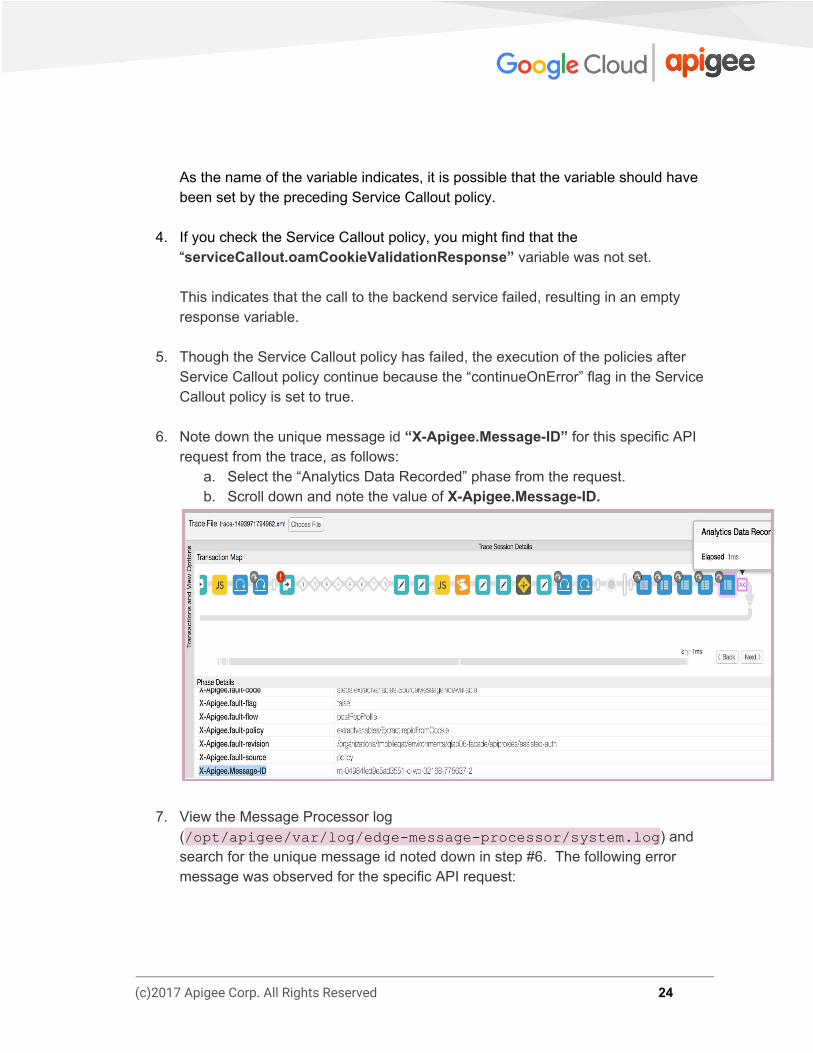
6. Note down the unique message id “X-Apigee.Message-ID” for this specific API request from the trace, as follows:
a. Select the “Analytics Data Recorded” phase from the request. b. Scroll down and note the value of X-Apigee.Message-ID.
7. View the Message Processor log (/opt/apigee/var/log/edge-message-processor/system.log ) and search for the unique message id noted down in step #6. The following error message was observed for the specific API request:
(c)2017 Apigee Corp. All Rights Reserved 24

The above error indicates that the Service Callout policy failed due to a connection timeout error while connecting to the backend server.
8. To determine the cause for the connection timeout error, executed the telnet command to the backend server from the Message Processor(s). The telnet command gave “Connection timed out” error as shown below:
Typically, this error is observed under the following circumstances:
➔ When the backend server is not configured to allow traffic from the Edge Message Processors.
➔ If the backend server is not listening on the specific port.
In the above illustrated example, though the Extract Variables policy failed, the actual cause was that Edge was unable to connect to the backend server in the Service Callout policy. And the cause for this failure was that the backend end server was not configured to allow traffic from the Edge Message Processors. Your own Extract Variables policy will behave differently and may fail for a different reason. You can troubleshoot the issue appropriately depending on the cause for failure of your Extract Variables policy by checking the message in the error property.
Resolution
1. Fix the cause for error or failure in Extract Variables policy appropriately.
(c)2017 Apigee Corp. All Rights Reserved 25

2. In the illustrated example above, the solution was to rectify the network configuration to allow the traffic from Edge Message Processors to your backend server. This was done by while listing the Message Processors’ IP addresses on the specific backend server. For example, On Linux, you could use iptables to white list or allow the traffic from Message Processor’s IP addresses on the backend server.
Example 3: Failure in JavaCallout policy Let’s now look at an example, where 500 Internal Server Error is caused due to an error in Java Callout policy and see how to troubleshoot and resolve the issue.
1. The following UI trace shows 500 status code due to an error in Java Callout Policy:
2. Select the Flow named “Error” followed by the failed Java Callout Policy to get the error details as shown in the figure below:
(c)2017 Apigee Corp. All Rights Reserved 26

3. In this example, the “error” property under the Properties section reveals that the
failure is due to expired password being used while connecting to the Oracle Database from within the JavaCallout policy. Your own Java callout will behave differently and will populate a different message in the error property.
4. Check the JavaCallout policy code and confirm the correct configuration that needs to be used.
Resolution Fix the Java callout code or configuration appropriately to avoid the runtime exception. In the illustrated Java callout failure example above, one would need to use the correct password for connecting to the Oracle database to resolve the issue.
(c)2017 Apigee Corp. All Rights Reserved 27

Error in the Backend Server Steps to Diagnose If you have confirmed that the 500 Internal Server Error is coming from the backend server, perform the following steps:
1. If you have the UI trace for the error, then:
a. Select the API request that has failed with 500 Internal Server Error.
b. Select the “Response received from target server” phase from the failing
API request as shown in the figure below:
c. Check the “Response Content” section to get details about the error.
(c)2017 Apigee Corp. All Rights Reserved 28

In this example, the Response Content which is a SOAP Envelope, shows the fault string as “Not Authorized” message. The most likely cause for this issue is that the proper credentials (username/password, access token, etc.) are not passed to the backend server by the user. The cause of other backend errors can vary widely. You will need to diagnose each situation independently.
d. Check the backend server logs to see if there are any more details about
the error.
e. Proceed to step #4.
2. If the UI trace is not available for the failing request, then check the backend server logs to get details about the error.
3. If possible, enable the debug mode on the backend server to get more details about the error and the cause.
4. If it is a NodeJS Backend Server, then check the NodeJS logs for the specific API Proxy in the UI or Message Processor logs (/opt/apigee/var/log/edge-message-processor/logs/system.log ) for more details about the error.
(c)2017 Apigee Corp. All Rights Reserved 29

NodeJS Logs option in the Edge UI - Overview Tab of API Proxy
Resolution
1. Once you’ve identified the cause of the error, fix the issue in your backend server.
2. If it’s a NodeJS backend server: a. Check if the error is thrown from your custom code and fix the issue, if
possible.
b. If the error is not thrown from your custom code or if you need assistance, contact Apigee Support.
If you need further assistance in troubleshooting 500 Internal Server Error or you suspect that it’s an issue within Edge, contact Apigee Support.
(c)2017 Apigee Corp. All Rights Reserved 30

502 Bad Gateway Description The client application gets an HTTP status code of 502 with the message “Bad Gateway” as a response for API calls. Error Messages Client application gets the following response code:
In addition, you may observe the following error message:
Overview of 502 Bad Gateway The HTTP status code 502 means that the client is not receiving a valid response from the backend servers that should actually fulfill the request. Causes One of the typical causes for 502 Bad Gateway Error is the “Unexpected EOF” error, which can be caused due to following reasons:
(c)2017 Apigee Corp. All Rights Reserved 31

Cause Details
Incorrectly configured Target Server
Target server is not properly configured to support TLS/SSL connections.
EOFException from Backend Server
The backend server may send EOF abruptly.
Incorrectly configured Target Server Steps to Diagnose
1. Enable the trace in UI for the affected API.
2. If the trace for the failing API request shows the following: a. The 502 Bad Gateway error is seen as soon as the Target Flow request
started. b. The error.class displays messaging.adaptors.http.UnexpectedEOF.
Then it is very likely that this issue is caused by an incorrect target server configuration.
3. Get the target server definition using the following Edge management API call: curl -v http://management:8080/v1/organizations/ <orgname>/environments/<envname>/targetservers /<targetservername> Sample Faulty Target Server Definition
(c)2017 Apigee Corp. All Rights Reserved 32

4. The illustrated target server definition is an example for one of the typical mis
configurations which is explained as follows: Let’s assume that the target server “mocktarget.apigee.net” is configured to accept secure (HTTPS) connections on port # 443. However, if you look at the target server definition, there are no other attributes/flags that indicate that it is meant for secure connections. This causes Edge to treat the API requests going to the specific target server as HTTP (non-secure) requests. So Edge will not initiate the SSL Handshake process with this target server.
Since the target server is configured to accept only HTTPS (SSL) requests on 443, it will reject the request from Edge or close the connection. As a result, you get an UnexpectedEOF error on the Message Processor. The Message Processor will send 502 Bad Gateway response to the client.
Resolution Always ensure that the target server is configured correctly as per your requirements. For the illustrated example above, if you want to make requests to a secure (HTTPS/SSL) target server, you need to include the SSLInfo attributes with the “enabled” flag set to true. While it is allowed to add the SSLInfo attributes for a target server in the target endpoint definition itself, it is recommended to add the SSLInfo attributes as part of the target server definition to avoid any confusion.
1. If the backend service requires one-way SSL communication, then:
a. You need to enable the TLS/SSL in the target server definition by including the SSLInfo attributes where “enabled” flag is set to true as shown below:
(c)2017 Apigee Corp. All Rights Reserved 33

b. If you want to validate the target server’s certificate in Edge, then we also need to include the truststore (containing the target server’s certificate) as shown below:
2. If the backend service requires two-way SSL communication, then:
a. You need to have SSLInfo attributes with ClientAuthEnabled, Keystore, KeyAlias, and Truststore flags set appropriately, as shown below:
(c)2017 Apigee Corp. All Rights Reserved 34

References Load balancing across backend servers
EOFException from the Backend Server
1. Check the Message Processor logs (/opt/apigee/var/log/edge-message-processor/logs/system.log ) and search if you have got “eof unexpected” for the specific API or if you have the unique messageid for the API request, then you can search for it.
(c)2017 Apigee Corp. All Rights Reserved 35

Sample exception stack trace from Message Processor log
In the above example, you can see that the “java.io.EOFException: eof unexpected” error occurred while Message Processor is trying to read a response from the backend server. This exception indicates the the end of file (EOF), or the end of stream has been reached unexpectedly.
That is, the Message Processor sent the API request to the backend server and was waiting or reading the response. However, the backend server terminated the connection abruptly before the Message Processor got the response or could read the complete response.
2. Check your backend server logs and see if there are any errors or information that
could have led the backend server to terminate the connection abruptly. If you find any errors/information, then go to Resolution step and fix the issue appropriately in your backend server.
3. If you don’t find any errors or information in your backend server, collect the tcpdump output on the Message Processor(s):
a. If your backend server has a single IP address then use the following command: tcpdump -i any -s 0 host <IP address> -w <File name>
(c)2017 Apigee Corp. All Rights Reserved 36

b. If your backend server has multiple IP addresses, then use the following command: tcpdump -i any -s 0 host <Hostname> -w <File name>
Note: If you are running this command on the Message Processor, use the IP address/hostname of the backend server. You can also take the tcpdump on the backend server. If you are running the command on the backend server, use the IP address of the Message Processor.
Typically, this error is caused because the backend server responds back with [FIN,ACK] as soon as the Message Processor sends the request to the backend server.
4. Consider the following tcpdump example.
Sample tcpdump taken when 502 Bad Gateway Error (Unexpected EOF) occurred
5. From the TCPDump output, you notice the following sequence of events: a. The Message Processor sends the API request to the backend server. b. The backend server immediately responds back with [FIN,ACK].
(c)2017 Apigee Corp. All Rights Reserved 37

c. This is followed by the Message Processor responding with [FIN,ACK] to the backend server.
d. Eventually the connections are closed with [ACK] and [RST] from both the sides.
e. Since the backend server sends [FIN,ACK], you get the exception “java.io.EOFException: eof unexpected” exception on the Message Processor.
6. This can happen if there’s a network issue at the backend server. Engage your
network operations team to investigate this issue further. Resolution Fix the issue on the backend server appropriately. If the issue persists and you need assistance troubleshooting 502 Bad Gateway Error or you suspect that it’s an issue within Edge, contact Apigee Support.
(c)2017 Apigee Corp. All Rights Reserved 38

503 Service Unavailable Description The client application receives an HTTP status code of 503 with the message “Service Unavailable” as a response for the API calls. Error Messages Client application gets one of the following response codes:
OR
The following error message may also be observed:
Overview of 503 Service Unavailable The HTTP status code of 503 means that the server is currently unavailable. Most of the time this error occurs because the server is too busy or the server is temporarily under maintenance. It could also occur if the client is unable to connect to the server or the SSL handshake fails between the client and the server.
(c)2017 Apigee Corp. All Rights Reserved 39
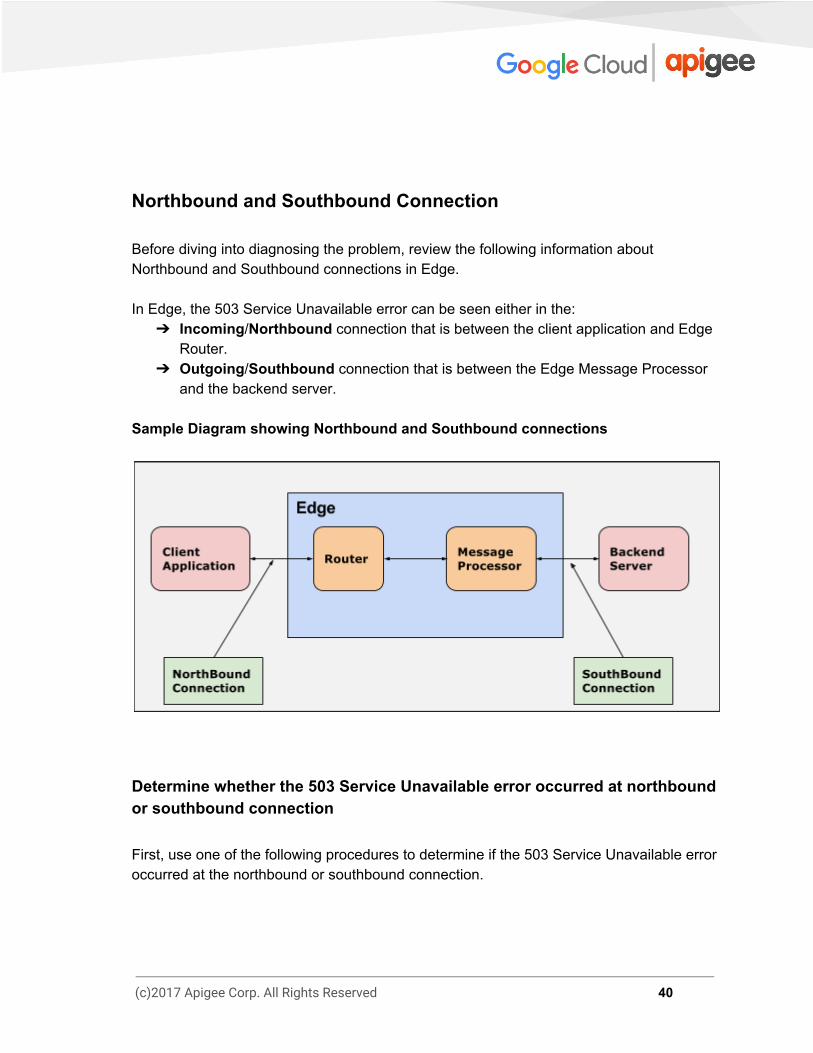
Northbound and Southbound Connection Before diving into diagnosing the problem, review the following information about Northbound and Southbound connections in Edge. In Edge, the 503 Service Unavailable error can be seen either in the:
➔ Incoming/Northbound connection that is between the client application and Edge Router.
➔ Outgoing/Southbound connection that is between the Edge Message Processor and the backend server.
Sample Diagram showing Northbound and Southbound connections
Determine whether the 503 Service Unavailable error occurred at northbound or southbound connection First, use one of the following procedures to determine if the 503 Service Unavailable error occurred at the northbound or southbound connection.
(c)2017 Apigee Corp. All Rights Reserved 40

Procedure 1: Using UI Trace
1. If the issue is still active, enable the UI trace for the affected API.
2. If the UI trace for the failing API request shows that the 503 Service Unavailable error occurs during the target request flow or is sent by the backend server, then the issue is southbound, between the Message Processor and the backend server.
3. If you don’t get the trace for the specific API call, then the issue is northbound, between the client application and the Router.
Procedure 2: Using Nginx Access Logs If the issue has happened in the past or if the issue is intermittent and you are unable to capture the trace, then perform the following steps:
1. Check the Nginx access logs (/opt/apigee/var/log/edge-router/nginx/<org>~<env>.<port#>_access_log ).
2. Search if there are any 503 Errors for specific API proxy.
3. If you can identify any 503 Errors for the specific API at the specific time, then the
issue occurred at the southbound between the Message Processor and the backend server.
4. If not, then the issue occurred at the northbound connection between the client application and the Router.
Causes The typical causes for the HTTP status code - 503 Service Unavailable are:
Cause Details
Overloaded Server Server is overloaded and cannot handle any new incoming requests.
(c)2017 Apigee Corp. All Rights Reserved 41

Connection Errors Server could not be connected due to network/connectivity issues.
SSL Handshake Failures SSL handshake failure between the client and server.
Overloaded Server
1. Typically you will see the following error when the server is overloaded or cannot handle any more requests:
2. Determine whether the 503 Service Unavailable error occurred at northbound or southbound connection:
a. If the error is on the northbound, then check if the Average Load/CPU/Memory usage is high on the Edge Router.
b. If the error is on the southbound, then check if the Average Load/CPU/Memory usage is high on the backend server.
Resolution If the Edge router or backend server is overloaded, then:
1. Restart the appropriate server (Edge Router or backend server) and then monitor the server to see if the problem is resolved.
2. If the problem persists, then check if you need to increase the capacity of the appropriate server.
(c)2017 Apigee Corp. All Rights Reserved 42

Connection Errors You get the connection errors when the Message Processor attempts to connect to the backend server and if:
● It is unable to connect within the preset connection timeout period (Default connection timeout period-3 seconds), OR
● If the connection is refused by the backend server. Steps to Diagnose
1. Check the /opt/apigee/var/log/edge-message-processor/logs/system.log on Message Processors for any of the following errors:
a. onConnectTimeout Error indicates that Message Processor was unable to connect to the backend server within the preset connection time out period.
b. java.net.ConnectException: Connection refused indicates the connection was refused by the backend server.
(c)2017 Apigee Corp. All Rights Reserved 43

2. Check if you are able to connect to the specific backend server directly from each of the Message Processors using the telnet command:
a. If the backend server resolves to a single IP address, then use the following command: telnet <BackendServer-IPaddress> 443
b. If the backend server resolves to multiple IP addresses, then use the following command: telnet <BackendServer-HostName> 443
3. If you are able to connect to the backend server, then you may see message like
“Connected to <BackendServer>”. If you are unable to connect to the backend server, this might be because the Message Processors’ IP addresses are not whitelisted on the specific backend server.
Resolution Whitelist the Message Processors’ IP addresses on the specific backend server to allow the traffic from Edge Message Processors to your backend server. For example, On Linux, you could use iptables to white list or allow the traffic from Message Processor’s IP addresses on the backend server.
(c)2017 Apigee Corp. All Rights Reserved 44

SSL Handshake Failures Description A failure that is observed during SSL handshake process between two processes is known as SSL Handshake Failure. Error Messages
The following error messages may also be observed:
Overview of SSL Handshake SSL Handshake is a process that enables the SSL/TLS client and server to establish the secret keys with which they can communicate. During this process they
1. Agree on the version of the protocol to use. 2. Select the cryptographic algorithm to be used. 3. Authenticate each other by exchanging and validating digital certificates.
If the SSL Handshake succeeds, then the SSL/TLS client and server transfer the data to each other. Otherwise, if SSL Handshake failure occurs the connection will be terminated. The end user will usually see a 503 Service Unavailable error in Apigee Edge setup. Causes The typical causes for SSL Handshake failure are:
(c)2017 Apigee Corp. All Rights Reserved 45
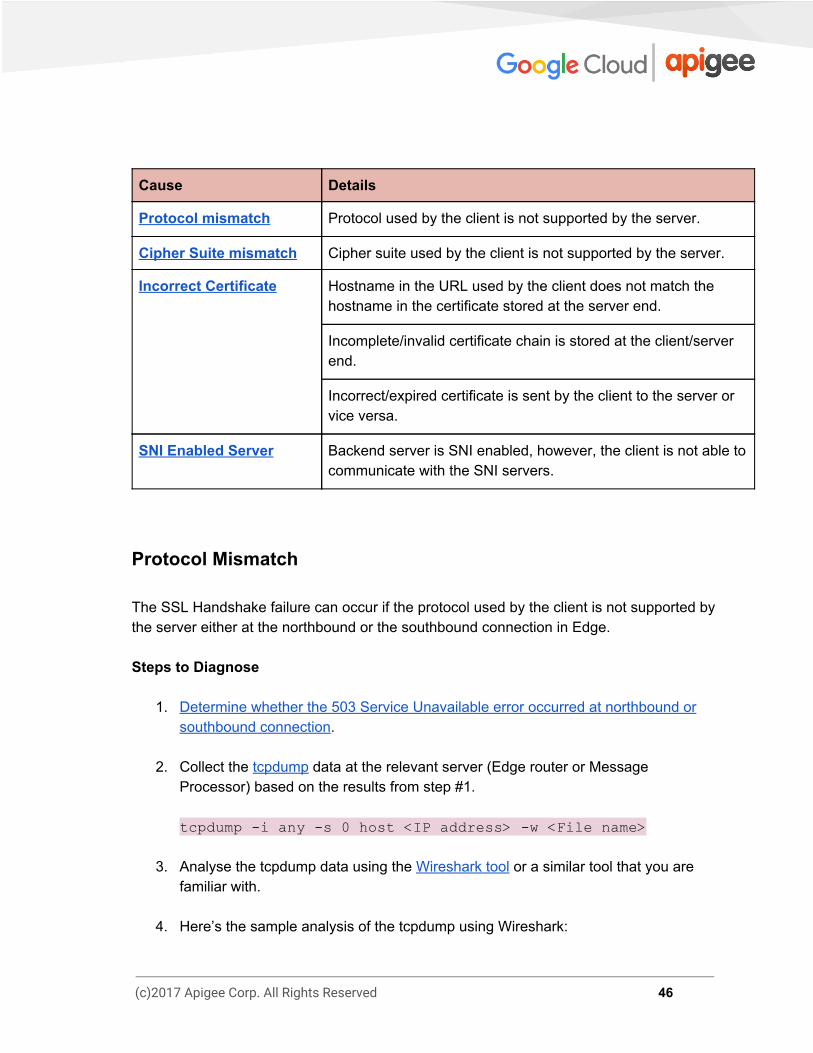
Cause Details
Protocol mismatch Protocol used by the client is not supported by the server.
Cipher Suite mismatch Cipher suite used by the client is not supported by the server.
Incorrect Certificate Hostname in the URL used by the client does not match the hostname in the certificate stored at the server end.
Incomplete/invalid certificate chain is stored at the client/server end.
Incorrect/expired certificate is sent by the client to the server or vice versa.
SNI Enabled Server Backend server is SNI enabled, however, the client is not able to communicate with the SNI servers.
Protocol Mismatch The SSL Handshake failure can occur if the protocol used by the client is not supported by the server either at the northbound or the southbound connection in Edge. Steps to Diagnose
1. Determine whether the 503 Service Unavailable error occurred at northbound or southbound connection.
2. Collect the tcpdump data at the relevant server (Edge router or Message Processor) based on the results from step #1. tcpdump -i any -s 0 host <IP address> -w <File name>
3. Analyse the tcpdump data using the Wireshark tool or a similar tool that you are familiar with.
4. Here’s the sample analysis of the tcpdump using Wireshark:
(c)2017 Apigee Corp. All Rights Reserved 46

○ In this example, the SSL handshake failure occurred between the Message Processor and the backend server (southbound connection).
○ The message #4 in the tcpdump below shows that the Message Processor (source) sent a “Client Hello” message to the backend server (destination) .
○ Selecting the Client Hello message shows that the Message Processor is using the TLSv1.2 protocol.
○ The message #5 shows that the backend server acknowledges the Client Hello message from the Message Processor.
○ Backend server immediately sends a Fatal Alert : Close Notify to the Message Processor (message #6). This means the SSL Handshake failed and the connection will be closed.
○ Looking further into message #6 shows that cause for SSL handshake failure is that the backend server supports only TLSv1.0 protocol as shown
(c)2017 Apigee Corp. All Rights Reserved 47

in the figure below:
○ Since there is a mismatch between the protocol used by the Message Processor and the backend server, the backend server sent the Fatal Alert Message: Close Notify.
Resolution The Message Processor runs on Java 8 and uses TLSv1.2 protocol by default. If the backend server does not support TLSv1.2 protocol, then you need to update the Message Processor to use TLSv1.0 protocol for communicating with the backend server. Here are the steps to enforce the Message Processor to use TLSv1.0 protocol:
1. If you are using a target server, then set the Protocol as TLSv1.0 in the target server configuration; otherwise, set it in the target endpoint definition. The following figure shows how to set the protocol to TLSv1.0 in the target endpoint:
(c)2017 Apigee Corp. All Rights Reserved 48

Cipher Mismatch The SSL handshake failure can be seen if the cipher suite algorithm used by the client is not supported by the server either at the northbound or the southbound connection in Edge. Steps to Diagnose
1. Determine whether the 503 Service Unavailable error occurred at northbound or southbound connection.
2. Collect the tcpdump data at the relevant server (Edge Router or Message Processor) based on the results from step #1: tcpdump -i any -s 0 host <IP address> -w <File name>
3. Analyse the tcpdump data using the Wireshark tool or any other tool that you are familiar with.
4. Here’s the sample analysis of the tcpdump using Wireshark:
(c)2017 Apigee Corp. All Rights Reserved 49

○ In this example, the SSL Handshake failure occurred between the Client application and Edge router (northbound connection).
○ The message #4 in the tcpdump below shows that the client application (source) sent a “Client Hello” message to the Edge Router (destination).
○ Selecting the Client Hello message shows that the client application is using the TLSv1.2 protocol.
○ The message #5 shows that the Edge Router acknowledges the Client Hello message from the client application.
○ The Edge router immediately sends a Fatal Alert : Handshake Failure to the client application (message #6). This means the SSL Handshake failed and the connection will be closed.
○ Looking further into message #6 shows the following information:
(c)2017 Apigee Corp. All Rights Reserved 50

■ The Edge Router supports TLSv1.2 protocol. This means that the protocol matches between the client application and the Edge Router.
■ However, the Edge router still sends the Fatal Alert: Handshake Failure to the client application as shown in the figure below:
○ The error could be the result of one of the following issues: ■ The client application is not using the cipher suite algorithms
supported by the Edge Router. ■ The Edge Router is SNI-enabled, but the client application is not
sending the server name.
○ Message #4 in the tcpdump lists the cipher suite algorithms supported by the client application.
○ The list of cipher suite algorithms supported by the Edge Router are listed in the /opt/nginx/conf.d/0-default.conf file. In this example, the Edge Router supports only the High Encryption cipher suite algorithms.
(c)2017 Apigee Corp. All Rights Reserved 51
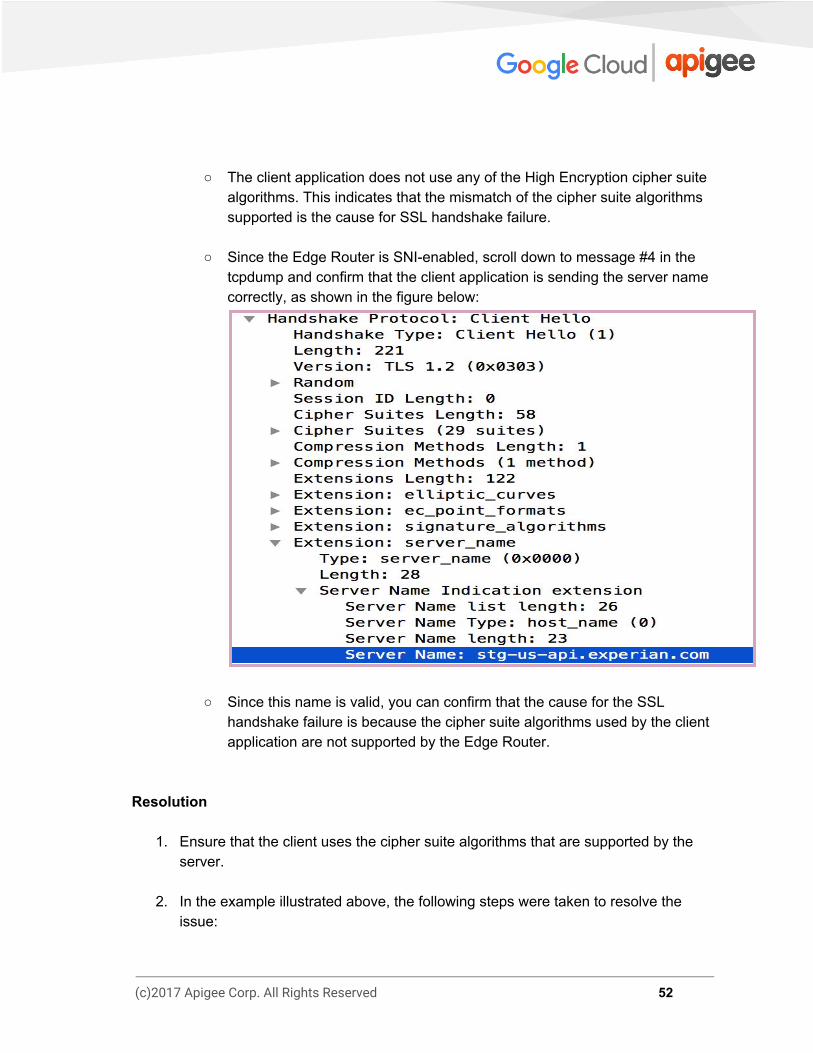
○ The client application does not use any of the High Encryption cipher suite algorithms. This indicates that the mismatch of the cipher suite algorithms supported is the cause for SSL handshake failure.
○ Since the Edge Router is SNI-enabled, scroll down to message #4 in the
tcpdump and confirm that the client application is sending the server name correctly, as shown in the figure below:
○ Since this name is valid, you can confirm that the cause for the SSL handshake failure is because the cipher suite algorithms used by the client application are not supported by the Edge Router.
Resolution
1. Ensure that the client uses the cipher suite algorithms that are supported by the server.
2. In the example illustrated above, the following steps were taken to resolve the
issue:
(c)2017 Apigee Corp. All Rights Reserved 52
a. Confirmed that both client application and Edge Router were using Java 8.
b. As identified above, the Edge Router was using the High Encryption cipher suite algorithms.
c. However, the client was using the default Java 8 installation so the High Encryption cipher suite algorithms were not available.
d. The solution was to download and install the Java Cryptography Extension (JCE) package and include it in the Java installation to support High Encryption cipher suite algorithms.
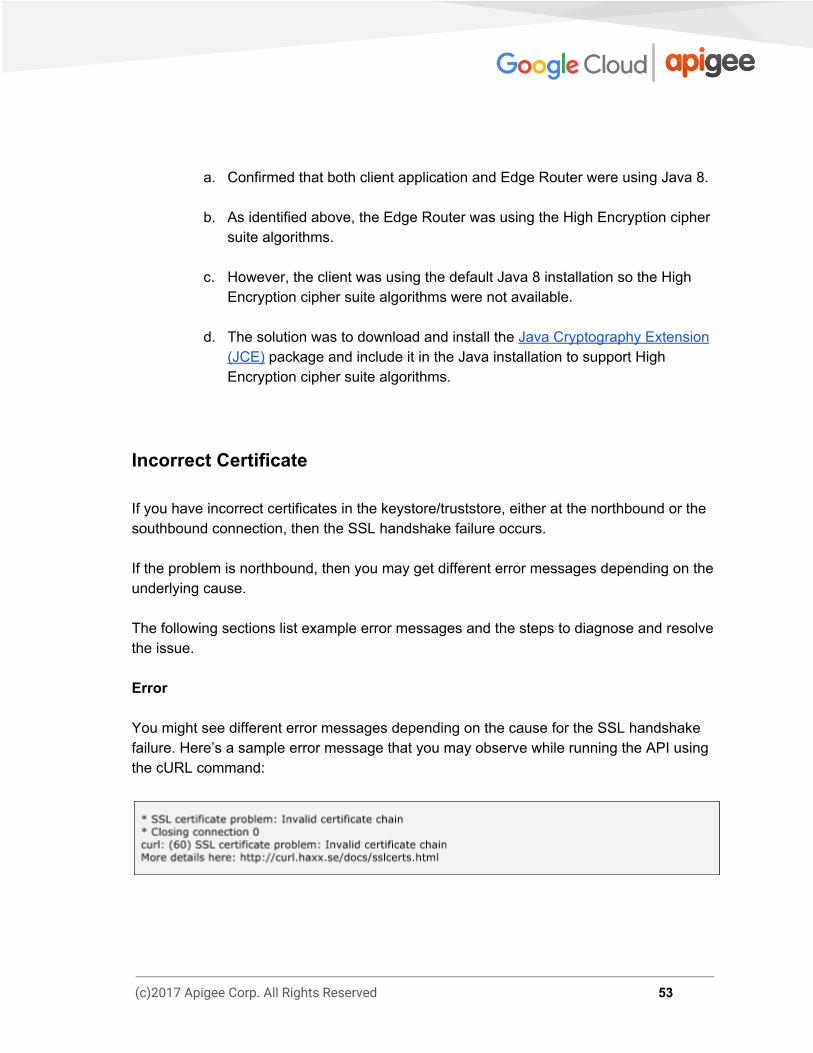
Incorrect Certificate If you have incorrect certificates in the keystore/truststore, either at the northbound or the southbound connection, then the SSL handshake failure occurs. If the problem is northbound, then you may get different error messages depending on the underlying cause. The following sections list example error messages and the steps to diagnose and resolve the issue. Error You might see different error messages depending on the cause for the SSL handshake failure. Here’s a sample error message that you may observe while running the API using the cURL command:
(c)2017 Apigee Corp. All Rights Reserved 53
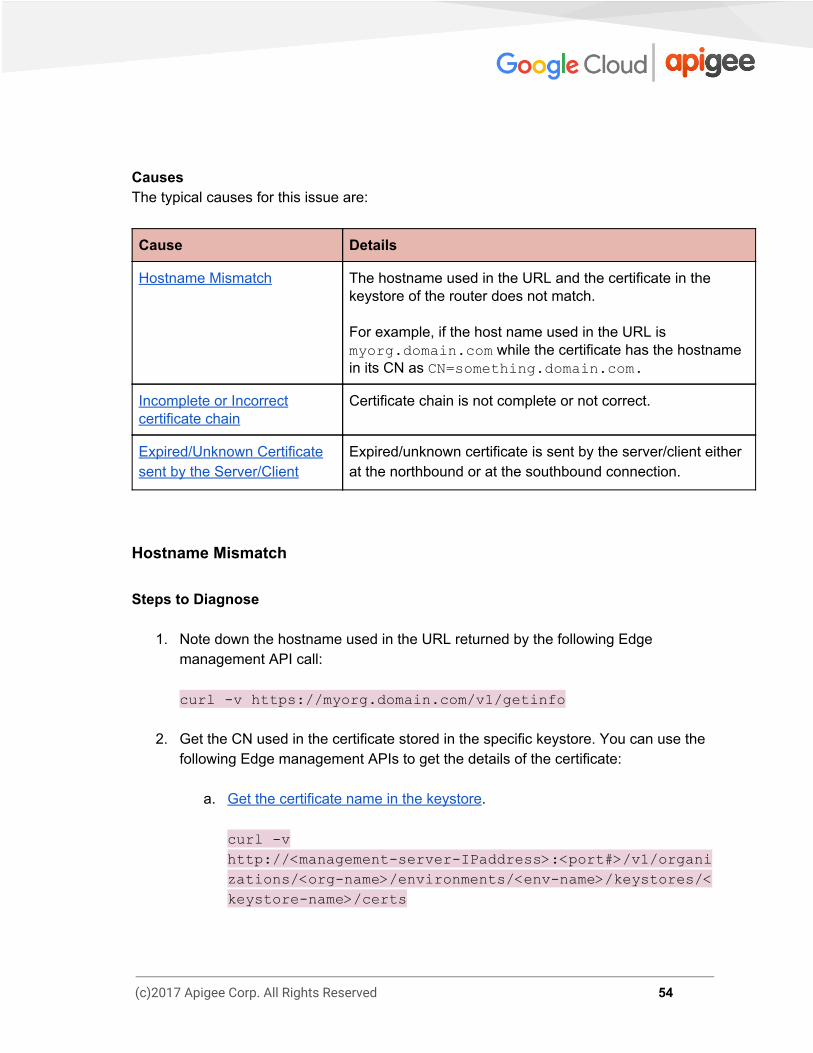
Causes The typical causes for this issue are:
Cause Details
Hostname Mismatch The hostname used in the URL and the certificate in the keystore of the router does not match. For example, if the host name used in the URL is myorg.domain.com while the certificate has the hostname in its CN as CN=something.domain.com.
Incomplete or Incorrect certificate chain
Certificate chain is not complete or not correct.
Expired/Unknown Certificate sent by the Server/Client
Expired/unknown certificate is sent by the server/client either at the northbound or at the southbound connection.
Hostname Mismatch Steps to Diagnose
1. Note down the hostname used in the URL returned by the following Edge management API call: curl -v https://myorg.domain.com/v1/getinfo
2. Get the CN used in the certificate stored in the specific keystore. You can use the following Edge management APIs to get the details of the certificate:
a. Get the certificate name in the keystore. curl -v http://<management-server-IPaddress>:<port#>/v1/organi
zations/<org-name>/environments/<env-name>/keystores/<
keystore-name>/certs
(c)2017 Apigee Corp. All Rights Reserved 54

b. Get the details of the certificate in the keystore. curl -v http://<management-server-IPaddress>:<port#>/v1/organi
zations/<org-name>/environments/<env-name>/keystores/<
keystore-name>/certs/<cert-name>
For example, here’s a sample cert:
The subject name in the primary certificate has the CN as something.domain.com.
Since the hostname used in the API request URL (refer to step#1 above) and the subject name in the certificate don’t match, you get the SSL Handshake failure. Resolution This issue can be resolved in one of the following two ways:
(c)2017 Apigee Corp. All Rights Reserved 55

1. Obtain a certificate (if you don’t have one already) with subject CN having a wildcard certificate, then upload the new complete certificate chain to the keystore. For example: "subject": "CN=*.domain.com, OU=Domain Control Validated, O=*.domain.com",
2. Obtain a certificate (if you don’t have one already) with existing subject CN, but
having myorg.domain.name as a subject alternative name, then upload the complete certificate chain to the keystore.
References Keystores and Truststores
Incomplete or Incorrect certificate chain Steps to Diagnose
1. Get the complete certificate chain used in the certificate stored in the specific keystore. You can use the following Edge management APIs to get the details of the certificate:
a. Get the certificate name in the keystore. curl -v http://<management-server-IPaddress>:<port#>/v1/organi
zations/<org-name>/environments/<env-name>/keystores/<
keystore-name>/certs
b. Get the details of the certificate in the keystore.
curl -v http://<management-server-IPaddress>:<port#>/v1/organi
zations/<org-name>/environments/<env-name>/keystores/<
keystore-name>/certs/<cert-name>
(c)2017 Apigee Corp. All Rights Reserved 56
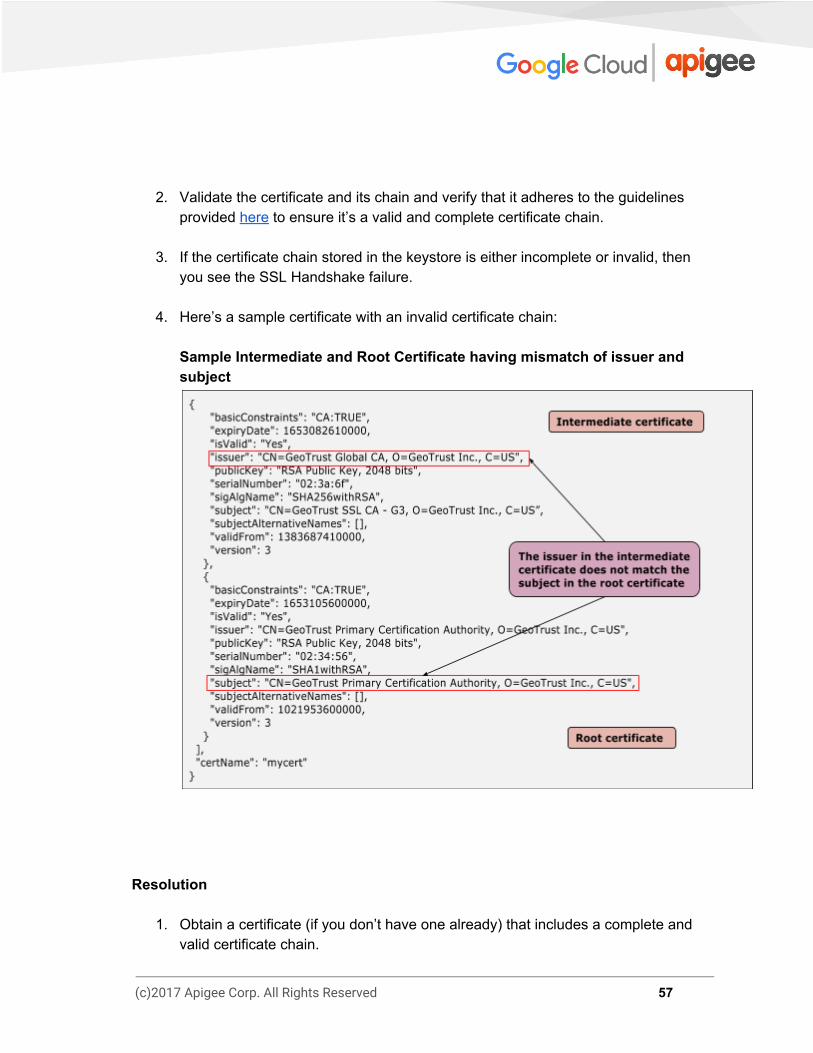
2. Validate the certificate and its chain and verify that it adheres to the guidelines
provided here to ensure it’s a valid and complete certificate chain.
3. If the certificate chain stored in the keystore is either incomplete or invalid, then you see the SSL Handshake failure.
4. Here’s a sample certificate with an invalid certificate chain:
Sample Intermediate and Root Certificate having mismatch of issuer and subject
Resolution
1. Obtain a certificate (if you don’t have one already) that includes a complete and valid certificate chain.
(c)2017 Apigee Corp. All Rights Reserved 57

2. Run the following openssl command to verify that the certificate chain is correct
and complete: openssl verify -CAfile <root-cert> -untrusted <intermediate-cert> <main-cert>
3. Upload the validated certificate chain to the keystore.
Expired/Unknown Certificate sent by the Server/Client If an incorrect/expired certificate is sent by the server/client either at the northbound or at the southbound connection, then the other end (server/client) rejects the certificate leading to an SSL handshake failure. Steps to Diagnose
1. Determine whether the 503 Service Unavailable error occurred at the northbound or southbound connection.
2. Collect the tcpdump data at the relevant server (Edge Router or Message Processor) based on the outcome from step #1: tcpdump -i any -s 0 host <IP address> -w <File name>
3. Analyze the tcpdump data using Wireshark or a similar tool that you are familiar with.
4. From the tcpdump, determine the host (client or server) that is rejecting the certificate during the verification step.
5. You can retrieve the certificate sent from the other end from the tcpdump, provided the data is not encrypted. This will be useful to compare if this certificate matches with the certificate available in the truststore.
6. Review the sample tcpdump for the SSL communication between the Message Processor and the backend server and understand how to get the information mentioned in step#4 and #5.
(c)2017 Apigee Corp. All Rights Reserved 58

Sample tcpdump showing Certificate Unknown Error
a. The Message Processor (client) sends the Client Hello to the backend server (server) in message #59.
b. The backend server sends the Server Hello to the Message Processor in message #61.
c. They mutually validate the protocol and cipher suite algorithms used.
d. The backend server sends the Certificate and Server Hello Done message to the Message Processor in message #68.
e. The Message Processor sends the Fatal Alert “Description: Certificate Unknown” in message #70.
f. Looking further into message #70, there are no additional details details other than alert message as shown below:
(c)2017 Apigee Corp. All Rights Reserved 59

g. Review message #68 to get the details about the certificate sent by the backend server.
h. The backend server’s certificate and its complete chain are all available underneath “Certificates,” as shown in the above figure.
7. If the certificate is found to be unknown either by the Router (northbound) or the Message Processor (southbound) as in the example illustrated above, then follow these steps:
a. Get the certificate and its chain that is stored in the specific truststore. (Refer to the virtual host configuration for the Router and target endpoint configuration for the Message Processor). You can use the following APIs to get the details of the certificate:
i. Get the certificate name in the truststore. curl -v http://<management-server-IPaddress>:<port#>/v1/o
rganizations/<org-name>/environments/<env-name>/k
(c)2017 Apigee Corp. All Rights Reserved 60

eystores/<truststore-name>/certs
. ii. Get the details of the certificate in the truststore
curl -v http://<management-server-IPaddress>:<port#>/v1/o
rganizations/<org-name>/environments/<env-name>/k
eystores/<truststore-name>/certs/<cert-name>
b. Check if the certificate stored in the truststore of the Router (northbound) or Message Processor (southbound) matches with the certificate that is stored in the keystore of the client application (northbound) or target server (southbound), or the one that is obtained from the tcpdump. If there’s a mismatch, then that’s the cause for the SSL Handshake failure.
8. If the certificate is found to be unknown either by the client application (northbound)
or the target server (southbound), then follow these steps:
a. Get the complete certificate chain used in the certificate stored in the specific keystore. (Refer to the virtual host configuration for the Router and target endpoint configuration for the Message Processor.) You can use the following APIs to get the details of the certificate:
i. Get the certificate name in the keystore. curl -v http://<management-server-IPaddress>:<port#>/v1/o
rganizations/<org-name>/environments/<env-name>/k
eystores/<keystore-name>/certs
ii. Get the details of the certificate in the keystore.
curl -v http://<management-server-IPaddress>:<port#>/v1/o
rganizations/<org-name>/environments/<env-name>/k
eystores/<keystore-name>/certs/<cert-name>
b. Check if the certificate stored in the keystore of the Router (northbound) or Message Processor (southbound) matches the certificate stored in the
(c)2017 Apigee Corp. All Rights Reserved 61
truststore of the client application (northbound) or target server (southbound), or the one that is obtained from the tcpdump. If there’s a mismatch, then that’s the cause for the SSL handshake failure.
9. If the certificate sent by a server/client is found to be expired then the receiving
client/server rejects the certificate and you will see the following alert message in the tcpdump: Alert (Level: Fatal, Description: Certificate expired)
10. Verify that the certificate in the keystore of the appropriate host is expired. Resolution To resolve the issue identified in the example above, upload the valid backend server’s certificate to the trustore on the Message Processor. The following table summarizes the steps to resolve an issue based on a number of causes.
Cause Details Steps to Resolve
Expired Certificate
NorthBound ● Certificate stored on the keystore
of the router is expired. ● Certificate stored on the keystore
of the client application is expired (2-way SSL).
Upload a new certificate and its complete chain to the keystore on the appropriate host.
SouthBound ● Certificate stored on the keystore
of the Target Server is expired. ● Certificate stored on the keystore
of the Message Processor is expired (2-way SSL).
Upload a new certificate and its complete chain to the keystore on the appropriate host.
Unknown Certificate
NorthBound ● Certificate stored on the truststore
of the client application does not match the Router’s certificate.
● Certificate stored on the truststore
Upload the valid certificate to the truststore on the appropriate host.
(c)2017 Apigee Corp. All Rights Reserved 62
of the router does not match the client application’s certificate (2 way SSL).
SouthBound ● Certificate stored on the truststore
of the target server does not match the Message Processor’s certificate.
● Certificate stored on the truststore of the Message Processor does not match the target server’s certificate (2-way SSL).
Upload the valid certificate to the truststore on the appropriate host.
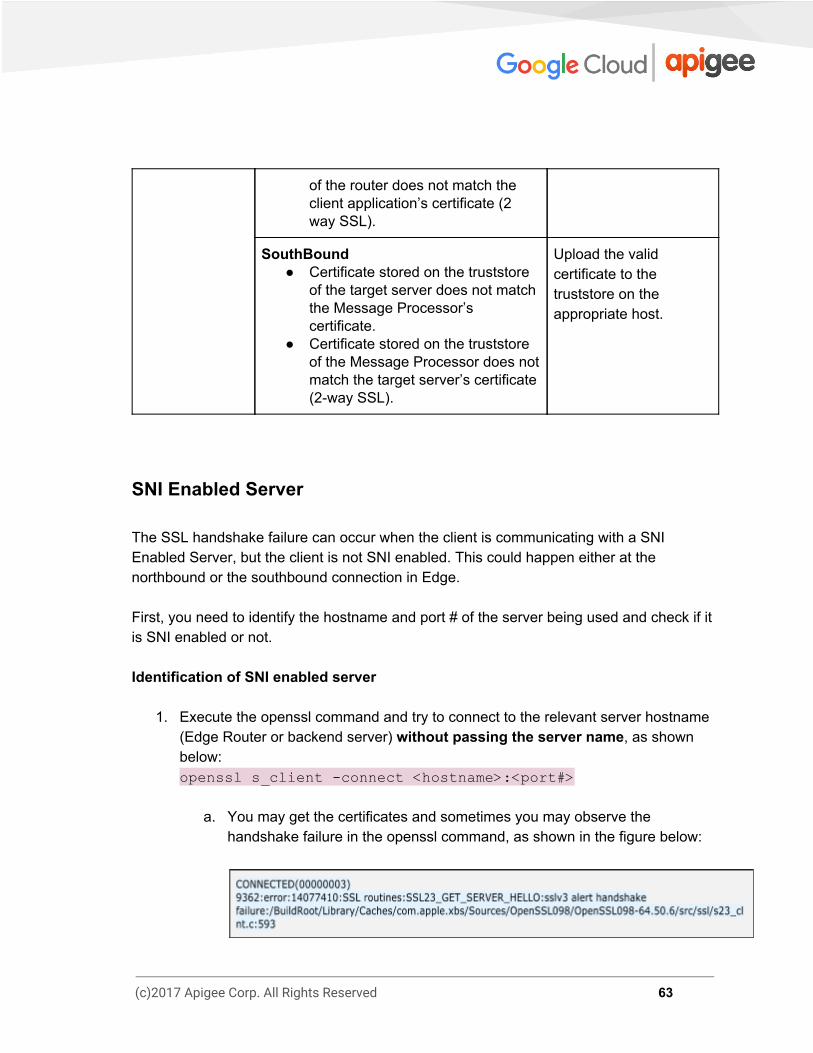
SNI Enabled Server The SSL handshake failure can occur when the client is communicating with a SNI Enabled Server, but the client is not SNI enabled. This could happen either at the northbound or the southbound connection in Edge. First, you need to identify the hostname and port # of the server being used and check if it is SNI enabled or not. Identification of SNI enabled server
1. Execute the openssl command and try to connect to the relevant server hostname (Edge Router or backend server) without passing the server name, as shown below: openssl s_client -connect <hostname>:<port#>
a. You may get the certificates and sometimes you may observe the handshake failure in the openssl command, as shown in the figure below:
(c)2017 Apigee Corp. All Rights Reserved 63
2. Execute the the openssl command and try to connect to the relevant server
hostname (Edge router or backend server) by passing the server name as shown below: openssl s_client -connect <hostname>:<port#> -servername <hostname>
3. If you get a handshake failure in step #1 or get different certificates in step #1 and step #2, then it indicates that the specified Server is SNI enabled.
Once you’ve identified that the server is SNI enabled, you can follow the steps below to check if the SSL handshake failure is caused by the client not being able to communicate with the SNI server. Steps to Diagnose
1. Determine whether the 503 Service Unavailable error occurred at the northbound or southbound connection.
2. Collect the tcpdump at the relevant server (Edge Router or Message Processor) based on the outcome from step #1: tcpdump -i any -s 0 host <IP address> -w <File name>
3. Analyze the tcpdump using Wireshark or a similar tool that you are familiar with.
4. Here’s the sample analysis of tcpdump using Wireshark:
a. In this example, the SSL handshake failure occurred between the Edge Message Processor and backend server (southbound connection).
b. The message #4 in the tcpdump below shows that the Message Processor (source) sent a “Client Hello” message to the backend server (destination).
(c)2017 Apigee Corp. All Rights Reserved 64
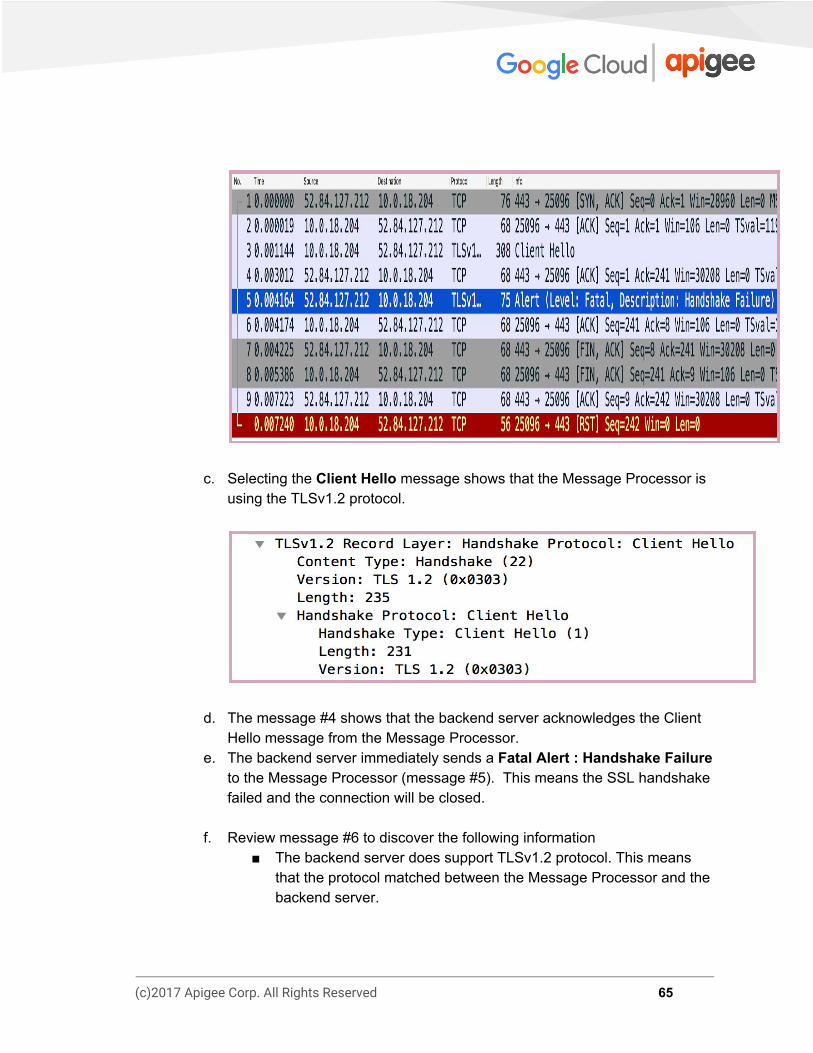
c. Selecting the Client Hello message shows that the Message Processor is using the TLSv1.2 protocol.
d. The message #4 shows that the backend server acknowledges the Client Hello message from the Message Processor.
e. The backend server immediately sends a Fatal Alert : Handshake Failure to the Message Processor (message #5). This means the SSL handshake failed and the connection will be closed.
f. Review message #6 to discover the following information ■ The backend server does support TLSv1.2 protocol. This means
that the protocol matched between the Message Processor and the backend server.
(c)2017 Apigee Corp. All Rights Reserved 65

■ However, the backend server still sends the Fatal Alert: Handshake Failure to the Message Processor as shown in the figure below:
g. This error might occur for one of the following reasons: ■ The Message Processor is not using the cipher suite algorithms
supported by the backend server. ■ The backend server is SNI enabled, but the client application is not
sending the server name.
h. Review the message #3 (Client Hello) in the tcpdump in more detail. Note that the Extension: server_name is missing, as shown below:
(c)2017 Apigee Corp. All Rights Reserved 66

i. This confirms that the Message Processor did not send the server_name to the SNI-enabled backend server.
j. This is the cause for the SSL handshake failure and the reason that the backend server sends the Fatal Alert: Handshake Failure to the Message Processor.
5. Verify that the jsse.enableSNIExtension property in system.properties is set to false on the Message Processor to confirm that the Message Processor is not enabled to communicate with the SNI-enabled server.
Resolution Enable the Message Processor(s) to communicate with SNI enabled servers by performing the following steps:
1. Create the/opt/apigee/customer/application/message-processor.properties file (if it does not exist already).
2. Add the following line into this file:
conf_system_jsse.enableSNIExtension=true
3. Chown the owner of this file to apigee:apigee.
chown apigee:apigee /opt/apigee/customer/application/message-processor.properti
es
4. Restart the Message Processor.
/opt/apigee/apigee-service/bin/apigee-service
message-processor restart
5. If you have more than one Message Processor, repeat the steps #1 through #4 on all the Message Processors.
(c)2017 Apigee Corp. All Rights Reserved 67

504 Gateway Timeout Description The client application receives an HTTP status code of 504 with the message “Gateway Timeout” as a response for the API calls.
Error Messages Client application gets the following response code:
In some cases, the following error message may also be observed:
Overview of 504 Gateway Timeout The HTTP status code - 504 Gateway Timeout error indicates that the client did not receive a timely response from the Edge Gateway or backend server during the execution of an API.
(c)2017 Apigee Corp. All Rights Reserved 68
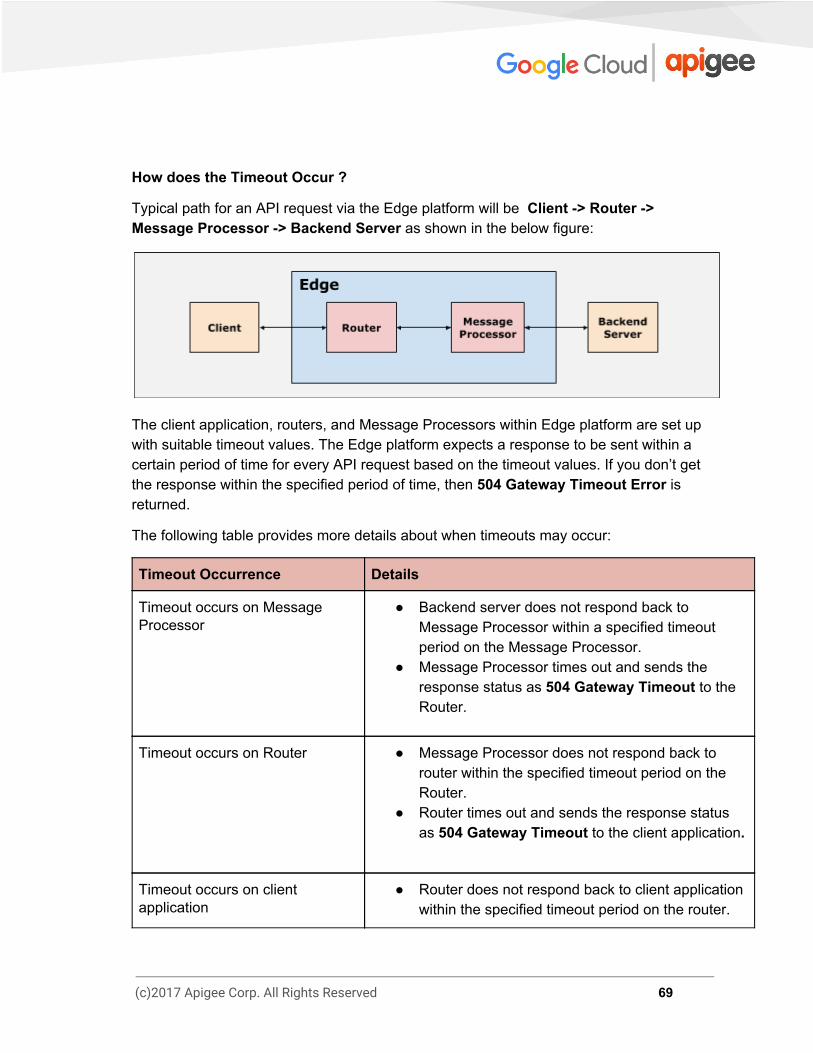
How does the Timeout Occur ?
Typical path for an API request via the Edge platform will be Client -> Router -> Message Processor -> Backend Server as shown in the below figure:
The client application, routers, and Message Processors within Edge platform are set up with suitable timeout values. The Edge platform expects a response to be sent within a certain period of time for every API request based on the timeout values. If you don’t get the response within the specified period of time, then 504 Gateway Timeout Error is returned.
The following table provides more details about when timeouts may occur:
Timeout Occurrence Details
Timeout occurs on Message Processor
● Backend server does not respond back to Message Processor within a specified timeout period on the Message Processor.
● Message Processor times out and sends the response status as 504 Gateway Timeout to the Router.
Timeout occurs on Router ● Message Processor does not respond back to router within the specified timeout period on the Router.
● Router times out and sends the response status as 504 Gateway Timeout to the client application.
Timeout occurs on client application
● Router does not respond back to client application within the specified timeout period on the router.
(c)2017 Apigee Corp. All Rights Reserved 69

● The Client application times out and ends the response status as 504 Gateway Timeout to the end user.
Causes In Edge, the typical causes for 504 Gateway Timeout error are:
Cause Details
Slow Backend Server The backend server that is processing the API request is too slow due to high load or poor performance.
Slow API Proxy processing by Edge
Edge takes a long time to process the API request due to high load or poor performance.
Slow Backend Server If the backend server is very slow and/or taking a long time to process the API request, then you will get a 504 Gateway Timeout error. As explained in the section above, the timeout can occur under one of the following scenarios:
1. Message Processor times out before backend server responds. 2. Router times out before Message Processor/backend server responds. 3. Client application times out before Router/Message Processor/backend server
responds. The following sections describe how to diagnose and resolve the issue under each of these scenarios. Scenario #1 Message Processor times out before Backend Server responds
Steps to Diagnose You can use the following procedures to diagnose if the 504 Gateway Timeout error has occurred because of the slow backend server.
(c)2017 Apigee Corp. All Rights Reserved 70
Procedure #1 Using Trace If the issue is still active (504 Errors are still happening), then follow the below steps:
1. Trace the affected API in Edge UI.Either wait for the error to occur or if you have the API call, then make some API calls and reproduce the 504 Gateway Timeout Error.
2. Once the error has occurred, examine the specific request which shows the response code as 504.
3. Check the elapsed time at each phase and make a note of the phase where most time is spent.
4. If you observe the “Error” with the longest elapsed time immediately after one of the following phases, then it indicates that the backend server is slow or taking a long time to process the request:
○ “Request sent to target server” ○ Service Callout policy
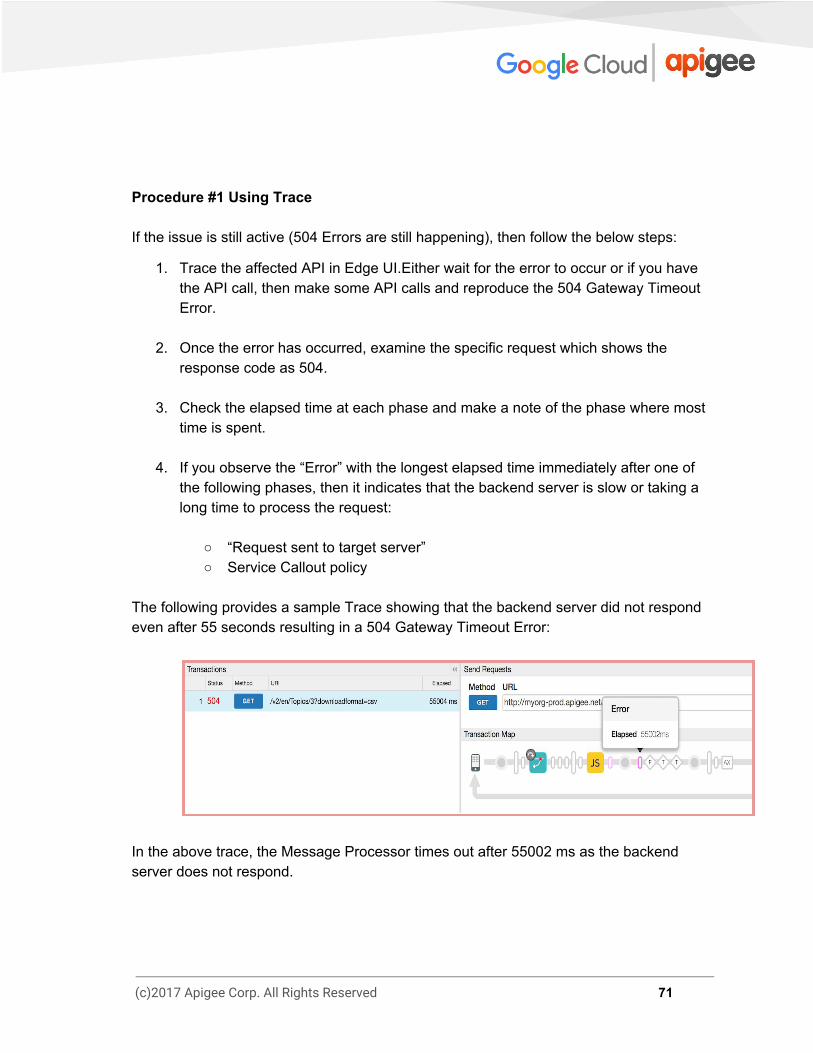
The following provides a sample Trace showing that the backend server did not respond even after 55 seconds resulting in a 504 Gateway Timeout Error:
In the above trace, the Message Processor times out after 55002 ms as the backend server does not respond.
(c)2017 Apigee Corp. All Rights Reserved 71

Procedure #2 Using Message Processor Logs
1. Check the Message Processor’s log (/opt/apigee/var/log/edge-message-processor/logs/system.log )
2. If you find “Gateway Timeout” and “onTimeoutRead” errors for the specific API proxy request at the specific time, then it indicates that the Message Processor has timed out.
Sample Message Processor log showing Gateway Timeout Error
In the above Message Processor log, you notice that the backend server denoted with the IP address XX.XX.XX.XX did not respond even after 55 seconds (lastIO=55000ms). As a result, the Message Processor timed out and sent 504 Gateway Timeout Error.
(c)2017 Apigee Corp. All Rights Reserved 72

Resolution
1. Check why the backend server is taking more than 55 seconds and see if it can be fixed/optimized to respond faster.
2. If it is not possible to fix/optimize the backend server or it is known that the backend server takes a longer time than the configured timeout, then Increase the timeout value on Router and Message Processor to a suitable value.
(c)2017 Apigee Corp. All Rights Reserved 73

Scenario #2 - Router times out before Message Processor/Backend Server responds You might get 504 Gateway Timeout Errors if the router times out before the Message Processor/backend server responds. This can happen under one of the following circumstances:
● The timeout value set on the Router is shorter than the timeout value set on the Message Processor. For example, let’s say the timeout on Router is 50 seconds, while the Message Processor is 55 seconds.
Timeout on Router Timeout on Message Processor
50 seconds 55 seconds
● The timeout value on the Message Processor is overridden with a higher timeout
value using the “io.timeout.millis” property set within the target endpoint configuration of the API Proxy: For example, if the following timeout values are set:
Timeout on Router Timeout on Message Processor
Timeout within API Proxy
57 seconds 55 seconds 120 seconds
But the io.timeout.millis is set to 120 seconds in the API Proxy:
Then, the Message Processor will not timeout after 55 seconds even though it’s timeout value (55 seconds) is less than the timeout value on the router (57 seconds).
(c)2017 Apigee Corp. All Rights Reserved 74
This is because the timeout value of 55 seconds on the Message Processor is overridden by the the value of 120 seconds that is set within the API Proxy. So the timeout value of the Message Processor for this specific API Proxy will be 120 seconds.
Since the Router has a lower timeout value (57 seconds) compared to 120 seconds set within the API Proxy, the router will timeout if the backend server does not respond back after 57 seconds.
Steps to Diagnose
1. Check the Nginx access log (/opt/apigee/var/log/edge-router/nginx/<org>~<env>.<port#>_access_log )
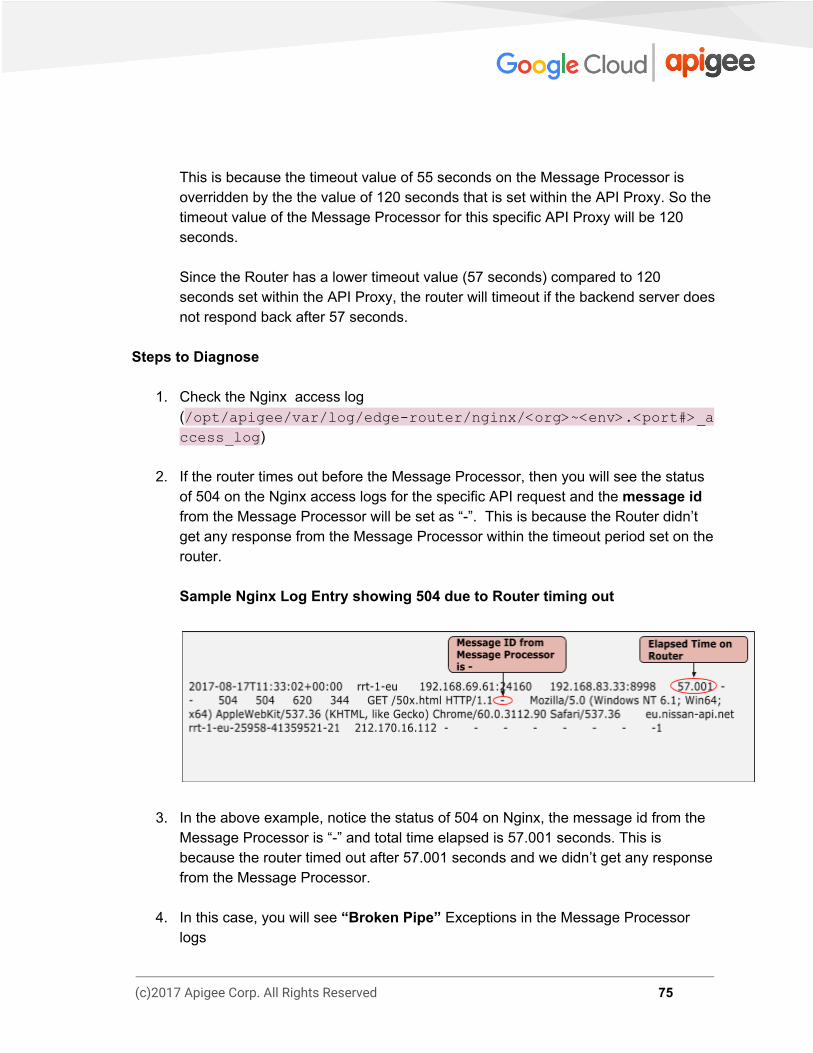
2. If the router times out before the Message Processor, then you will see the status of 504 on the Nginx access logs for the specific API request and the message id from the Message Processor will be set as “-”. This is because the Router didn’t get any response from the Message Processor within the timeout period set on the router. Sample Nginx Log Entry showing 504 due to Router timing out
3. In the above example, notice the status of 504 on Nginx, the message id from the Message Processor is “-” and total time elapsed is 57.001 seconds. This is because the router timed out after 57.001 seconds and we didn’t get any response from the Message Processor.
4. In this case, you will see “Broken Pipe” Exceptions in the Message Processor logs
(c)2017 Apigee Corp. All Rights Reserved 75
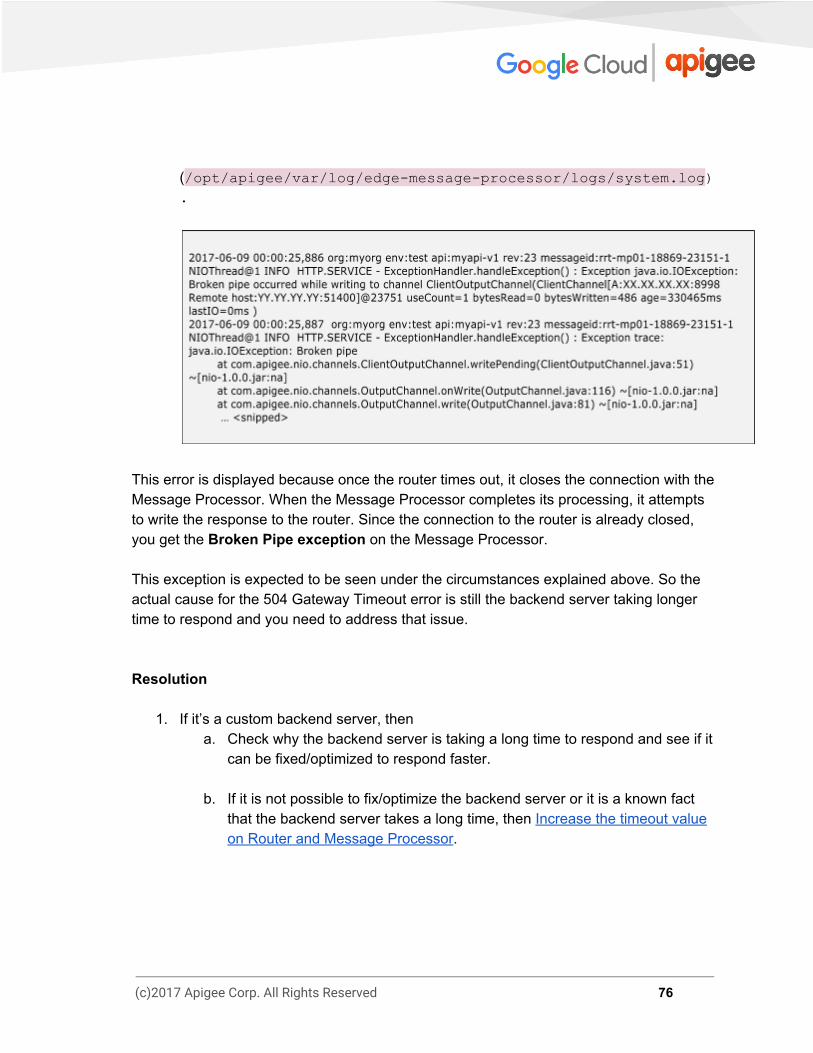
(/opt/apigee/var/log/edge-message-processor/logs/system.log ).
This error is displayed because once the router times out, it closes the connection with the Message Processor. When the Message Processor completes its processing, it attempts to write the response to the router. Since the connection to the router is already closed, you get the Broken Pipe exception on the Message Processor.
This exception is expected to be seen under the circumstances explained above. So the actual cause for the 504 Gateway Timeout error is still the backend server taking longer time to respond and you need to address that issue. Resolution
1. If it’s a custom backend server, then a. Check why the backend server is taking a long time to respond and see if it
can be fixed/optimized to respond faster.
b. If it is not possible to fix/optimize the backend server or it is a known fact that the backend server takes a long time, then Increase the timeout value on Router and Message Processor.
(c)2017 Apigee Corp. All Rights Reserved 76
2. If it’s a NodeJS backend server, then:
a. Check if the NodeJS code makes calls to any other backend server(s) and if it’s taking a long time to return a response. Check why those backend server(s) is taking longer time.
b. Check if the Message Processor(s) is experiencing high CPU or Memory usage:
i. If any Message Processor is experiencing high CPU usage, then generate three thread dumps every 30 seconds using the following command: <JAVA_HOME>/bin/jstack -l <pid> > <filename>
ii. If any Message Processor is experiencing high memory usage then generate a heap dump using the following command: sudo -u apigee <JAVA_HOME>/bin/jmap -dump:live,format=b,file=<filename> <pid>
iii. Restart the Message Processor will bring down the CPU and Memory: /opt/apigee/apigee-service/bin/apigee-service
edge -message-processor restart
iv. Monitor the API calls to confirm if the problem still exists.
v. Contact Apigee Support and provide the thread dumps, heap dump, and Message Processor logs (/opt/apigee/var/log/edge-message-processor/logs/system.log ) to help them investigate the cause for the high CPU/memory usage.
(c)2017 Apigee Corp. All Rights Reserved 77

Scenario #3 - Client Application times out before Router/Message
Processor/Backend Server responds
You might get 504 Gateway Timeout Errors if the client application times out before the backend server responds. This situation can happen if:
1. The timeout value set on the client application is lower than the timeout value set on the router and Message Processor: For example, if the following timeout values are set:.
Timeout on Client Timeout on Router Timeout on Message Processor
50 seconds 57 seconds 55 seconds
If the backend server does not respond back to the Message Processor within 50 seconds, then the client will timeout and close the connection with the router. The client will get the response code of 504. This will cause the Nginx to set a status code of 499 indicating the client closed the connection.
(c)2017 Apigee Corp. All Rights Reserved 78

Steps to Diagnose
1. If the client application times out before the backend server responds, then it will close the connection with the router. In this situation, you will see a status code of 499 in the Nginx access logs for the specific API request. Sample Nginx Log Entry showing status code 499
3. In the above example, note that the status of 499 on the Nginx and total time elapsed is 50.001 seconds. This indicates that the client timed out after 50.001 seconds.
4. In this case, you will see “Broken Pipe” Exceptions in the Message Processor logs (/opt/apigee/var/log/edge-message-processor/logs/system.log ).
5. After the Router times out, it closes the connection with the Message Processor. When the Message Processor completes its processing, it attempts to write the
(c)2017 Apigee Corp. All Rights Reserved 79
response to the Router. Since the connection to the Router is already closed, you get the Broken Pipe exception on the Message Processor.
6. This exception is expected under the circumstances explained above. So the actual cause for the 504 Gateway Timeout error is still that the backend server takes a long time to respond and you need to address that issue.
Resolution
1. If it’s your custom backend server then: a. Check the backend server to determine why it is taking more than 57
seconds and see if it can be fixed/optimized to respond faster.
b. If it is not possible to fix/optimize the backend server or if you know that the backend server will take a long time, then increase the timeout value on router and Message Processor.
2. If it’s a NodeJS backend, then:
a. Check if the NodeJS code makes calls to any other backend server(s) and if that’s taking a long time to return. Check why those backend server(s) is taking longer time.
b. Check if the Message Processor(s) is experiencing high CPU or memory usage:
i. If a Message Processor is experiencing high CPU usage, then generate three thread dumps every 30 seconds using the following command: <JAVA_HOME>/bin/jstack -l <pid> > <filename>
(c)2017 Apigee Corp. All Rights Reserved 80

ii. If a Message Processor is experiencing high memory usage, then generate a heap dump using the following command: sudo -u apigee <JAVA_HOME>/bin/jmap -dump:live,format=b,file=<filename> <pid>
iii. Restarting the Message Processor will ensure that the CPU and Memory will drop down: /opt/apigee/apigee-service/bin/apigee-service
edge -message-processor restart
iv. Monitor the API calls to confirm if the problem still exists.
v. Contact Apigee Support and provide the thread dumps, heap dump, and Message Processor logs (/opt/apigee/var/log/edge-message-processor/logs/system.log ) to help them investigate the cause for the high CPU/memory usage.
Increase the timeout value on Router and Message Processor Choose the timeout values to be set on the Router and Message Processor carefully depending on your requirements. Don’t set arbitrarily large timeout values. If you need assistance, contact Apigee Support. Router
1. Create the /opt/apigee/customer/application/router.properties file on the Router machine, if it does not already exist.
2. Add the following line to this file: conf_load_balancing_load.balancing.driver.proxy.read.timeou
t=<time in seconds>
For example, if you want to set the timeout value of 120 seconds, then set it as follows:
(c)2017 Apigee Corp. All Rights Reserved 81

conf_load_balancing_load.balancing.driver.proxy.read.timeou
t=120
3. Ensure this file is owned by apigee: chown apigee:apigee /opt/apigee/customer/application/router.properties
4. Restart the router: /opt/apigee/apigee-service/bin/apigee-service edge -router restart
5. If you have more than one router, repeat the above steps on all the routers. Message Processor
1. Create /opt/apigee/customer/application/message-processor.properti
es file on the Message Processor machine, if it does not already exist.
2. Add the following line to this file: conf_http_HTTPTransport.io.timeout.millis=<time in milliseconds>
For example, if you want to set the timeout value of 120 seconds, then set it as follows: conf_http_HTTPTransport.io.timeout.millis=120000
3. Ensure this file is owned by apigee: chown apigee:apigee /opt/apigee/customer/application/message-processor.properti
es
4. Restart the Message Processor:
/opt/apigee/apigee-service/bin/apigee-service
edge -message-processor restart
(c)2017 Apigee Corp. All Rights Reserved 82
5. If you have more than one Message Processor, repeat the above steps on all the Message Processors.
Slow API Request Processing by Edge If Edge is very slow and/or taking a long time to process the API request, then you will get a 504 Gateway Timeout error. Steps to Diagnose
1. Trace the affected API in Edge UI.
2. Either wait for the error to occur or if you have the API call, then make some API calls and reproduce the 504 Gateway Timeout Error.
3. Note, in this case, you may see a successful response in the Trace.
a. The Router/client times out as the Message Processor does not respond back within the specified timeout period on the Router/client (whichever has the lowest time out period). However, the Message Processor continues to process the request and may complete successfully.
b. In addition, the HTTPTransport.io.timeout.millis value set on the Message Processor triggers only if the Message Processor communicates with a HTTP/HTTPS backend server.
(c)2017 Apigee Corp. All Rights Reserved 83
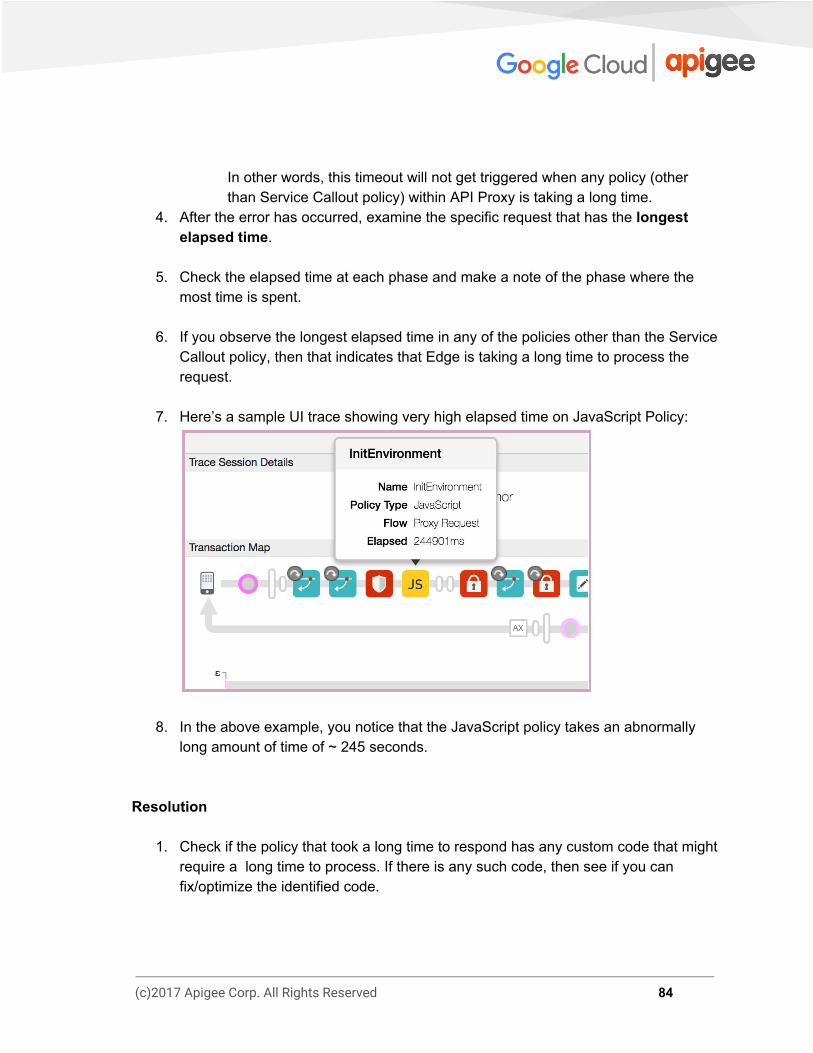
In other words, this timeout will not get triggered when any policy (other than Service Callout policy) within API Proxy is taking a long time.
4. After the error has occurred, examine the specific request that has the longest elapsed time.
5. Check the elapsed time at each phase and make a note of the phase where the most time is spent.
6. If you observe the longest elapsed time in any of the policies other than the Service Callout policy, then that indicates that Edge is taking a long time to process the request.
7. Here’s a sample UI trace showing very high elapsed time on JavaScript Policy:
8. In the above example, you notice that the JavaScript policy takes an abnormally long amount of time of ~ 245 seconds.
Resolution
1. Check if the policy that took a long time to respond has any custom code that might require a long time to process. If there is any such code, then see if you can fix/optimize the identified code.
(c)2017 Apigee Corp. All Rights Reserved 84

2. If there is no custom code that might cause high processing time, then check if the Message Processor(s) is experiencing high CPU or memory usage:
a. If any Message Processor is experiencing high CPU usage, then generate three thread dumps every 30 seconds using the following command:
<JAVA_HOME>/bin/jstack -l <pid> > <filename>
b. If any Message Processor is having high Memory usage, then generate a heap dump using the following command:
sudo -u apigee <JAVA_HOME>/bin/jmap -dump:live,format=b,file=<filename> <pid>
c. Restarting the Message Processor will bring down the CPU and memory
usage:
/opt/apigee/apigee-service/bin/apigee-service
edge -message-processor restart
d. Monitor the API calls and confirm if the problem still exists.
e. Contact Apigee Support and provide the thread dumps, heap dump, and Message Processor logs (/opt/apigee/var/log/edge-message-processor/logs/system.log ) to help them investigate the cause for the high CPU/memory usage.
(c)2017 Apigee Corp. All Rights Reserved 85

Troubleshooting Analytics Problems This section provides information and guidance on procedures for troubleshooting commonly observed analytics problems.
Data not showing up on analytics dashboards in Edge Description The analytics dashboards (Proxy Performance, Target Performance, etc.) are not showing any data in the Edge UI. All the dashboards show the following message:
“No traffic in the selected date range” Error Messages No Errors are observed. Causes The typical causes for this error are:
Cause
No API Traffic for Organization-Environment
Data available in Postgres Database, but not shown up in UI
Analytics Data not being pushed to Postgres Database
Postgres Server running out of disk space
Incorrect Analytics Deployment
Stale Analytics Server UUIDs
(c)2017 Apigee Corp. All Rights Reserved 86

The following sections describe how to diagnose and resolve each issue.
No API Traffic for Organization-Environment Steps to Diagnose
1. Check if there is traffic for the API Proxies on the specific organization-environment for the specific duration that you are trying to view the analytics data using one of the following methods:
a. Enable the trace for any of your APIs that is currently being used by your users and check if you are able to get any requests in the trace. Note: This technique will be useful only if you want to check if there is traffic at this point in time rather than in the past.
b. View the Nginx access logs (/opt/apigee/var/log/edge-router/nginx/logs/access.log ) and see if there any new entries for API Proxies for the specific duration.
c. If you log information from API Proxies to a log server such as Syslog, Splunk, Loggly, etc., then you can check if there are any entries in these log servers for API Proxies for the specific duration.
2. If there’s no traffic (no API requests) for the specific duration, then analytics data is
not available. You will see “No traffic in the selected date range” in the analytics dashboard.
Resolution
1. Make some calls to one or more API proxies in the specific organization-environment.
2. Wait for a few seconds, and then view the analytics dashboards in the Hour tab and see if the data appears.
3. If the issue persists, then proceed to Data available in Postgres Database, but not displaying in UI.
(c)2017 Apigee Corp. All Rights Reserved 87
Data available in Postgres database, but not displaying in the Edge UI
Determine the availability of latest Analytics data in Postgres database Follow the below steps to check if the latest Analytics data is available in the Postgres Master node:
1. Log in to each of the Postgres servers and run the following command to validate if you are on the Master Postgres node: /opt/apigee/apigee-service/bin/apigee-service
apigee-postgresql postgres-check-master
2. On the Master Postgres node, log in to PostgresSQL: psql -h /opt/apigee/var/run/apigee-postgresql -U apigee apigee
3. Check if the table exists for your org-env using the following SQL query in the Postgres database: \d analytics."<orgname>.<envname>.fact" Note: Replace orgname and envname with your organization and environment names.
4. Check if the latest data is available in the Postgres database using the following
SQL query: select max(client_received_start_timestamp) from analytics."<orgname>.<envname>.fact";
5. If the latest timestamp is very old (or null), then this indicates that data is not
available in the Postgres database. The likely cause for this issue would be that the data is not pushed from the Qpid Server to the Postgres database. Proceed to Analytics Data not being pushed to Postgres Database.
6. If the latest data is available in the Postgres database on the Master node, then follow the below steps to diagnose why the data is not displaying in the Edge UI.
(c)2017 Apigee Corp. All Rights Reserved 88

Steps to Diagnose
1. Enable Developer Tools in the browser and get the API used from one of the analytics dashboards using the below steps:
a. Select the Network tab from the Developer Tools. b. Start Recording. c. Reload the Analytics dashboard. d. On the left hand panel in the Developer Tools, select the row having
“apiproxy?_optimized…”. e. On the right hand panel in the Developer Tools, select the “Headers” tab
and note down the “Request URL”.
2. Here’s a sample output from the Developer Tools: Sample output showing the API used in Proxy Performance dashboard from Network Tab of Developer Tools for Proxy Performance dashboard
3. Run the management API call directly and check if you get the results. Here’s a sample API call for the Day tab in the Proxy Performance dashboard:
(c)2017 Apigee Corp. All Rights Reserved 89
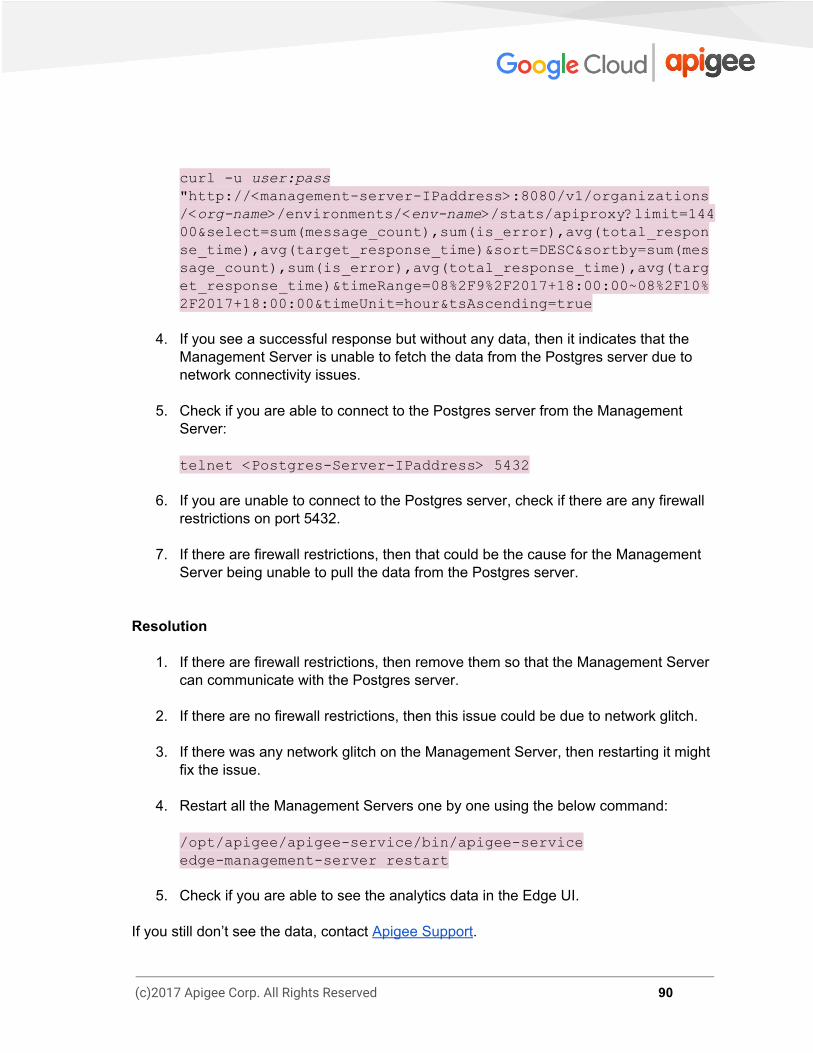
curl -u user:pass "http://<management-server-IPaddress>:8080/v1/organizations
/< org-name>/environments/< env-name>/stats/apiproxy?limit=14400&select=sum(message_count),sum(is_error),avg(total_respon
se_time),avg(target_response_time)&sort=DESC&sortby=sum(mes
sage_count),sum(is_error),avg(total_response_time),avg(targ
et_response_time)&timeRange=08%2F9%2F2017+18:00:00~08%2F10%
2F2017+18:00:00&timeUnit=hour&tsAscending=true
4. If you see a successful response but without any data, then it indicates that the
Management Server is unable to fetch the data from the Postgres server due to network connectivity issues.
5. Check if you are able to connect to the Postgres server from the Management
Server: telnet <Postgres-Server-IPaddress> 5432
6. If you are unable to connect to the Postgres server, check if there are any firewall restrictions on port 5432.
7. If there are firewall restrictions, then that could be the cause for the Management Server being unable to pull the data from the Postgres server.
Resolution
1. If there are firewall restrictions, then remove them so that the Management Server can communicate with the Postgres server.
2. If there are no firewall restrictions, then this issue could be due to network glitch.
3. If there was any network glitch on the Management Server, then restarting it might fix the issue.
4. Restart all the Management Servers one by one using the below command: /opt/apigee/apigee-service/bin/apigee-service
edge-management-server restart
5. Check if you are able to see the analytics data in the Edge UI.
If you still don’t see the data, contact Apigee Support.
(c)2017 Apigee Corp. All Rights Reserved 90

Analytics Data not being pushed to Postgres Database Steps to Diagnose If the data is not pushed from Qpid Server to Postgres Database as determined in Determine the availability of latest Analytics data in Postgres database, then perform the following steps:
1. Check if each of the Qpid Server is up and running by executing the below command: /opt/apigee/bin/apigee-service edge-qpid-server status
2. If any Qpid Server is down, then restart it. If not, jump to step #5. /opt/apigee/bin/apigee-service edge-qpid-server restart
3. Wait for some time and then re-check if the latest data is available in Postgres database.
a. Log in to PostgresSQL: psql -h /opt/apigee/var/run/apigee-postgresql -U apigee apigee
b. Run the below SQL query to check if the latest data is available: select max(client_received_start_timestamp) from analytics."<orgname>.<envname>.fact";
4. If the latest data is available, then skip the following steps and proceed to last step in Resolution section. If the latest data is not available, then proceed with the following steps.
5. Check if the messages from Qpid server queues are being pushed to Postgres database.
a. Execute the qpid-stat -q command and check the msgIn and msgOut column values.
(c)2017 Apigee Corp. All Rights Reserved 91
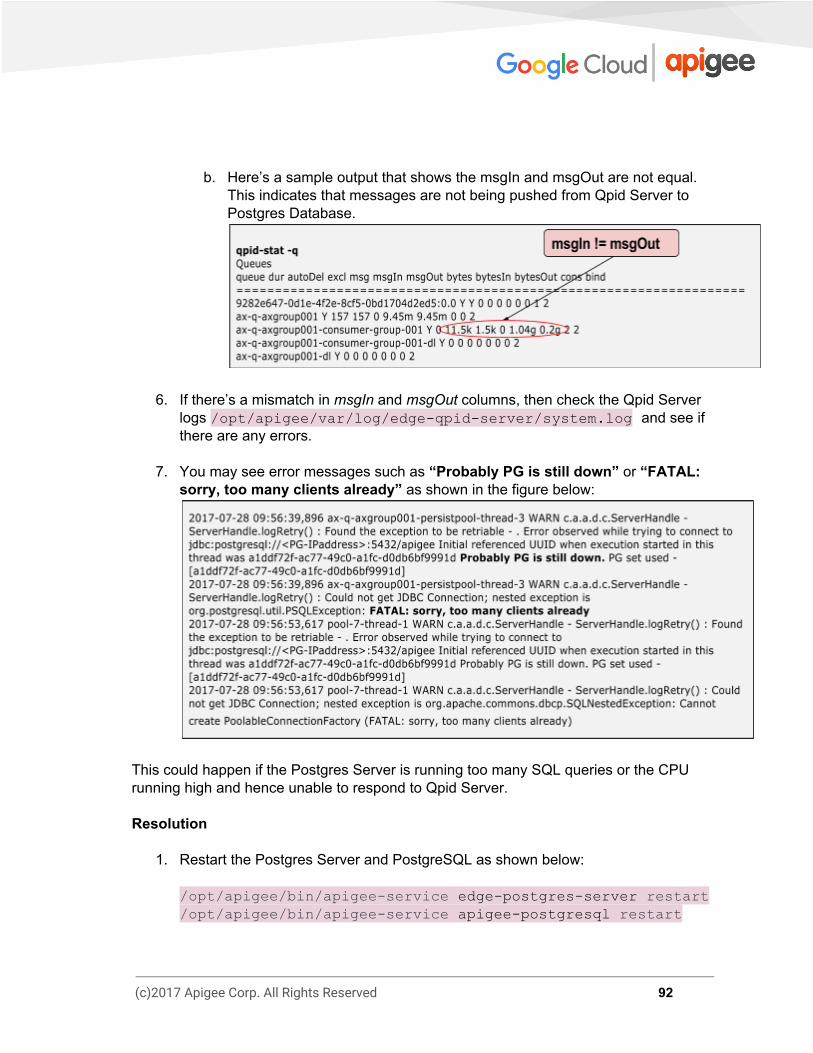
b. Here’s a sample output that shows the msgIn and msgOut are not equal. This indicates that messages are not being pushed from Qpid Server to Postgres Database.
6. If there’s a mismatch in msgIn and msgOut columns, then check the Qpid Server logs /opt/apigee/var/log/edge-qpid-server/system.log and see if there are any errors.
7. You may see error messages such as “Probably PG is still down” or “FATAL: sorry, too many clients already” as shown in the figure below:
This could happen if the Postgres Server is running too many SQL queries or the CPU running high and hence unable to respond to Qpid Server. Resolution
1. Restart the Postgres Server and PostgreSQL as shown below: /opt/apigee/bin/apigee-service edge-postgres-server restart /opt/apigee/bin/apigee-service apigee-postgresql restart
(c)2017 Apigee Corp. All Rights Reserved 92

2. This restart ensures that all the previous SQL queries are stopped and should allow new connections to the Postgres database.
3. Reload the Analytics dashboards and check if the Analytics data is being displayed.
If the problem persists, contact Apigee Support.
Incorrect Analytics Deployment Steps to Diagnose
1. Get the analytics deployment status by using the following API call: curl -u <userEmail>:<password> http://<management-server-host>:<port>/v1/organizations/<or
gname>/environments/<envname>/provisioning/axstatus
2. Check the status of the Qpid and Postgres servers from the results of the API call.
a. If the status of Qpid and Postgres servers are shown as “SUCCESS”, then
it indicates the analytics servers are wired properly. Proceed to Scenario #2 Stale Analytics Server UUIDs.
b. If the status of Qpid/Postgres servers is shown as “UNKNOWN” or
“FAILURE”, then it indicates an issue with the corresponding server. For example, the following scenario shows the status of the Postgres servers as “UNKNOWN”
(c)2017 Apigee Corp. All Rights Reserved 93

This may happen if there is a failure during the onboarding of analytics. This failure prevents the messages from Management Servers reaching the Postgres servers.
Resolution This issue can be typically resolved by restarting the servers which showed the “FAILURE” or “UNKNOWN”.
1. Restart each of the servers whose analytics wiring status indicated “FAILURE” or
“UNKNOWN” using the following command: /opt/apigee/apigee-service/bin/apigee-service <component> restart
2. For example:
a. If you see the issue on Qpid Servers, then restart the Qpid Servers: /opt/apigee/apigee-service/bin/apigee-service
edge-qpid-server restart
(c)2017 Apigee Corp. All Rights Reserved 94

b. If you see the issue on Postgres Servers, then restart both the Master and Slave Postgres Server nodes: /opt/apigee/apigee-service/bin/apigee-service
edge-postgres-server restart
3. In the example above, the “UNKNOWN” message is shown for the Postgres servers, so you need to restart both the Master and Slave Postgres servers: /opt/apigee/apigee-service/bin/apigee-service
edge-postgres-server restart
Stale Analytics Server UUIDs
1. Get the analytics configuration using the following API call: curl -u <userEmail>:<password> http://<management-server-host>:<port>/v1/analytics/groups/
ax
Here’s a sample output from the above API:
(c)2017 Apigee Corp. All Rights Reserved 95

2. Ensure the following information in the output is correct: a. org-env names listed in the “scopes” element. b. UUIDs of the Postgres servers and Qpid servers.
● Get the Postgres Server UUIDs by running the following command on each of the Postgres server nodes:
curl 0:8084/v1/servers/self/uuid
● Get the Qpid Server UUIDs by running the following command on each of the Qpid server nodes:
curl 0:8083/v1/servers/self/uuid
3. If all the information is correct, then proceed to Analytics Data not being pushed to
Postgres Database.
4. If the UUIDs of Postgres and/or Qpid servers are incorrect, then it could be possible that the Management Servers are referring to stale UUIDs.
Resolution To remove the stale UUIDs and add the correct UUIDs of the servers, contact Apigee Support.
(c)2017 Apigee Corp. All Rights Reserved 96

Custom variable not visible in analytics custom reports Description The custom variable created using the Statistics Collector policy is not visible under Custom Dimensions in the Analytics Custom Reports in the Edge UI. Error Messages No Errors are observed. Causes The typical causes for this error are:
Cause
Custom Variable not adhering to the standard guidelines
No traffic on API Proxy implementing the Statistics Collector policy
Custom Variable not available on Postgres Server
The following sections describe how to diagnose and resolve each issue.
Custom Variable not adhering to the standard guidelines If the custom variable name used in the Statistics Collector policy does not adhere to the standard guidelines (see below), then it will not appear in the Custom Reports. The code snippet below shows that the variable name “TLS version” has a space, so it will not appear under the Custom Dimension in the Custom Report.
(c)2017 Apigee Corp. All Rights Reserved 97
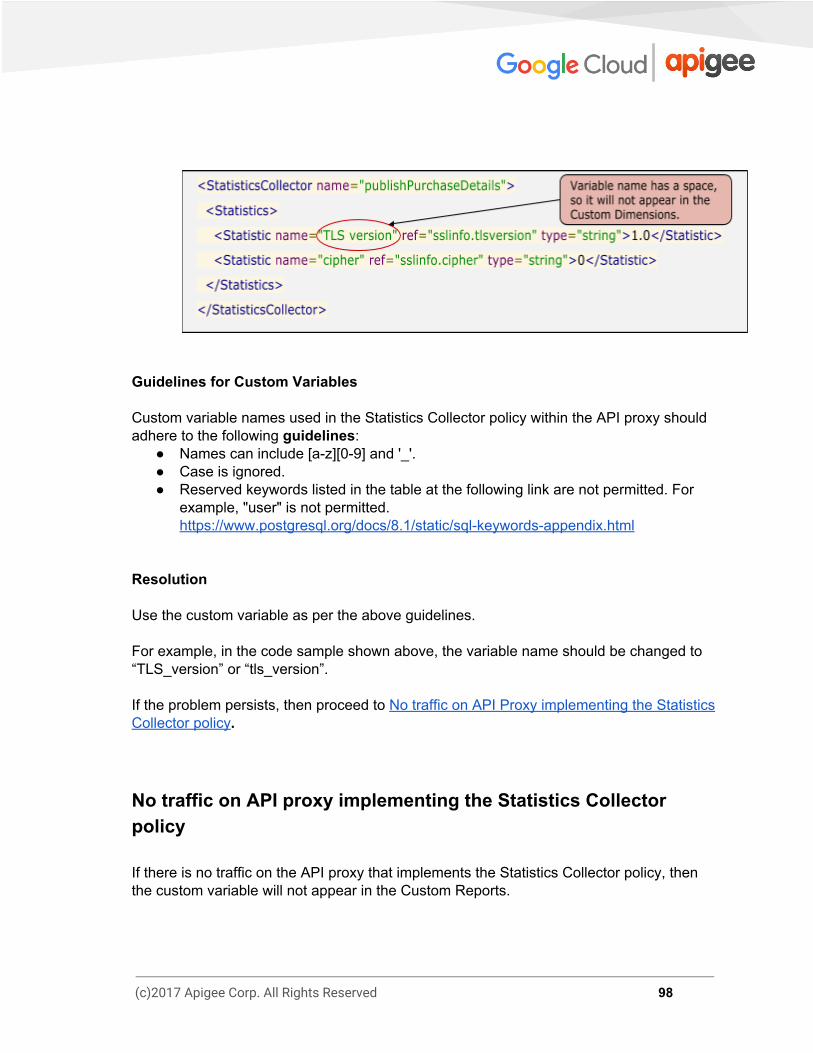
Guidelines for Custom Variables Custom variable names used in the Statistics Collector policy within the API proxy should adhere to the following guidelines:
● Names can include [a-z][0-9] and '_'. ● Case is ignored. ● Reserved keywords listed in the table at the following link are not permitted. For
example, "user" is not permitted. https://www.postgresql.org/docs/8.1/static/sql-keywords-appendix.html
Resolution Use the custom variable as per the above guidelines. For example, in the code sample shown above, the variable name should be changed to “TLS_version” or “tls_version”. If the problem persists, then proceed to No traffic on API Proxy implementing the Statistics Collector policy.
No traffic on API proxy implementing the Statistics Collector policy If there is no traffic on the API proxy that implements the Statistics Collector policy, then the custom variable will not appear in the Custom Reports.
(c)2017 Apigee Corp. All Rights Reserved 98

Resolution Make some calls to the API proxy that implements the Statistics Collector policy. If the problem persists, then proceed to Custom Variable not pushed to Postgres Server.
Custom Variable not pushed to Postgres Server When a custom variable is created in the API proxy and API calls are made, the variable first gets stored in-memory on the Message Processor. The Message Processor then sends the information about the new variable to ZooKeeper, which in turn sends it to the Postgres server to add it as a column in the Postgres database. At times, the notification from ZooKeeper may not reach Postgres due to network issues. Because of this error, the custom variable might not appear in the Custom Report. To identify where the custom variable is missing, perform following steps:
1. Generate the ZooKeeper tree using the following command: /opt/apigee/apigee-zookeeper/contrib/zk-tree.sh > zktree-output.txt
2. Search for the custom variable in the ZooKeeper tree output.
3. If the custom variable exists in the ZooKeeper tree, then execute the following commands to check if the custom variable is added to the Postgres database
a. On the Postgres node, log in to PostgresSQL: psql -h /opt/apigee/var/run/apigee-postgresql -U apigee apigee
b. Run the following SQL query:
select column_name, data_type, character_maximum_length from INFORMATION_SCHEMA.COLUMNS where table_name = analytics"<orgname>.<envname>.fact";
4. Very likely you will see that custom variable column will be missing in the fact table
which is the reason for it not to appear in the Custom Dimensions.
(c)2017 Apigee Corp. All Rights Reserved 99

Resolution Solution #1: Restart the Postgres Server
1. Restart the Postgres Server to force it to read all information relevant to Analytics from Zookeeper.
/opt/apigee/bin/apigee-service edge-postgres-server restart
If the problem persists, apply Solution #2. Solution #2: Enable the property forceonboard Enable the forceonboard property using the below steps:
1. Create /opt/apigee/customer/application/postgres-server.properties file on the Postgres server machine, if it does not already exist.
2. Add the following line to this file: conf_pg-agent_forceonboard=true
3. Ensure this file is owned by Apigee.
4. Restart the Postgres server: /opt/apigee/apigee-service/bin/apigee-service
edge -postgres-server restart
5. If you have more than one Postgres server, repeat the steps above on all the Postgres servers.
6. Undeploy and deploy your API proxy that uses the Statistics Collector policy.
7. Run the API calls.
8. Check if the custom variable(s) appear in the custom dimensions in Custom Report.
(c)2017 Apigee Corp. All Rights Reserved 100

If the problem persists, contact Apigee Support.
Postgres Server running out of disk space Description The Postgres Server containing the Analytics data has run out of disk space. In the following example, you can see that the /u01 has filled up 90% (176GB/207GB) of the disk space.
Error Messages You may not observe any error message unless the disk space is completely filled on the Postgres Server.
Causes The typical causes for this issue are:
Cause
Inadequate disk space
Lack of Analytics Data Pruning
The following sections describe how to diagnose and resolve each issue.
Inadequate disk space One of the typical causes for disk space errors on Postgres Servers is that you don’t have adequate disk space to store the large volumes of analytics data. The steps provided
(c)2017 Apigee Corp. All Rights Reserved 101
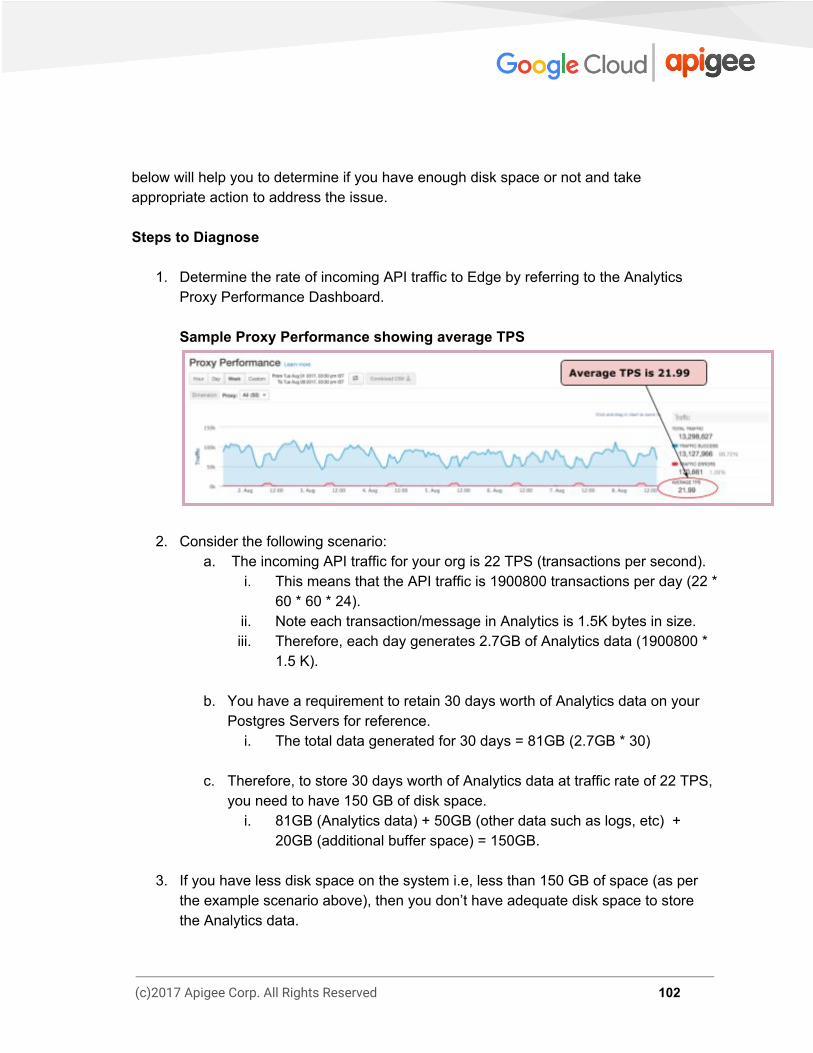
below will help you to determine if you have enough disk space or not and take appropriate action to address the issue. Steps to Diagnose
1. Determine the rate of incoming API traffic to Edge by referring to the Analytics Proxy Performance Dashboard. Sample Proxy Performance showing average TPS
2. Consider the following scenario: a. The incoming API traffic for your org is 22 TPS (transactions per second).
i. This means that the API traffic is 1900800 transactions per day (22 * 60 * 60 * 24).
ii. Note each transaction/message in Analytics is 1.5K bytes in size. iii. Therefore, each day generates 2.7GB of Analytics data (1900800 *
1.5 K).
b. You have a requirement to retain 30 days worth of Analytics data on your Postgres Servers for reference.
i. The total data generated for 30 days = 81GB (2.7GB * 30)
c. Therefore, to store 30 days worth of Analytics data at traffic rate of 22 TPS, you need to have 150 GB of disk space.
i. 81GB (Analytics data) + 50GB (other data such as logs, etc) + 20GB (additional buffer space) = 150GB.
3. If you have less disk space on the system i.e, less than 150 GB of space (as per
the example scenario above), then you don’t have adequate disk space to store the Analytics data.
(c)2017 Apigee Corp. All Rights Reserved 102
Resolution Add adequate disk space to the Postgres Server machine.
Lack of Analytics Data Pruning With the increase in API traffic to Edge, the amount of analytics data getting stored in the Postgres database will also increase. The amount of analytics data that can be stored in Postgres database is limited by the amount of disk space available on the system. Therefore, you cannot continue to keep storing additional analytics data on the Postgres database without taking one of the following actions:
1. Add more disk space. This is not a scalable option as we can’t keep adding more disk space as it it limited and expensive.
2. Prune the data beyond the required retention interval. This is a preferred solution as you can ensure that the data that is no longer required is being removed at regular intervals of time.
If you don’t prune the data at regular intervals manually or by using a cron job, then the amount of analytics data continually increases and can eventually lead to your running out of disk space on the system. Resolution Prune the data that is beyond your required retention interval:
1. Determine the retention interval, that is the duration for which you want to retain the Analytics data in the Postgres Database. For example, you want to retain 60 days worth of Analytics data.
(c)2017 Apigee Corp. All Rights Reserved 103

2. Run the following command to prune data for a specific organization and environment: /opt/apigee/apigee-service/bin/apigee-service
apigee-postgresql pg-data-purge <Org> <Env> <NoOfDaysToPurgeBackFromCurrentDate>
3. See Pruning Analytics data for more information.
(c)2017 Apigee Corp. All Rights Reserved 104

Analytics Reports timing out Description The Analytics dashboards (Proxy Performance, Target Performance, Custom Reports, etc.) in the Edge UI timeout. Error Messages You see the following error message when the Analytics dashboards timeout:
Causes The typical causes of this issue are:
Cause
Inadequate Hardware Configuration
Large amount of Analytics data in Postgres Database
Insufficient time to fetch Analytics data
The following sections describe how to diagnose and resolve each issue.
(c)2017 Apigee Corp. All Rights Reserved 105
Inadequate Hardware Configuration If any of the Edge components are under capacity i.e., if they have less CPU, RAM, or IOPS capacity than required, then the Postgres Servers/Qpid Servers may run slowly causing Analytics dashboards to timeout. Resolution Ensure that all the Edge components are adhering to the minimum hardware requirements as per the guidance provided in Hardware Requirements.
Large amount of Analytics data in Postgres Database Steps to Diagnose
1. On the Postgres node, login to PostgresSQL: psql -h /opt/apigee/var/run/apigee-postgresql -U apigee apigee
2. Check the duration for which the data is available in the Postgres Database using the following SQL query: select min(client_received_start_timestamp), max(client_received_start_timestamp) from analytics."<orgname>.<envname>.fact";
3. Get the sizes of all the tables in the Postgres Database:
SELECT relname as "Table",pg_size_pretty(pg_total_relation_size(relid)) As "Size",
pg_size_pretty(pg_total_relation_size(relid) - pg_relation_size(relid)) as "External Size" FROM pg_catalog.pg_statio_user_tables ORDER BY pg_total_relation_size(relid) DESC;
(c)2017 Apigee Corp. All Rights Reserved 106

Based on the output obtained in step #2 and #3, if you notice that either the duration for which the data has been stored is long (longer than your retention interval) and/or the table sizes are very large, then it indicates that you have large amounts of analytics data in the Postgres database. This could be causing the Analytics dashboards to time out. Resolution Prune the data that is beyond your required retention interval.
1. Determine the retention interval, that is the duration for which you want to retain the Analytics data in the Postgres Database. For example, you want to retain 60 days worth of Analytics data.
2. Run the following command to prune data for a specific organization and environment: /opt/apigee/apigee-service/bin/apigee-service
apigee-postgresql pg-data-purge <Org> <Env> <NoOfDaysToPurgeBackFromCurrentDate>
3. See Pruning Analytics data for more information. If the problem persists, then proceed to Insufficient time to fetch Analytics data.
Insufficient time to fetch Analytics data Steps to diagnose
1. Check if you are able to view the data in the Hour/Day Tab of Analytics dashboard (Proxy Performance/Target Performance).
2. If you are able to view the data in the Hour tab alone or Hour and Day tabs, but are getting report timeout errors only when attempting to view the Week or Custom tabs, then this indicates that the volume of data that needs to be fetched from the Postgres database is very large. This could be causing the Edge UI to time out.
(c)2017 Apigee Corp. All Rights Reserved 107

Resolution The Edge UI has a default timeout of 120 seconds for fetching and displaying the Analytics data. If the volume of Analytics data to be fetched is very large, then 120 seconds may not be sufficient. Increase the Edge UI timeout value to 300 seconds by following the instructions Set the timeout used by the Edge UI for Edge API management calls. Reload any of the Analytics dashboard and check if you are able to view the data for all the tabs - Hour, Day, Week and Custom. If the problem persists, contact Apigee Support.
(c)2017 Apigee Corp. All Rights Reserved 108

Troubleshooting Deployment Errors
Deployment of API proxies might fail due to various reasons such as network connectivity issues between Edge servers, issues with the Cassandra datastore, ZooKeeper exceptions, and errors in the API proxy bundle. This section provides information and guidance on some specific procedures that can be followed for troubleshooting deployment errors. If a deployment failure is encountered that is not described in this doc, contact Apigee Support for assistance.
Deployment Error: "Call timed out; either server is down or server is not reachable" Description Deployment of API proxy revisions via the UI or management API calls fails with timeout error. Error Messages
(c)2017 Apigee Corp. All Rights Reserved 109
Causes The typical causes for this issue are:
Cause Details
Network Connectivity Issue Communication failure between Management Server and Message Processor due to network connectivity issues or firewall rules.
Large API Proxy Bundle Message Processor may take a long time to activate if the API proxy bundle is large in size, leading to RPC timeouts.
Network Connectivity Issue Steps to Diagnose
1. Get the deployment status for the specific API that shows the error by using the following management API call: curl -v http://<management-server-IPaddress>:<port#>/organizations/
<orgname>/environments/<envname>/apis/<apiname>/deployments
-u <username>
Sample output showing the error:
(c)2017 Apigee Corp. All Rights Reserved 110
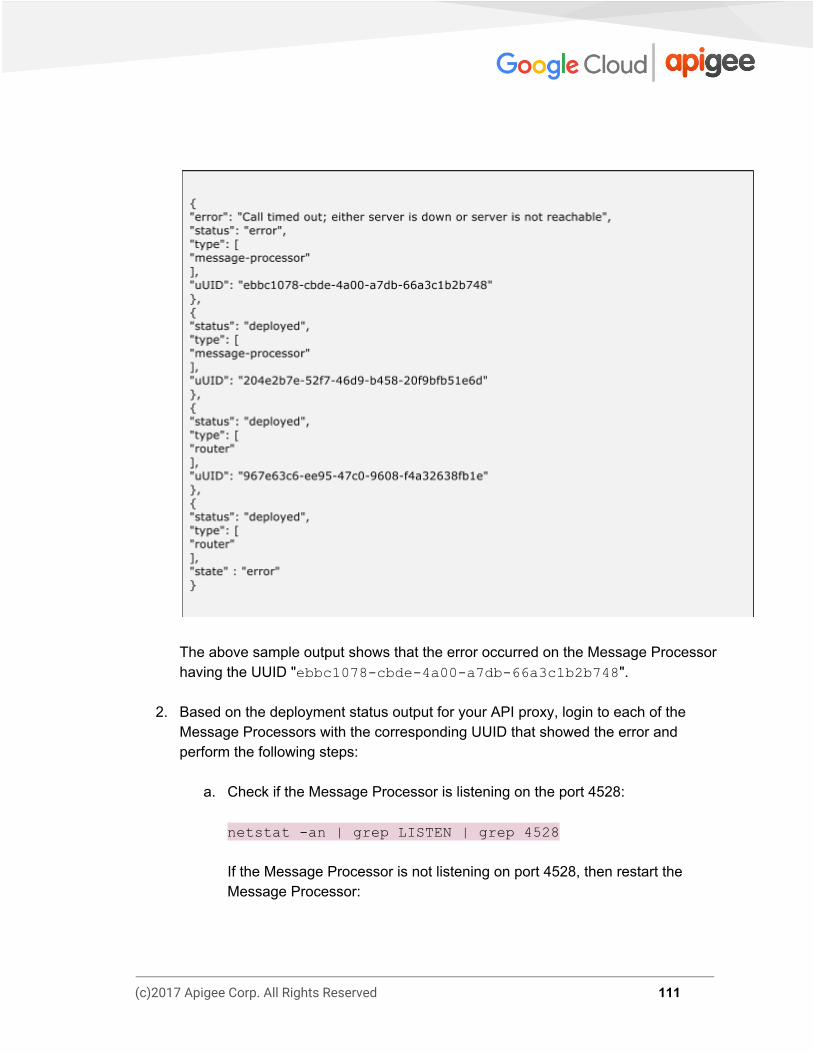
The above sample output shows that the error occurred on the Message Processor having the UUID "ebbc1078-cbde-4a00-a7db-66a3c1b2b748 ".
2. Based on the deployment status output for your API proxy, login to each of the
Message Processors with the corresponding UUID that showed the error and perform the following steps:
a. Check if the Message Processor is listening on the port 4528:
netstat -an | grep LISTEN | grep 4528
If the Message Processor is not listening on port 4528, then restart the Message Processor:
(c)2017 Apigee Corp. All Rights Reserved 111

/opt/apigee/apigee-service/bin/apigee-service
edge-message-processor restart
b. Re-check the deployment status of the API proxy by using the management API call shown in step #1 above. If there no errors, then that indicates the issue is resolved.
3. If the problem persists, test the connectivity from Management Server to the
Message Processor on port 4528 using the following steps:
a. If telnet is available, then use telnet: telnet <MessageProcessor_IP> 4528
b. If telnet is not available, use netcat to check the connectivity as follows: nc -vz < MessageProcessor_IP > 4528
c. If you get the response “Connection Refused” or “Connection timed out”, then engage your network operations team.
4. Test the connectivity from the Message Processor to the Management Server on
port 4526 using the following steps:
a. If telnet is available, then use telnet: telnet <management-server-IP> 4526
b. If telnet is not available, use netcat to check the connectivity as follows: nc -vz <management-server-IP> 4526
c. If you get the response “Connection Refused” or “Connection timed out”, engage your network operations team.
5. Work with your network operations team and do the following:
a. Ensure RPC protocol is allowed on both the Management Server and
Message Processor.
(c)2017 Apigee Corp. All Rights Reserved 112

b. Remove any firewall restrictions or security rules setup between the
Management Servers and Message Processors to allow connectivity to port 4526 on the management server, and connectivity from Management Server to Message Processors on port 4528.
6. Re-check the deployment status (refer to step #1 above). If you don’t see any
errors, then it indicates the error is resolved.
7. If the issue persists, check if there is network issue on the Message Processor. If there’s a network issue, restarting the specific Message Processor that shows the timeout error (as per the deployment status output) may fix the issue: /opt/apigee/apigee-service/bin/apigee-service
edge-message-processor restart
8. If the problem still persists, then check the Management Server logs at: (/opt/apigee/var/log/edge-management-server/logs/system.log ). Sample Call timed out error from Management Server Log
If you observe a similar error as shown in the above example, then increase the RPC timeout on the Management Server so that if there’s any network slowdown
(c)2017 Apigee Corp. All Rights Reserved 113

then it should give time for Management Server to connect to the Message Processor.
Resolution
1. Perform the following steps to increase the RPC timeout: a. Create the file
/opt/apigee/customer/application/management-server.pro
perties the Management Server machine, if it does not already exist.
b. Add the following line into this file: conf_cluster_rpc.connect.timeout=<time in seconds>
The default RPC timeout value is 10 and it is recommended to increase it to 40 seconds. Set it as follows: conf_cluster_rpc.connect.timeout=40
c. Ensure this file is owned by apigee: chown apigee:apigee /opt/apigee/customer/application/management-server.pro
perties
d. Restart the Management Server: /opt/apigee/apigee-service/bin/apigee-service
edge -management-server restart
e. If you have more than one Management Server, repeat the above steps on all the Management Servers.
f. Deploy the API proxy in the Edge UI or by using the Edge management API call. If the API proxy gets deployed without any issues, then that indicates the issue is resolved.
2. If the problem persists, then collect tcpdump command from the Management
Server and Message Processor. Enable the tcpdump command on each of the servers and then initiate the deployment of the API Proxy from the UI or using the
(c)2017 Apigee Corp. All Rights Reserved 114

management API:
a. Run the below tcpdump command from the Management Server: tcpdump -i any -s 0 host <message-processor-IP address> -w <File name>
b. Run the below tcpdump command from the Message Processor: tcpdump -i any -s 0 host <management-server-IP address> -w <File name>
3. Contact Apigee Support to get assistance on analyzing the tcpdumps and to troubleshoot the problem further.
(c)2017 Apigee Corp. All Rights Reserved 115

Large API Proxy Bundle Steps to Diagnose
1. Check the size of the API proxy bundle for which the deployment error is being observed.
2. If the size is reasonably large (10MB or higher), then it’s very likely that Message Processor may need more time to activate the API proxy.
3. If the API Proxy bundle size is greater than 15 MB, then proceed to API Proxy
Bundle larger than 15MB. Resolution Increase the RPC timeout on the Management Server so that Message Processor has enough time to activate large API proxy bundles. Perform the following steps to increase the RPC timeout value:
1. Create the /opt/apigee/customer/application/management-server.properti
es file on the Management Server machine, if it does not already exist.
2. Add the following line to this file: conf_cluster_rpc.connect.timeout=<time in seconds>
The default RPC timeout value is 10 and it is recommended to increase it to 40 seconds. Set it as follows: conf_cluster_rpc.connect.timeout=40
3. Ensure this file is owned by apigee: chown apigee:apigee /opt/apigee/customer/application/management-server.properti
es
4. Restart the Management Server:
(c)2017 Apigee Corp. All Rights Reserved 116
/opt/apigee/apigee-service/bin/apigee-service
edge -management-server restart
5. If you have more than one Management Server, repeat the above steps on all the Management Servers.
(c)2017 Apigee Corp. All Rights Reserved 117
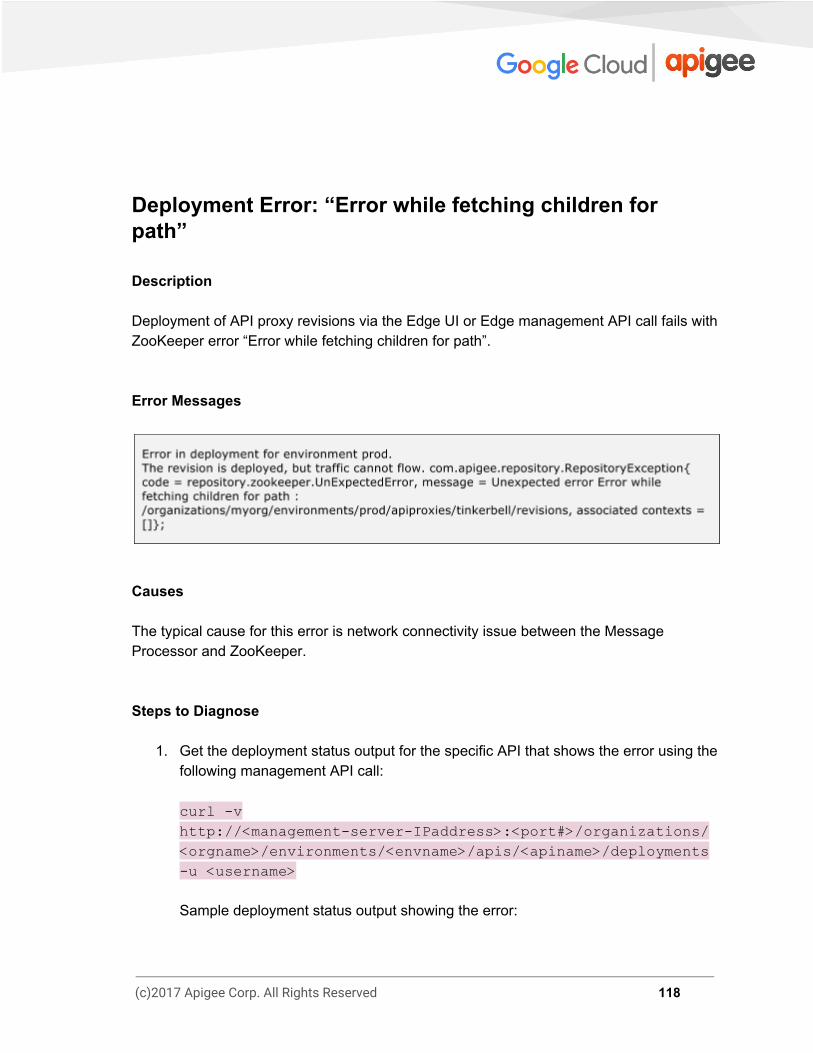
Deployment Error: “Error while fetching children for path” Description Deployment of API proxy revisions via the Edge UI or Edge management API call fails with ZooKeeper error “Error while fetching children for path”. Error Messages
Causes The typical cause for this error is network connectivity issue between the Message Processor and ZooKeeper. Steps to Diagnose
1. Get the deployment status output for the specific API that shows the error using the following management API call: curl -v http://<management-server-IPaddress>:<port#>/organizations/
<orgname>/environments/<envname>/apis/<apiname>/deployments
-u <username>
Sample deployment status output showing the error:
(c)2017 Apigee Corp. All Rights Reserved 118

2. Check the Message Processor (/opt/apigee/var/log/edge-message-processor/system.log ). Sample error from Message Processor log
(c)2017 Apigee Corp. All Rights Reserved 119
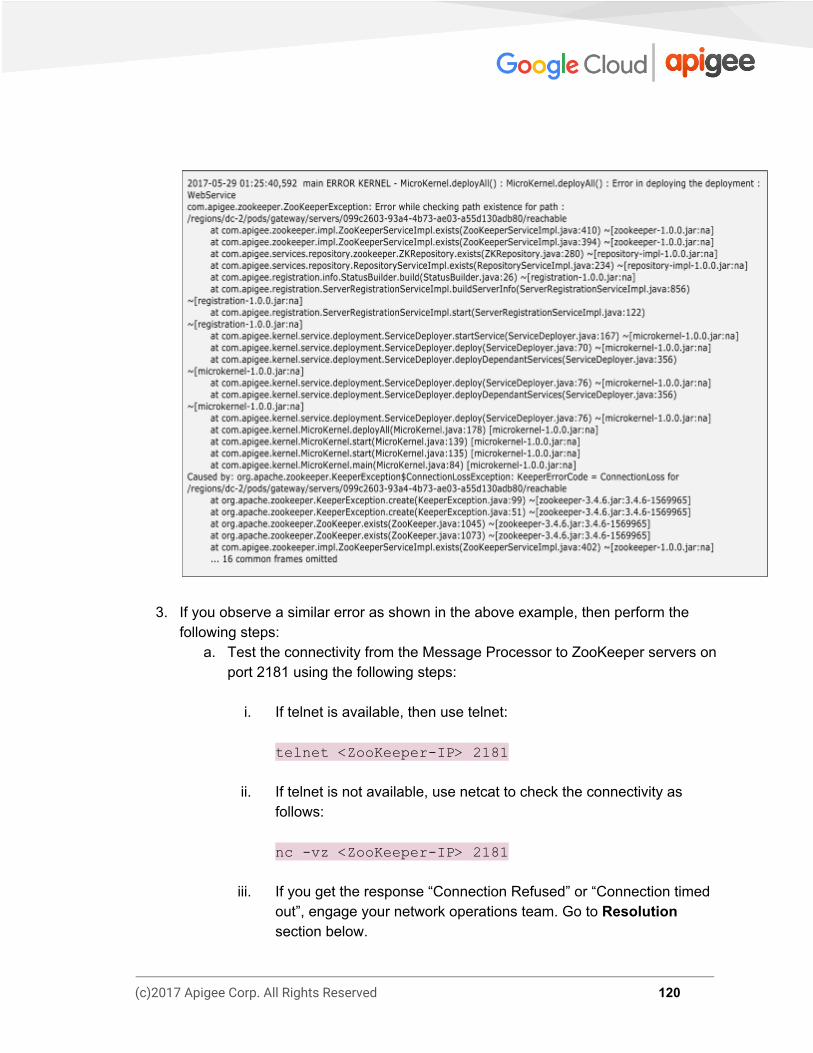
3. If you observe a similar error as shown in the above example, then perform the following steps:
a. Test the connectivity from the Message Processor to ZooKeeper servers on port 2181 using the following steps:
i. If telnet is available, then use telnet: telnet <ZooKeeper-IP> 2181
ii. If telnet is not available, use netcat to check the connectivity as follows: nc -vz <ZooKeeper-IP> 2181
iii. If you get the response “Connection Refused” or “Connection timed out”, engage your network operations team. Go to Resolution section below.
(c)2017 Apigee Corp. All Rights Reserved 120

4. If you observe any other, then contact Apigee Support.
Resolution
1. Work with your network team to: a. Ensure connectivity is allowed between the Message Processor and all
ZooKeeper nodes on port 2181. b. Remove any firewall restrictions or security rules setup from Message
Processors to allow connectivity to port 2181 on the ZooKeeper servers.
2. If there is network issue on the Message Processor, then restarting the specific Message Processor that shows the error (as per the deployment status output) might fix the issue. Restart the specific Message Processor: /opt/apigee/apigee-service/bin/apigee-service
edge-message-processor restart
If the problem persists, contact Apigee Support.
(c)2017 Apigee Corp. All Rights Reserved 121
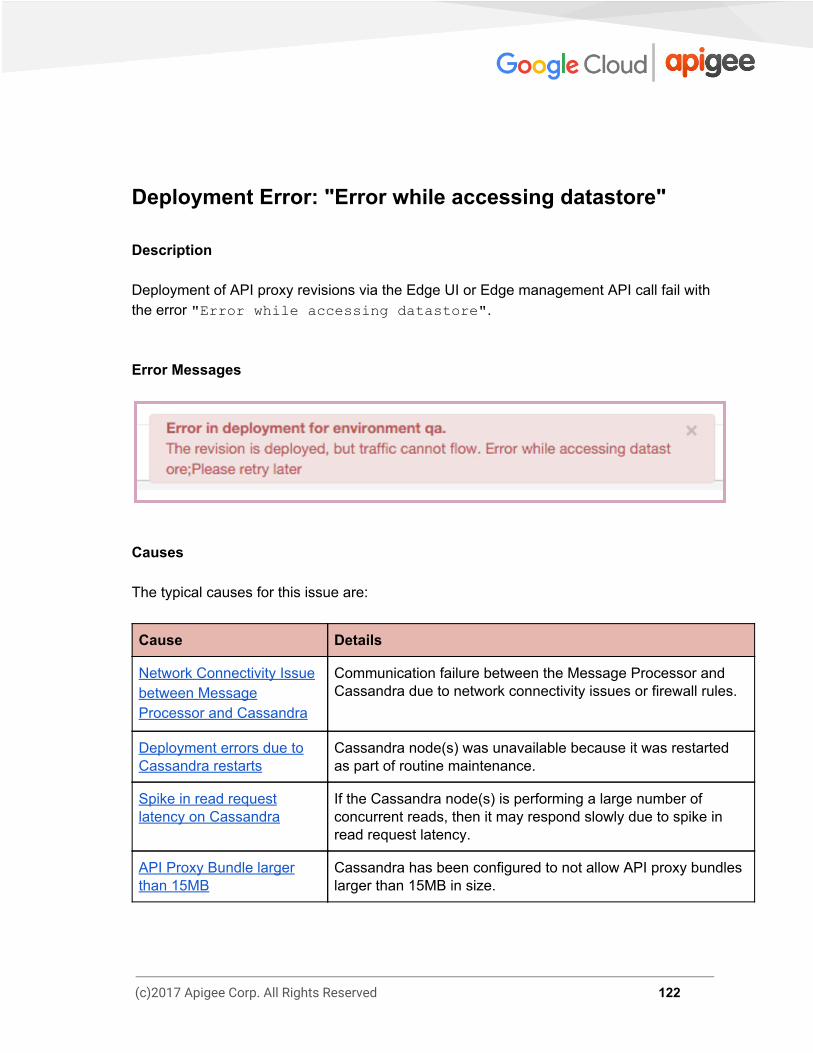
Deployment Error: "Error while accessing datastore" Description Deployment of API proxy revisions via the Edge UI or Edge management API call fail with the error "Error while accessing datastore" . Error Messages
Causes The typical causes for this issue are:
Cause Details
Network Connectivity Issue between Message Processor and Cassandra
Communication failure between the Message Processor and Cassandra due to network connectivity issues or firewall rules.
Deployment errors due to Cassandra restarts
Cassandra node(s) was unavailable because it was restarted as part of routine maintenance.
Spike in read request latency on Cassandra
If the Cassandra node(s) is performing a large number of concurrent reads, then it may respond slowly due to spike in read request latency.
API Proxy Bundle larger than 15MB
Cassandra has been configured to not allow API proxy bundles larger than 15MB in size.
(c)2017 Apigee Corp. All Rights Reserved 122
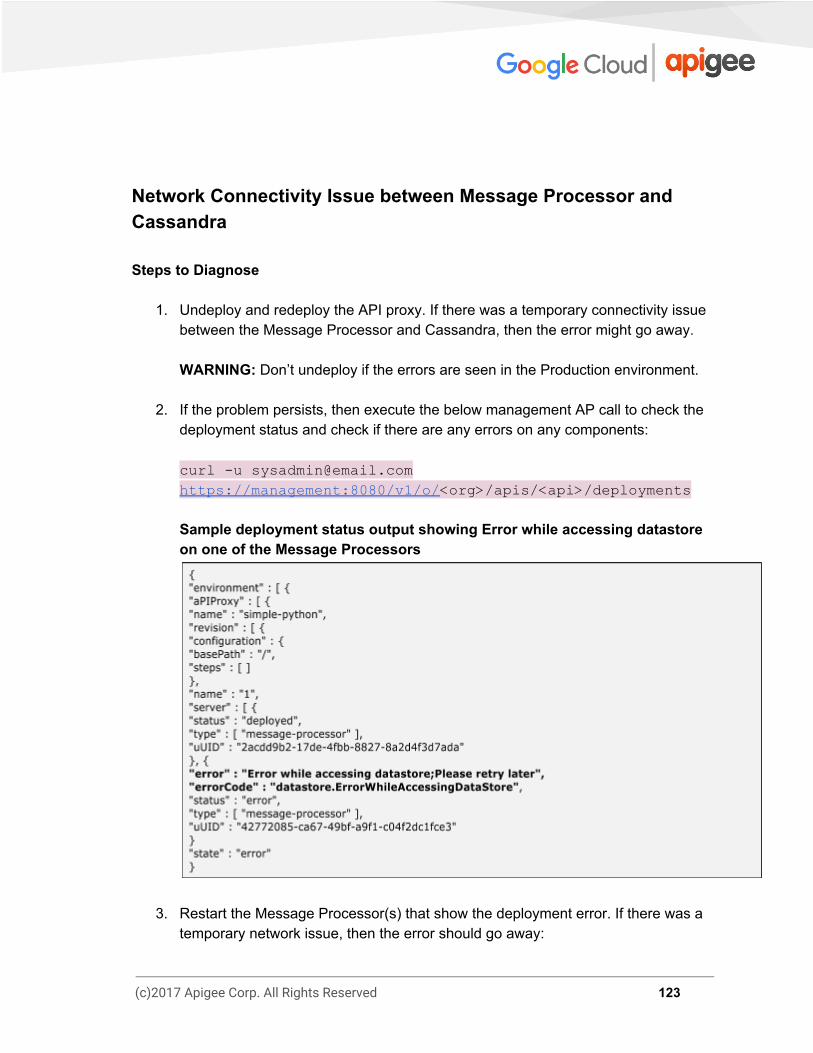
Network Connectivity Issue between Message Processor and Cassandra Steps to Diagnose
1. Undeploy and redeploy the API proxy. If there was a temporary connectivity issue between the Message Processor and Cassandra, then the error might go away. WARNING: Don’t undeploy if the errors are seen in the Production environment.
2. If the problem persists, then execute the below management AP call to check the
deployment status and check if there are any errors on any components: curl -u [email protected] https://management:8080/v1/o/ <org>/apis/<api>/deployments
Sample deployment status output showing Error while accessing datastore on one of the Message Processors
3. Restart the Message Processor(s) that show the deployment error. If there was a
temporary network issue, then the error should go away:
(c)2017 Apigee Corp. All Rights Reserved 123

/opt/apigee/apigee-service/bin/apigee-service
edge-message-processor restart
4. Repeat step #2 to see if the deployment succeeds on the Message Processor that was restarted. If no errors found, then that indicates the issue is resolved.
5. Check if the message processor is able to connect to each Cassandra node on port 9042 and 9160:
a. If telnet is available, then use telnet: telnet <Cassandra_IP> 9042 telnet <Cassandra_IP> 9160
b. If telnet is not available, use netcat to check the connectivity as follows: nc -vz < Cassandra_IP > 9042 nc -vz <Cassandra_IP> 9160
c. If you get the response “Connection Refused” or “Connection timed out”, then engage your network operations team.
6. If the problem persists, then check if each of the Cassandra nodes are listening on
the port 9042 and port 9160: netstat -an | grep LISTEN | grep 9042 netstat -an | grep LISTEN | grep 9160
7. If the Cassandra nodes are not listening on port 9042 or 9160, then restart the specific Cassandra node(s): /opt/apigee/apigee-service/bin/apigee-service
apigee-cassandra restart
8. If the problem persists, then engage your network operations team.
(c)2017 Apigee Corp. All Rights Reserved 124

Resolution Work with your network operations team and get the network connectivity issue fixed between Message Processor and Cassandra.
Deployment errors due to Cassandra restarts Cassandra nodes are usually restarted periodically as part of routine maintenance. If API proxies are deployed during the Cassandra maintenance work, then the deployments fail due to inaccessibility to the Cassandra datastore. Steps to Diagnose
1. Check if the Cassandra nodes were restarted during the time of the deployment.This can be done by checking the Cassandra log or most recent startup time logs of the Cassandra node: grep "shutdown " /opt/apigee/var/log/apigee-cassandra/system.log
Resolution
1. Ensure Cassandra is up and running.
2. Check if Message Processors are able to connect to Cassandra datastore on port 9042 and 9160.
Spike in read request latency on Cassandra A high number of reads on Cassandra is dependant on individual use cases and traffic patterns on the proxies that contain policies that require read access from Cassandra. For example, if a GET call to refresh_token grant type is called for OAuth policies, and the refresh token is associated with many access tokens, then this may result in high amounts
(c)2017 Apigee Corp. All Rights Reserved 125

of reads from Cassandra. This can cause increase in the read request latency on Cassandra. Steps to Diagnose
1. If you have installed the Beta Monitoring dashboard, look at the Cassandra dashboard, and review the “Read Requests” chart for the period of the problem. Also review the chart for “Read Request Latencies”.
2. Alternate tool to check the read requests and read latencies is the nodetool cfstats command. See Cassandra documentation to get more details to use this command.
(c)2017 Apigee Corp. All Rights Reserved 126

Resolution
1. Try the deployment again once Cassandra performance is back to normal. Make sure the entire Cassandra ring is normal.
2. (Optional) Do a rolling restart on Message Processors to be sure connectivity is established.
3. For a long term solution, review the API traffic patterns that would possibly contribute to higher reads in the Cassandra datastore. Contact Apigee Support for assistance in troubleshooting this issue.
4. If the existing Cassandra node(s) are not adequate to handle the incoming traffic, then either increase the hardware capacity or the number of the Cassandra datastore nodes appropriately.
API Proxy Bundle larger than 15MB The size of API proxy bundles are restricted to 15MB on Cassandra. If the size of the API proxy bundle is greater than 15 MB, then you will see “Error while accessing datastore" when you attempt to deploy the API proxy. Steps to Diagnose
1. Check the Message Processor logs (/opt/apigee/var/log/edge-message-processor/logs/system.log ) and see if there are any errors occurred during deployment of the specific API Proxy.
2. If you see an error similar to the one shown in the figure below, then the deployment error is because the API proxy bundle size is > 15 MB.
(c)2017 Apigee Corp. All Rights Reserved 127

Resolution The API proxy bundle will be large if there are too many resource files. Use the following solutions to address this issue: Solution #1: Move resource files to the Environment or Organization level
1. Move any of the resource files, such as NodeJS Script files and modules, JavaScript files, JAR files to the environment or organization level. For more information on resource files, see the Edge documentation.
2. Deploy the API proxy and see if the error goes away. If the problem persists or you cannot move the resource files to environment or organization level for some reason, then apply solution #2.
(c)2017 Apigee Corp. All Rights Reserved 128

Solution #2: Increase the API proxy bundle size on Cassandra Follow these steps to increase the size of the Cassandra property thrift frame transport size, that controls the maximum size of the API proxy bundle allowed in Edge:
1. Create the following file, if it does not exist: /opt/apigee/customer/application/cassandra.properties
2. Add the following line to the file, replacing <size> with the size setting needed for the large bundle:
conf_cassandra_thrift_framed_transport_size_in_mb=<size>
3. Restart Cassandra: /opt/apigee/apigee-service/bin/apigee-service
edge-management-server restart
4. Repeat the steps #1 through #3 on all Cassandra nodes in the cluster.
(c)2017 Apigee Corp. All Rights Reserved 129

Deployment Error: "Unexpected error occurred while processing the updates" Description Deployment of API proxy revisions via the Edge UI or Edge management API calls fails with the error "Unexpected error occurred while processing the updates ". Error Messages
Causes There could be many different causes for this error. Here are a few sample causes:
Cause Details
Out Of Memory Message Processor ran out of Java heap space resulting in API proxy deployment failure.
Error in API Proxy Bundle API Proxy bundle has errors that can lead to API proxy deployment failure.
Common Steps to Diagnose
1. Check if there are any deployment errors or exception stack trace in the Message Processor log
(c)2017 Apigee Corp. All Rights Reserved 130

/opt/apigee/var/log/apigee/edge-message-processor/logs/syst
em.log
2. You usually see a stack trace that provides information on the cause for the
deployment error. Please read the stack trace thoroughly to understand the cause.
Out Of Memory Steps to Diagnose
1. You may see exception similar to the one in the Message Processor log /opt/apigee/var/log/apigee/edge-message-processor/logs/syst
em.log as shown in the figure below:
(c)2017 Apigee Corp. All Rights Reserved 131
2. The message Caused by: java.lang.OutofMemoryError: Java Heap space indicates that the Message Processor has run out of Java Heap space.
Resolution Increase the maximum Java Heap space on the Message Processors. The maximum Java Heap space is controlled by the JVM property -Xmx. Here are the steps to increase the Java Heap space on the Message Processors:
1. Determine the amount of memory by which the Java heap space can be increased:
a. Check the current value set for max heap space, max_mem, in the file /opt/apigee/edge-message-processor/bin/setenv.sh
b. Get MemTotal (Total amount of usable RAM), MemFree (amount of physical RAM left unused on the system) using /proc/meminfo command on the system.
i. Ensure the above information includes the memory consumed by any other processes such as Edge Router etc that exist on the same system.
c. Based on the above information, determine by how much the Java heap
space can be increased for Message Processor.
d. For example, the current max heap space on the Message Processor is 1024MB, MemTotal is 8GB (8192MB), MemFree is 5GB (5120MB), then you can increase the max Java heap space to 3GB (3072MB).
e. If assistance is needed in determining how much to increase the Java heap
space, contact Apigee Support.
2. Create the following file, if it does not exist already: /opt/apigee/customer/application/message-processor.properti
es
(c)2017 Apigee Corp. All Rights Reserved 132

3. Add the following line in the file, with the increased heap setting (for example, 3072M): bin_setenv_max_mem=3072m
4. Save the file.
5. Restart the Message Processor:
/opt/apigee/apigee-service/bin/apigee-service
edge-message-processor restart
6. If you have more than one Message Processor, repeat the steps 3 through 6 on all the Message Processors.
If the problem persists, contact Apigee Support.
Error in API proxy bundle If there are any errors in any of the policies used in the API proxy, then the deployment will fail with the error "Unexpected error occurred while processing the updates ". For example, see this community post. Steps to Diagnose
1. Check the Message Processor logs for exceptions or errors related to the API proxy deployment. The error should give you information on what should be changed in the API proxy bundle to address the problem.
2. If no error messages show up on the Message Processor logs, check the diffs in the revision history of the API proxy. If older revisions deploy without a problem then review what code changes were made.
Resolution
(c)2017 Apigee Corp. All Rights Reserved 133
1. Make the necessary changes in the API proxy bundle to address the issue.
2. Revert any code changes to the API proxy that was problematic for the deployment.
If the problem persists, contact Apigee Support for further assistance.
(c)2017 Apigee Corp. All Rights Reserved 134

Troubleshooting Developer Portal Problems This section provides guidance on troubleshooting common issues encountered when using the developer portal. Before we begin looking at troubleshooting developer portal issues, let’s get a quick overview of Apigee Developer Portal and how it works.
Overview of Apigee Developer Portal (Drupal) As an API provider, you need a way to expose your APIs, educate developers about your APIs, sign up developers, and let developers register apps. Apigee Edge provides you with a Developer Services portal that you can use to build and launch your own customized website to provide these services to your development community. To learn more about developer portal, see http://docs.apigee.com/developer-services/content/what-developer-portal The following sections describe key concepts that you should understand before troubleshooting issues with your developer portal.
How SmartDocs works An OpenAPI (JSON or YAML) or WADL specification describing your API can be imported into SmartDocs and used to publish API reference documentation to your portal. The API reference documentation appears under the APIs tab on your portal automatically. Developers discover the API documentation through the portal and can make live API requests. As the API requests originate from a browser, CORS (Cross-Origin Resource Sharing) support is needed to allow them to succeed. CORS support is provided by the "smartdocs" proxy on Edge (in the "VALIDATE" org) that acts as the proxy for all SmartDocs requests to the intended endpoint. The "smartdocs" proxy is created when you install SmartDocs. For example:
(c)2017 Apigee Corp. All Rights Reserved 135

The URL of the smartdocs proxy is exposed as a configurable property at Configuration -> SmartDocs -> SmartDocs proxy URL. You may need to modify this URL if your API is on a private network and live API requests using SmartDocs from your portal are failing.
How the Developer Portal Communicates with Edge The developer portal stores and retrieves most of the information it displays from Edge including Smartdocs, developers, products, and developer apps. Edge org information and devadmin credentials are configurable by using the menu command Configuration -> Devportal. For more information, see Communicating between the portal and Edge.
(c)2017 Apigee Corp. All Rights Reserved 136
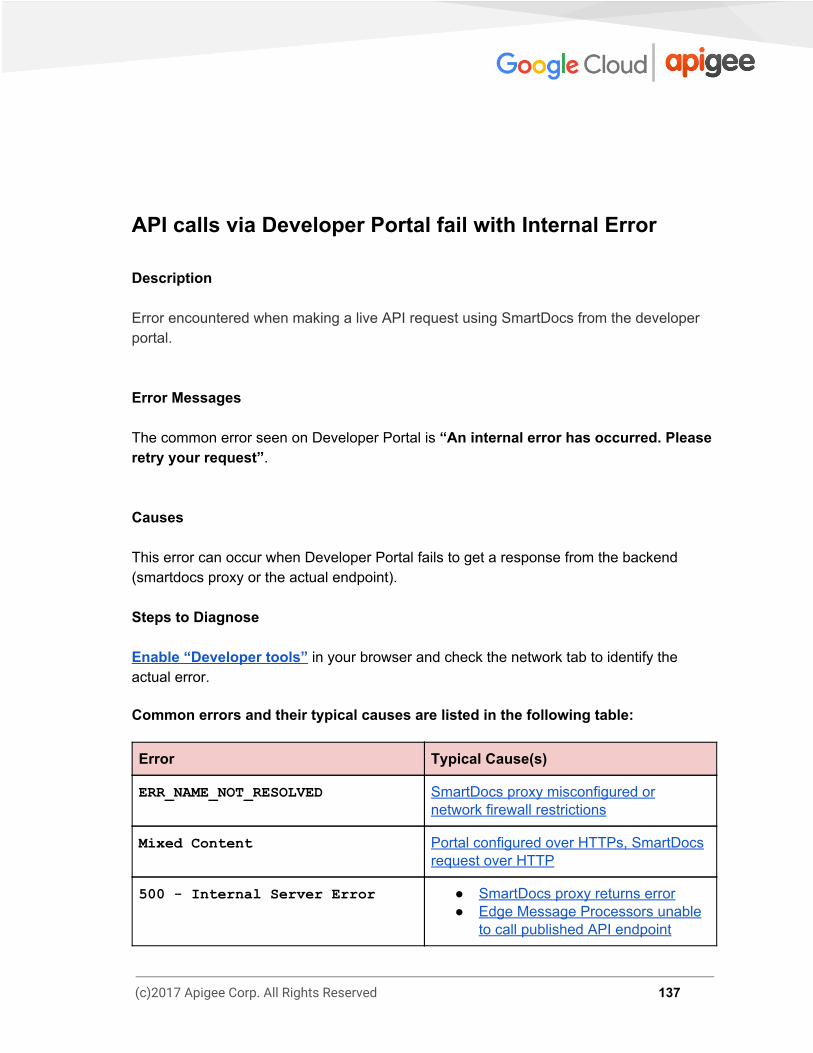
API calls via Developer Portal fail with Internal Error Description Error encountered when making a live API request using SmartDocs from the developer portal. Error Messages The common error seen on Developer Portal is “An internal error has occurred. Please retry your request”. Causes This error can occur when Developer Portal fails to get a response from the backend (smartdocs proxy or the actual endpoint). Steps to Diagnose Enable “Developer tools” in your browser and check the network tab to identify the actual error. Common errors and their typical causes are listed in the following table: Error Typical Cause(s)
ERR_NAME_NOT_RESOLVED SmartDocs proxy misconfigured or network firewall restrictions
Mixed Content Portal configured over HTTPs, SmartDocs request over HTTP
500 - Internal Server Error ● SmartDocs proxy returns error ● Edge Message Processors unable
to call published API endpoint
(c)2017 Apigee Corp. All Rights Reserved 137

Let’s go through each of these causes one by one and steps to resolve the issue.
SmartDocs proxy misconfigured or network firewall restrictions The“ERR_NAME_NOT_RESOLVED” message indicates that the smartdocs proxy url is misconfigured or the network from which the portal is being accessed is unable to make a call to the smartdocs proxy URL due to firewall restrictions. The smartdocs proxy must be accessible from the internet or from the internal network (for internal APIs).
Resolution Ensure that the smartdocs proxy can be accessed from all required networks by deploying the smartdocs proxy to a virtual host on Edge with a hostname that is accessible from internet.
(c)2017 Apigee Corp. All Rights Reserved 138

Portal configured over HTTPS, SmartDocs request over HTTP The “Mixed Content” error indicates that smartdocs proxy is being called over HTTP from a page loaded over HTTPS.
Resolution Expose smartdocs proxy over https to resolve the issue. You can do so by deploying the smartdocs proxy to include a virtual host configured to use TLS/SSL (typically the “secure” virtual host).
SmartDocs proxy returning an exception The 500 - Internal Server Error message can be caused by an issue with the “smartdocs” proxy. In this case, you notice that the smartdocs proxy returns this error.
(c)2017 Apigee Corp. All Rights Reserved 139

Steps to Diagnose Use the Trace tool to diagnose errors with the “smartdocs” proxy, as described below. For more information, see Using the Trace tool.
1. Enable trace for the “smartdocs” Proxy in the “VALIDATE” org to locate the specific policy that is returning the 500 Internal Server Error.
2. Select the specific policy in the trace to identify the cause of the error. Resolution Fix the error identified. If you need assistance, contact Apigee Support.
Edge Message Processors unable to call published API endpoint 500 - Internal Server Error can also occur when the Message Processors belonging to the org hosting the Smartdocs proxy are unable to call the API endpoint.
(c)2017 Apigee Corp. All Rights Reserved 140

Steps to Diagnose Use the Trace tool to diagnose errors with the “smartdocs” proxy, as described below. For more information, see Using the Trace tool.
1. Enable trace for the “smartdocs” proxy in the “VALIDATE” org to locate the specific policy that is returning the 500 Internal Server Error.
2. In the sample UI trace shown above, it is seen that the JavaScript policy “BuildTargetAPIRequest” is failing to execute the target URL.
3. Obtain the target URL from the JavaScript policy “BuildTargetAPIRequest”.
4. Make a direct call to the URL from the Message Processor nodes associated with “VALIDATE” org as shown below: curl -v <target URL>
5. Correct any observed error.
(c)2017 Apigee Corp. All Rights Reserved 141

Resolution
1. Ensure that APIs published on Developer Portal can be invoked from Message Processors associated with the “VALIDATE” org and correct any errors encountered.
2. If you are able to execute the API call directly from the Message Processor, it’s very likely that you should be able to execute the API through SmartDocs as well.
3. Execute the API call through SmartDocs and check if the issue is fixed.
(c)2017 Apigee Corp. All Rights Reserved 142

Communication Issues between Developer Portal and Edge Description You might encounter one or more of the following issues caused by communication issues between the Developer Portal and Edge:
1. Unable to perform the following tasks: a. Create or update SmartDocs. b. Register developer apps. c. List API products.
2. Error returned when accessing SmartDocs models page on Developer Portal
(select Content > SmartDocs in the Developer Portal administration menu).
3. Developer app analytics not being generated. Error Messages
1. Error returned when accessing the “SmartDocs” tab in the developer portal:
2. Error returned when registering a developer app in the developer portal:
(c)2017 Apigee Corp. All Rights Reserved 143
Causes In most cases, the problem is due to incorrect devadmin credentials specified or insufficient permissions assigned to the devadmin user role. Validate the Edge connection configuration for the dev portal by navigating to Configuration > Dev Portal and ensuring the Connection Status field displays Connection Successful. Otherwise, the dev portal is not able to properly connect to the Edge Management server. Steps to Diagnose
1. Enable "DEBUG" logging on the dev portal by navigating to Configuration > Dev Portal and selecting Debug under Edge logging threshold. By default, Management API calls are not logged.
2. Reproduce the problem.
3. Access the log by navigating to Reports -> Recent Log Messages.
(c)2017 Apigee Corp. All Rights Reserved 144

4. Open the “Message” of type “LogPlugin” to learn more about the actual error. Sample output showing 401 Unauthorized Error
(c)2017 Apigee Corp. All Rights Reserved 145
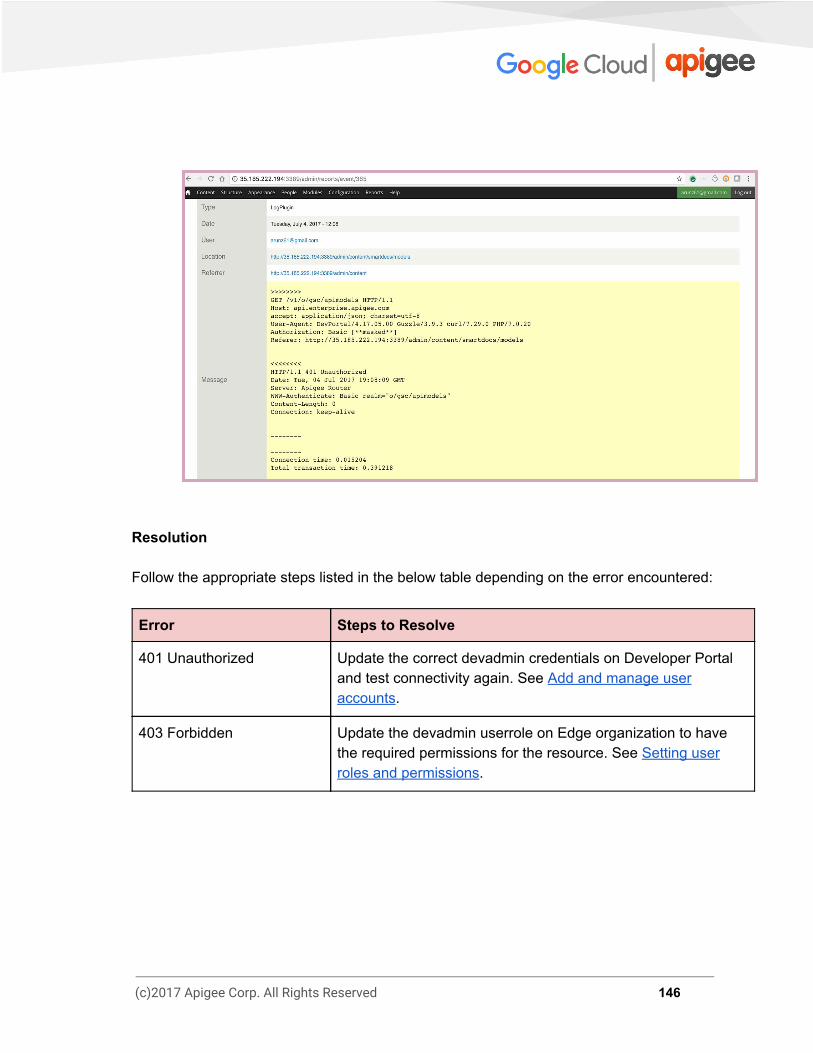
Resolution Follow the appropriate steps listed in the below table depending on the error encountered:
Error Steps to Resolve
401 Unauthorized Update the correct devadmin credentials on Developer Portal and test connectivity again. See Add and manage user accounts.
403 Forbidden Update the devadmin userrole on Edge organization to have the required permissions for the resource. See Setting user roles and permissions.
(c)2017 Apigee Corp. All Rights Reserved 146

Troubleshooting Edge Router Problems This section provides guidance and instructions to troubleshoot commonly observed problems with Edge Routers.
Bad Config Files Description The Edge Router is implemented by using Nginx. During the Edge upgrade process, or when changing the configuration of the Router, you might see Nginx configuration errors. When these errors occur, Edge marks all the Nginx configuration files that caused the issue to /opt/nginx/conf.d :
-rw-r--r-- 1 apigee apigee 522 Jul 20 08:41 0-default.conf.bad
-rw-r--r-- 1 apigee apigee 577 Jul 20 08:42 0-fallback.conf
-rw-r--r-- 1 apigee apigee 1062 Jul 20 08:18 0-map.conf
-rw-r--r-- 1 apigee apigee 1887 Jul 20 08:42
custorg_test_default.conf.bad
Error Messages You will not see any error messages. However, you might not be able to execute your API proxies because of the bad config files. Causes Typically the Nginx config file are marked bad either because incorrect value(s) are set to Nginx property(ies) in the /opt/apigee/customer/application/router.properties file or incorrect changes are made to a virtual host.
(c)2017 Apigee Corp. All Rights Reserved 147

Steps to Diagnose
1. Remove the .bad suffix from the file names in the /opt/nginx/conf.d directory so they end in .conf.
2. Run the Nginx configtest tool to determine the reason for the failure: /opt/nginx/scripts/apigee-nginx configtest
Resolution
1. If the config test identifies the reason for the bad config files, then fix the issue by making the appropriate changes to the specific property in the /opt/apigee/customer/application/router.properties file or virtual host.
2. Remove the /opt/nginx/conf.d directory: rm -rf /opt/nginx/conf.d
3. Restart the Router: /opt/apigee/apigee-service/bin/apigee-service edge-router restart
4. You should no longer see bad config files in the /opt/nginx/conf.d directory.
If the problem persists, contact Apigee Support. Here’s an example that shows how to fix the problem based on the information provided by the Nginx config test. Example: Incorrect Value set for a Nginx property
1. Let’s say you updated the property “proxy_busy_buffers_size” to 128K in the /opt/apigee/customer/application/router.properties file, as shown below:
(c)2017 Apigee Corp. All Rights Reserved 148

conf_load_balancing_load.balancing.driver.proxy.busy.buffer
.size=128k
This caused the config files to be marked as bad in /opt/apigee/nginx/conf.d directory.
2. Run the Nginx configtest command to determine the reason for failure:
The configtest results indicates that the value for the property proxy_busy_buffers_size should be equal to or greater than proxy_buffer_size , but seems to be set with an incorrect value.
3. Check the values set for the properties proxy_buffer_size and proxy_busy_buffers_size in the 0-default.conf file: proxy_buffer_size 512k; proxy_busy_buffers_size 128k;
4. Update the value of proxy_busy_buffers_size to 512K in the /opt/apigee/customer/application/router.properties file: conf_load_balancing_load.balancing.driver.proxy.busy.buffer
.size=512k
5. Remove the /opt/nginx/conf.d folder:
rm -rf /opt/nginx/conf.d
6. Restart the router:
(c)2017 Apigee Corp. All Rights Reserved 149
/opt/apigee/apigee-service/bin/apigee-service edge-router restart
The issue was fixed and the bad config files were removed.
(c)2017 Apigee Corp. All Rights Reserved 150

Troubleshooting Monetization Problems This section provides information and guidance on troubleshooting commonly observed monetization problems.
Developer suspended Description Developer is suspended and will not be able to make any additional monetization transactions/API calls. Note: Developer suspension is enforced by the Monetization Limits Check Policy. If the policy is not attached to the proxy (or it is disabled), calls will go through unchecked, but they will be rated as FAILED. This would enable developers to get unlimited calls "for free". Error Messages
Steps to Diagnose To determine the reason that the developer has been suspended, perform the following steps:
1. Execute the following API call to identify the error code associated with the suspended developer:
(c)2017 Apigee Corp. All Rights Reserved 151

curl -X GET "https://api.enterprise.apigee.com/v1/mint/organizations/{o
rg}/suspended-developers/{developer-email}" -u orgadminEmail:passwrd
2. Compare the error code with the following reasons codes to determine why the developer was suspended. See also: http://docs.apigee.com/monetization/content/unsuspend-developers#suspend-reason-codes
Reason Code Cause Details
INSUFFICIENT
_FUNDS Developer account balance is depleted
If the prepaid developer account balance does not have enough funds for any additional transactions, then the developer will be suspended. For postpaid developers, this error can occur if they exceed their credit limit or if the credit limit set on the currency used is depleted.
LIMIT_VIOLAT
ED
Developer is unable to make any further transactions
Every developer is allowed to make a fixed number of transactions based on the rate plan purchased. If the number of transactions is exceeded, then the developer is suspended and cannot complete additional transactions.
RATE_PLAN_RA
TE_BAND_EXCE
EDED
NO_CURRENT_P
UBLISHABLE_E
NTITY
Developer has not purchased any rate plan
A developer must purchase a rate plan before completing any transactions.
(c)2017 Apigee Corp. All Rights Reserved 152

Resolution
Error Steps to Resolve
INSUFFICIENT_FUNDS The developer needs to make sure that there is a sufficient account balance or available credit in order to complete any additional transactions.
LIMIT_VIOLATED
1. Make the following API calls to get the developer rate plan and transaction details, respectively:
● Run the following API call to get the start and end date of the rate plans that the developer has purchased:
http://docs.apigee.com/monet
ize/apis/get/organizations/%
7Borg_name%7D/developers/%7B
developer_id%7D/developer-ac
cepted-rateplans
● Run the following API call to get the
number of successful transactions made by the developer :
http://docs.apigee.com/monetiz
e/apis/get/organizations/%7Bor
g_name%7D/transactions/develop
ers/%7Bdeveloper_email_or_id%7
D
2. In Edge UI, you can also check the number of calls a developer is allowed to make by selecting: Packages -> PackageName -> RatePlanName -> Rate Card
RATE_PLAN_RATE_BAND_EXCEEDED
(c)2017 Apigee Corp. All Rights Reserved 153

For example, if the package name is ‘Pro Package’ and it’s a Free Plan, then the path would be: Packages -> Pro Package -> Free Plan -> Rate Card
NO_CURRENT_PUBLISHABLE_ENTITY The developer has to purchase a rate plan to be able to make API calls.
(c)2017 Apigee Corp. All Rights Reserved 154

Monetization setup issues Description The Monetization setup issues can manifest as different symptoms such as:
● Webhooks functionality not working ○ Cannot create webhooks ○ Webhook notifications not being triggered
● Monetization Reports not showing any transactions ○ For example, the Analytics data indicates that the developer has completed
many transactions in a specific period of time, but the Monetization reports don’t list any of those transactions.
● Transactions not getting recorded Error Messages You may not observe any error messages, but you will see issues as explained in the Description section above. Causes If you are seeing any of the symptoms listed above in the Description section, then it’s very likely the transactions are not being monetized. Steps to Diagnose
1. Use the management API call described in the following section to check if the transactions are being monetized. http://docs.apigee.com/monetization/content/transaction-status
2. If you don’t see any transactions being listed as ‘SUCCESS’ within the specified duration, then the transactions are not monetized.
The typical causes for the transactions not being monetized are:
(c)2017 Apigee Corp. All Rights Reserved 155

Cause
Monetization Limits Check Policy Not Attached To API Proxy
APIProduct is not Monetized
Transaction Recording Policy incorrectly defined
Developer has not purchased rate plan
The following sections describe how to diagnose and resolve each issue.
Monetization Limits Check Policy not used in API Proxy Steps To Diagnose
1. Check whether the Monetization Limits Check Policy is attached to the API proxies.
2. If the policy is not attached, then this could be the reason that transactions are listed as ‘FAILED’.
Resolution Attach the Monetization Limits Check Policy to the required API proxies, as described in the following section: http://docs.apigee.com/monetization/content/enforce-monetization-limits-using-monetization-limits-check-policy
If the problem persists, then check if the API Product is not monetized.
(c)2017 Apigee Corp. All Rights Reserved 156

API Product is not monetized Steps to Diagnose
1. Check if the API product is monetized (only monetized API products are rated and will be listed under transactions). A monetized product is one that has at least one active rate plan available.
2. Use the following management API call to get the list of monetized API products:
curl -v http://<management-host>:<port#> / v1 / mint / organizations /{ org_id }/ products ? monetized = true
3. If the API product associated with your API Proxy is not monetized, then this could be the reason that the transactions are not being monetized.
Resolution To monetize an API product, perform the following steps:
1. Create a transaction recording policy, as described in the following section: http://docs.apigee.com/monetization/content/create-transaction-recording-policy
2. Check that the API Product has an active rate plan. If the problem persists, then check if Transaction recording policy incorrectly defined
Transaction recording policy incorrectly defined Steps to Diagnose
1. Enable the UI trace for the API Proxy that has the Monetization Limits Check Policy attached.
(c)2017 Apigee Corp. All Rights Reserved 157
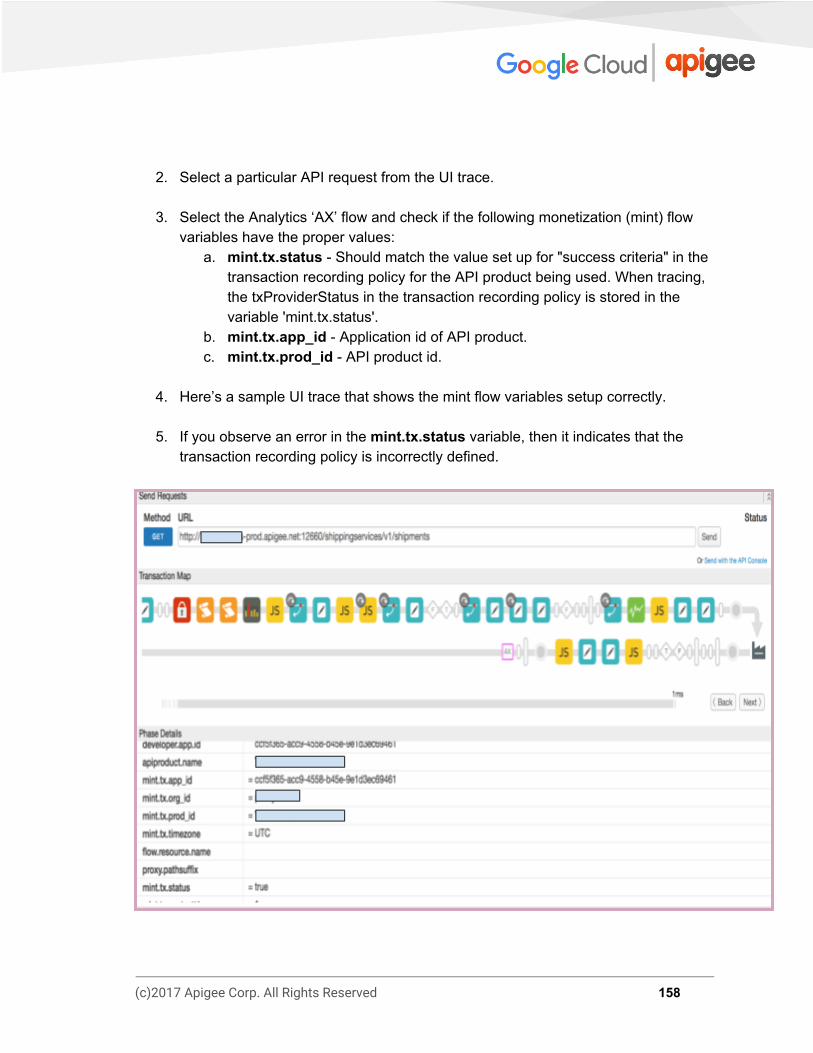
2. Select a particular API request from the UI trace.
3. Select the Analytics ‘AX’ flow and check if the following monetization (mint) flow variables have the proper values:
a. mint.tx.status - Should match the value set up for "success criteria" in the transaction recording policy for the API product being used. When tracing, the txProviderStatus in the transaction recording policy is stored in the variable 'mint.tx.status'.
b. mint.tx.app_id - Application id of API product. c. mint.tx.prod_id - API product id.
4. Here’s a sample UI trace that shows the mint flow variables setup correctly.
5. If you observe an error in the mint.tx.status variable, then it indicates that the
transaction recording policy is incorrectly defined.
(c)2017 Apigee Corp. All Rights Reserved 158
Resolution
1. Ensure that all the steps documented in the following section have been followed correctly while creating the transaction recording policy. http://docs.apigee.com/monetization/content/create-transaction-recording-policy
2. The key value is the ‘transaction success criteria’ set in the transaction recording policy. http://docs.apigee.com/monetization/content/create-transaction-recording-policy#success-criteria
Developer has not purchased rate plan
Steps to Diagnose
1. Use the following management API call to verify the rate plans purchased by the developer: curl -v http://<management-host>:<port#>/v1/mint/organizations/{org
}/developers/{dev_email}/products/{prod}/developer-rateplan
s
2. Based on the response from the above call, find the plan that was active at the time that the transaction was completed by the developer.
Resolution Developer must purchase the rate plan based on their requirements and then execute the transactions/APIs.
(c)2017 Apigee Corp. All Rights Reserved 159

Troubleshooting OpenLDAP Problems
This section provides information and guidance on troubleshooting OpenLDAP problems.
SMTP is disabled and users need to reset password
Description When SMTP is not set up on the Edge UI, new users added to Edge need a way to set a password. Error Messages
Causes New users are unable to get an email from the “Forgot your password?” link to set a password because SMTP is not set up.
(c)2017 Apigee Corp. All Rights Reserved 160

Resolution You can address this issue in one of the following ways: Solution #1: Configure SMTP Server Configure the SMTP Server to set a new password for the user using the instructions provided in the documentation. Solution #2: Using LDAP If you are unable to configure the SMTP server, then use the below LDAP commands to set the new password for a user:
1. An existing org admin needs to add the specific user via the Edge UI as shown below:
2. Use ldapsearch to find the user’s distinguished name (dn): ldapsearch -w Secret123 -D "cn=manager,dc=apigee,dc=com" -b "dc=apigee,dc=com" -LLL -h localhost -p 10389 > ldap.txt
Here is an example of a dn entry for a user, along with the attributes for the user:
(c)2017 Apigee Corp. All Rights Reserved 161

3. Open the ldap.txt and find the dn of the new user that has been added based on the new user's email attribute.
4. Execute the ldappassword command to add a password for the new user using its
dn. In this example, you are setting the user's password to Apigee123: ldappasswd -h localhost -p 10389 -D "cn=manager,dc=apigee,dc=com" -W -s Apigee123 "uid=f7a4a4a5-7c43-4168-a47e-6e9a1417cc29,ou=users,ou=globa
l,dc=apigee,dc=com"
5. Log in to the Edge UI as the new user with the password defined in the previous
step. The user can set a new password once logged into the UI.
(c)2017 Apigee Corp. All Rights Reserved 162
LDAP is not Replicating
Description Many Edge installations have multiple data centers, for example DC-1 and DC-2. When logging into the Edge UI in DC-1 as an org admin you can view the list of users, but that same user list does not appear in the Edge UI in DC-2. Error Messages No errors appear, the Edge UI simply does not show the list of users that should have been replicated across all OpenLDAP servers. Causes Typically the cause of this issue is a misconfigured OpenLDAP replication configuration, not the installation itself. Also, replication may break if the network between the OpenLDAP servers is not allowing traffic on port 10389. Steps to Diagnose Use the following troubleshooting steps to resolve the problem:
1. Check if ldapsearch returns data from each OpenLDAP server: ldapsearch -W -D "cn=manager,dc=apigee,dc=com" -b "dc=apigee,dc=com" -LLL -h <host-ip> -p 10389
2. Check if you can connect to each OpenLDAP node from the other OpenLDAP nodes on port 10389. If telnet is installed: telnet <OpenLDAP_Peer_IP> 10389
3. Check the replication configuration in the following file:
(c)2017 Apigee Corp. All Rights Reserved 163
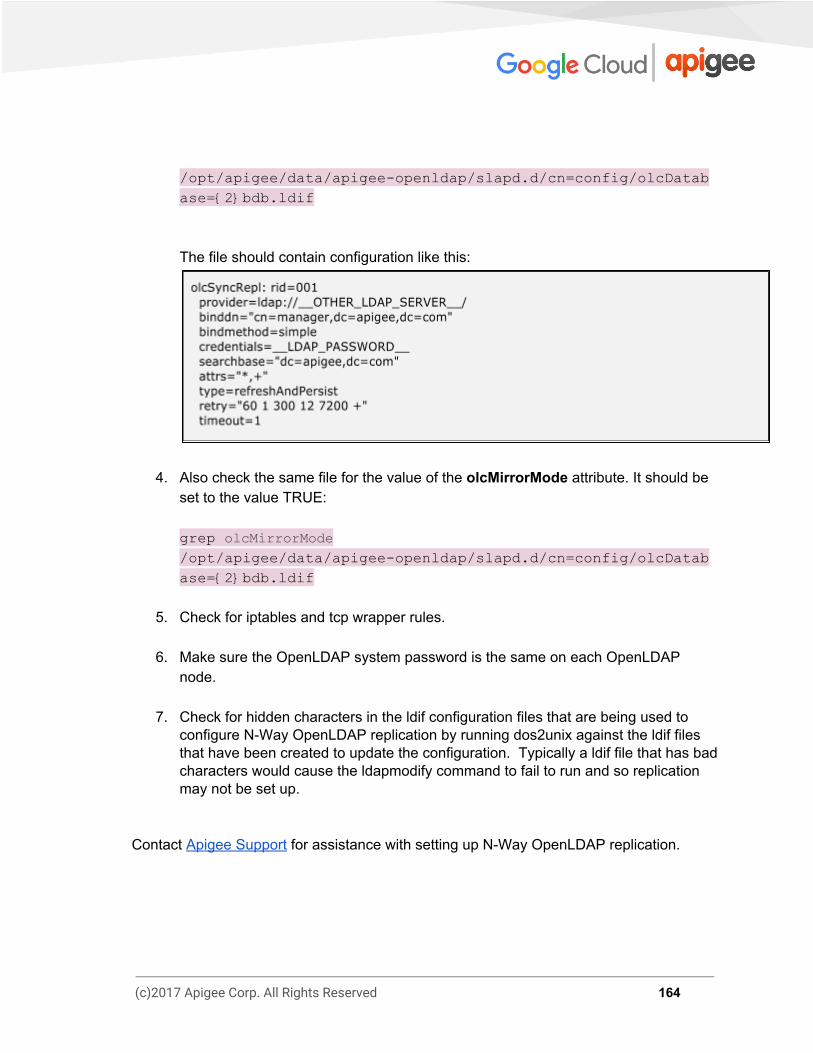
/opt/apigee/data/apigee-openldap/slapd.d/cn=config/olcDatab
ase={2}bdb.ldif
The file should contain configuration like this:
4. Also check the same file for the value of the olcMirrorMode attribute. It should be set to the value TRUE: grep olcMirrorMode /opt/apigee/data/apigee-openldap/slapd.d/cn=config/olcDatab
ase={2}bdb.ldif
5. Check for iptables and tcp wrapper rules.
6. Make sure the OpenLDAP system password is the same on each OpenLDAP node.
7. Check for hidden characters in the ldif configuration files that are being used to
configure N-Way OpenLDAP replication by running dos2unix against the ldif files that have been created to update the configuration. Typically a ldif file that has bad characters would cause the ldapmodify command to fail to run and so replication may not be set up.
Contact Apigee Support for assistance with setting up N-Way OpenLDAP replication.
(c)2017 Apigee Corp. All Rights Reserved 164
Unable to start OpenLDAP
Description OpenLDAP does not start. Error Messages SLAPD Dead But Pid File Exist Causes This issue is typically caused by a lock file that is left behind on the file system and needs to be removed. Steps to Diagnose Use the following steps to troubleshoot this issue:
1. Check for an OpenLDAP slapd process lock or pid file in the following location: /opt/apigee/var/run/apigee-openldap/apigee-openldap.lock
/opt/apigee/var/run/apigee-openldap/apigee-openldap.pid
2. Delete the lock and pid file, if found, and try to restart openldap. rm /opt/apigee/var/run/apigee-openldap/apigee-openldap.lock Rm /opt/apigee/var/run/apigee-openldap/apigee-openldap.pid
3. If the OpenLDAP slapd process does not start, try running slapd in debug mode and look for any errors: slapd -h ldap://:10389/ -u apigee -F /opt/apigee/data/apigee-openldap/slapd.d -d 255
(c)2017 Apigee Corp. All Rights Reserved 165
4. Errors may point to resource issues. Check memory and CPU utilization.
5. Check the version of OpenLDAP and upgrade if it is old. Check for the supported versions of OpenLDAP in our Supported Software document. slapd -V
6. Use strace to troubleshoot slapd process, and to provide strace output to Apigee Support: strace -tt -T -f -F -i -v -e read=all -s 8192 -e write=all -o /tmp/strace.out -p <pid>
(c)2017 Apigee Corp. All Rights Reserved 166

OpenLDAP Data Corruption Description Users are no longer able to run management calls or log in to the Edge UI. Using ldapsearch utility to query the users may indicate the user exists in the LDAP datastore, or may identify possible missing users or roles. Error Messages Unknown username and password combination. Causes Typically, OpenLDAP data does not get corrupted. But in the rare case that it does, the corruption could be due to system disk failure or disk space issues. Steps to Diagnose
1. Check the disk space on the system having OpenLDAP installed using the below command: du -m /opt
2. If you see the disk space used is very close to 100%, then that would indicate the
cause for this issue is your system running out of disk space. Resolution If your system has run out of disk space or very near to running out of disk space, then add more disk space to ensure you have sufficient disk space. Once you have sufficient disk space use one of the below solutions to address the LDAP data corruption issue:
(c)2017 Apigee Corp. All Rights Reserved 167

1. Restore the OpenLDAP data from the backup.
2. Clean up the OpenLDAP database.
Solution #1 Restore the LDAP data from the backup On a working OpenLDAP node make a backup. The backup should be performed regularly. See Apigee Private Cloud Operations Guide for best practices on backups: slapcat -F /opt/apigee/data/apigee-openldap/slapdd -l /tmp/ldap-backup.ldif
The following steps can be used to restore the OpenLDAP data from a good backup.
1. Stop the OpenLDAP node for which the data needs to be restored: /opt/apigee/apigee-service/bin/apigee-service
apigee-openldap stop
2. Change directory to the OpenLDAP data directory: cd /opt/apigee/data/apigee-openldap
3. Back up the existing OpenLDAP data using the move command: mv ldap ldap_orig
4. Switch to the apigee user: su apigee
5. From /opt/apigee/data/apigee-openldap directory, create a new OpenLDAP data directory with the original name: mkdir ldap
6. Take the backup of ldap_orig/DB_CONFIG subdirectory from step 3, and copy it to the openldap directory.
(c)2017 Apigee Corp. All Rights Reserved 168
cp ldap_orig/DB_CONFIG ldap
7. To restore data from backup taken with slapcat, use slapadd to import the ldif which contains the good data: slapadd -F /opt/apigee/data/apigee-openldap/slapd.d -l /tmp/ldap-backup.ldif
8. Start the OpenLDAP process: /opt/apigee/apigee-service/bin/apigee-service
apigee-openldap start
Solution #2 Cleanup the LDAP database The following steps wipe out the OpenLDAP database to provide a fresh start. This solution can be used if there is no data backup of the last state where the OpenLDAP data was working.
1. Stop the OpenLDAP service: /opt/apigee/apigee-service/bin/apigee-service
apigee-openldap stop
2. Change directory to the OpenLDAP data directory: cd /opt/apigee/data/apigee-openldap
3. Back up the existing OpenLDAP data using the move command: mv ldap ldap_orig
4. Switch to the apigee user: su apigee
(c)2017 Apigee Corp. All Rights Reserved 169

5. Create a new OpenLDAP data directory with the original name: mkdir ldap
6. Take the backup ldap_orig/DB_CONFIG subdirectory from step 3, and copy it to the openldap directory: cp ldap_orig/DB_CONFIG ldap
7. Restart the OpenLDAP process: /opt/apigee/apigee-service/bin/apigee-service
apigee-openldap start
8. Restart the Management Server to force a refresh of the connections to OpenLDAP: /opt/apigee/apigee-service/bin/apigee-service
edge-management-server restart
(c)2017 Apigee Corp. All Rights Reserved 170

Troubleshooting ZooKeeper Problems This section provides information and guidance on troubleshooting common ZooKeeper problems.
ZooKeeper Connection Loss Errors Description The ZooKeeper connectivity issues can manifest as different symptoms such as:
1. API proxy deployment errors 2. Management API calls fail with 5XX errors 3. Routers or Message Processors fail to start 4. Analytics components report ZooKeeper connection loss in system.logs
Error Messages The following provides examples of error messages that may be observed when there is connection loss to ZooKeeper node(s).
1. The following error is returned in Management Server logs when an API Proxy deployment fails due to ZooKeeper Connection loss:
(c)2017 Apigee Corp. All Rights Reserved 171

2. During startup, the Routers and Message Processors connect to ZooKeeper. If there are connectivity issues with ZooKeeper, then these components will fail to start with the following error:
(c)2017 Apigee Corp. All Rights Reserved 172
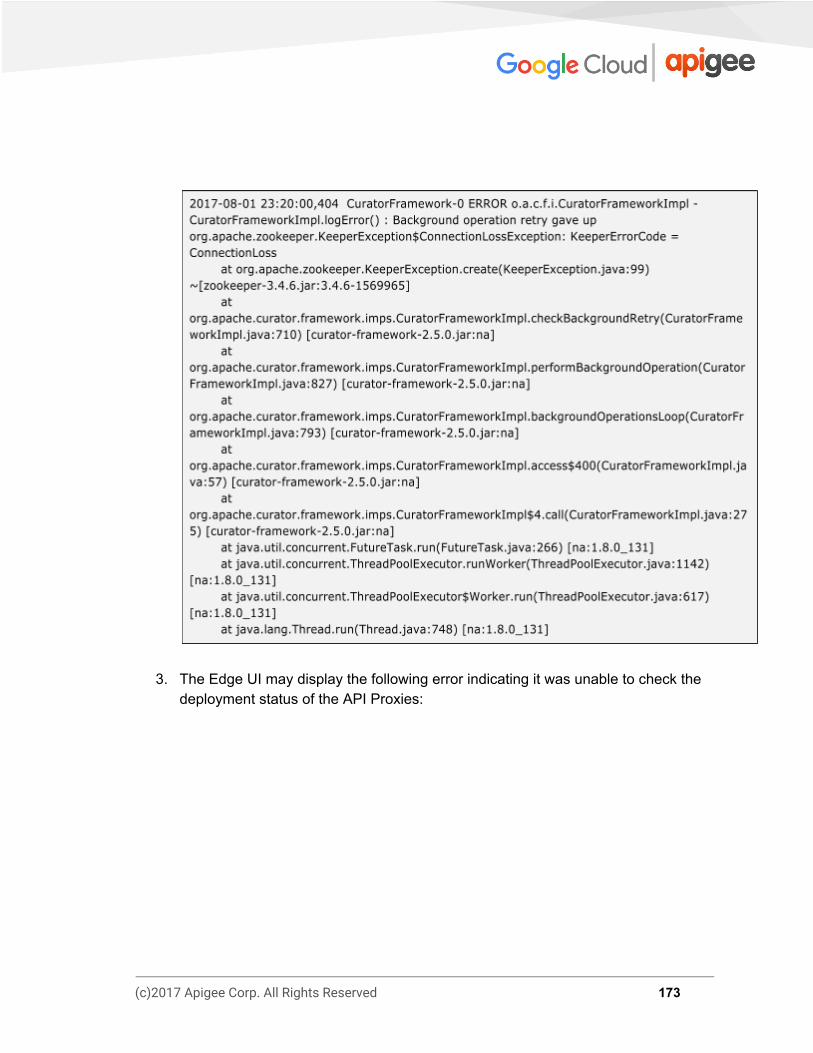
3. The Edge UI may display the following error indicating it was unable to check the deployment status of the API Proxies:
(c)2017 Apigee Corp. All Rights Reserved 173
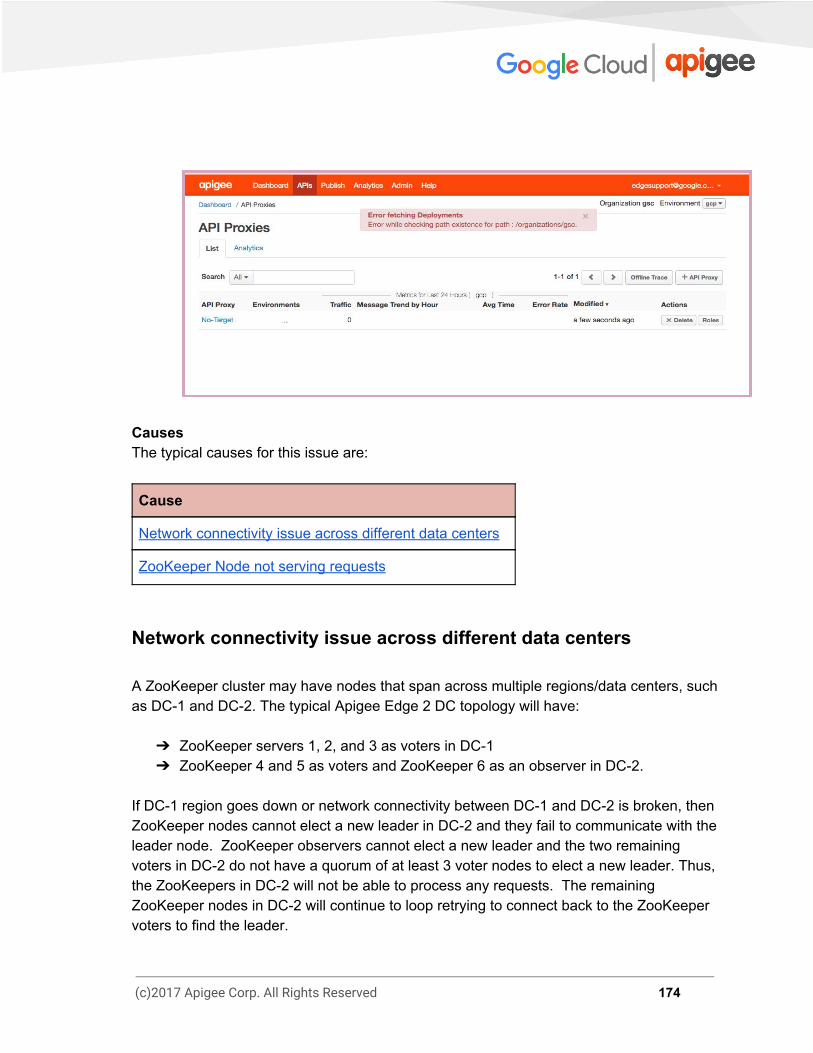
Causes The typical causes for this issue are:
Cause
Network connectivity issue across different data centers
ZooKeeper Node not serving requests
Network connectivity issue across different data centers A ZooKeeper cluster may have nodes that span across multiple regions/data centers, such as DC-1 and DC-2. The typical Apigee Edge 2 DC topology will have:
➔ ZooKeeper servers 1, 2, and 3 as voters in DC-1 ➔ ZooKeeper 4 and 5 as voters and ZooKeeper 6 as an observer in DC-2.
If DC-1 region goes down or network connectivity between DC-1 and DC-2 is broken, then ZooKeeper nodes cannot elect a new leader in DC-2 and they fail to communicate with the leader node. ZooKeeper observers cannot elect a new leader and the two remaining voters in DC-2 do not have a quorum of at least 3 voter nodes to elect a new leader. Thus, the ZooKeepers in DC-2 will not be able to process any requests. The remaining ZooKeeper nodes in DC-2 will continue to loop retrying to connect back to the ZooKeeper voters to find the leader.
(c)2017 Apigee Corp. All Rights Reserved 174

Resolution Apply the following solutions to address this issue in the specified order. Solution #1
1. Work with your network administrators to repair the network connectivity issue between the data centers.
2. When the ZooKeeper ensemble are able to communicate across the data centers
and elect a ZooKeeper leader, the nodes should become healthy and be able to process requests.
Solution #2
1. If the network connectivity will take time to repair, a workaround is to reconfigure ZooKeeper nodes in the region where they are down. For example, reconfigure the ZooKeeper cluster in DC-2 so that the 3 ZooKeeper nodes in this region are all voters and remove the server.# in the zoo.cfg of the ZooKeepers from DC-1 region.
a. In the following example, zoo.cfg configures nodes for 2 regions where DC-1 uses us-ea hostnames denoting US-East region and DC-2 uses us-wo hostnames denoting US-West region. (NOTE: Only relevant configs are displayed)
server.1= zk01ea.us-ea.4.apigee.com:2888:3888 server.2=zk02ea.us-ea.4.apigee.com:2888:3888
server.3=zk03ea.us-ea.4.apigee.com:2888:3888
server.4=zk04wo.us-wo.4.apigee.com:2888:3888
server.5=zk05wo.us-wo.4.apigee.com:2888:3888
server.6=zk06wo.us-wo.4.apigee.com:2888:3888:observer
In the above example, reconfigure the zoo.cfg as follows:
server.1=zk04wo.us-wo.4.apigee.com:2888:3888
server.2=zk05wo.us-wo.4.apigee.com:2888:3888
server.3=zk06wo.us-wo.4.apigee.com:2888:3888
(c)2017 Apigee Corp. All Rights Reserved 175

b. Using code with config, create a file /opt/apigee/customer/application/ZooKeeper.properties with the following: conf_zoo_quorum=server.1=zk04wo.us-wo.4.apigee.com:2888:38
88\
\nserver.2=zk05wo.us-wo.4.apigee.com:2888:3888\
\nserver.3=zk06wo.us-wo.4.apigee.com:2888:3888\
In the above, the nodes from US-East are removed, and the US-West nodes get promoted to voters when the :observer annotation is removed.
2. Back up /opt/apigee/apigee-ZooKeeper/conf/zoo.cfg and old /opt/apigee/customer/application/ZooKeeper.properties .
These files will be used to restore the defaults when the network connectivity is back up between data centers.
3. Restart the ZooKeeper nodes in the region where you reconfigured the ZooKeeper
cluster.
4. Repeat the above configuration from step #1b through step# 3 on all ZooKeeper nodes in DC-2.
5. Validate the nodes are up with a leader:
> echo srvr | nc zk04wo.us-wo.4.apigee.com 2181 > echo srvr | nc zk05wo.us-wo.4.apigee.com 2181 > echo srvr | nc zk06wo.us-wo.4.apigee.com 2181 The output of this command will contain a line that says "mode" followed by "leader" if it is the leader, or "follower" if it is a follower. When the network between data centers is reestablished, the ZooKeeper configurations changes can be reverted on the ZooKeeper nodes in DC-2.
Solution #3
1. If ZooKeeper node(s) in the cluster is not started, then restart it.
(c)2017 Apigee Corp. All Rights Reserved 176

2. Check ZooKeeper logs to determine why the ZooKeeper node went down.
ZooKeeper logs are available in the following directory: $ cd /opt/apigee/var/log/apigee-zookeeper $ ls -l total 188 -rw-r--r--. 1 apigee apigee 2715 Jul 22 19:51 apigee-zookeeper.log
-rw-r--r--. 1 apigee apigee 10434 Jul 17 19:51 config.log -rw-r--r--. 1 apigee apigee 169640 Aug 1 19:51 zookeeper.log
3. Contact Apigee Support and provide the ZooKeeper logs to troubleshoot the cause
of any ZooKeeper node that may have been stopped.
ZooKeeper node not serving requests A ZooKeeper node in the ensemble may become unhealthy and be unable to respond to client requests. This could be because:
1. The node was stopped without being restarted.
2. The node was rebooted without auto-start enabled.
3. System load on the node caused it to go down or become unhealthy. Steps to Diagnose
1. Execute the following ZooKeeper health check commands on each of the ZooKeeper nodes and check the output:
a. echo "ruok" | nc localhost 2181 Note: Response “imok” is a successful response. Example output: $ echo "ruok" | nc localhost 2181 imok
(c)2017 Apigee Corp. All Rights Reserved 177

b. echo srvr | nc localhost 2181 Check the mode to determine if the ZooKeeper node is a leader or follower. Example output for an all in one, single ZooKeeper node: $ echo srvr | nc localhost 2181 ZooKeeper version: 3.4.5-1392090, built on 09/30/2012 17:52 GMT Latency min/avg/max: 0/0/88 Received: 4206601 Sent: 4206624 Connections: 8 Outstanding: 0 Zxid: 0x745 Mode: standalone Node count: 282
c. echo mntr | nc localhost 2181 This command lists the ZooKeeper variables which can be used to check the health of the ZooKeeper cluster. Example output: $ echo mntr | nc localhost 2181 zk_version 3.4.5-1392090, built on 09/30/2012 17:52 GMT
zk_avg_latency 0
zk_max_latency 88
zk_min_latency 0
zk_packets_received 4206750
zk_packets_sent 4206773
zk_num_alive_connections 8
zk_outstanding_requests 0
zk_server_state standalone
zk_znode_count 282
zk_watch_count 194
zk_ephemerals_count 1
zk_approximate_data_size 22960
(c)2017 Apigee Corp. All Rights Reserved 178
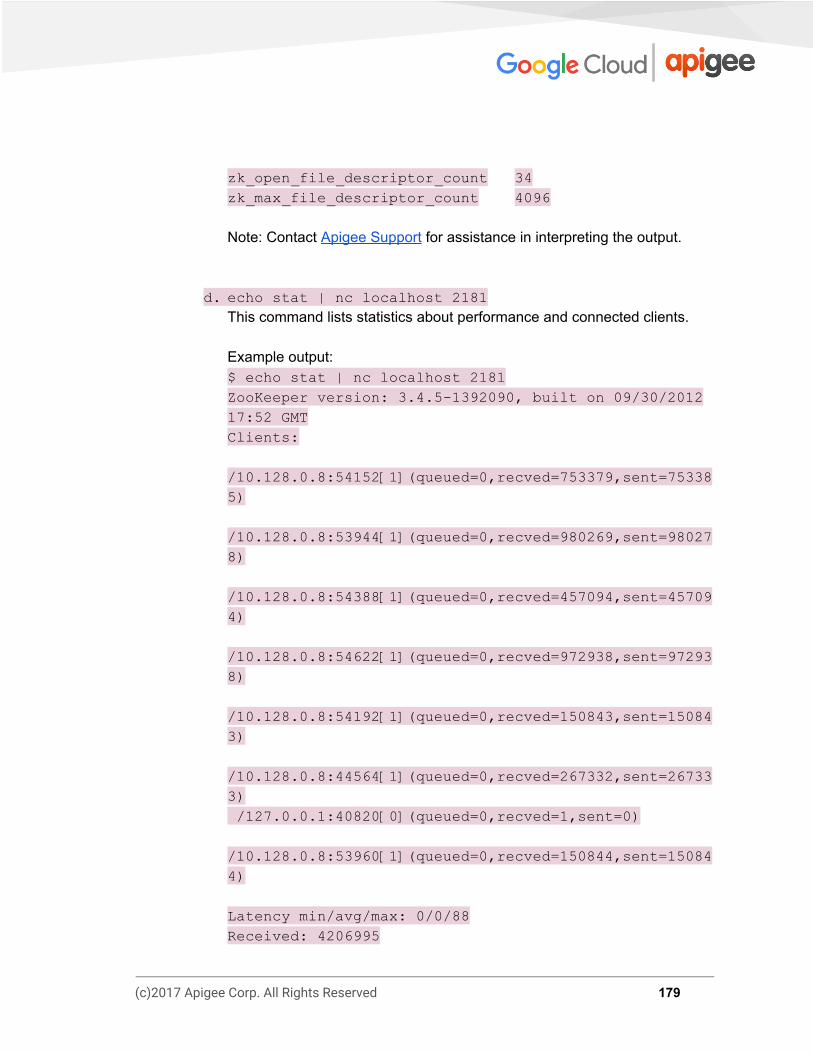
zk_open_file_descriptor_count 34
zk_max_file_descriptor_count 4096
Note: Contact Apigee Support for assistance in interpreting the output.
d. echo stat | nc localhost 2181 This command lists statistics about performance and connected clients. Example output: $ echo stat | nc localhost 2181 ZooKeeper version: 3.4.5-1392090, built on 09/30/2012 17:52 GMT Clients:
/10.128.0.8:54152[1](queued=0,recved=753379,sent=75338
5)
/10.128.0.8:53944[1](queued=0,recved=980269,sent=98027
8)
/10.128.0.8:54388[1](queued=0,recved=457094,sent=45709
4)
/10.128.0.8:54622[1](queued=0,recved=972938,sent=97293
8)
/10.128.0.8:54192[1](queued=0,recved=150843,sent=15084
3)
/10.128.0.8:44564[1](queued=0,recved=267332,sent=26733
3)
/127.0.0.1:40820[0](queued=0,recved=1,sent=0)
/10.128.0.8:53960[1](queued=0,recved=150844,sent=15084
4)
Latency min/avg/max: 0/0/88 Received: 4206995
(c)2017 Apigee Corp. All Rights Reserved 179
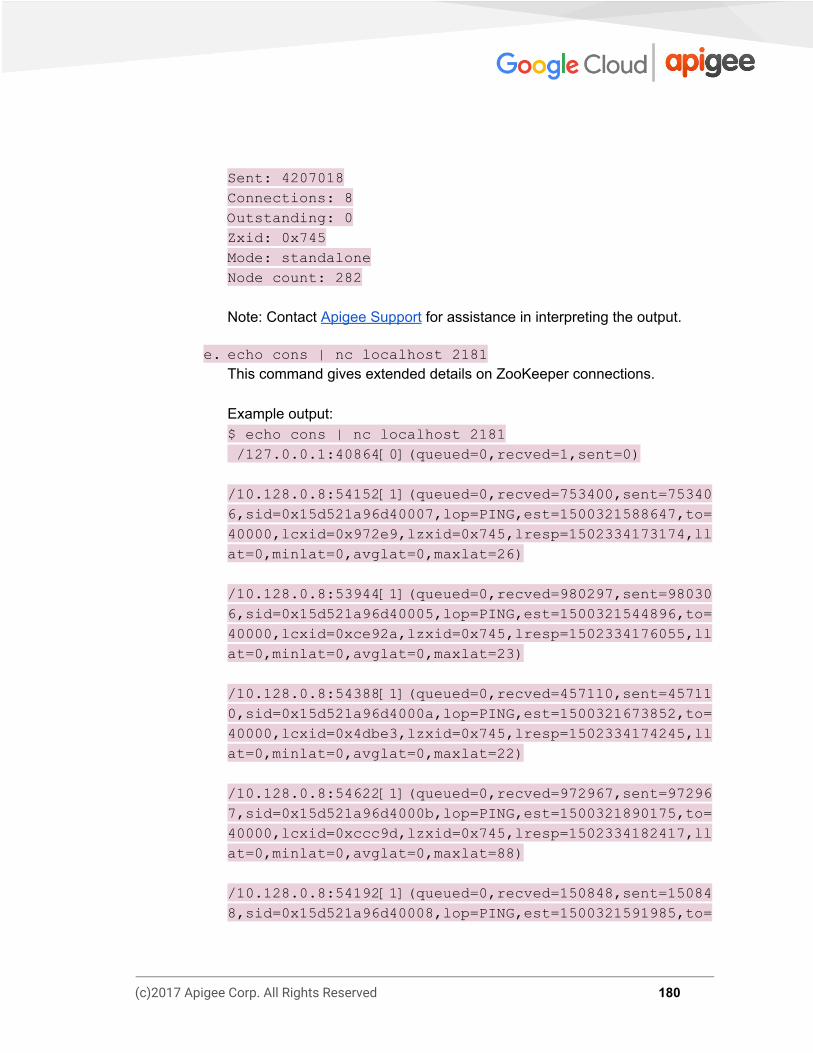
Sent: 4207018 Connections: 8 Outstanding: 0 Zxid: 0x745 Mode: standalone Node count: 282
Note: Contact Apigee Support for assistance in interpreting the output.
e. echo cons | nc localhost 2181 This command gives extended details on ZooKeeper connections. Example output: $ echo cons | nc localhost 2181 /127.0.0.1:40864[0](queued=0,recved=1,sent=0)
/10.128.0.8:54152[1](queued=0,recved=753400,sent=75340
6,sid=0x15d521a96d40007,lop=PING,est=1500321588647,to=
40000,lcxid=0x972e9,lzxid=0x745,lresp=1502334173174,ll
at=0,minlat=0,avglat=0,maxlat=26)
/10.128.0.8:53944[1](queued=0,recved=980297,sent=98030
6,sid=0x15d521a96d40005,lop=PING,est=1500321544896,to=
40000,lcxid=0xce92a,lzxid=0x745,lresp=1502334176055,ll
at=0,minlat=0,avglat=0,maxlat=23)
/10.128.0.8:54388[1](queued=0,recved=457110,sent=45711
0,sid=0x15d521a96d4000a,lop=PING,est=1500321673852,to=
40000,lcxid=0x4dbe3,lzxid=0x745,lresp=1502334174245,ll
at=0,minlat=0,avglat=0,maxlat=22)
/10.128.0.8:54622[1](queued=0,recved=972967,sent=97296
7,sid=0x15d521a96d4000b,lop=PING,est=1500321890175,to=
40000,lcxid=0xccc9d,lzxid=0x745,lresp=1502334182417,ll
at=0,minlat=0,avglat=0,maxlat=88)
/10.128.0.8:54192[1](queued=0,recved=150848,sent=15084
8,sid=0x15d521a96d40008,lop=PING,est=1500321591985,to=
(c)2017 Apigee Corp. All Rights Reserved 180

40000,lcxid=0x8,lzxid=0x745,lresp=1502334184475,llat=3
,minlat=0,avglat=0,maxlat=19)
/10.128.0.8:44564[1](queued=0,recved=267354,sent=26735
5,sid=0x15d521a96d4000d,lop=PING,est=1501606633426,to=
40000,lcxid=0x356e2,lzxid=0x745,lresp=1502334182315,ll
at=0,minlat=0,avglat=0,maxlat=35)
/10.128.0.8:53960[1](queued=0,recved=150848,sent=15084
8,sid=0x15d521a96d40006,lop=PING,est=1500321547138,to=
40000,lcxid=0x5,lzxid=0x745,lresp=1502334177036,llat=1
,minlat=0,avglat=0,maxlat=20)
Note: Contact Apigee Support for assistance in interpreting the output.
If any of the last 3 health check commands show the following message:
Then it indicates that specific ZooKeeper node(s) is not serving requests.
2. Check the ZooKeeper logs on the specific node and try to locate any errors causing the ZooKeeper to be down. ZooKeeper logs are available in the following directory:
$ cd /opt/apigee/var/log/apigee-zookeeper $ ls -l total 188 -rw-r--r--. 1 apigee apigee 2715 Jul 22 19:51 apigee-zookeeper.log
-rw-r--r--. 1 apigee apigee 10434 Jul 17 19:51 config.log
-rw-r--r--. 1 apigee apigee 169640 Aug 1 19:51 zookeeper.log
Resolution
(c)2017 Apigee Corp. All Rights Reserved 181

1. Restart all other ZooKeeper nodes in the cluster one by one.
2. Re-run the ZooKeeper health check commands on each node and see if you get the expected output.
Contact Apigee Support to troubleshoot the cause of system load if it persists or if restarts does not resolve the problem.
(c)2017 Apigee Corp. All Rights Reserved 182

Unable to start ZooKeeper Description Unable to start the ZooKeeper process. Error Messages When you attempt to start the ZooKeeper process, the following error message is returned indicating that ZooKeeper could not be started.
Causes Here are the typical causes that can prevent ZooKeeper process from starting:
Cause
Misconfigured ZooKeeper MyId
ZooKeeper Port in Use
Incorrect process id in apigee-ZooKeeper.pid file
ZooKeeper Election Leader Failure
(c)2017 Apigee Corp. All Rights Reserved 183
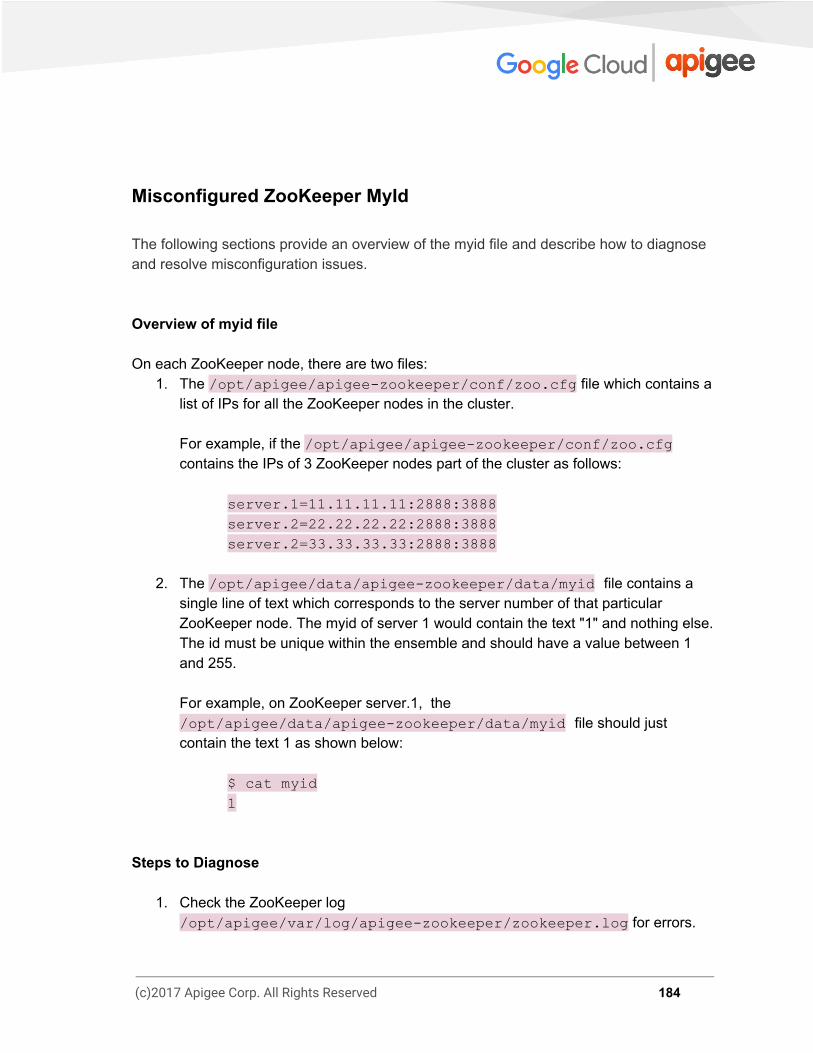
Misconfigured ZooKeeper MyId The following sections provide an overview of the myid file and describe how to diagnose and resolve misconfiguration issues. Overview of myid file On each ZooKeeper node, there are two files:
1. The /opt/apigee/apigee-zookeeper/conf/zoo.cfg file which contains a list of IPs for all the ZooKeeper nodes in the cluster. For example, if the /opt/apigee/apigee-zookeeper/conf/zoo.cfg contains the IPs of 3 ZooKeeper nodes part of the cluster as follows:
server.1=11.11.11.11:2888:3888
server.2=22.22.22.22:2888:3888
server.2=33.33.33.33:2888:3888
2. The /opt/apigee/data/apigee-zookeeper/data/myid file contains a single line of text which corresponds to the server number of that particular ZooKeeper node. The myid of server 1 would contain the text "1" and nothing else. The id must be unique within the ensemble and should have a value between 1 and 255. For example, on ZooKeeper server.1, the /opt/apigee/data/apigee-zookeeper/data/myid file should just contain the text 1 as shown below:
$ cat myid 1
Steps to Diagnose
1. Check the ZooKeeper log /opt/apigee/var/log/apigee-zookeeper/zookeeper.log for errors.
(c)2017 Apigee Corp. All Rights Reserved 184

2. If you see the WARN message similar to “Connection broken for id #, my id = #”, as shown in the below figure, then the possible cause for this issue could be that the server # in the myid file is misconfigured or corrupted.
3. Check the /opt/apigee/apigee-zookeeper/conf/zoo.cfg file and note
down the server.# for the current ZooKeeper node.
4. Check the /opt/apigee/data/apigee-zookeeper/data/myid file and see if the text in this file matches the server.# noted in step #2.
5. If there is a mismatch, then you have identified the cause for ZooKeeper failing to
start. Resolution If myid file is incorrectly configured, then edit the myid file and replace the value to a correct text representing the server.# parameter in the zoo.cfg.
ZooKeeper port in use
1. Check ZooKeeper log /opt/apigee/var/log/apigee-zookeeper/zookeeper.log for errors.
2. If you notice the exception java.net.BindException: Address already in use
while binding to the port #2181, as shown in the figure below, it indicates that the ZooKeeper port 2181 is being used by another process. Hence, the ZooKeeper could not be started.
(c)2017 Apigee Corp. All Rights Reserved 185
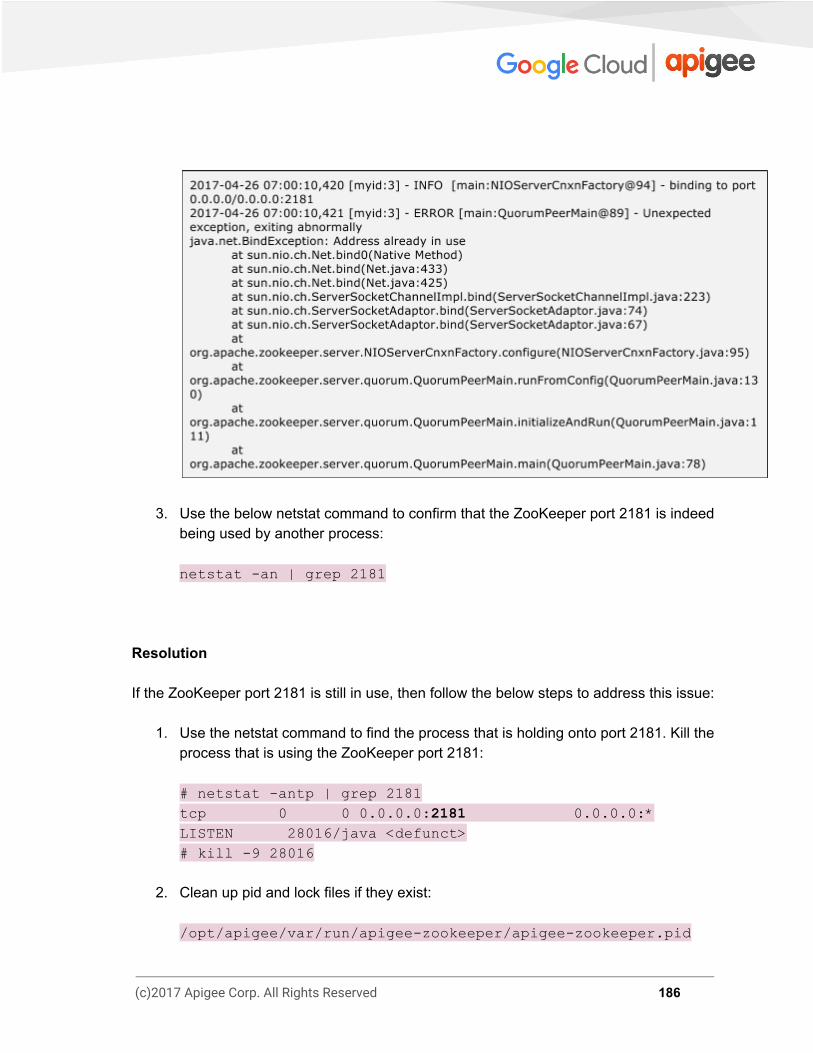
3. Use the below netstat command to confirm that the ZooKeeper port 2181 is indeed being used by another process: netstat -an | grep 2181
Resolution If the ZooKeeper port 2181 is still in use, then follow the below steps to address this issue:
1. Use the netstat command to find the process that is holding onto port 2181. Kill the process that is using the ZooKeeper port 2181: # netstat -antp | grep 2181 tcp 0 0 0.0.0.0: 2181 0.0.0.0:* LISTEN 28016/java <defunct> # kill -9 28016
2. Clean up pid and lock files if they exist:
/opt/apigee/var/run/apigee-zookeeper/apigee-zookeeper.pid
(c)2017 Apigee Corp. All Rights Reserved 186

/opt/apigee/var/run/apigee-zookeeper/apigee-zookeeper.lock
3. Restart the ZooKeeper: /opt/apigee/apigee-service/bin/apigee-service
apigee-zookeeper restart
Incorrect process id in apigee-zookeeper.pid file When you attempt to stop/restart the ZooKeeper, it may fail because the apigee-zookeeper.pid contains older/incorrect pid and not that of the currently running ZooKeeper process. This may happen if the ZooKeeper process terminated unexpectedly or abruptly for some reason and the apigee-zookeeper.pid file was not deleted. Steps to Diagnose
1. Get the process id of the currently running ZooKeeper process by running the ps command: ps -ef | grep zookeeper
2. Check if the /opt/apigee/var/run/apigee-ZooKeeper/apigee-zookeeper.pid file exists. If it exists, then note down the process id written into this file.
3. Compare the process ids taken from step #1 and #2. If they are different, then the
cause for this issue is having the incorrect process id in the apigee-zookeeper.pid file.
Resolution
1. Edit the apigee-zookeeper.pid file and replace the incorrect process id with the correct process id obtained from ps command (step #1 above).
(c)2017 Apigee Corp. All Rights Reserved 187

2. Restart the ZooKeeper: /opt/apigee/apigee-service/bin/apigee-service
apigee-zookeeper restart
ZooKeeper Leader Election Failure Steps to Diagnose
1. Check the ZooKeeper log /opt/apigee/var/log/apigee-zookeeper/zookeeper.log for errors.
2. Check if there were any configuration changes which may cause ZooKeeper
election of the leader to fail.
3. Check the /opt/apigee/apigee-zookeeper/conf/zoo.cfg and make sure all ZooKeepers in the cluster have the proper number and IP addresses for the server.# parameter. Also note that for the leader election to succeed there needs to be at least 3 voters minimum and the number of voters should be odd numbered. If there are too little voters, like only 2 voters, it cannot come to a quorum to decide a leader among only 2 voters.
Resolution Typically, ZooKeeper election failure is caused by misconfigured myid. Use the resolution in Misconfigured ZooKeeper MyId to address the election failure. If the problem persists and further diagnosis is needed, contact Apigee Support.
(c)2017 Apigee Corp. All Rights Reserved 188

ZooKeeper Data Issues Description Data related issues, commonly referred to as wiring issues, can manifest as one of the following symptoms:
➔ Failures during startup of Management servers ➔ Deployment failures ➔ Datastore errors on the UI ➔ Cross data center connectivity issues among Message Processors and
Management servers ➔ Analytics showing no data
These issues are not related to the ZooKeeper infrastructure, but related to invalid data that is available in the ZooKeeper tree. Causes The typical causes for this issue are:
1. Nodes wired to the wrong region or pod name during installation due to mistakes in the silent installation file.
2. A failed installation of a component creates duplicate registrations when you
reinstall the component multiple times. In this case, cleanup is required to remove the registration with the wrong UUIDs.
Steps to Diagnose Gather the following data:
1. Topology diagram, with hostname and ip addresses of each node and what Apigee component exist on the node. A mapping like the following using the profile of the Apigee install would be most helpful DC-1
DS: ip1 hostname DS: ip2 hostname DS: ip3 hostname
(c)2017 Apigee Corp. All Rights Reserved 189

MS: ip4 hostname RMP: ip5 hostname RMP: ip6 hostname SAX: ip7 hostname
DC-2
DS: ip8 hostname DS: ip9 hostname DS: ip10 hostname MS: ip11 hostname RMP: ip12 hostname RMP: ip13 hostname SAX: ip14 hostname
2. Generate ZooKeeper tree output to check the wiring:
/opt/apigee/apigee-ZooKeeper/contrib/zk-tree.sh > zk-tree-output.txt
3. For ease of verification of the data in ZooKeeper tree, run the following management API calls to get the list of server UUIDs in each of data centers: Gateway Servers curl -u [email protected] "http://<management-server-host>:8080/v1/servers?pod=gatewa
y®ion=<region-name>"
Central Servers curl -u [email protected] "http://<management-server-host>:8080/v1/servers?pod=centra
l®ion=<region-name>"
Analytics Servers curl -u [email protected] "http://<management-server-host>:8080/v1/servers?pod=analyt
ics®ion=<region-name>"
(c)2017 Apigee Corp. All Rights Reserved 190

4. Check the UUIDs on each component and make sure they match what you see in the ZooKeeper tree: Router curl 0:8081/v1/servers/self/uuid Message Processor curl 0:8082/v1/servers/self/uuid Qpid Agent curl 0:8083/v1/servers/self/uuid
Postgres Agent curl 0:8084/v1/servers/self/uuid
5. Use the UUID data to search the ZooKeeper tree output generated in step #2 to
validate the components wiring and to remove any duplicate registrations for the component that have the wrong UUIDs.
6. Use the management API calls listed here for correcting datastore registration.
The components like Routers, Message Processors, Postgres, and Qpid self register to ZooKeeper during startup time.
Resolution ZooKeeper data related problems need to be addressed on a case-by-case basis. Data in ZooKeeper is based on Apigee Edge topologies and vary by each use case. If one of the problem symptoms is being experienced, collect the data as explained in the previous section, “Steps to Diagnose,” and contact Apigee Support .
(c)2017 Apigee Corp. All Rights Reserved 191

PART 2 - Commands Quick Reference
Components Command Reference This section provides a quick reference summarizing the various commands that you can use to start, stop, and restart the components, get the version and status information about the components, and perform a backup of the components.
apigee-all You can use the apigee-all tool to start/stop/restart all the components, get the version and status information of all the components on a system. /opt/apigee/apigee-service/bin/apigee-all <command> Here’s the table that lists the various commands that can be used with apigee-tool:
apigee-all command reference table
Command Description Command
View version of all the components
/opt /apigee/apigee-service/bin/apigee-all version
View status of all components in a machine
/opt /apigee/apigee-service/bin/apigee-all status
Start all components in a machine
/opt /apigee/apigee-service/bin/apigee-all start
Stop all components in a machine
/opt /apigee/apigee-service/bin/apigee-all stop
Restart all components in a machine
/opt /apigee/apigee-service/bin/apigee-all restart
(c)2017 Apigee Corp. All Rights Reserved 192
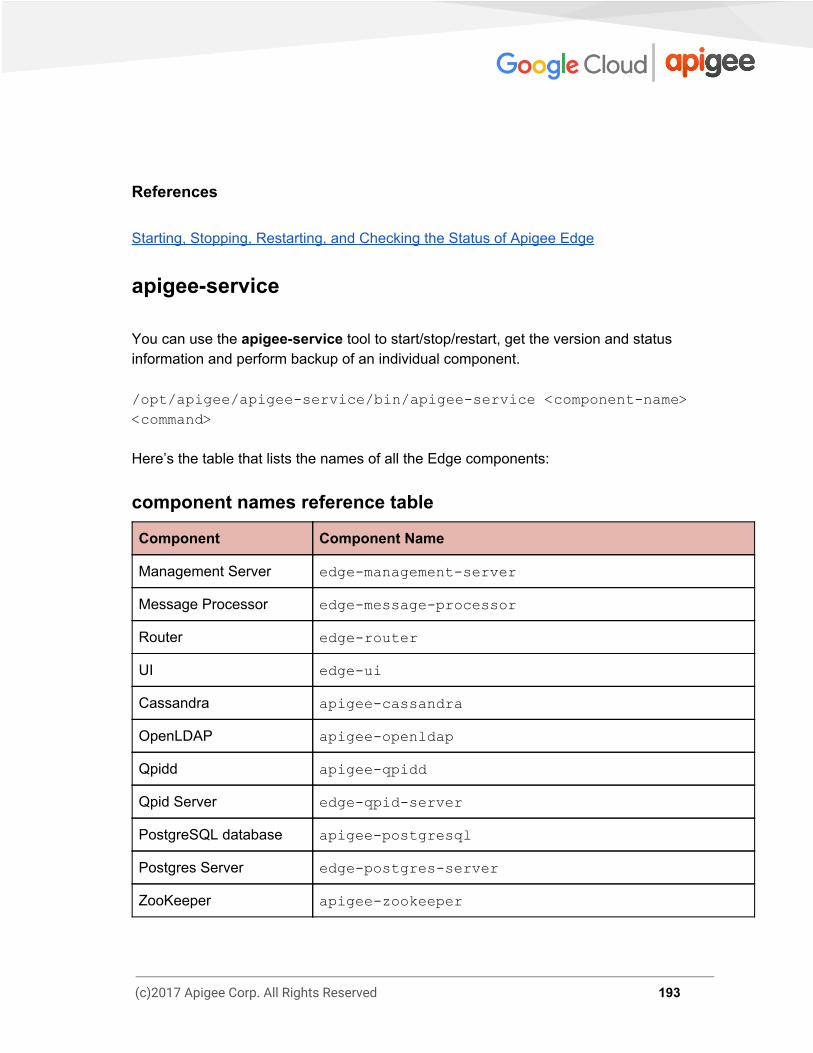
References Starting, Stopping, Restarting, and Checking the Status of Apigee Edge
apigee-service You can use the apigee-service tool to start/stop/restart, get the version and status information and perform backup of an individual component. /opt/apigee/apigee-service/bin/apigee-service <component-name> <command>
Here’s the table that lists the names of all the Edge components:
component names reference table
Component Component Name
Management Server edge-management-server
Message Processor edge-message-processor
Router edge-router
UI edge-ui
Cassandra apigee-cassandra
OpenLDAP apigee-openldap
Qpidd apigee-qpidd
Qpid Server edge-qpid-server
PostgreSQL database apigee-postgresql
Postgres Server edge-postgres-server
ZooKeeper apigee-zookeeper
(c)2017 Apigee Corp. All Rights Reserved 193

Here’s the table that lists the various commands that can be used with apigee-tool:
apigee-service command reference table
Command Description Command
View status of the specified component
/opt /apigee/apigee-service/bin/apigee-service <component-name> status
Example To view the status of Message Processor: /opt /apigee/apigee-service/bin/apigee-service edge-message-processor status
Start the specified component
/opt /apigee/apigee-service/bin/apigee-service <component-name> start
Example To start Message Processor: /opt /apigee/apigee-service/bin/apigee-service edge-message-processor start
Stop the specified component
/<inst_root> /apigee/apigee-service/bin/apigee-service <component-name> stop
Example To stop Message Processor:
/opt /apigee/apigee-service/bin/apigee-service edge-message-processor stop
Restart the specified component
/opt /apigee/apigee-service/bin/apigee-service <component-name> restart
Example To restart Message Processor: /opt /apigee/apigee-service/bin/apigee-service edge-message-processor restart
(c)2017 Apigee Corp. All Rights Reserved 194

Back up the specified component
/opt /apigee/apigee-service/bin/apigee-service <component-name> backup
Example To backup Cassandra: /opt /apigee/apigee-service/bin/apigee-service apigee-cassandra backup
References Backup and Restore
(c)2017 Apigee Corp. All Rights Reserved 195

Postgres Commands Reference
PostgreSQL (psql) utility The psql utility is the command-line interface to PostgreSQL. It enables you to query the Postgres database and get the results. Syntax psql -h <path to apigee-postgresql> -U <user> <database>
Example $ psql -h /opt/apigee/var/run/apigee-postgresql -U apigee apigee psql (9.3.10) Type "help" for help.
Verify existence of your org-env tables The Describe Table (dt) command can be used to check if your organization and environment level tables exist in the database. Syntax \dt analytics.*; Example apigee=# \dt analytics.*; List of relations Schema | Name | Type | Owner
-----------+-------------------------------+-------+--------
analytics | VALIDATE.test.agg_api | table | apigee analytics | VALIDATE.test.agg_app | table | apigee analytics | VALIDATE.test.agg_uri_pattern | table | apigee analytics | VALIDATE.test.fact | table | apigee analytics | VALIDATE.test.fact_1 | table | apigee analytics | VALIDATE.test.fact_2 | table | apigee analytics | _analytics_version | table | apigee
(c)2017 Apigee Corp. All Rights Reserved 196

analytics | agg_api_rollup_30min | table | apigee analytics | agg_app_rollup_30min | table | apigee analytics | agg_cache | table | apigee analytics | agg_cache_rollup_30min | table | apigee analytics | agg_geo | table | apigee analytics | agg_geo_rollup_30min | table | apigee analytics | agg_percentile | table | apigee analytics | agg_target | table | apigee
List the columns in fact table Command to describe the fact table. Use this command to check if columns exist and are correct. Syntax \d analytics."org.env.fact"; Note: replace org and env with the actual organization and environment name. Example apigee=# \d analytics."gsc.gcp.fact"; Table "analytics.gsc.gcp.fact" Column | Type | Modifiers
---------------------------------+-----------------------------+-
----------
organization | text | environment | text | apiproxy | text | request_uri | text | proxy | text | proxy_basepath | text | request_verb | text | request_size | bigint | response_status_code | integer | is_error | integer | client_received_start_timestamp | timestamp without time zone | client_received_end_timestamp | timestamp without time zone | target_sent_start_timestamp | timestamp without time zone |
(c)2017 Apigee Corp. All Rights Reserved 197

target_sent_end_timestamp | timestamp without time zone | target_received_start_timestamp | timestamp without time zone | target_received_end_timestamp | timestamp without time zone | client_sent_start_timestamp | timestamp without time zone | client_sent_end_timestamp | timestamp without time zone | client_ip | text | access_token | text | client_id | text | developer | text | developer_app | text | api_product | text | flow_resource | text | target | text | target_url | text | target_host | text | apiproxy_revision | text | proxy_pathsuffix | text | proxy_client_ip | text | target_basepath | text | client_host | text | target_ip | text | request_path | text | response_size | integer | developer_email | text | virtual_host | text | gateway_flow_id | text | sla | boolean | message_count | integer | total_response_time | real | request_processing_latency | real | response_processing_latency | real | target_response_time | real | cache_hit | integer | x_forwarded_for_ip | text | useragent | text | target_response_code | integer | groupid | integer | target_error | integer | policy_error | integer |
(c)2017 Apigee Corp. All Rights Reserved 198
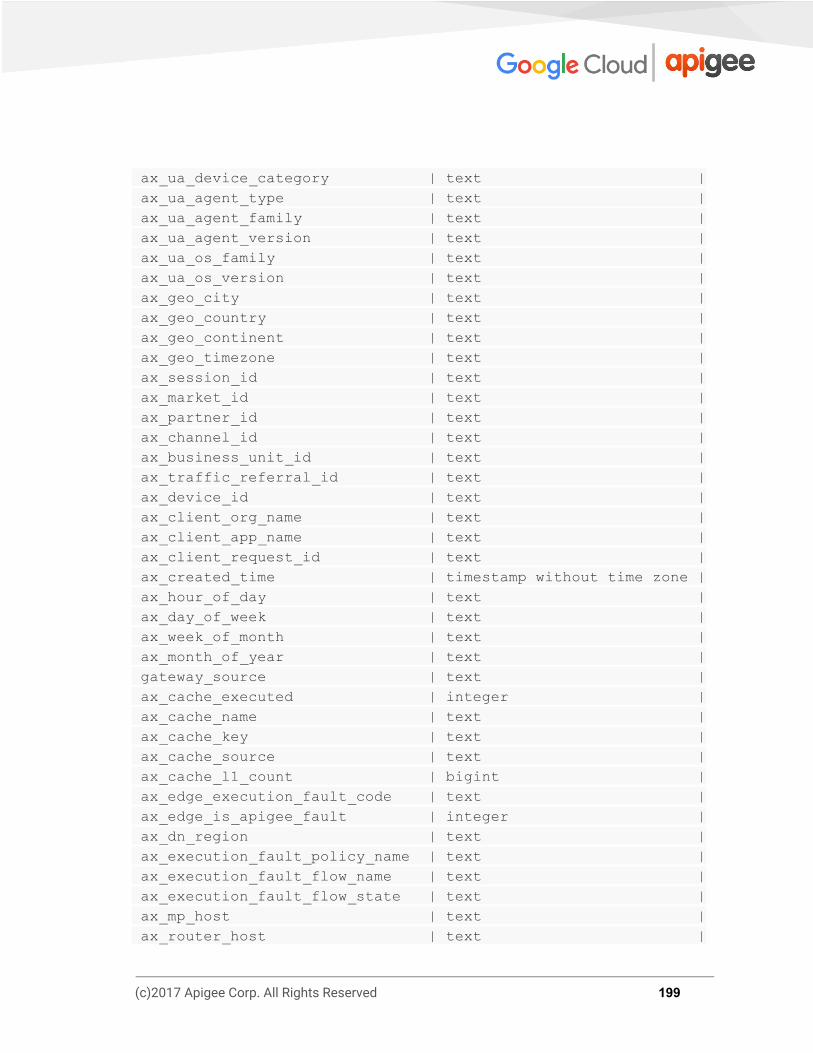
ax_ua_device_category | text | ax_ua_agent_type | text | ax_ua_agent_family | text | ax_ua_agent_version | text | ax_ua_os_family | text | ax_ua_os_version | text | ax_geo_city | text | ax_geo_country | text | ax_geo_continent | text | ax_geo_timezone | text | ax_session_id | text | ax_market_id | text | ax_partner_id | text | ax_channel_id | text | ax_business_unit_id | text | ax_traffic_referral_id | text | ax_device_id | text | ax_client_org_name | text | ax_client_app_name | text | ax_client_request_id | text | ax_created_time | timestamp without time zone | ax_hour_of_day | text | ax_day_of_week | text | ax_week_of_month | text | ax_month_of_year | text | gateway_source | text | ax_cache_executed | integer | ax_cache_name | text | ax_cache_key | text | ax_cache_source | text | ax_cache_l1_count | bigint | ax_edge_execution_fault_code | text | ax_edge_is_apigee_fault | integer | ax_dn_region | text | ax_execution_fault_policy_name | text | ax_execution_fault_flow_name | text | ax_execution_fault_flow_state | text | ax_mp_host | text | ax_router_host | text |
(c)2017 Apigee Corp. All Rights Reserved 199

ax_geo_region | text | ax_isp | text | ax_true_client_ip | text | Indexes:
"gscgcpfactclrecsts" btree (client_received_start_timestamp) Number of child tables: 75 (Use \d+ to list them.)
(c)2017 Apigee Corp. All Rights Reserved 200

Get the Database Table Size Use the SELECT command to get the size of the database tables. This is typically helpful in troubleshooting disk space issues on Postgres database. Syntax SELECT relname as "Table",pg_size_pretty(pg_total_relation_size(relid)) As "Size", pg_size_pretty(pg_total_relation_size(relid) - pg_relation_size(relid)) as "External Size" FROM pg_catalog.pg_statio_user_tables ORDER BY pg_total_relation_size(relid) DESC; Example apigee=# SELECT relname as "Table",pg_size_pretty(pg_total_relation_size(relid)) As "Size", apigee-# pg_size_pretty(pg_total_relation_size(relid) - pg_relation_size(relid)) as "External Size" apigee-# FROM pg_catalog.pg_statio_user_tables ORDER BY pg_total_relation_size(relid) DESC; Table | Size | External Size -------------------------------+------------+---------------
VALIDATE.test.agg_app | 40 kB | 40 kB api_pattern | 40 kB | 40 kB gsc.gcp.agg_app | 40 kB | 40 kB gsc.gcp.agg_uri_pattern | 40 kB | 40 kB VALIDATE.test.agg_api | 40 kB | 40 kB gsc.gcp.agg_api | 40 kB | 40 kB VALIDATE.test.agg_uri_pattern | 40 kB | 40 kB VALIDATE.test.fact_1 | 32 kB | 24 kB gsc.gcp.fact_36 | 16 kB | 16 kB gsc.gcp.fact_52 | 16 kB | 16 kB gsc.gcp.fact_29 | 16 kB | 16 kB agg_cache_rollup_30min | 16 kB | 16 kB
(c)2017 Apigee Corp. All Rights Reserved 201

Get Latest Timestamp In Fact Table Check to see date and time in UTC of the latest analytics data that was inserted into postgres from Qpid. This is useful in checking for problems concerning Qpid latencies. Normal case is the date/time matches as close to current time if there is current traffic being generated. Run the command a few times back to back after a few seconds to see if the date/timestamp increments, which indicate that data is being pushed to Postgres. The date/time shows how far behind the Qpid server is in pushing the data. Note: Replace org and env with the actual organization and environment name. Syntax SELECT max(client_received_start_timestamp) from analytics."org.env.fact";
Example apigee=# SELECT max(client_received_start_timestamp) from analytics."gsc.gcp.fact";
max -----
2017-07-31 18:39:30.09
(1 row)
Get the Oldest and Latest Timestamp in Fact Table Use this command to determine the duration the analytics data has been stored in the fact table. Syntax SELECT min(client_received_start_timestamp), max(client_received_start_timestamp) from analytics."org.env.fact";
Example
(c)2017 Apigee Corp. All Rights Reserved 202

SELECT min(client_received_start_timestamp), max(client_received_start_timestamp) from analytics."myorg.test.fact";
min | max -------------------------+-------------------------
2017-04-18 00:02:38.179 | 2017-07-21 21:57:22.759 (1 row)
The above output shows that the analytics data has been stored since Apr 18 till Jul 21.
Get details about SQL queries running in Postgres Database Get the details about the current activity in Postgres database and display which client is making the query, what query is being run, when the query was started, what state the query is in, if the query is waiting on a lock, and what is the pid of the process. This information is helpful for checking for long running queries and what is taking up the most processing time for postgres for performance tuning activity. Syntax SELECT client_addr,query,query_start,state,waiting,pid FROM pg_stat_activity WHERE datname='apigee' AND NOT (state='idle' OR pid=pg_backend_pid()) ; Example client_addr | query | query_start | state | waiting | pid
------------+-----------+-------------------+--------+---------+-
------
10.16.35.50 | insert into analytics.agg_geo ( org, env, apiproxy, api_product, ax_geo_city, ax_geo_country, ax_geo_continent, ax_geo_timezone, timestamp, sum_error_count, sum_message_count
, sum_total_response_time, max_total_response_time, min_total_response_time, sum_cache_hit, sum_data_exchange_size, max_data_exchange_size, min_data_exchange_size, sum_error_count_3xx, sum_ error_count_4xx, sum_error_count_5xx, sum_target_response_time,
(c)2017 Apigee Corp. All Rights Reserved 203

max_target_response_time, min_target_response_time, sum_request_size, max_request_size, min_request_size, sum_response_size,
max_response_size, min_response_size, sum_target_error_count_3xx, sum_target_error_count_4xx, sum_target_error_count_5xx, sum_request_processing_latency, max_request_processing_latency, min
_request_processing_latency, sum_response_processing_latency, max_response_processing_latency, min_response_processing_latency) Select 'gsc','gcp',apiproxy,api_product,ax_geo_city,ax _geo_country,ax_geo_continent,ax_geo_timezone,
date_trunc('minute', client_received_start_tim | 2017-07-01 23:54:12.875845+00 | active | f | 31689 10.16.35.50 | insert into analytics.agg_percentile ( org, env, apiproxy, timestamp, tp50_total_response_time, tp95_total_response_time, tp99_total_response_time, tp50_target_response_time,
tp95_target_response_time, tp99_target_response_time, tp50_request_processing_latency, tp95_request_processing_latency, tp99_request_processing_latency,
tp50_response_processing_latency, t p95_response_processing_latency,
tp99_response_processing_latency)select organization, environment, apiproxy, time_unit, max(tp50) as tp50_total_resp_time, max(tp95) as tp95_total_response_ time, max(tp99) as tp99_total_response_time ,max(tp50_target) as tp50_target_resp_time,max(tp95_target) as tp95_target_resp_time,max(tp99_target) as tp99_target_resp_time ,max(tp50_request_
processing_latency) as tp50_request_processing_latency,max(tp95_request_processing_laten
cy) as tp95_request_processing_latency,max(tp99_request_processing_laten
cy) as tp99_request_processin g_latency , max(tp50_response_processing_latency) as tp50_response_processing_latency,max(tp9 | 2017-07-01 23:54:13.379458+00 | active | f | 31690 10.16.35.50 | insert into analytics.agg_timeofday ( org, env, apiproxy, api_product, ax_hour_of_day, ax_day_of_week,
(c)2017 Apigee Corp. All Rights Reserved 204

ax_week_of_month, ax_month_of_year, timestamp, sum_error_count, sum_mes
sage_count, sum_total_response_time, max_total_response_time, min_total_response_time, sum_cache_hit, sum_error_count_3xx, sum_error_count_4xx, sum_error_count_5xx, sum_target_error_count_3
xx, sum_target_error_count_4xx, sum_target_error_count_5xx, sum_target_response_time, max_target_response_time, min_target_response_time, sum_request_size, max_request_size, min_request_siz
e, sum_response_size, max_response_size, min_response_size, sum_target_response_size, max_target_response_size, min_target_response_size, sum_request_processing_latency, min_request_process
ing_latency, max_request_processing_latency, sum_response_processing_latency, min_response_processing_latency, max_response_processing_latency) Select 'gsc','gcp',apiproxy,api_produc
t,ax_hour_of_day,ax_day_of_week,ax_week_of_month,ax_month_of_year
, date_trunc('minute', clien | 2017-07-01 23:54:13.422099+00 | active | f | 31691 (3 rows)
The above response shows aggregation jobs that are run on regular intervals triggered from the Apigee Postgres agent.
Get Replication Time Lag on Postgres Standby Get the lag time for data replication on Postgres standby machine. Ideally the lag time should be zero to a few seconds. In some cases, the lag time may increase to five or ten minutes, but eventually catch up with the Postgres Master. If the lag time continues to increase without catching up to Postgres Master, there is likely an issue with replication. Syntax SELECT now() - pg_last_xact_replay_timestamp() AS time_lag; Example
(c)2017 Apigee Corp. All Rights Reserved 205

apigee=# SELECT now() - pg_last_xact_replay_timestamp() AS time_lag;
time_lag
-------------------------
10 days 22:59:19.852748 (1 row)
Interpreting the Output The output shows the lag time on the Postgres standby is little over 10 days. If this lag continues to increase with time, then we may have to rebuild the Postgres standby.
(c)2017 Apigee Corp. All Rights Reserved 206
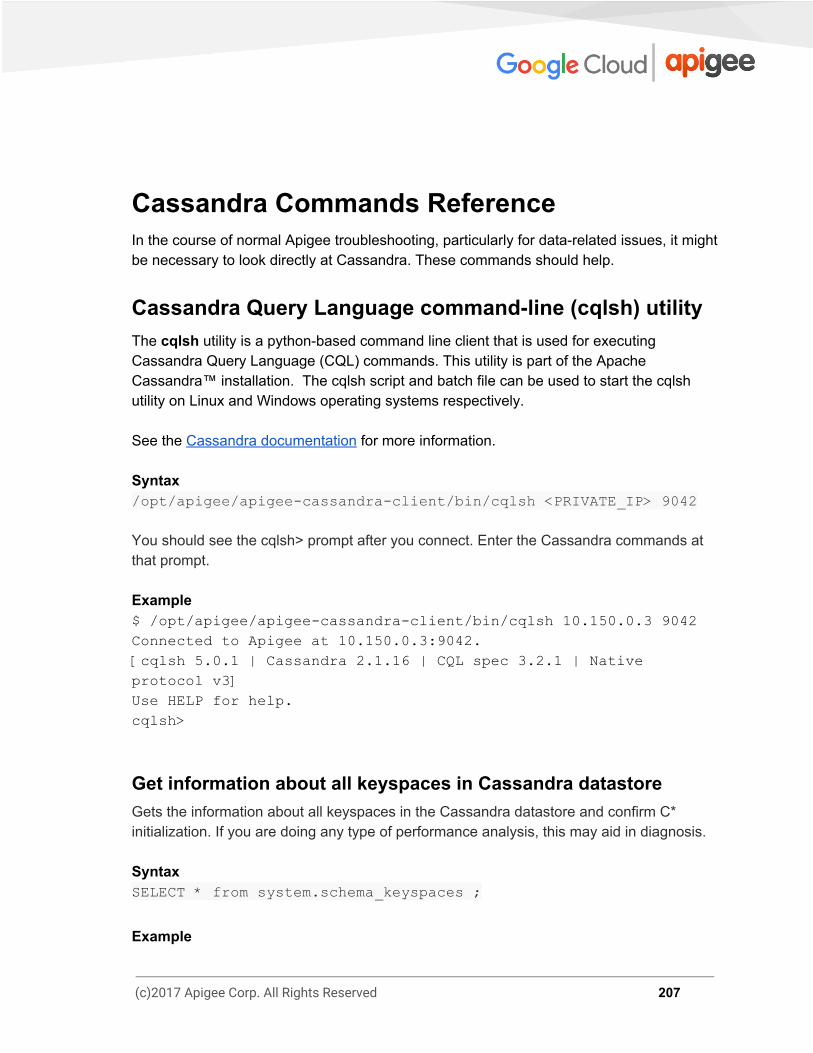
Cassandra Commands Reference In the course of normal Apigee troubleshooting, particularly for data-related issues, it might be necessary to look directly at Cassandra. These commands should help.
Cassandra Query Language command-line (cqlsh) utility The cqlsh utility is a python-based command line client that is used for executing Cassandra Query Language (CQL) commands. This utility is part of the Apache Cassandra™ installation. The cqlsh script and batch file can be used to start the cqlsh utility on Linux and Windows operating systems respectively. See the Cassandra documentation for more information. Syntax /opt/apigee/apigee-cassandra-client/bin/cqlsh <PRIVATE_IP> 9042
You should see the cqlsh> prompt after you connect. Enter the Cassandra commands at that prompt.
Example $ /opt/apigee/apigee-cassandra-client/bin/cqlsh 10.150.0.3 9042 Connected to Apigee at 10.150.0.3:9042. [cqlsh 5.0.1 | Cassandra 2.1.16 | CQL spec 3.2.1 | Native protocol v3] Use HELP for help. cqlsh>
Get information about all keyspaces in Cassandra datastore Gets the information about all keyspaces in the Cassandra datastore and confirm C* initialization. If you are doing any type of performance analysis, this may aid in diagnosis. Syntax
SELECT * from system.schema_keyspaces ;
Example
(c)2017 Apigee Corp. All Rights Reserved 207

The preceding query displays information about all keyspaces: keyspace_name | durable_writes | strategy_class |
strategy_options------------------------+----------------+-------
-----------------------------------------------+-----------------
------------------
Get Information about OAuth tokens Gets the information about OAuth Tokens that are stored in the table “oauth_20_access_tokens” of “kms” keyspace. This may be helpful for diagnosing access issues for a user with a valid token, or for auditing access by a specific token. Syntax SELECT * FROM kms.oauth_20_access_tokens limit 10;
Example The preceding query fetches all the oauth tokens created during a specific period for an organization. SELECT * FROM kms.oauth_20_access_tokens where organization_name='<ORG>' and created_at > xxxx and created_at < yyyy ALLOW FILTERING; key | app_end_user | app_id | attributes | client_id | client_secret | created_at | created_by | developer_id | expires_at | grant_type | isTokensHashed | issued_at | lastmodified_at | lastmodified_by | organization_name | redirect_uri | refresh_count | refresh_token | refresh_token_expires_at | refresh_token_issued_at | refresh_token_status | scope | status | token_secret -----+--------------+--------+------------+-----------+----------
-----+------------+------------+--------------+------------+-----
-------+----------------+-----------+-----------------+----------
-------+-------------------+--------------+---------------+------
---------+--------------------------+-------------------------+--
--------------------+-------+--------+--------------
(c)2017 Apigee Corp. All Rights Reserved 208

Get Information about Developer Apps Gets the information about developers and associated Developer Apps that are stored in the table “developers” of “devconnect” keyspace. This is helpful information if you are looking into missing/orphaned developer apps. Syntax SELECT apps from devconnect.developers where email = '<EMAIL_ADDRESS>';
Example The preceding query displays information about all developer apps: apps --------------------------
["AppName"]
Get Information about Apigee Cache Gets the information about Apigee Cache data that is stored in the table “cache_entries” of “cache” keyspace. This may be helpful in troubleshooting issues with cache misses or replication among Cassandra nodes. Syntax SELECT * from cache.cache_entries where cache_name = '<CACHE_NAME>';
Example The preceding query fetches the details of the given cache. key | added_at | cache_name | cache_value | expires_in | is_compressed | uncompressed_size -----+----------+------------+-------------+------------+--------
-------+-------------------
(c)2017 Apigee Corp. All Rights Reserved 209
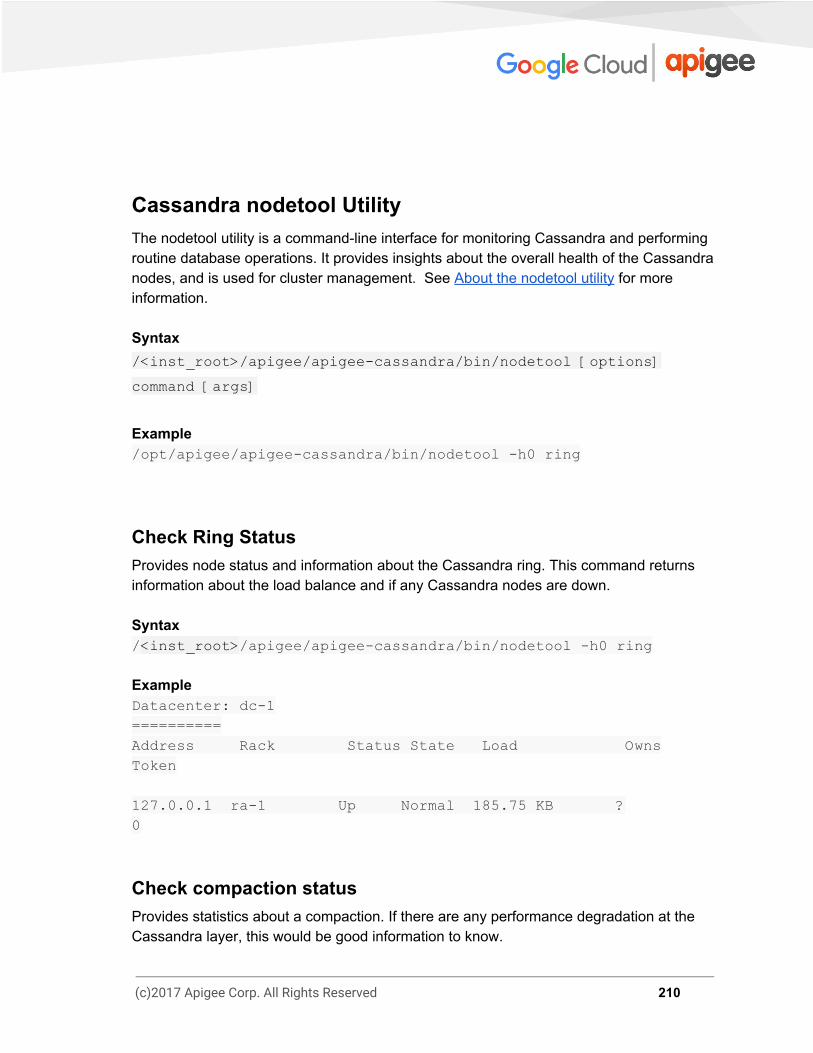
Cassandra nodetool Utility The nodetool utility is a command-line interface for monitoring Cassandra and performing routine database operations. It provides insights about the overall health of the Cassandra nodes, and is used for cluster management. See About the nodetool utility for more information. Syntax /<inst_root>/apigee/apigee-cassandra/bin/nodetool [options]
command [args]
Example /opt/apigee/apigee-cassandra/bin/nodetool -h0 ring
Check Ring Status Provides node status and information about the Cassandra ring. This command returns information about the load balance and if any Cassandra nodes are down. Syntax / <inst_root> /apigee/apigee-cassandra/bin/nodetool -h0 ring
Example Datacenter: dc-1 ==========
Address Rack Status State Load Owns Token
127.0.0.1 ra-1 Up Normal 185.75 KB ? 0
Check compaction status Provides statistics about a compaction. If there are any performance degradation at the Cassandra layer, this would be good information to know.
(c)2017 Apigee Corp. All Rights Reserved 210

Syntax / <inst_root> /apigee/apigee-cassandra/bin/nodetool -h0 compactionstats
Example pending tasks: 5 compaction type keyspace table completed total unit progress Compaction Keyspace1 Standard1 282310680 302170540 bytes 93.43% Compaction Keyspace1 Standard1 58457931 307520780 bytes 19.01% Active compaction remaining time : 0h00m16s
Check Gossip info Provides the gossip information for the cluster. Gossip is how Cassandra nodes talk to one another. This information is useful if there are any replication issues. Syntax / <inst_root> /apigee/apigee-cassandra/bin/nodetool -h0 gossipinfo
Example /10.150.0.3
generation:1496940478 heartbeat:14924509 STATUS:18:NORMAL,0 LOAD:14924353:190207.0 SCHEMA:1173:6e3380fb-3cc9-3e97-9565-997cdb482e06 DC:23:dc-1 RACK:25:ra-1 RELEASE_VERSION:4:2.1.16 RPC_ADDRESS:3:10.150.0.3 SEVERITY:14924511:0.0 NET_VERSION:1:8 HOST_ID:2:2b1dd105-3a43-4fb9-adb1-ff32b51d5a18 TOKENS:17:<hidden>
(c)2017 Apigee Corp. All Rights Reserved 211

Check reads/writes/drops Provides usage statistics of thread pools. Cassandra uses thread pools for client-to-server and server-to-server communications. If there are any performance issues, be on the lookout for any Blocked thread pools here. Syntax / <inst_root> /apigee/apigee-cassandra/bin/nodetool -h0 tpstats
Example Pool Name Active Pending Completed Blocked All time blocked MutationStage 0 0 579 0 0 ReadStage 0 0 2397 0 0 RequestResponseStage 0 0 0 0 0 ReadRepairStage 0 0 0 0 0 CounterMutationStage 0 0 0 0 0 MiscStage 0 0 0 0 0 HintedHandoff 0 0 0 0 0 GossipStage 0 0 0 0 0 CacheCleanupExecutor 0 0 0 0 0 InternalResponseStage 0 0 2 0 0 CommitLogArchiver 0 0 0 0 0 CompactionExecutor 0 0 8040778 0 0 ValidationExecutor 0 0 0 0 0
(c)2017 Apigee Corp. All Rights Reserved 212
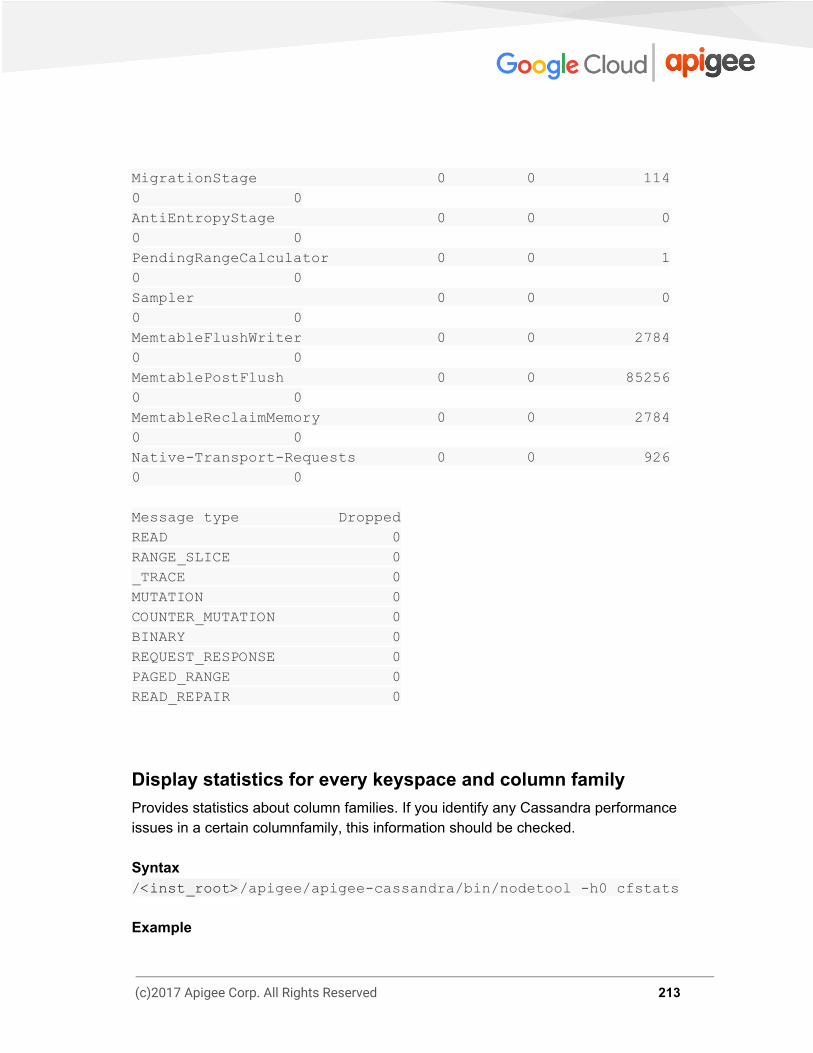
MigrationStage 0 0 114 0 0 AntiEntropyStage 0 0 0 0 0 PendingRangeCalculator 0 0 1 0 0 Sampler 0 0 0 0 0 MemtableFlushWriter 0 0 2784 0 0 MemtablePostFlush 0 0 85256 0 0 MemtableReclaimMemory 0 0 2784 0 0 Native-Transport-Requests 0 0 926 0 0
Message type Dropped READ 0 RANGE_SLICE 0 _TRACE 0 MUTATION 0 COUNTER_MUTATION 0 BINARY 0 REQUEST_RESPONSE 0 PAGED_RANGE 0 READ_REPAIR 0
Display statistics for every keyspace and column family Provides statistics about column families. If you identify any Cassandra performance issues in a certain columnfamily, this information should be checked. Syntax / <inst_root> /apigee/apigee-cassandra/bin/nodetool -h0 cfstats
Example
(c)2017 Apigee Corp. All Rights Reserved 213

Keyspace: cache Read Count: 2 Read Latency: 0.1305 ms. Write Count: 3 Write Latency: 0.14733333333333334 ms. Pending Flushes: 0
Table (index): cache_entries.cache_entries_cache_name_idx
… (this is very verbose output which is too much for this guide) ...
Status of the thrift server Provides the status of the Thrift server. Thrift is the client API used by Apigee. If there are any client-to-server issues like timeouts in connecting, if would be good to ensure this is running. Syntax / <inst_root> /apigee/apigee-cassandra/bin/nodetool -h0 statusthrift
Example running
Show Network Statistics Provides network information about the host. If there are any repairs hanging, this is the utility to check; for example, if a node becomes unresponsive during a repair. Syntax / <inst_root> /apigee/apigee-cassandra/bin/nodetool -h0 netstats
Example Mode: NORMAL Not sending any streams. Read Repair Statistics: Attempted: 230 Mismatch (Blocking): 0
(c)2017 Apigee Corp. All Rights Reserved 214

Mismatch (Background): 0 Pool Name Active Pending Completed Dropped
Commands n/a 0 2 0
Responses n/a 0 2 n/a
Repair tables Repairs one or more tables. Repair might be needed if a compaction was interrupted, or if there are any performance-related issues detected on a single node. Also, the -pr option (recommended by Apigee) only repairs the token range on the single node on which this command is run. So, it must be run individually on all nodes. Note that this process may take some time, so it is highly recommended that this should not be done during peak API traffic hours. Syntax / <inst_root> /apigee/apigee-cassandra/bin/nodetool -h0 -pr repair <KEYSPACE>
Example Starting repair command #1, repairing 1 ranges for keyspace system_traces (parallelism=SEQUENTIAL, full=true) Repair command #1 finished
(c)2017 Apigee Corp. All Rights Reserved 215

ZooKeeper Utilities This section provides information about some of the ZooKeeper utilities and various commands that can be used for retrieving, updating, or deleting information or while troubleshooting any problems with ZooKeeper.
ZooKeeper Command Line Interface (zkCli) utility The ZooKeeper Command Line Interface zkCli is used for interacting with the ZooKeeper database. It provides a list of commands that allow you to access and manipulate zNodes in ZooKeeper. It is very useful for debugging any ZooKeeper issues. To start zkCli.sh commands: /opt/apigee/apigee-zookeeper/bin/zkCli.sh
From the zkCli.sh prompt, you can then enter commands to get information about data stored in ZooKeeper.
List Data in a ZooKeeper Node Lists and displays the data stored in the ZooKeeper node. Syntax ls /path To list possible paths, get an output from the ZooKeeper Tree Utility. Example List the uuids of all the servers in the gateway pod in region DC-1: [zk: localhost:2181(CONNECTED) 1] ls /regions [dc-1]
[zk: localhost:2181(CONNECTED) 2] ls /regions/dc-1 [pods]
[zk: localhost:2181(CONNECTED) 3] ls /regions/dc-1/pods [analytics, central, gateway]
(c)2017 Apigee Corp. All Rights Reserved 216

[zk: localhost:2181(CONNECTED) 4] ls /regions/dc-1/pods/gateway [types, servers, bindings] [zk: localhost:2181(CONNECTED) 5] ls /regions/dc-1/pods/gateway/servers
[b76e10cb-ef68-4196-bd47-2d7b724dab8d,
f76f17d9-2e23-47c8-ac04-a318972e3a53,
e386f7eb-47cd-4270-9196-ea185cf07f98]
Get Data from a ZooKeeper Node Gets the data from a ZooKeeper Node. Syntax get /path
To list possible paths, get an output from the ZooKeeper Tree Utility. Example Check if the InternalIP has been set: [zk: localhost:2181(CONNECTED) 21] get /regions/dc-1/pods/gateway/servers/966e107a-d10f-4cc0-8e1e-3077da2
3f8e2/InternalIP
10.28.153.100
cZxid = 0x30000006e ctime = Mon Apr 27 20:31:03 EDT 2015 mZxid = 0x1200000116 mtime = Fri Mar 11 18:05:15 EST 2016 pZxid = 0x30000006e cversion = 0 dataVersion = 1 aclVersion = 0 ephemeralOwner = 0x0 dataLength = 13 numChildren = 0
(c)2017 Apigee Corp. All Rights Reserved 217

ZooKeeper Tree (zkTree) Utility The ZooKeeper Tree Utility zkTree allows you to generate the list of all the nodes and its children recursively in a ZooKeeper. This utility can be run on any ZooKeeper node in the cluster.
Syntax /opt/apigee/apigee-zookeeper/contrib/zk-tree.sh
Example Example of getting the ZooKeeper tree and redirecting the output to a file: /opt/apigee/apigee-zookeeper/contrib/zk-tree.sh > tree.txt
The ZooKeeper tree output is raw text of the data stored in ZooKeeper. This data can be used for validation of Apigee Edge wiring and should be replicated across all ZooKeeper nodes in the cluster. Apigee Edge wiring refers details about the IP, hostname, and uuids for component (datastore, message-processor, routers, postgres, qpid, management server) that is deployed into the topology of the installation.
(c)2017 Apigee Corp. All Rights Reserved 218

How to check if a ZooKeeper Node is leader? In a ZooKeeper ensemble, a single ZooKeeper node which handles all writes is the leader node. All the write requests from the clients are forwarded to the leader node. The rest of the ZooKeeper servers are called followers and read data from the ZooKeeper leader. Install To determine if a ZooKeeper node is a leader or a follower, we will need to install the netcat utility. The netcat utility can be installed on the ZooKeeper node using the following command: yum install nc
Syntax nc hostname port
Example Run the following command on each of the ZooKeeper nodes in the ZooKeeper ensemble to check if it is a leader or a follower. echo srvr | nc localhost 2181 Example output for a leader $ echo srvr | nc localhost 2181 ZooKeeper version: 3.4.5-1392090, built on 09/30/2012 17:52 GMT Latency min/avg/max: 0/0/0 Received: 1 Sent: 0 Connections: 1 Outstanding: 0 Zxid: 0x50000000a Mode: leader Node count: 852 Example output for a follower $ echo srvr | nc localhost 2181 ZooKeeper version: 3.4.5-1392090, built on 09/30/2012 17:52 GMT
(c)2017 Apigee Corp. All Rights Reserved 219

Latency min/avg/max: 0/0/14 Received: 1287670 Sent: 1287670 Connections: 8 Outstanding: 0 Zxid: 0x50000000a Mode: follower Node count: 852
(c)2017 Apigee Corp. All Rights Reserved 220

Diagnostic Tools and Logs This section provides information and guidance about the network and JVM tools and diagnostic logs that can be used for troubleshooting network and JVM related issues in Edge platform.
TCP/IP packet sniffer (tcpdump) utility The tcpdump tool is a command-line packet sniffer tool that allows you to capture or filter TCP/IP packets that are received or transferred over a network. It is available on Linux/Unix based operating systems. If not, it can be installed easily using yum as follows: yum install tcpdump The tcpdump tool is useful for troubleshooting network or SSL related issues. For example:
➔ 502 Bad Gateway Errors (caused due to EOF Exception) ➔ 503 Service Unavailable Errors ➔ SSL Handshake Failures, etc.
To troubleshoot any of these problems, your first step is to determine the pair of components between which the error occurred. In case of Edge, it can be one of the following pairs:
➔ Client app and Router ➔ Router and Message Processor ➔ Message Processor and Backend server
Once you identify the pair of components, you can capture the network packets using tcpdump on one or both of these components. Capturing packets sent to/received from a specific host using tcpdump Use the following tcpdump command to capture all the packets sent to or received from a specified host (IP address) and save the information in the specified file:
tcpdump -i any -s 0 host <IP address> -w <File name>
Where
(c)2017 Apigee Corp. All Rights Reserved 221
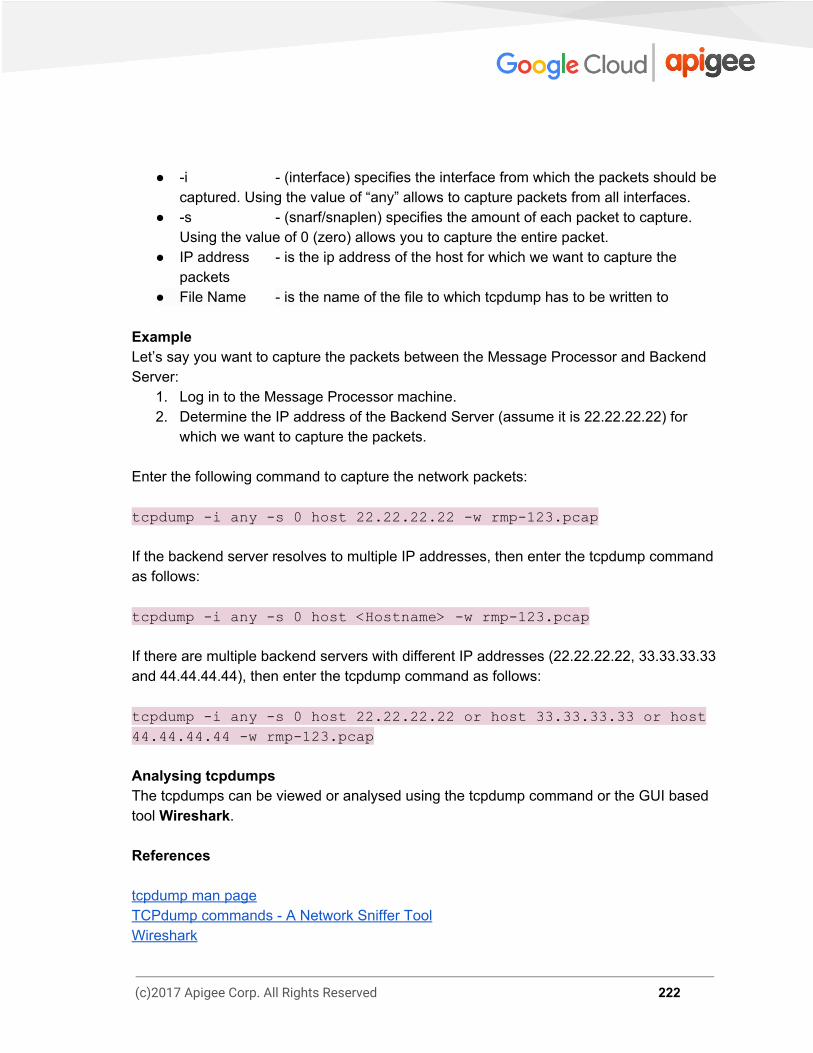
● -i - (interface) specifies the interface from which the packets should be captured. Using the value of “any” allows to capture packets from all interfaces.
● -s - (snarf/snaplen) specifies the amount of each packet to capture. Using the value of 0 (zero) allows you to capture the entire packet.
● IP address - is the ip address of the host for which we want to capture the packets
● File Name - is the name of the file to which tcpdump has to be written to Example Let’s say you want to capture the packets between the Message Processor and Backend Server:
1. Log in to the Message Processor machine. 2. Determine the IP address of the Backend Server (assume it is 22.22.22.22) for
which we want to capture the packets. Enter the following command to capture the network packets:
tcpdump -i any -s 0 host 22.22.22.22 -w rmp-123.pcap
If the backend server resolves to multiple IP addresses, then enter the tcpdump command as follows: tcpdump -i any -s 0 host <Hostname> -w rmp-123.pcap
If there are multiple backend servers with different IP addresses (22.22.22.22, 33.33.33.33 and 44.44.44.44), then enter the tcpdump command as follows: tcpdump -i any -s 0 host 22.22.22.22 or host 33.33.33.33 or host 44.44.44.44 -w rmp-123.pcap Analysing tcpdumps The tcpdumps can be viewed or analysed using the tcpdump command or the GUI based tool Wireshark. References tcpdump man page TCPdump commands - A Network Sniffer Tool Wireshark
(c)2017 Apigee Corp. All Rights Reserved 222
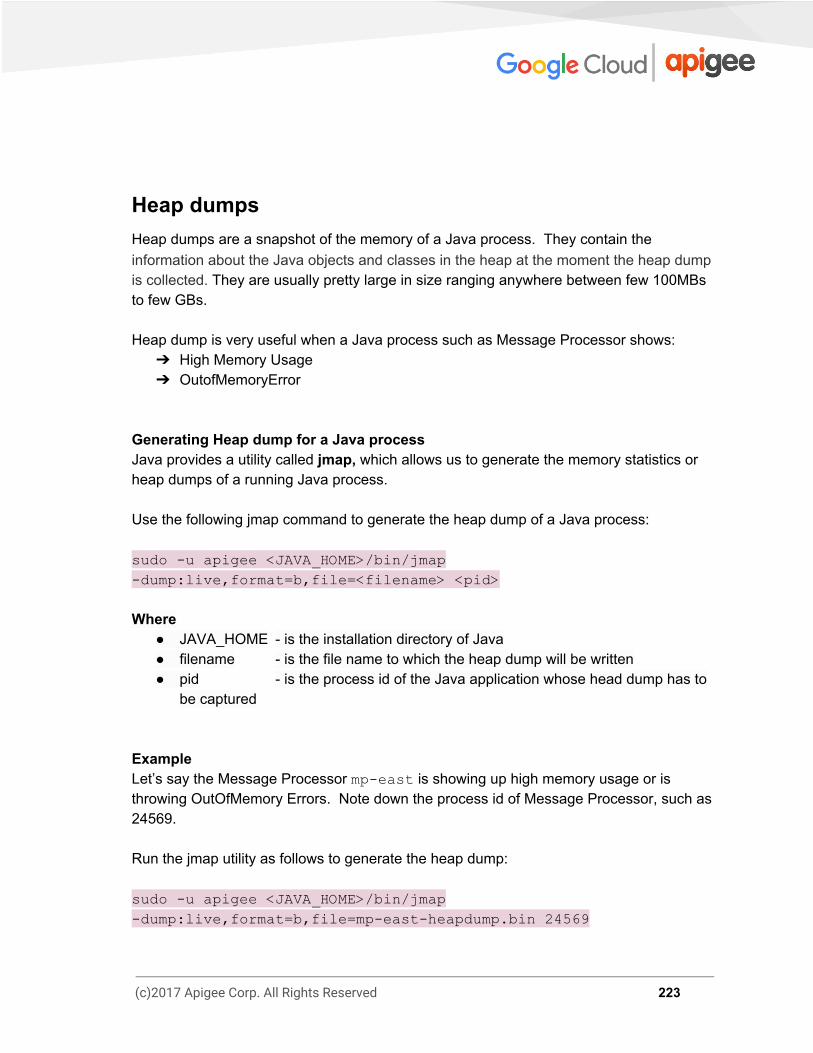
Heap dumps Heap dumps are a snapshot of the memory of a Java process. They contain the information about the Java objects and classes in the heap at the moment the heap dump is collected. They are usually pretty large in size ranging anywhere between few 100MBs to few GBs. Heap dump is very useful when a Java process such as Message Processor shows:
➔ High Memory Usage ➔ OutofMemoryError
Generating Heap dump for a Java process Java provides a utility called jmap, which allows us to generate the memory statistics or heap dumps of a running Java process. Use the following jmap command to generate the heap dump of a Java process: sudo -u apigee <JAVA_HOME>/bin/jmap -dump:live,format=b,file=<filename> <pid>
Where ● JAVA_HOME - is the installation directory of Java ● filename - is the file name to which the heap dump will be written ● pid - is the process id of the Java application whose head dump has to
be captured Example Let’s say the Message Processor mp-east is showing up high memory usage or is throwing OutOfMemory Errors. Note down the process id of Message Processor, such as 24569. Run the jmap utility as follows to generate the heap dump:
sudo -u apigee <JAVA_HOME>/bin/jmap -dump:live,format=b,file=mp-east-heapdump.bin 24569
(c)2017 Apigee Corp. All Rights Reserved 223
Analysing Heap Dumps Heap Dumps can be analysed using Eclipse MAT (Memory Analyzer Tool) to determine the potential memory leaks or which Java objects are leading to high memory usage. References How to collect a heap dump jmap utility jmap man page Memory Analyzer Tool (MAT)
(c)2017 Apigee Corp. All Rights Reserved 224

Thread dumps A thread dump is a snapshot of the state of all the threads of a running Java process. The state of each thread is presented with the contents of its stack, referred to as a stack trace. Some of the threads will be part of the Java application that is running, while others will be JVM internal threads. A thread dump reveals information about each of the application’s threads activities. This information can be very useful to:
➔ Diagnose problems such as CPU spikes, slow response times, or unresponsive Java applications
➔ Optimize application and JVM performance Generating Thread Dumps The thread dump for a Java process can be generated using the jstack utility as shown below: <JAVA_HOME>/bin/jstack -l <pid> > <filename> Where
● JAVA_HOME - is the installation directory of Java ● pid - is the process id of the Java application whose thread dump you
want to capture ● filename - is the file name to which the thread dump will be written
Example To generate a thread dump for the process ID 37320 on Message Processor mp-east , enter the following command: <JAVA_HOME>/bin/jstack -l 37320 > /opt/apigee/edge-message-processor/mp-east-threadDump.txt
As per the above example, thread dump of the process would be saved to the /opt/apigee/edge-message-processor/mp-east-threadDump.txt file.
(c)2017 Apigee Corp. All Rights Reserved 225

Analysing Thread Dumps The thread dumps can be viewed in any text editor such as vi (Linux), notepad (Windows). Refer to Thread Dump for details on different sections of Thread Dump and how to interpret the information.
References jstack utility Analyzing Thread Dump: CPU High Usage Issue How to Analyze Java Thread Dumps
(c)2017 Apigee Corp. All Rights Reserved 226

PART 3 - APIs Quick Reference This section provides information about frequently used Edge management APIs to get information about organization, environments, API proxies, deployments, virtual hosts, keystores, analytics, servers, etc. You can either use management APIs or apigee-adminapi utility to get the information. You need to use your sysadmin username and password for executing the management APIs. See Using the apigee-adminapi.sh utility for information to install and configure the apigee-adminapi, before running the commands using this utility.
Organization APIs
Use the following APIs to get information about your organizations:
Description API/Command
Get list of organizations
API: curl
http://<management-server-IP-address
>:<port#>/v1/organizations
adminapi command: apigee-adminapi.sh orgs list
Get the details of an organization
API: curl
http://<management-server-IP-address
>:<port#>/v1/organizations/<orgname>
adminapi command: apigee-adminapi.sh orgs list -o <orgname>
(c)2017 Apigee Corp. All Rights Reserved 227

Environment APIs
Use the following APIs to get information about environments:
Description API/Command
List the environments in an organization
API: curl
http://<management-server-IP-address>:<port#>/v1
/organizations/<orgname>/environments
adminapi command: apigee-adminapi.sh orgs envs list -o <org>
Get the environment details of an organization
API: curl
http://<management-server-IP-address>:<port#>/v1
/organizations/<orgname>/environments/<envname>
adminapi command: apigee-adminapi.sh orgs envs list -o <org> -e <env>
(c)2017 Apigee Corp. All Rights Reserved 228

API Proxy APIs
Use the following APIs to get information about and manage the deployment of API proxies:
Description API/Command
List API Proxies API: curl
http://<management-server-IP-address>:<port#>/v1/org
anizations/<orgname>/apis
adminapi command: apigee-adminapi.sh orgs apis list -o <org>
List the revisions of an API Proxy
API: curl
http://<management-server-IP-address>:<port#>/v1/org
anizations/<orgname>/apis/<apiname>/revisions
adminapi command: apigee-adminapi.sh orgs apis revisions list -o <org> -a <api>
Deploy an API Proxy
API: curl -X POST " http://<management-server-IP-address>:<port#>/v1/organizations/<orgname>/apis/environments/<envname>/<a
piname>/revisions/<revnumber>/deployments " -H "Content-Type: application/x-www-form-urlencoded"
apigee-adminapi.sh orgs apis deploy -o <org> -e <env> -a <api> -r <revision>
Undeploy an API Proxy
API: curl -X DELETE " http://<management-server-IP-address>:<port#>/v1/organizations/<orgname>/apis/environments/<envname>/<a
piname>/revisions/<revnumber>/deployments? "
(c)2017 Apigee Corp. All Rights Reserved 229

adminapi command: apigee-adminapi.sh orgs apis undeploy -o <org> -e <env> -a <api> -r <revision>
(c)2017 Apigee Corp. All Rights Reserved 230
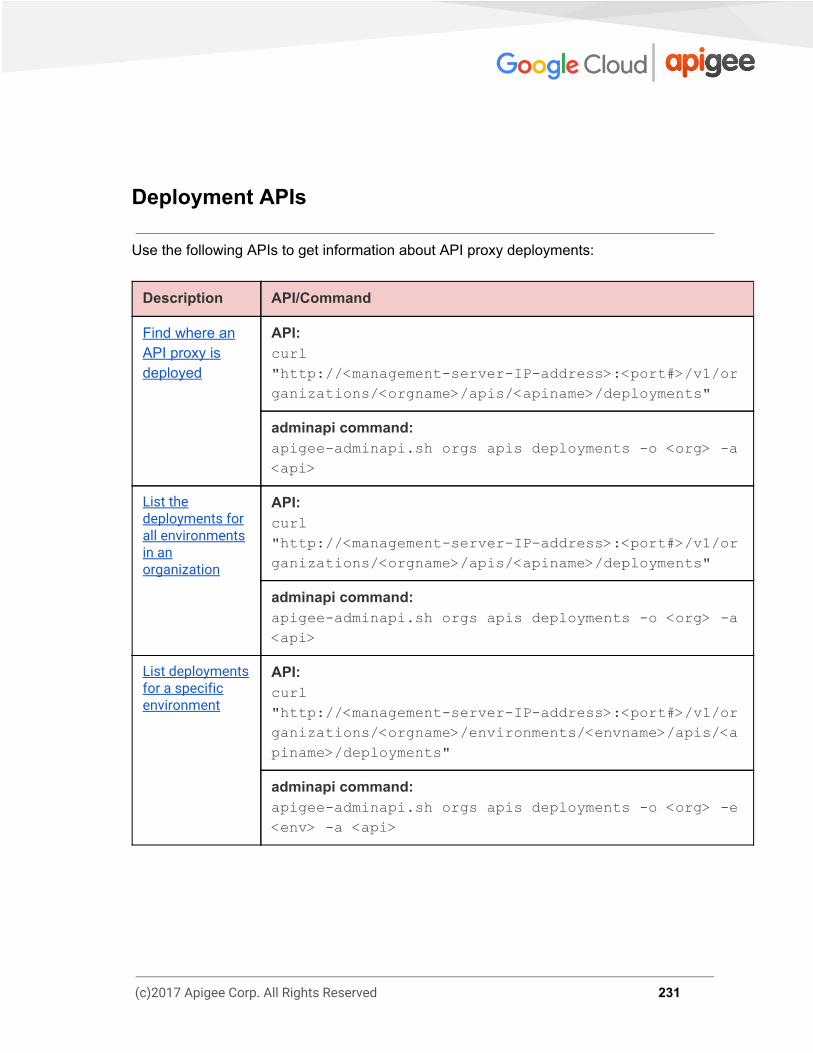
Deployment APIs
Use the following APIs to get information about API proxy deployments:
Description API/Command
Find where an API proxy is deployed
API: curl
" http://<management-server-IP-address>:<port#>/v1/organizations/<orgname>/apis/<apiname>/deployments "
adminapi command: apigee-adminapi.sh orgs apis deployments -o <org> -a <api>
List the deployments for all environments in an organization
API: curl
" http://<management-server-IP-address>:<port#>/v1/organizations/<orgname>/apis/<apiname>/deployments "
adminapi command: apigee-adminapi.sh orgs apis deployments -o <org> -a <api>
List deployments for a specific environment
API: curl
" http://<management-server-IP-address>:<port#>/v1/organizations/<orgname>/environments/<envname>/apis/<a
piname>/deployments "
adminapi command: apigee-adminapi.sh orgs apis deployments -o <org> -e <env> -a <api>
(c)2017 Apigee Corp. All Rights Reserved 231

Virtual Host APIs
Use the following APIs to create, delete, and get information about virtual hosts:
Description API/Command
List virtual hosts in an environment
curl
http://<management-server-IP-address>:<port#>/v1/org
anizations/<orgname>/environments/<envname>/ virtualhosts
adminapi command: apigee-adminapi.sh orgs envs virtual_hosts list -o <org> -e <env>
Get a specific virtual host detail
curl
http://<management-server-IP-address>:<port#>/v1/org
anizations/<orgname>/environments/<envname>/ virtualhosts/<virtualhostname>
adminapi command: apigee-adminapi.sh orgs envs virtual_hosts list -o <org> -e <env> -v <vhname>
Create a virtual host
curl -X POST http://<management-server-IP-address>:<port#>/v1/org
anizations/<orgname>/environments/<envname>/ virtualhosts -H "Content-Type: application/xml" -d @new_virtual_host.xml
adminapi command: apigee-adminapi.sh orgs envs virtual_hosts -o <org> -e <env> -f <path to file> -t xml or json
Delete a virtual host in an environment
curl -X DELETE http://<management-server-IP-address>:<port#>/v1/org
anizations/<orgname>/environments/<envname>/ virtualhosts /<virtualhostname>
(c)2017 Apigee Corp. All Rights Reserved 232

adminapi command: apigee-adminapi.sh orgs envs virtual_hosts delete -o <org> -e <env>-v <virtualhostname>
(c)2017 Apigee Corp. All Rights Reserved 233

Keystore APIs
Use the following APIs create, delete, and get information about keystores and truststores:
Description API/Command
List keystores and truststores in an environment
API: curl
http://<management-server-IP-address>:<port#>/v1/org
anizations/<orgname>/environments/<envname>/ keystores
adminapi command: apigee-adminapi.sh orgs envs keystores list -o <org> -e <env>
Get details for a specific keystore or truststore
API: curl
http://<management-server-IP-address>:<port#>/v1/org
anizations/<orgname>/environments/<envname>/ keystores /<keystorename>
adminapi command: apigee-adminapi.sh orgs envs keystores list -o <org> -e <env>
Create a keystore or truststore
API: curl -X POST http://<management-server-IP-address>:<port#>/v1/org
anizations/<orgname>/environments/<envname>/keystore
s -H "content-type: application/xml" -d '<KeyStore name="<KEYSTORE_NAME>"/>' -Q -v
adminapi command: apigee-adminapi.sh orgs envs keystores add-o <org> -e <env> -k <keystore name>
(c)2017 Apigee Corp. All Rights Reserved 234
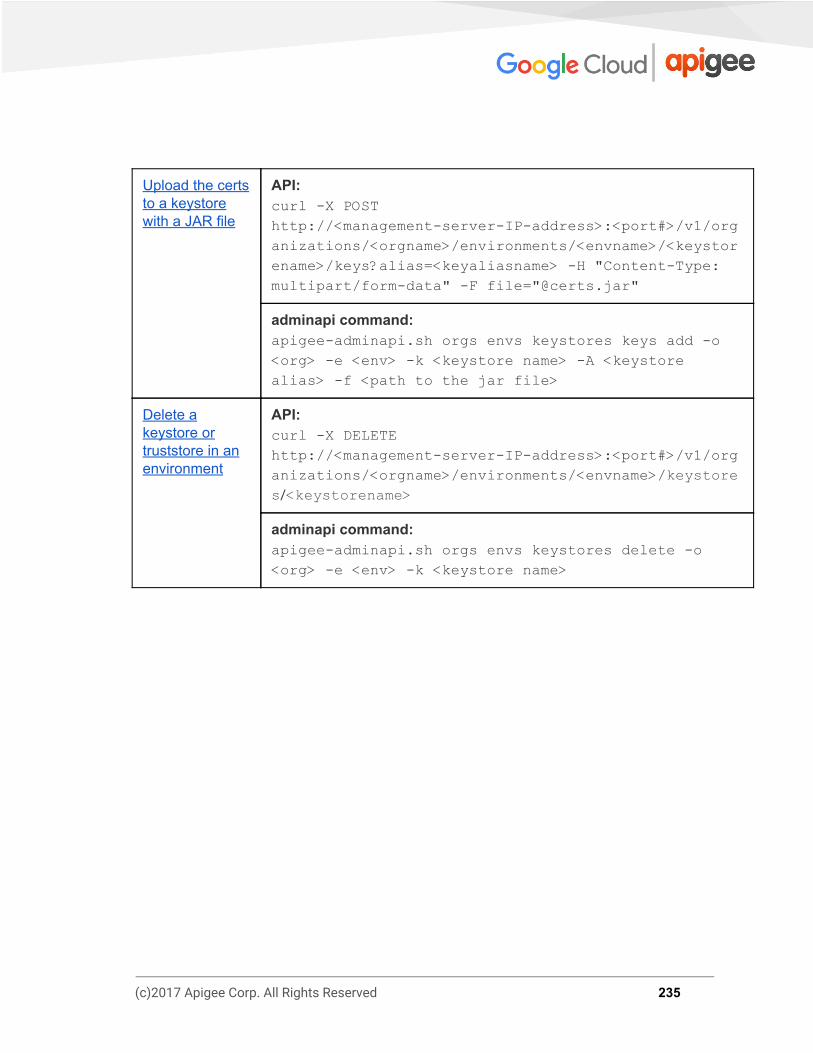
Upload the certs to a keystore with a JAR file
API: curl -X POST http://<management-server-IP-address>:<port#>/v1/org
anizations/<orgname>/environments/<envname> /<keystorename>/keys?alias=<keyaliasname> -H "Content-Type: multipart/form-data" -F file="@certs.jar"
adminapi command: apigee-adminapi.sh orgs envs keystores keys add -o <org> -e <env> -k <keystore name> -A <keystore alias> -f <path to the jar file>
Delete a keystore or truststore in an environment
API: curl -X DELETE http://<management-server-IP-address>:<port#>/v1/org
anizations/<orgname>/environments/<envname>/ keystores /<keystorename>
adminapi command: apigee-adminapi.sh orgs envs keystores delete -o <org> -e <env> -k <keystore name>
(c)2017 Apigee Corp. All Rights Reserved 235
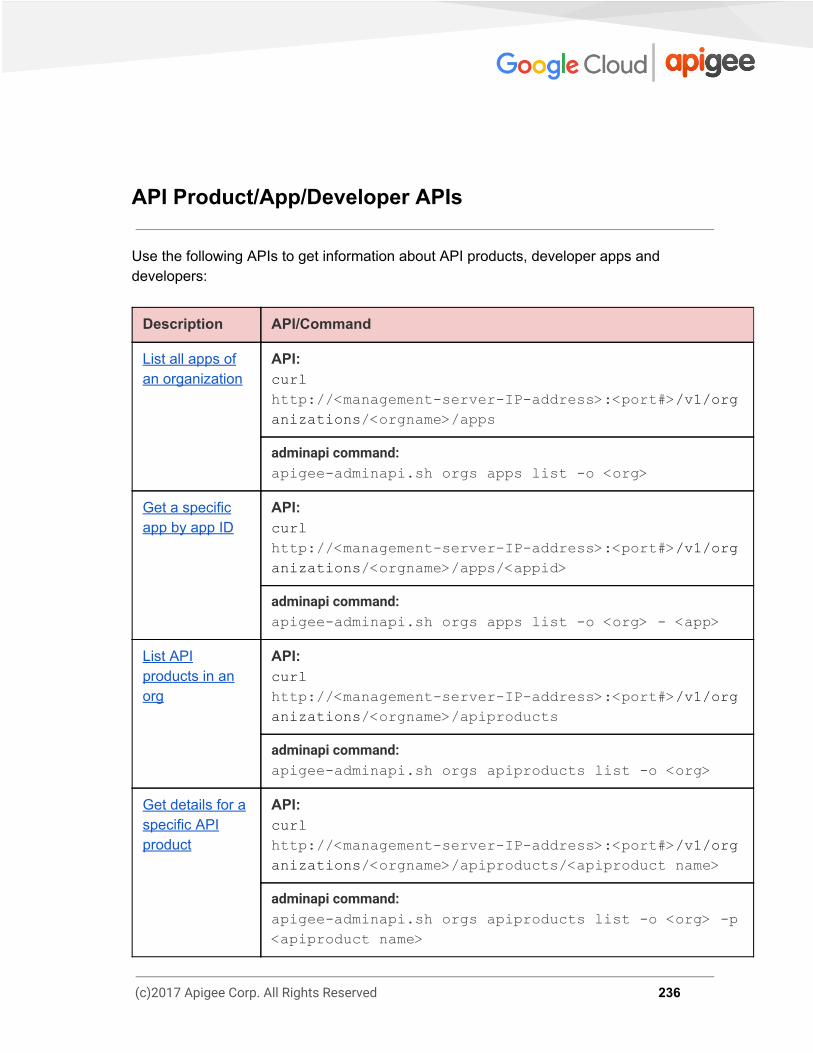
API Product/App/Developer APIs
Use the following APIs to get information about API products, developer apps and developers:
Description API/Command
List all apps of an organization
API: curl
http://<management-server-IP-address>:<port#> /v1/organizations /<orgname>/apps
adminapi command: apigee-adminapi.sh orgs apps list -o <org>
Get a specific app by app ID
API: curl
http://<management-server-IP-address>:<port#> /v1/organizations /<orgname>/apps/<appid>
adminapi command: apigee-adminapi.sh orgs apps list -o <org> - <app>
List API products in an org
API: curl
http://<management-server-IP-address>:<port#> /v1/organizations /<orgname>/apiproducts
adminapi command: apigee-adminapi.sh orgs apiproducts list -o <org>
Get details for a specific API product
API: curl
http://<management-server-IP-address>:<port#> /v1/organizations /<orgname>/apiproducts/<apiproduct name>
adminapi command: apigee-adminapi.sh orgs apiproducts list -o <org> -p <apiproduct name>
(c)2017 Apigee Corp. All Rights Reserved 236
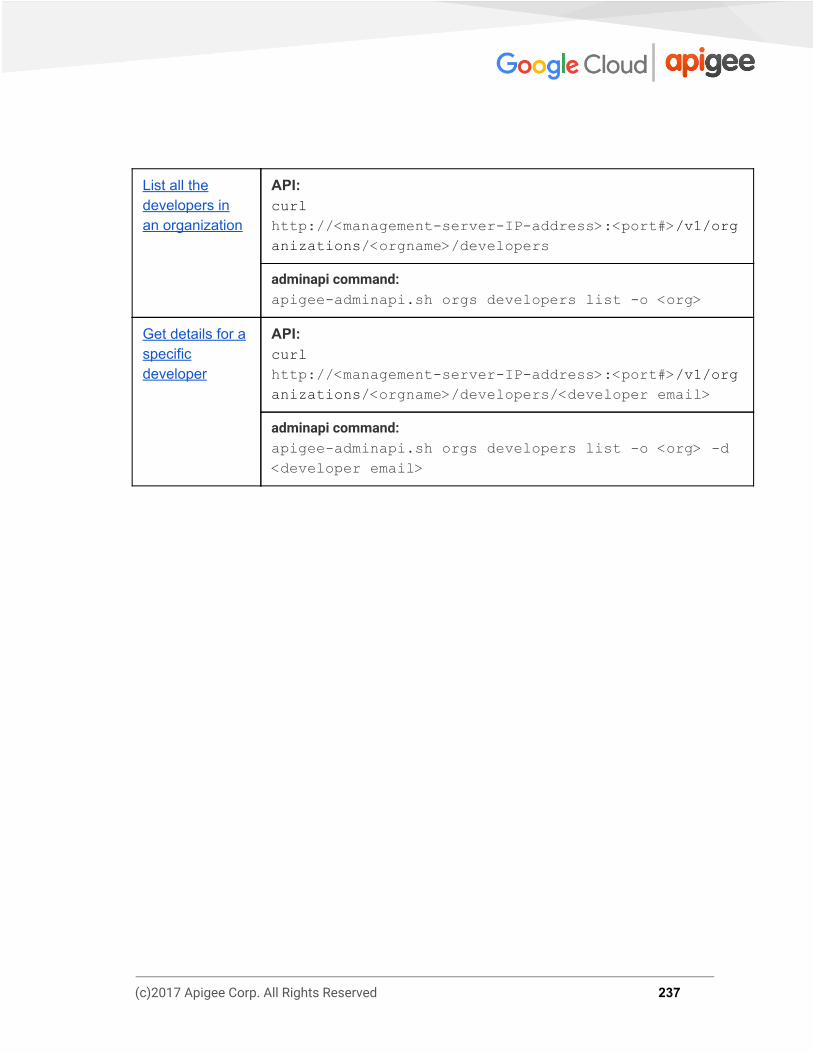
List all the developers in an organization
API: curl
http://<management-server-IP-address>:<port#> /v1/organizations /<orgname>/developers
adminapi command: apigee-adminapi.sh orgs developers list -o <org>
Get details for a specific developer
API: curl
http://<management-server-IP-address>:<port#> /v1/organizations /<orgname>/developers/<developer email>
adminapi command: apigee-adminapi.sh orgs developers list -o <org> -d <developer email>
(c)2017 Apigee Corp. All Rights Reserved 237
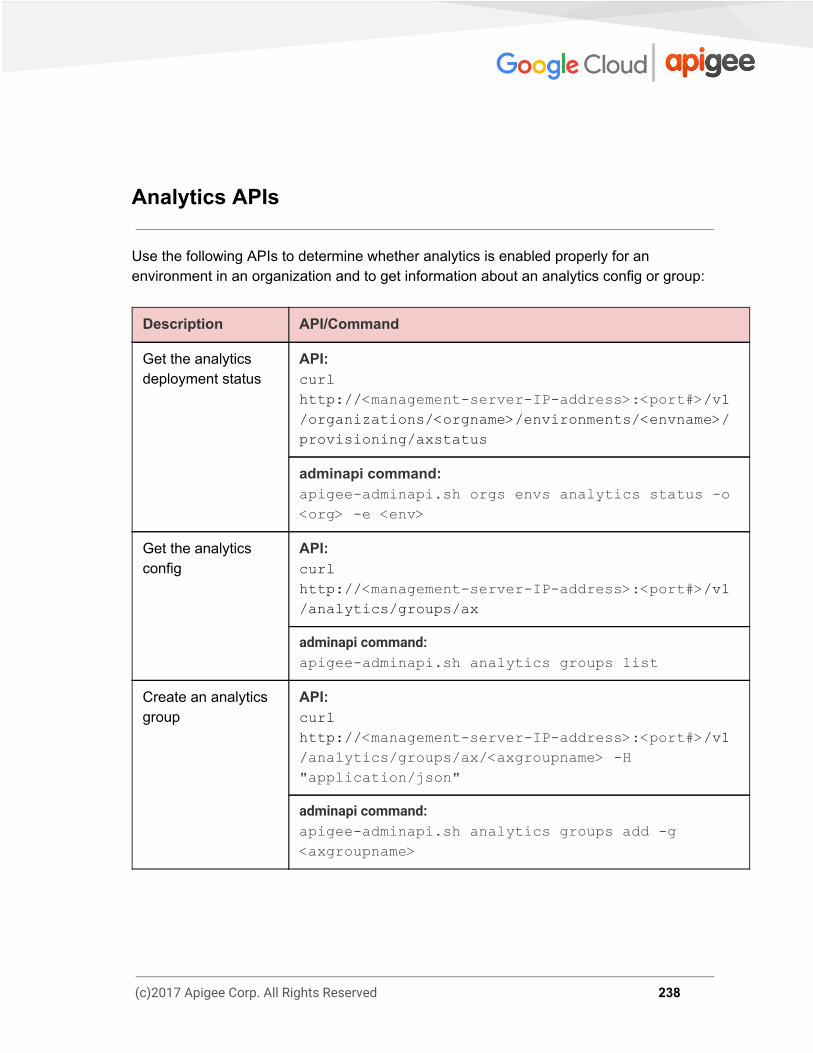
Analytics APIs
Use the following APIs to determine whether analytics is enabled properly for an environment in an organization and to get information about an analytics config or group:
Description API/Command
Get the analytics deployment status
API: curl
http:// <management-server-IP-address>:<port#> /v1/organizations/<orgname>/environments/<envname>/
provisioning/axstatus
adminapi command: apigee-adminapi.sh orgs envs analytics status -o <org> -e <env>
Get the analytics config
API: curl
http:// <management-server-IP-address>:<port#> /v1/analytics/groups/ax
adminapi command: apigee-adminapi.sh analytics groups list
Create an analytics group
API: curl
http:// <management-server-IP-address>:<port#> /v1/ analytics/groups/ax/<axgroupname> -H "application/json"
adminapi command: apigee-adminapi.sh analytics groups add -g <axgroupname>
(c)2017 Apigee Corp. All Rights Reserved 238

Server in Pods/Region APIs
Use the following APIs to get information about the pods and servers in a pod and region:
Description API/Command
Get pods associated with an organization
API call: curl
http://<management-server-IP-address>:<port#> /v1/organizations/<orgname>/pods
adminapi command: apigee-adminapi.sh orgs pods list -o <orgname>
List pods in a region API call: curl
http:// <management-server-IP-address>:<port#> /v1/ regions/<regionname>/pods
adminapi command: apigee-adminapi.sh regions pods list -r <region>
List servers in a pod and region
API: curl
http:// <management-server-IP-address>:<port#> /v1/ regions/<regionname>/pods/<podname>/servers
adminapi command: apigee-adminapi.sh regions pods servers list -r <region> -p <pod>
Get list of servers of a specific type in a pod
API: curl
http:// <management-server-IP-address>:<port#> /v1/ servers?pod=<podname>&type=<servertype>
adminapi command:
(c)2017 Apigee Corp. All Rights Reserved 239
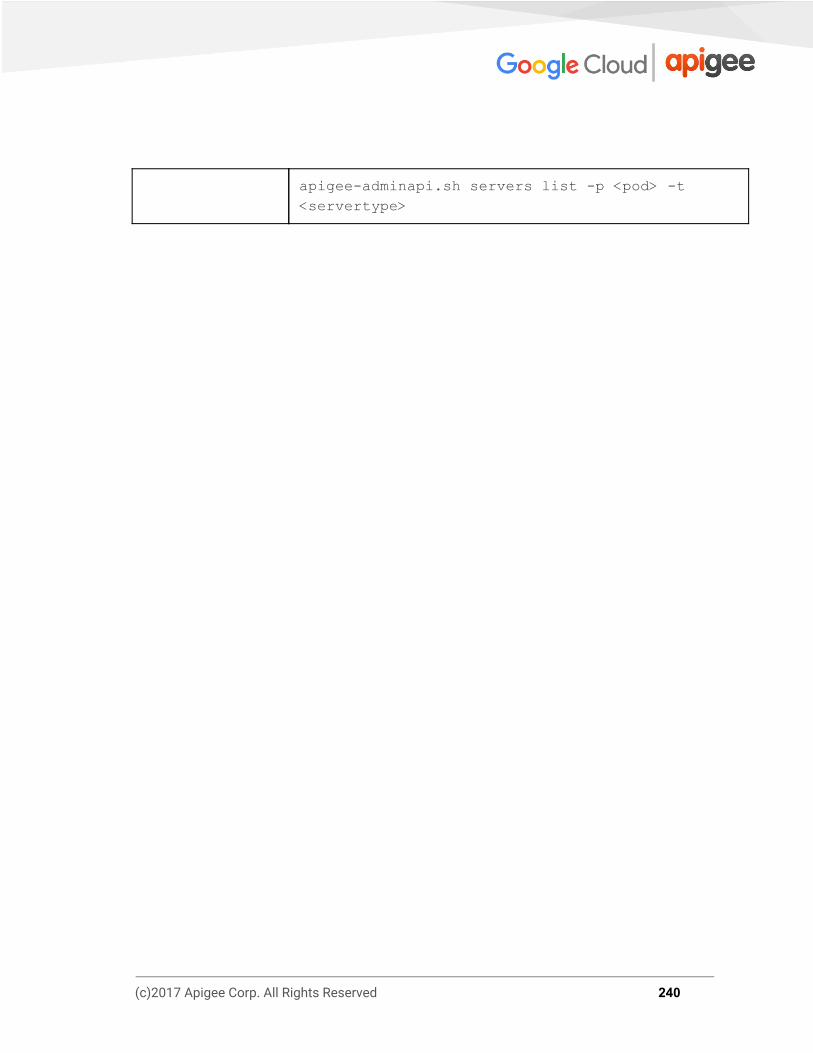
apigee-adminapi.sh servers list -p <pod> -t <servertype>
(c)2017 Apigee Corp. All Rights Reserved 240

Server Info APIs
Use the following APIs to get information about specific servers such as Edge Management Servers, Routers, Message Processor, Qpid Server and Postgres Server, etc. Note: The port #s for Management Server, Router, Message Processor, Qpid Server and Postgres Server are 8080, 8081, 8082, 8083, and 8083 respectively.
Description API/Command
View server details API: curl localhost:<port#>/v1/servers/self
adminapi command: apigee-adminapi.sh servers self list
Get the server's uuid API: curl localhost:<port#>/v1/servers/self/uuid
adminapi command: apigee-adminapi.sh servers self uuid
Get the server reachable status
API: curl
localhost:<port#>/v1/servers/self/uuid/reachable
adminapi command: apigee-adminapi.sh servers self reachable
Verify if server started or not
API: curl localhost:<port#>/v1/servers/self/up
adminapi command: apigee-adminapi.sh servers self is_up --host <host>
(c)2017 Apigee Corp. All Rights Reserved 241
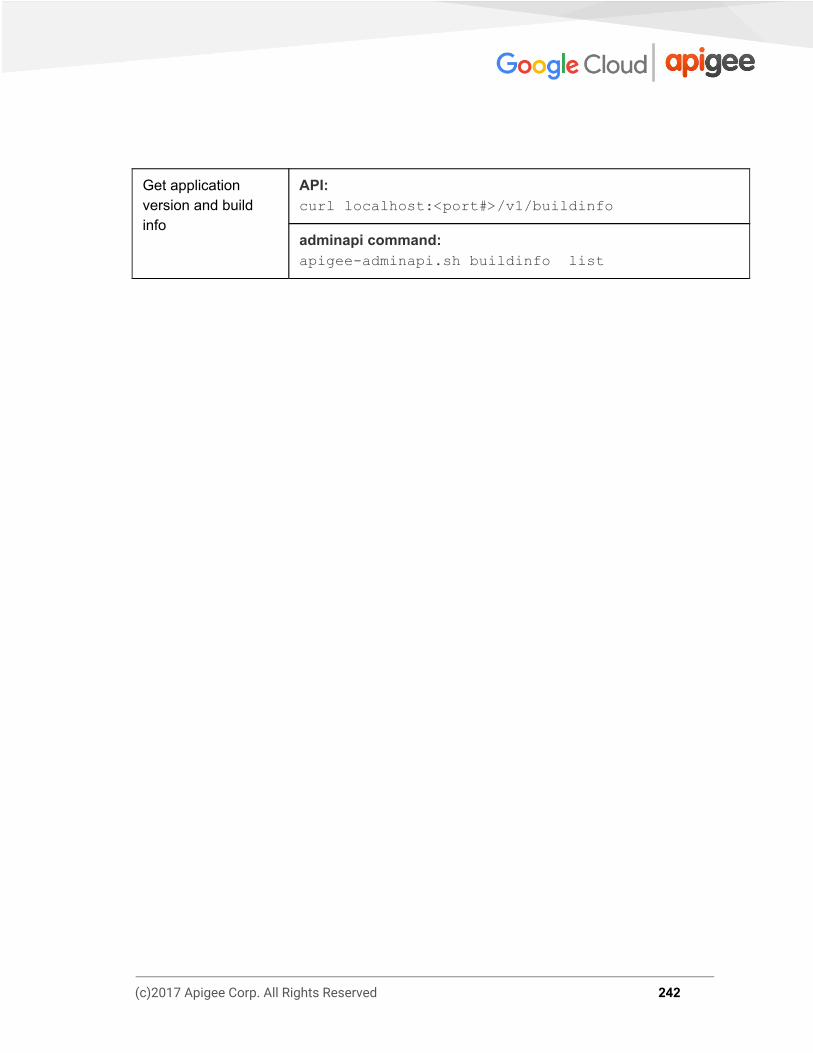
Get application version and build info
API: curl localhost:<port#>/v1/buildinfo
adminapi command: apigee-adminapi.sh buildinfo list
(c)2017 Apigee Corp. All Rights Reserved 242
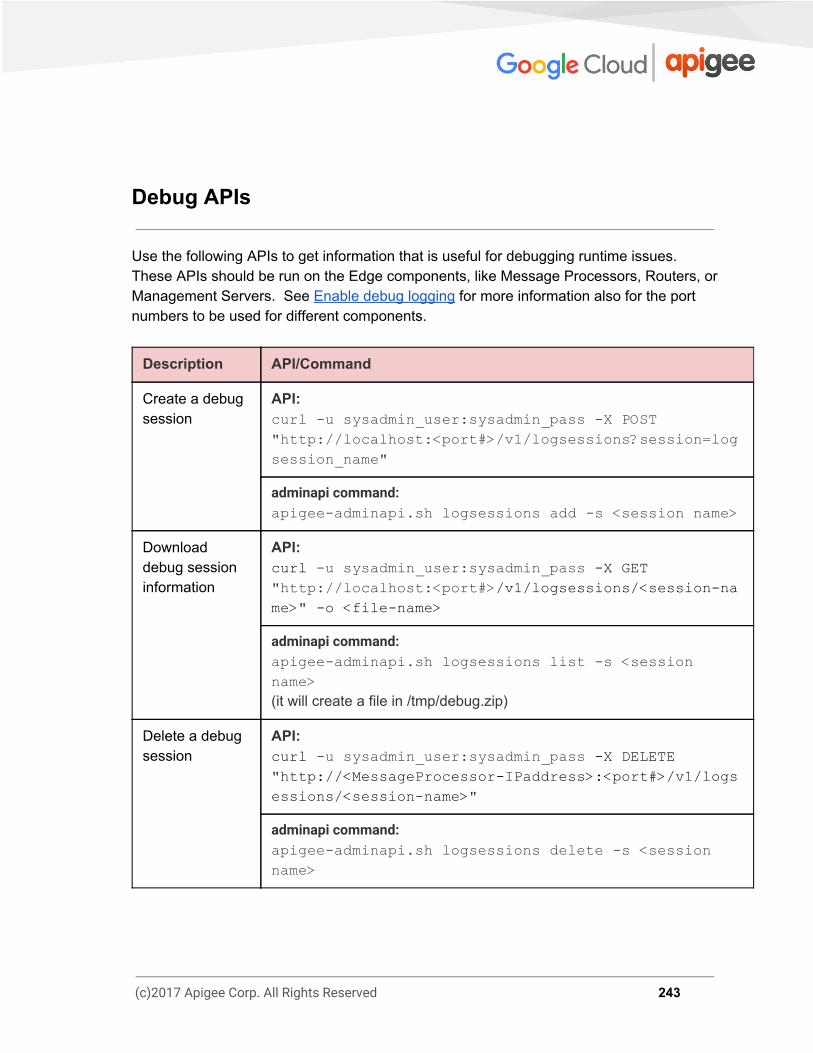
Debug APIs
Use the following APIs to get information that is useful for debugging runtime issues. These APIs should be run on the Edge components, like Message Processors, Routers, or Management Servers. See Enable debug logging for more information also for the port numbers to be used for different components.
Description API/Command
Create a debug session
API: curl -u sysadmin_user:sysadmin_pass -X POST "http://localhost:<port#>/v1/logsessions?session=log
session_name"
adminapi command: apigee-adminapi.sh logsessions add -s <session name>
Download debug session information
API: curl -u sysadmin_user:sysadmin_pass -X GET "http://localhost:<port#> /v1/logsessions/<session-name> " -o <file-name>
adminapi command: apigee-adminapi.sh logsessions list -s <session name>
(it will create a file in /tmp/debug.zip)
Delete a debug session
API: curl -u sysadmin_user:sysadmin_pass -X DELETE " http://<MessageProcessor-IPaddress>:<port#>/v1/logsessions/<session-name> "
adminapi command: apigee-adminapi.sh logsessions delete -s <session name>
(c)2017 Apigee Corp. All Rights Reserved 243

PART 4 - Properties
Message Processor Properties This section provides information and guidance on some of the properties that can be configured on the Edge Message Processor component to get optimized performance and desired results. The Message Processor properties are categorized based on the functionality and stored in separate property files. All the Message Processor property files are located in /opt/apigee/edge-message-processor/conf directory. Properties Table The following table lists the different types of Message Processor properties:
Type of Properties File Name Details
HTTP properties http.properties Contains HTTP protocol properties
Message Logging properties
message-logging.properties Contains Message Logging policy related properties.
Security properties security-policy.properties Contains security based properties.
JVM properties system.properties Contains JVM and JSSE related properties.
How to modify Properties You may have to modify the default values of some of the properties either as part of troubleshooting an issue or to get more optimized performance based on your requirements or application. The properties cannot be modified directly by editing the properties files listed in the above table. To modify the properties you need to use a technique referred to as “code with config.” Modifying any of the properties requires you to restart the Message Processor. For more details see code with config.
(c)2017 Apigee Corp. All Rights Reserved 244
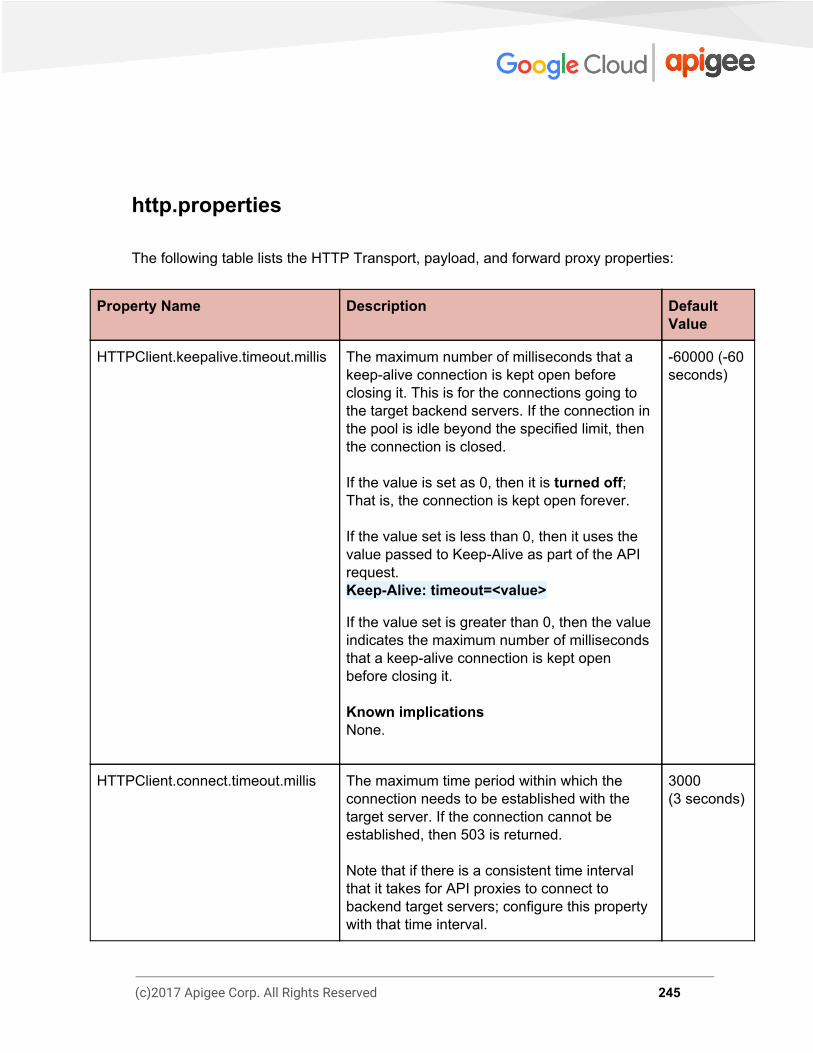
http.properties The following table lists the HTTP Transport, payload, and forward proxy properties:
Property Name Description Default Value
HTTPClient.keepalive.timeout.millis The maximum number of milliseconds that a keep-alive connection is kept open before closing it. This is for the connections going to the target backend servers. If the connection in the pool is idle beyond the specified limit, then the connection is closed. If the value is set as 0, then it is turned off; That is, the connection is kept open forever. If the value set is less than 0, then it uses the value passed to Keep-Alive as part of the API request. Keep-Alive: timeout=<value> If the value set is greater than 0, then the value indicates the maximum number of milliseconds that a keep-alive connection is kept open before closing it. Known implications None.
-60000 (-60 seconds)
HTTPClient.connect.timeout.millis The maximum time period within which the connection needs to be established with the target server. If the connection cannot be established, then 503 is returned. Note that if there is a consistent time interval that it takes for API proxies to connect to backend target servers; configure this property with that time interval.
3000 (3 seconds)
(c)2017 Apigee Corp. All Rights Reserved 245
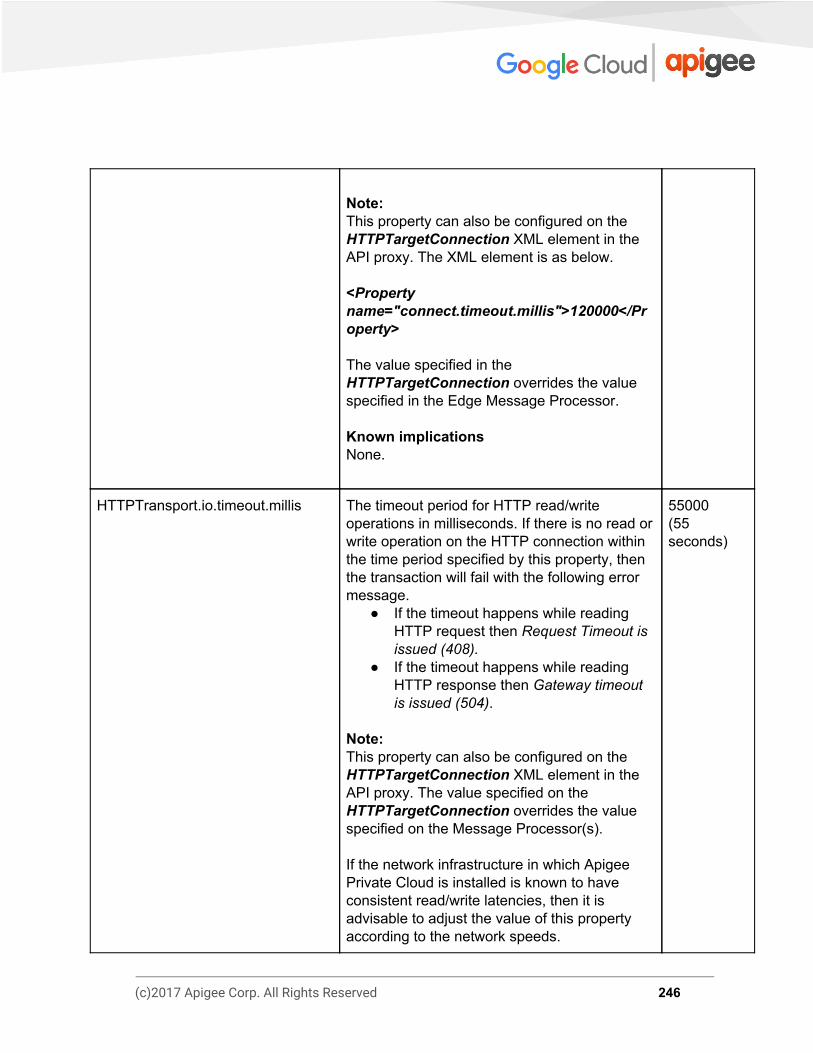
Note: This property can also be configured on the HTTPTargetConnection XML element in the API proxy. The XML element is as below. <Property name="connect.timeout.millis">120000</Property> The value specified in the HTTPTargetConnection overrides the value specified in the Edge Message Processor. Known implications None.
HTTPTransport.io.timeout.millis The timeout period for HTTP read/write operations in milliseconds. If there is no read or write operation on the HTTP connection within the time period specified by this property, then the transaction will fail with the following error message.
● If the timeout happens while reading HTTP request then Request Timeout is issued (408).
● If the timeout happens while reading HTTP response then Gateway timeout is issued (504).
Note: This property can also be configured on the HTTPTargetConnection XML element in the API proxy. The value specified on the HTTPTargetConnection overrides the value specified on the Message Processor(s). If the network infrastructure in which Apigee Private Cloud is installed is known to have consistent read/write latencies, then it is advisable to adjust the value of this property according to the network speeds.
55000 (55 seconds)
(c)2017 Apigee Corp. All Rights Reserved 246

Known implications The value specified should be greater than the time that target servers take to respond. If this value is set to a value less than the expected time required by the target servers, then the Message Processor will time out and you will get a 504 Gateway Timeout Error. You should not set an arbitrarily high number for this value, as it can cause connections to be held for longer than required. Review this community post to learn more about the other associated properties and their values.
HTTP Payload Header Properties
HTTPRequest.line.limit The maximum allowed size of the request line of the HTTP request that is made by the Message Processor to its backend services. The value includes both the HTTP URL and query parameters. If there are a lot of query parameters to be passed as part of the URL, then the value of this property can be modified appropriately to accommodate the URL and the associated query parameters. Note: This property is useful in the scenarios where the HTTP request URLs are automatically generated and the length of the URLs is arbitrary. The default value of 7k should suffice most of the situations. Consider increasing the value if the length of the URLs exceed the default value. See the Edge documentation for more information.
7k (7168 bytes)
(c)2017 Apigee Corp. All Rights Reserved 247

Known implications None.
HTTPRequest.headers.limit The maximum size allowed for the HTTP headers when Message Processor makes a HTTP request to its backend services. Consider increasing the value if the size of the HTTP headers exceed the default value. See the Edge documentation for more information. Known implications None.
25k (25600 bytes)
HTTPResponse.line.limit The maximum size allowed by the Message Processor component for the response line that it receives from the backend. Note: This property is useful in the scenarios where the HTTP request URLs are automatically generated and the length of the URLs is arbitrary. The default value of 2k should suffice in most situations. Consider increasing the value if the length of the URLs exceed the default value. See the Edge documentation for more information. Known implications None.
2k (2048 bytes)
HTTPResponse.headers.limit The maximum size allowed by the Message Processor component for the response headers of the HTTP response that it receives from the backend. Consider increasing the value if the size of the HTTP headers exceed the default value. See the Edge documentation for more information.
(25600 bytes)
(c)2017 Apigee Corp. All Rights Reserved 248
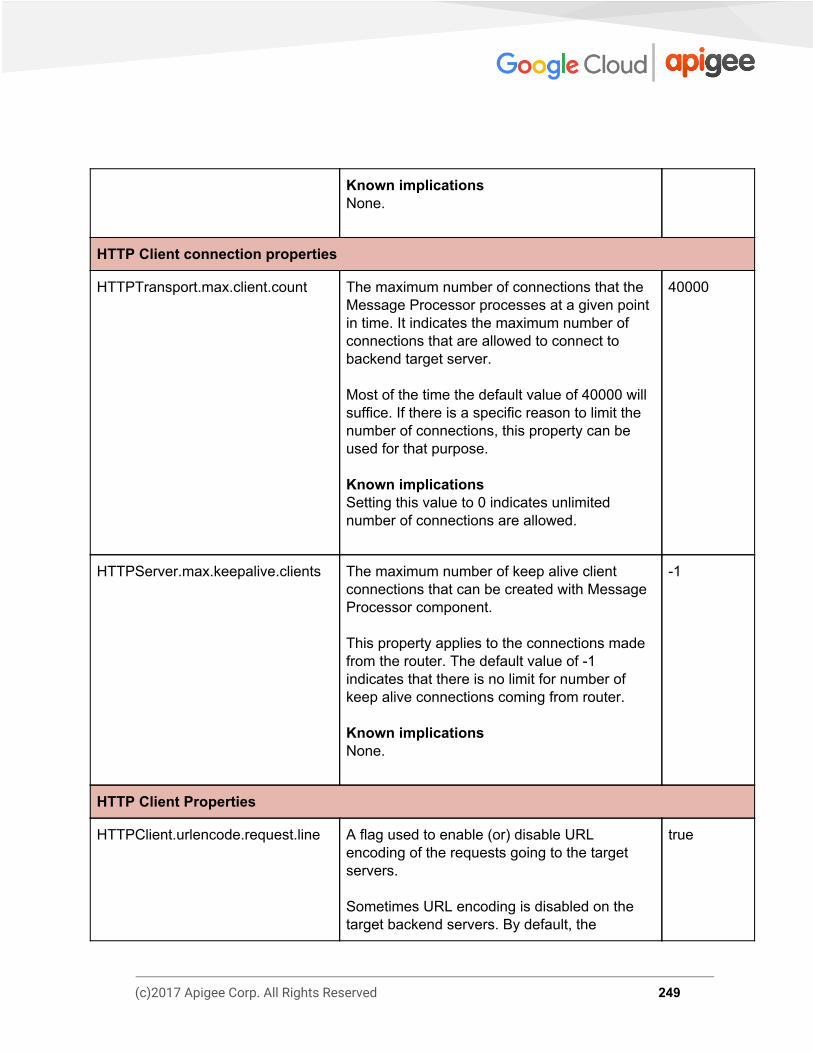
Known implications None.
HTTP Client connection properties
HTTPTransport.max.client.count The maximum number of connections that the Message Processor processes at a given point in time. It indicates the maximum number of connections that are allowed to connect to backend target server. Most of the time the default value of 40000 will suffice. If there is a specific reason to limit the number of connections, this property can be used for that purpose. Known implications Setting this value to 0 indicates unlimited number of connections are allowed.
40000
HTTPServer.max.keepalive.clients The maximum number of keep alive client connections that can be created with Message Processor component. This property applies to the connections made from the router. The default value of -1 indicates that there is no limit for number of keep alive connections coming from router. Known implications None.
-1
HTTP Client Properties
HTTPClient.urlencode.request.line A flag used to enable (or) disable URL encoding of the requests going to the target servers. Sometimes URL encoding is disabled on the target backend servers. By default, the
true
(c)2017 Apigee Corp. All Rights Reserved 249

Message Processor component encodes the URL and makes HTTP calls to target backend servers. In this case, the URL encoding can be disabled at the Message Processor by setting the value of this property to false. Known implications None.
HTTPClient.dns.ttl The application level (Message Processor level) time-to-live value in seconds for DNS cache. The Message Processor uses the DNS values from this property until it expires. If it is expires, then it uses the value specified in dns.cache.ttl.sec, which is specified in the security-policy.properties. This property is related to the DNS entries for the backend servers to which the Message Processor makes calls. Set the value for this property according to frequency with which the DNS entries for the backend servers change. Known implications None.
60
HTTP Request Properties
HTTPRequest.POST.allow.without.Content-Length (and) HTTPRequest.PUT.allow.without.Content-Length
Flags used to configure whether POST and PUT requests require a payload. By default, a Message Processor expects POST and PUT requests to have a payload. If the requests do not have payload, then the HTTP-411 Length Required error response is sent to clients. If you need to support POST and PUT requests without a payload, then set these properties to true.
false
(c)2017 Apigee Corp. All Rights Reserved 250
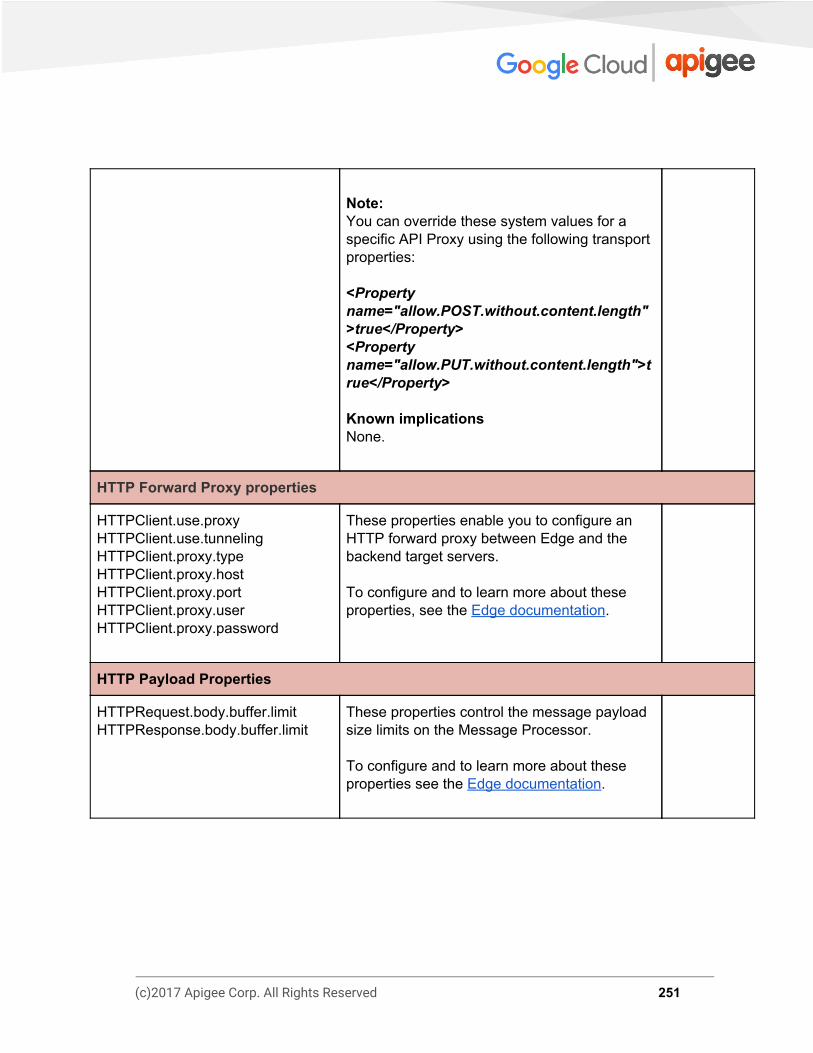
Note: You can override these system values for a specific API Proxy using the following transport properties: <Property name="allow.POST.without.content.length">true</Property> <Property name="allow.PUT.without.content.length">true</Property> Known implications None.
HTTP Forward Proxy properties
HTTPClient.use.proxy HTTPClient.use.tunneling HTTPClient.proxy.type HTTPClient.proxy.host HTTPClient.proxy.port HTTPClient.proxy.user HTTPClient.proxy.password
These properties enable you to configure an HTTP forward proxy between Edge and the backend target servers. To configure and to learn more about these properties, see the Edge documentation.
HTTP Payload Properties
HTTPRequest.body.buffer.limit HTTPResponse.body.buffer.limit
These properties control the message payload size limits on the Message Processor. To configure and to learn more about these properties see the Edge documentation.
(c)2017 Apigee Corp. All Rights Reserved 251

message-logging.properties The following table lists the Message Logging Policy properties:
Property Name Description Default Value
max.log.message.size.in.kb The maximum log size allowed by the Message Processor. If you use Message Logging policy and see the following message in the Message Processor logs then this property needs to be configured. “Log message size exceeded. Increase the max message size setting” For more information about this message, see this community post. You can increase the value up to 1024 or 2048 depending on the rate and size of the message payload being logged as part of message logging policy. Known implications None.
128
(c)2017 Apigee Corp. All Rights Reserved 252
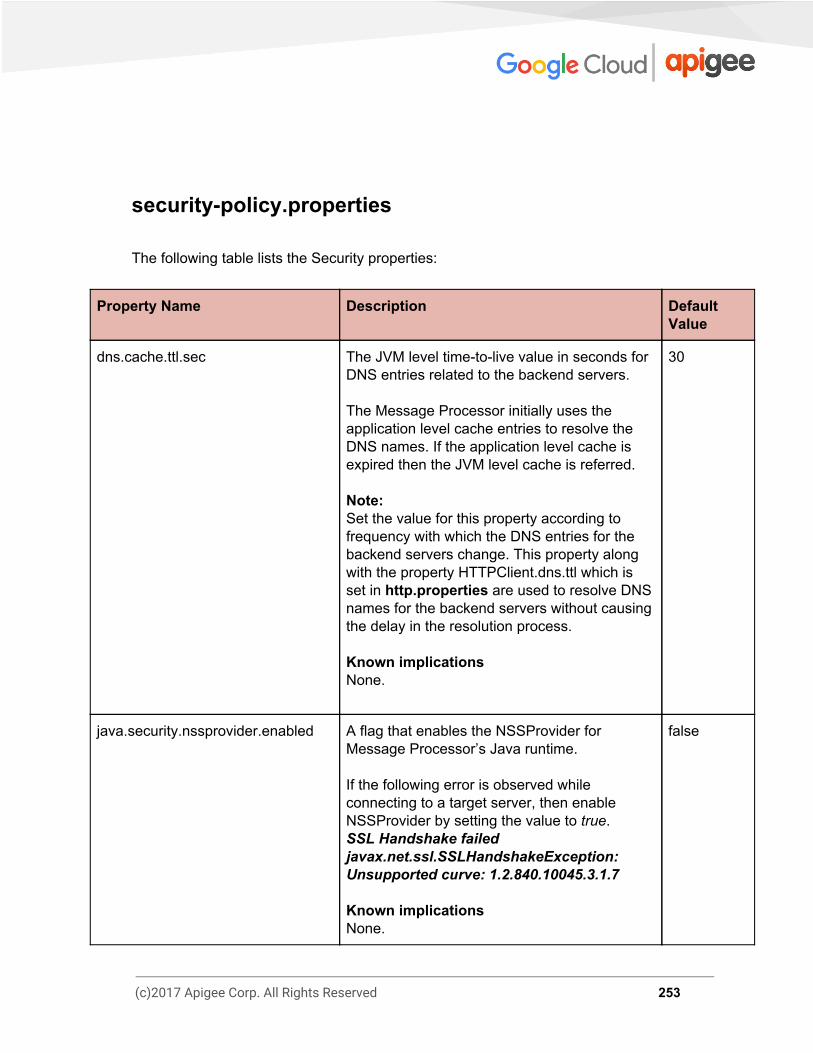
security-policy.properties The following table lists the Security properties:
Property Name Description Default Value
dns.cache.ttl.sec The JVM level time-to-live value in seconds for DNS entries related to the backend servers. The Message Processor initially uses the application level cache entries to resolve the DNS names. If the application level cache is expired then the JVM level cache is referred. Note: Set the value for this property according to frequency with which the DNS entries for the backend servers change. This property along with the property HTTPClient.dns.ttl which is set in http.properties are used to resolve DNS names for the backend servers without causing the delay in the resolution process. Known implications None.
30
java.security.nssprovider.enabled A flag that enables the NSSProvider for Message Processor’s Java runtime. If the following error is observed while connecting to a target server, then enable NSSProvider by setting the value to true. SSL Handshake failed javax.net.ssl.SSLHandshakeException: Unsupported curve: 1.2.840.10045.3.1.7 Known implications None.
false
(c)2017 Apigee Corp. All Rights Reserved 253

system.properties The following table lists the Java and JSSE properties:
Property Name Description Default Value
jsse.enableSNIExtension A flag that specifies whether to enable the SNI (server name indication) extension flag in the SSL handshake. Setting the value of this property to true enables SNI extension flag in the SSL handshake. When the Message Processor makes TLS connections to the target servers, the server_name extension is added to the TLS handshake request. This is required if the target servers are SNI enabled. Note: SNI-enabled Message Processors can make TLS connections to both SNI-enabled as well as non-SNI enabled target servers. But non-SNI enabled Message Processors cannot make TLS connections to SNI-enabled target servers. Known implications None.
false
(c)2017 Apigee Corp. All Rights Reserved 254