deep-dive: predicting customer behavior with apigee insights
TRANSCRIPT
Deep-Dive: Predicting Customer Behavior with Apigee InsightsAnticipate and adapt to each customer’s journey
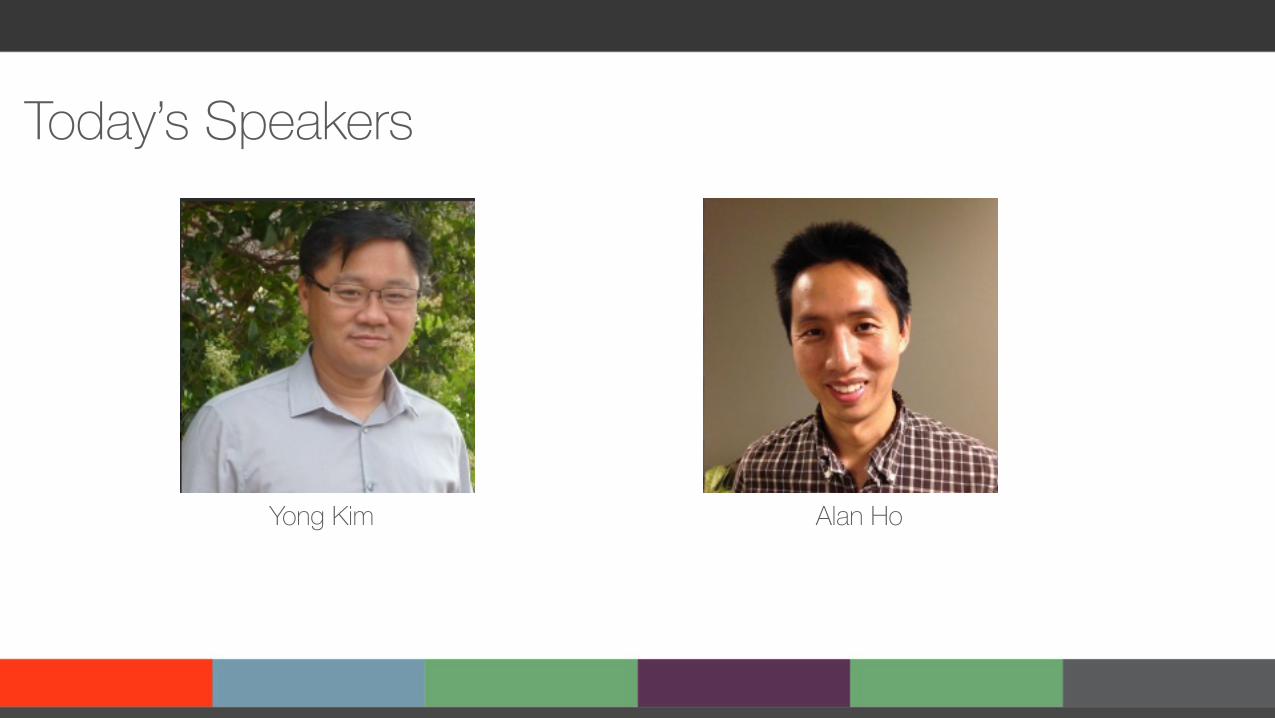
Today’s Speakers
Yong Kim Alan Ho

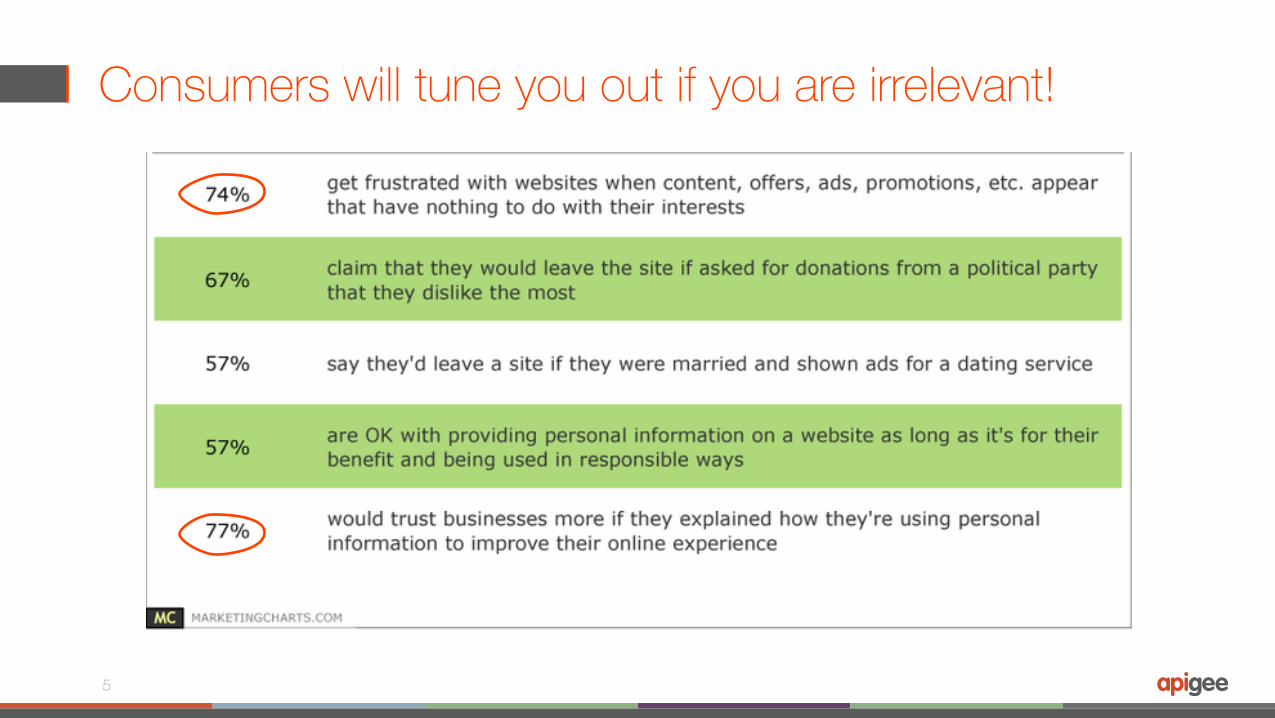
Consumers will tune you out if you are irrelevant!
5
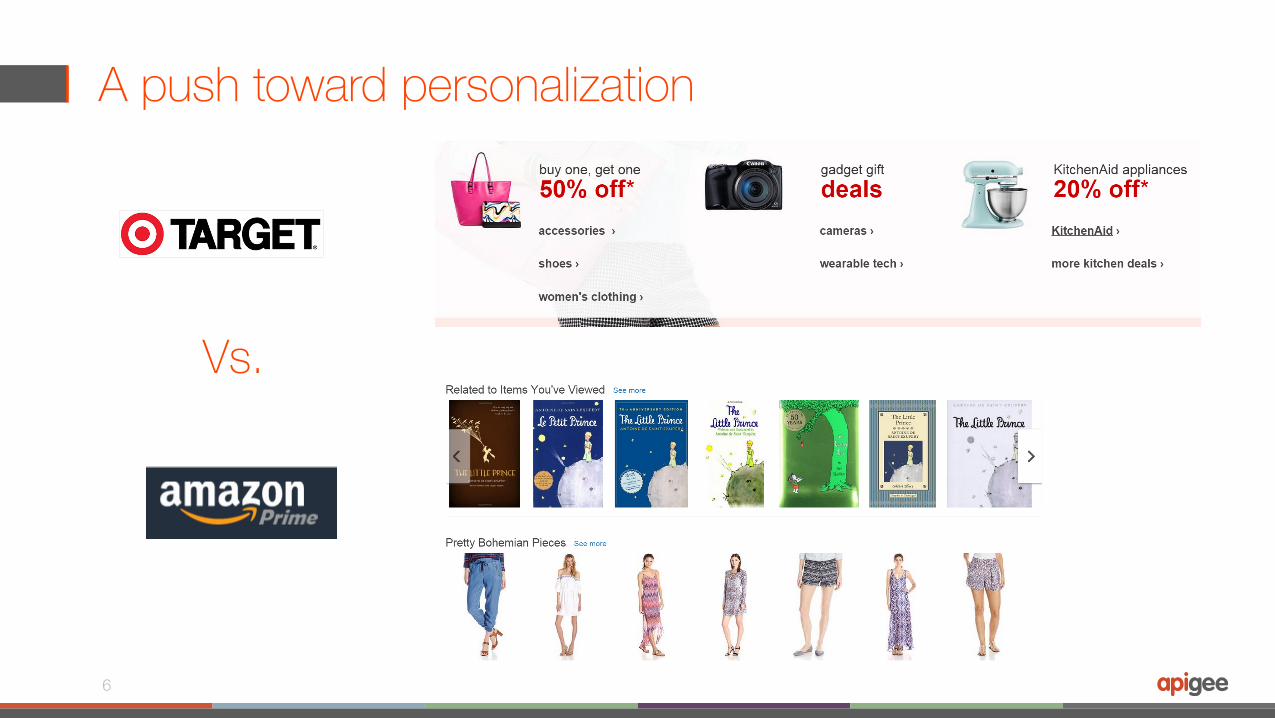
A push toward personalization
6
Vs.
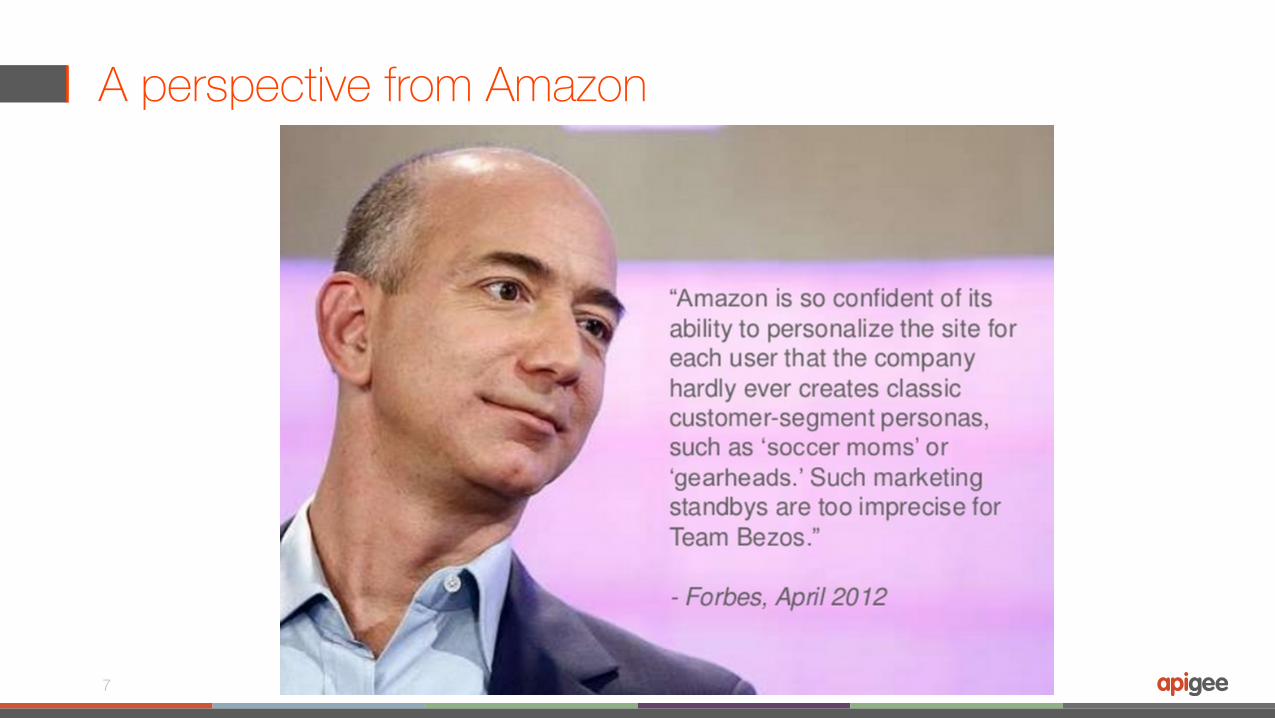
A perspective from Amazon
7

The complete personalization solution
Segmentation Predictive Analytics on Big Data
Real Time Interaction Platform
Personalization:Right PersonRight OfferRight Time
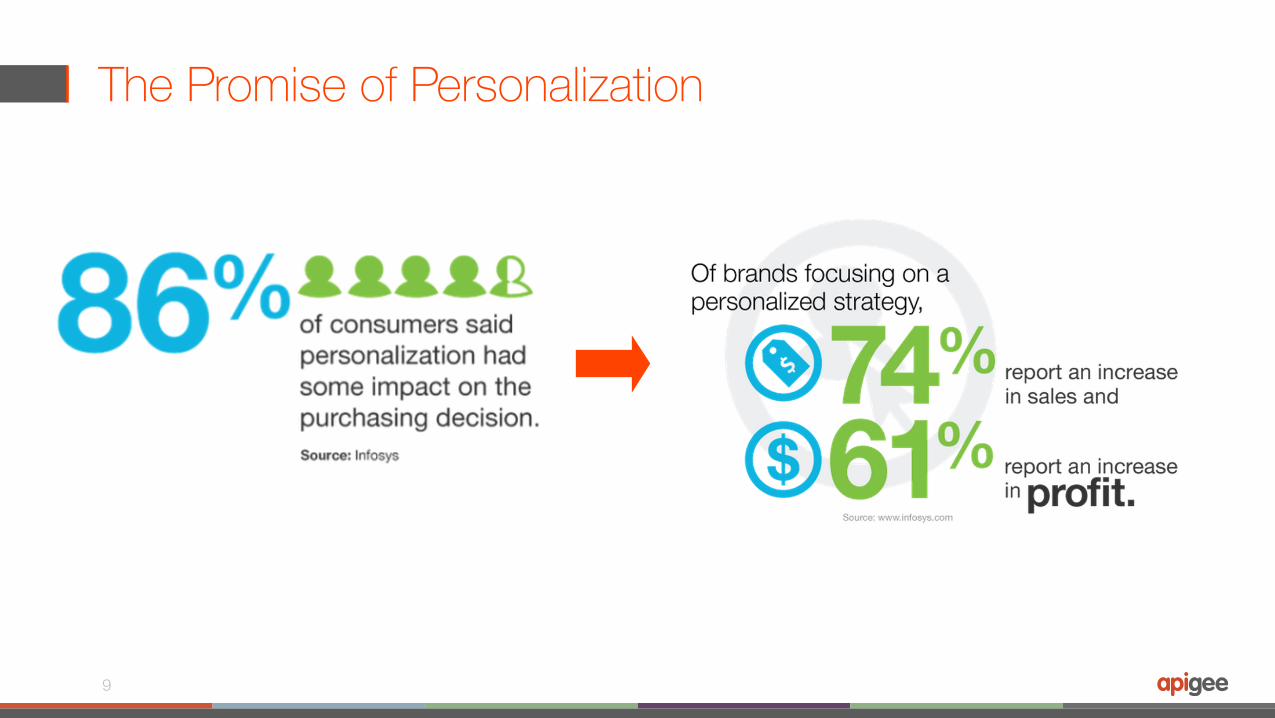
The Promise of Personalization
9
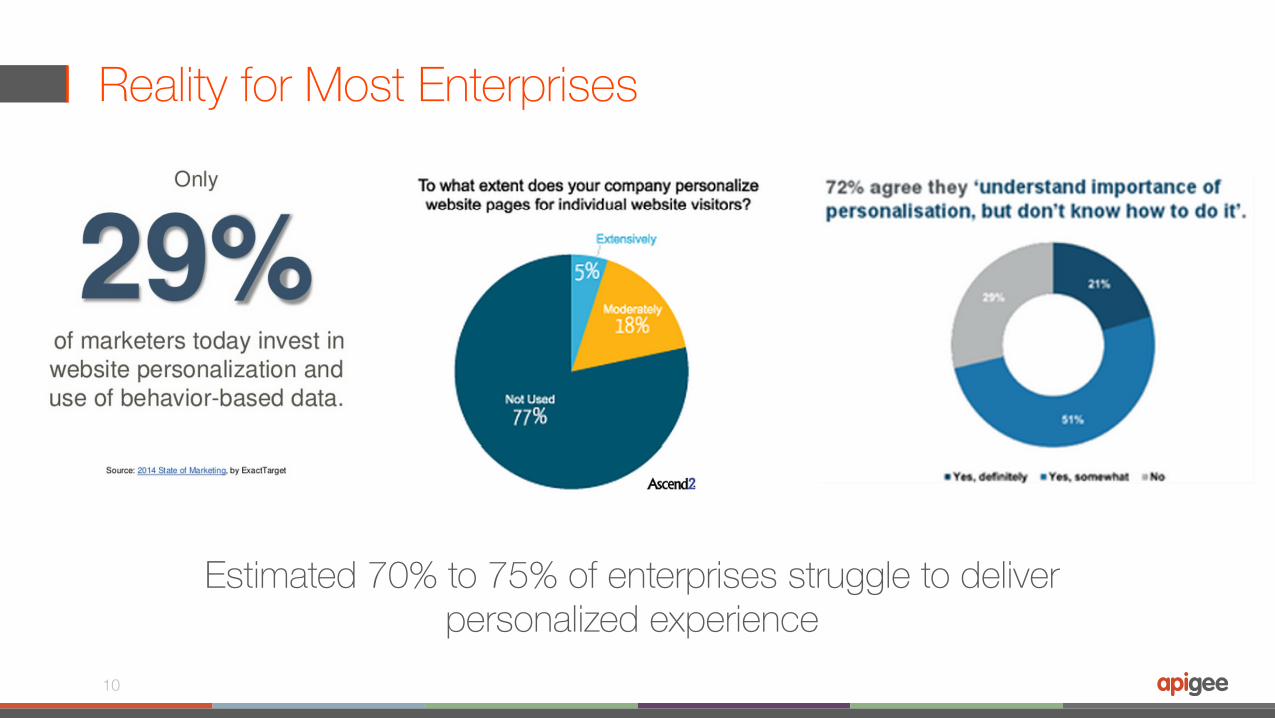
Reality for Most Enterprises
10
Estimated 70% to 75% of enterprises struggle to deliver personalized experience
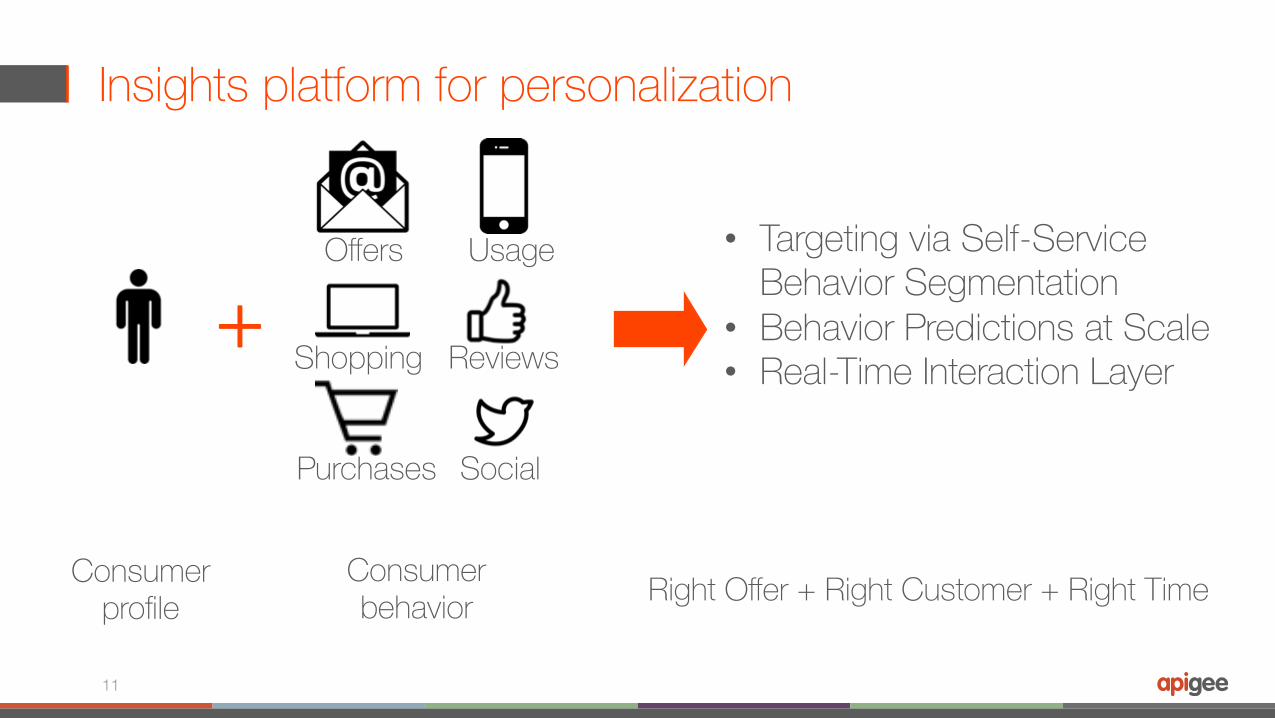
Insights platform for personalization
11
Consumer profile
Consumer behavior
• Targeting via Self-Service Behavior Segmentation
• Behavior Predictions at Scale• Real-Time Interaction Layer
Offers
Shopping
Purchases
Usage
Reviews
Social
+
Right Offer + Right Customer + Right Time
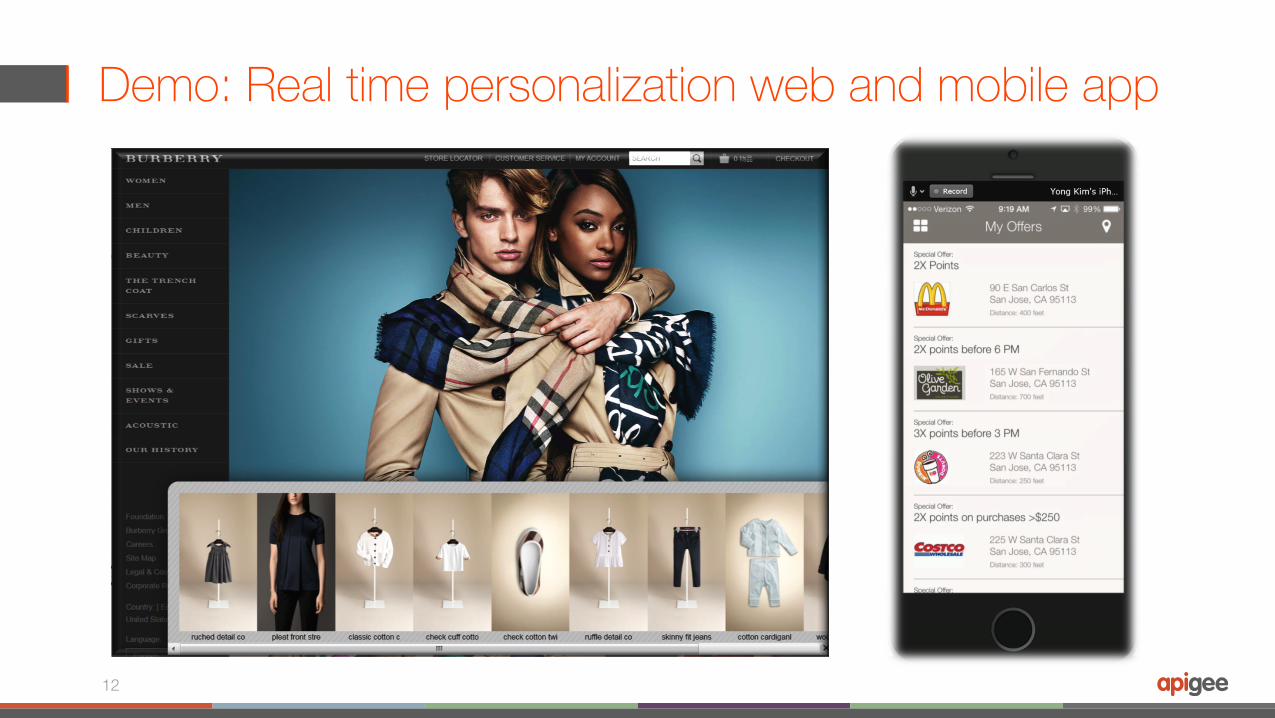
Demo: Real time personalization web and mobile app
12
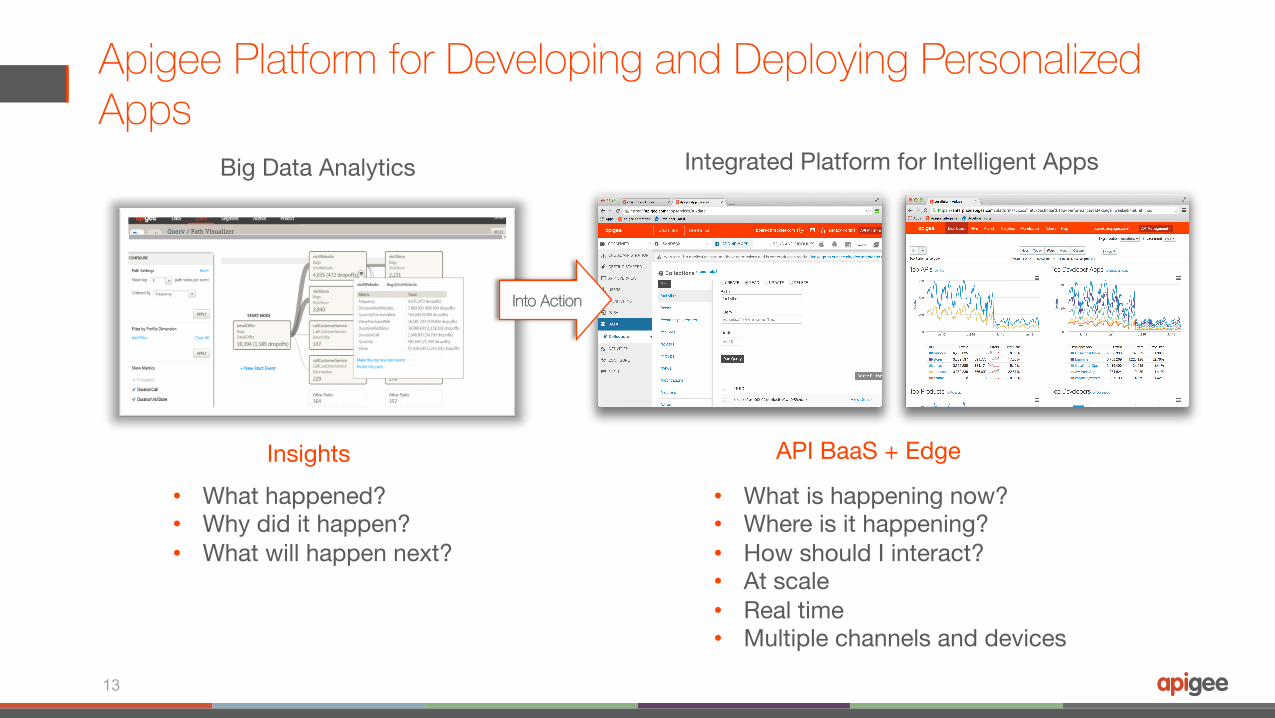
Apigee Platform for Developing and Deploying Personalized Apps
13
Big Data Analytics Integrated Platform for Intelligent Apps
Insights API BaaS + Edge
• What happened? • Why did it happen? • What will happen next?
• What is happening now? • Where is it happening? • How should I interact? • At scale • Real time • Multiple channels and devices
Into Action
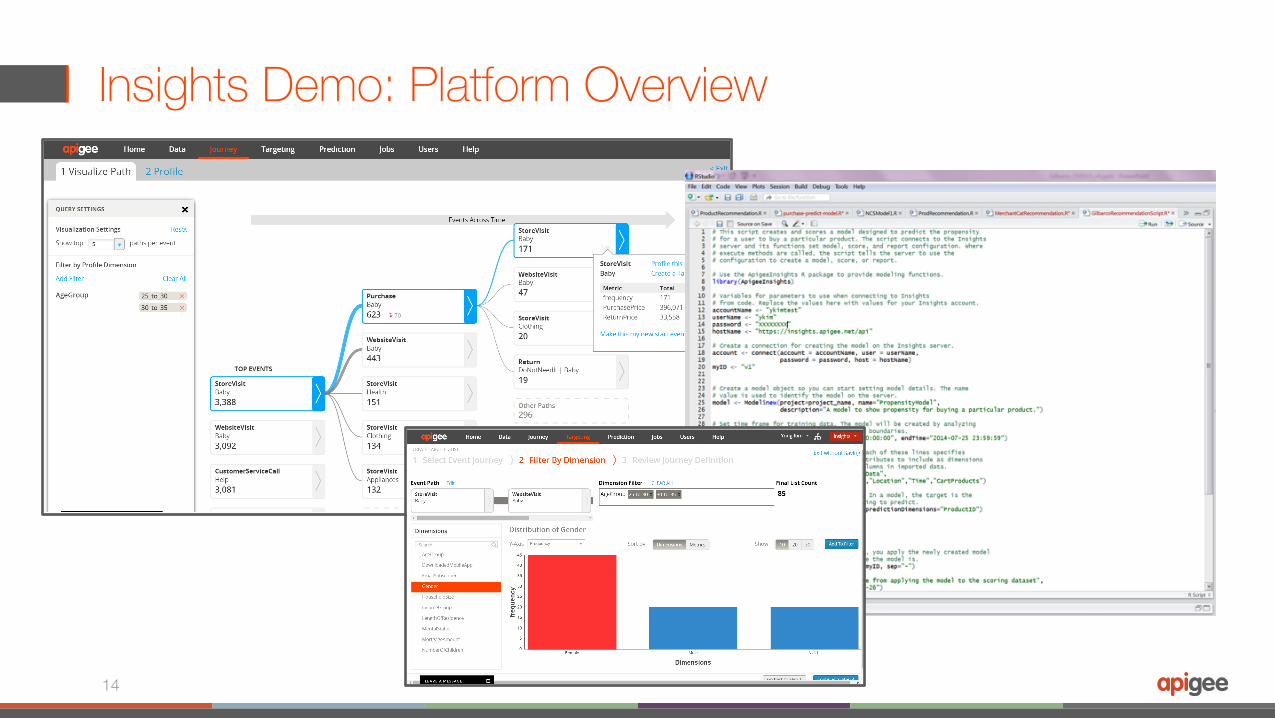
Insights Demo: Platform Overview
14
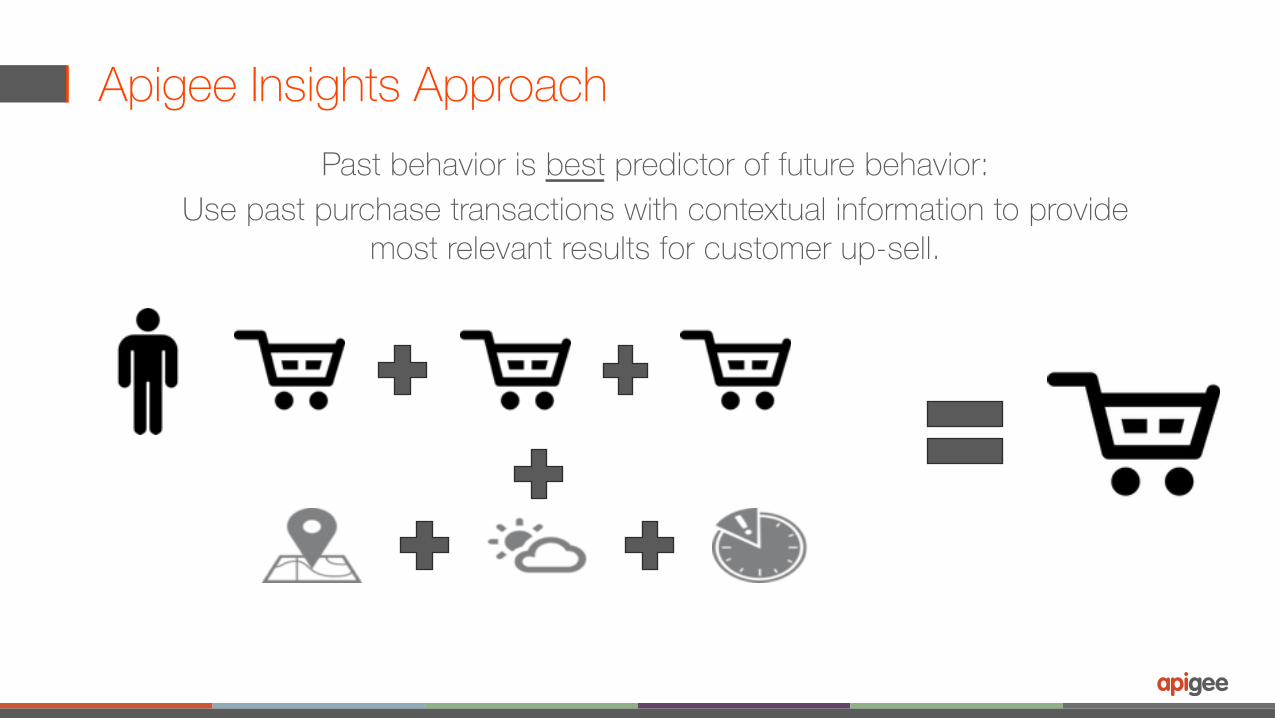
Past behavior is best predictor of future behavior:Use past purchase transactions with contextual information to provide
most relevant results for customer up-sell.
Apigee Insights Approach
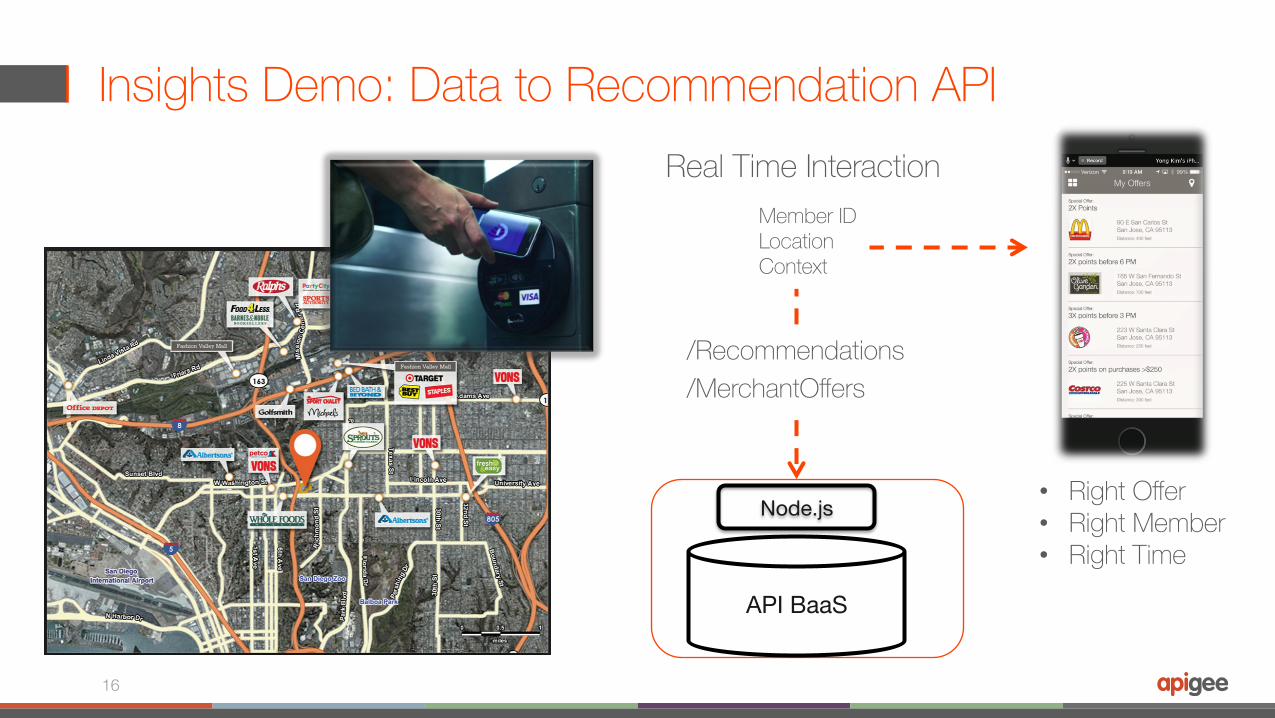
Insights Demo: Data to Recommendation API
16
Real Time Interaction
• Right Offer• Right Member• Right Time
Member IDLocationContext
/Recommendations/MerchantOffers
API BaaS
Node.js
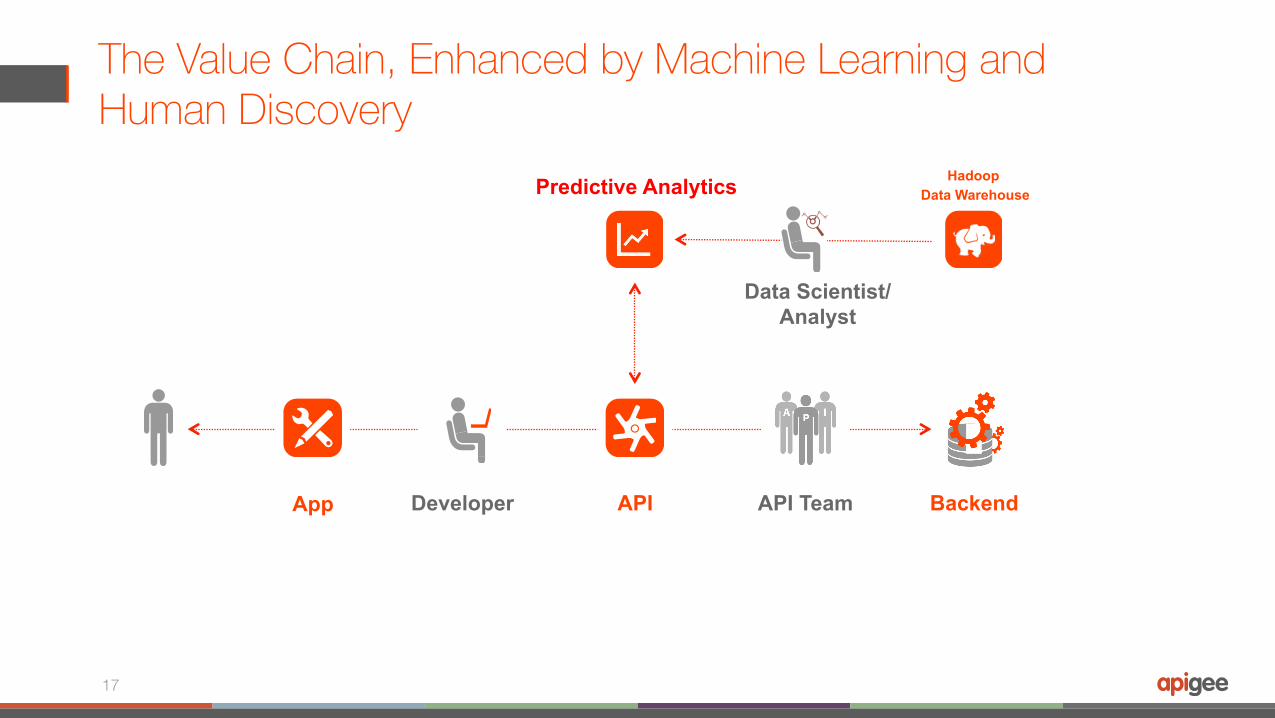
The Value Chain, Enhanced by Machine Learning and Human Discovery
17
Developer API API Team Backend
Predictive Analytics Hadoop Data Warehouse
App App
Data Scientist/ Analyst
GRASP:�Graph and Sequence Processing on Hadoop��
18
Time-sequenced graph analytics on Hadoop
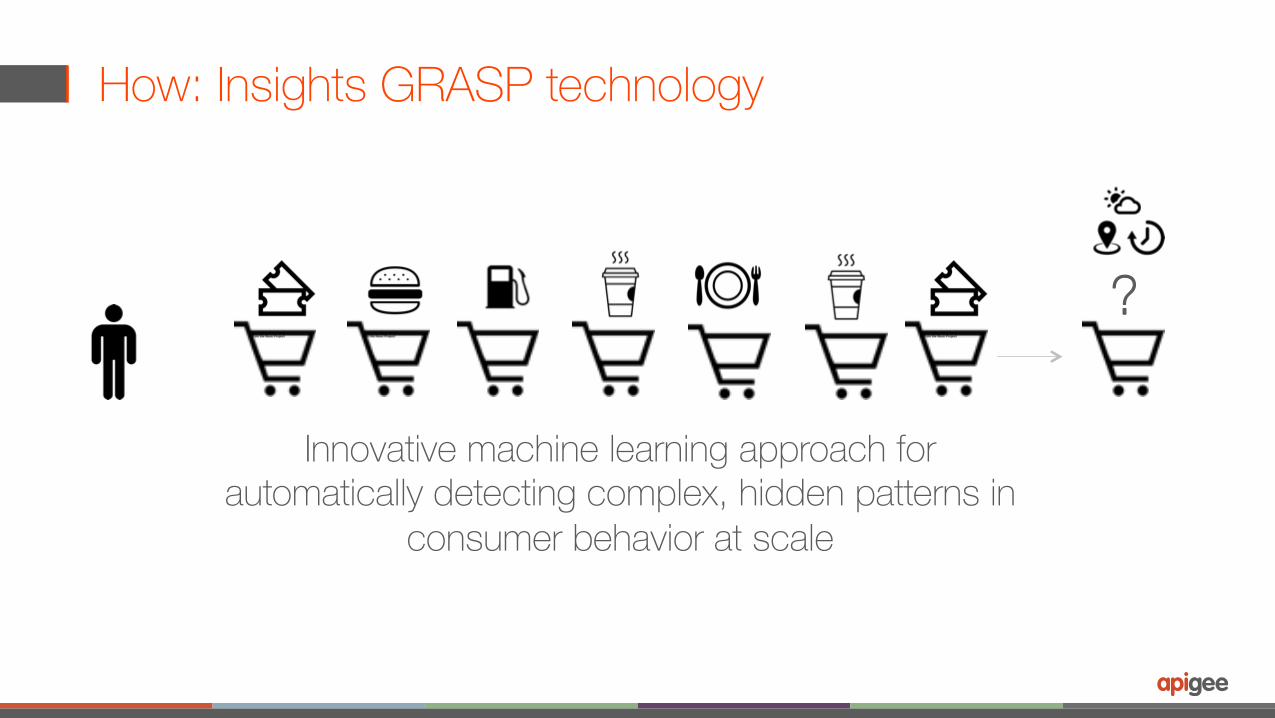
How: Insights GRASP technology
?
Innovative machine learning approach for automatically detecting complex, hidden patterns in
consumer behavior at scale
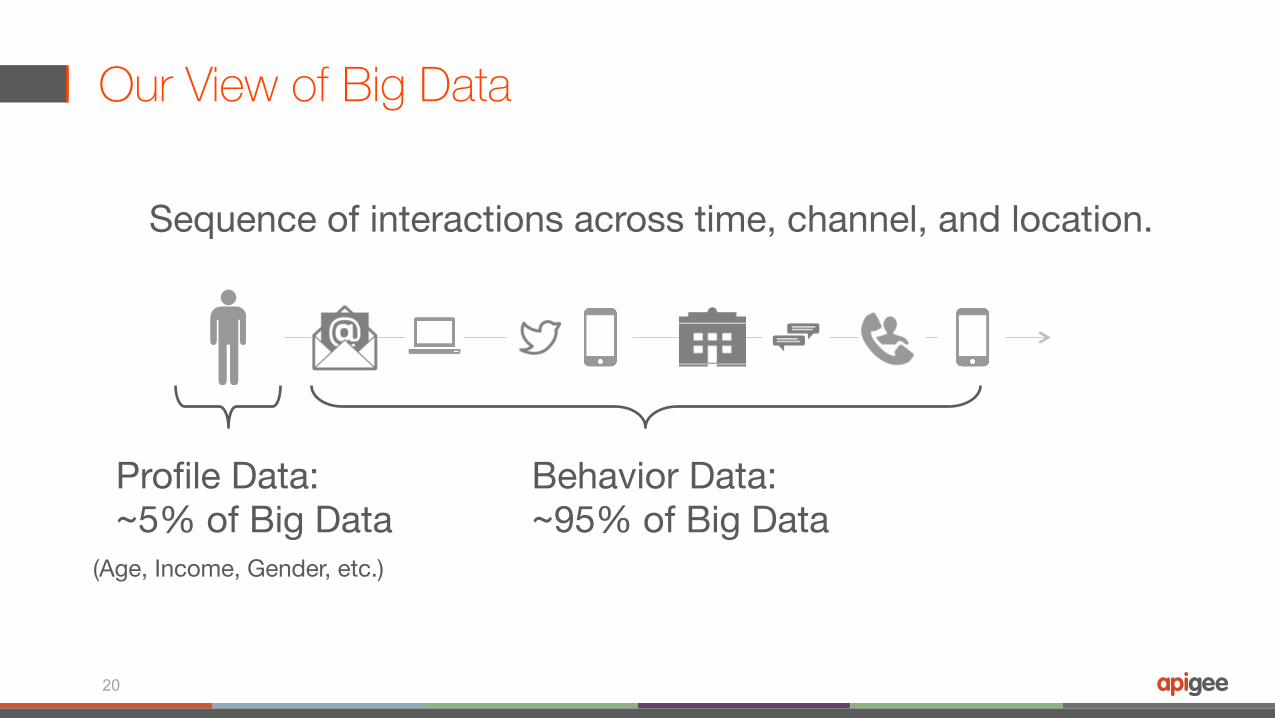
Our View of Big Data
20
Sequence of interactions across time, channel, and location.
Behavior Data: ~95% of Big Data
Profile Data: ~5% of Big Data
(Age, Income, Gender, etc.)
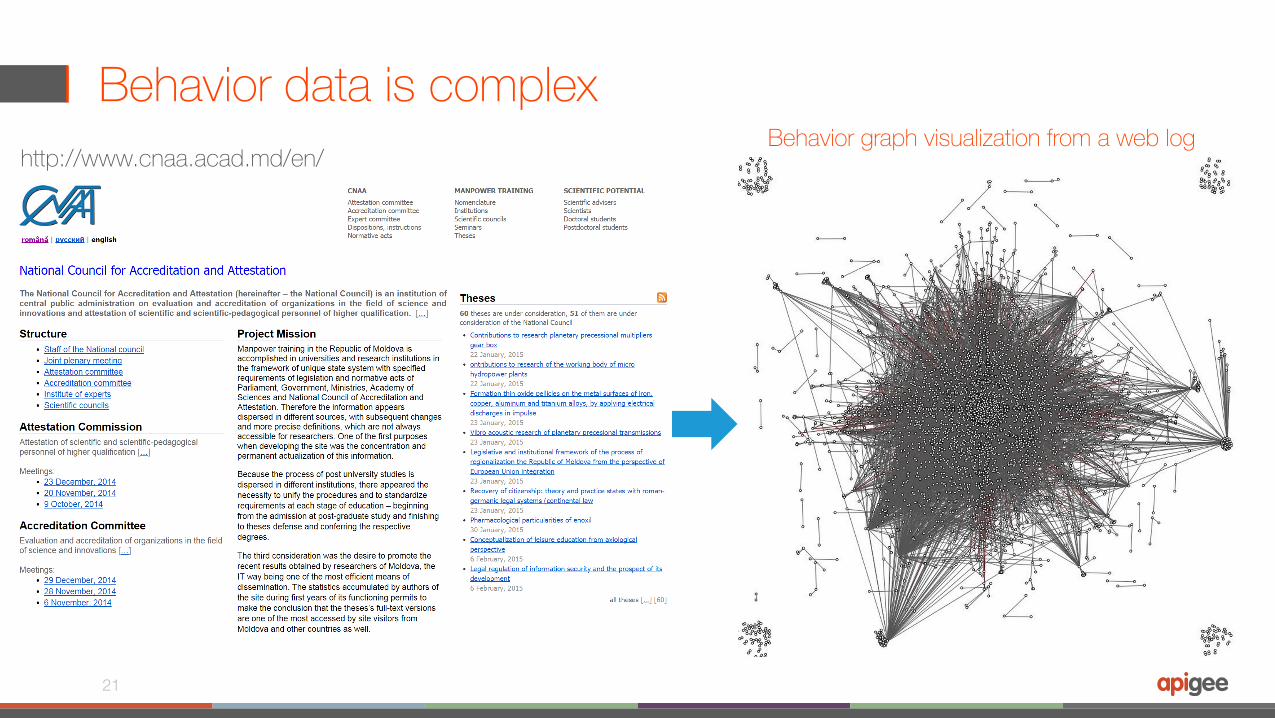
Behavior data is complex
21
Behavior graph visualization from a web loghttp://www.cnaa.acad.md/en/
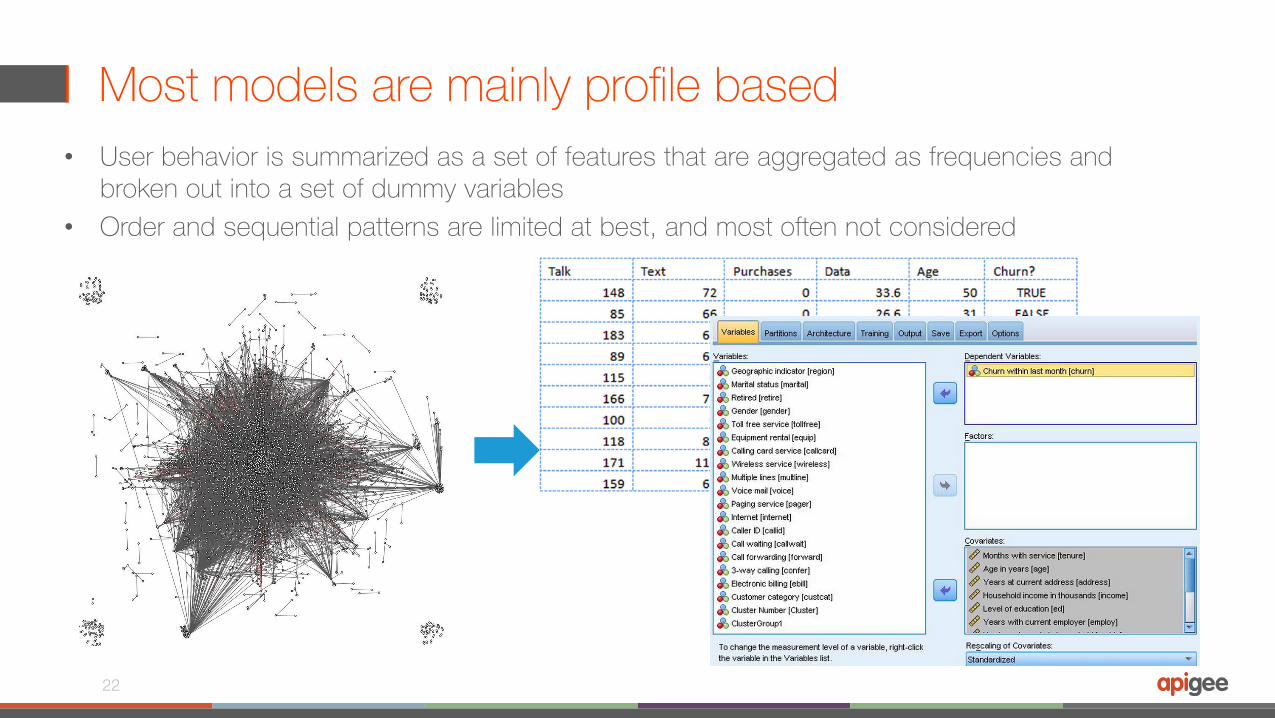
Most models are mainly profile based• User behavior is summarized as a set of features that are aggregated as frequencies and
broken out into a set of dummy variables• Order and sequential patterns are limited at best, and most often not considered
22
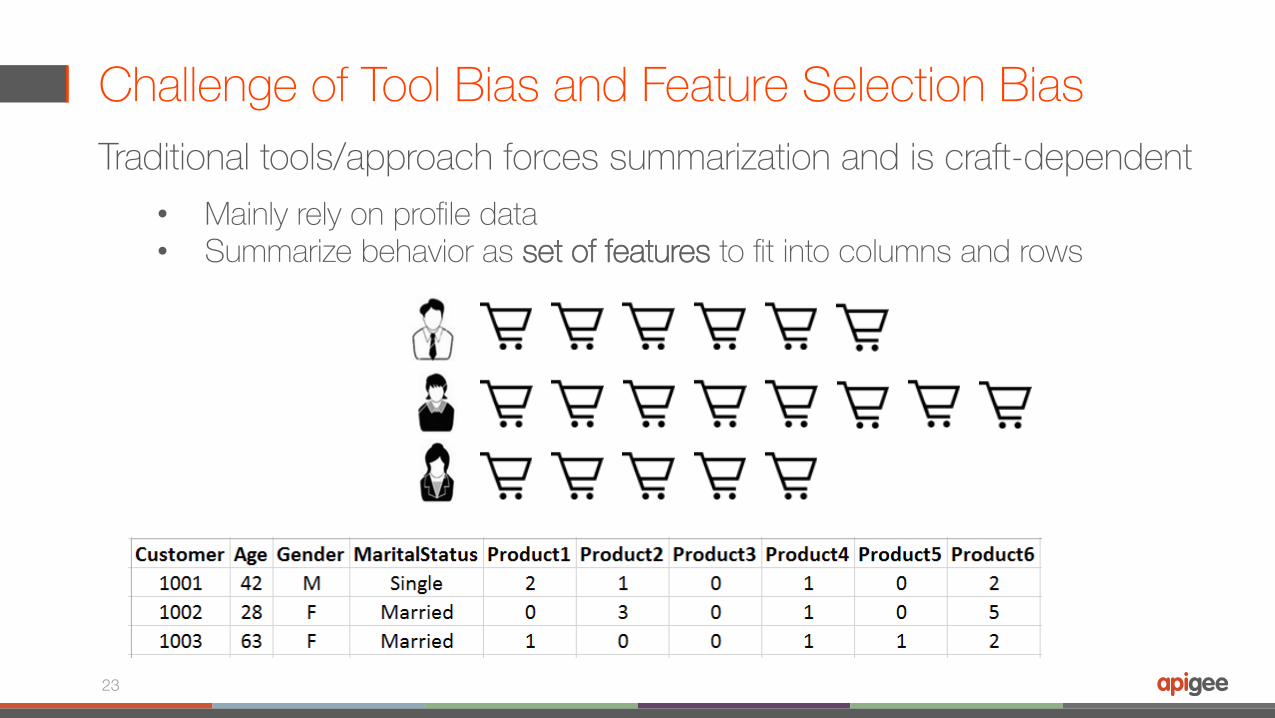
Challenge of Tool Bias and Feature Selection Bias
23
Traditional tools/approach forces summarization and is craft-dependent • Mainly rely on profile data• Summarize behavior as set of features to fit into columns and rows
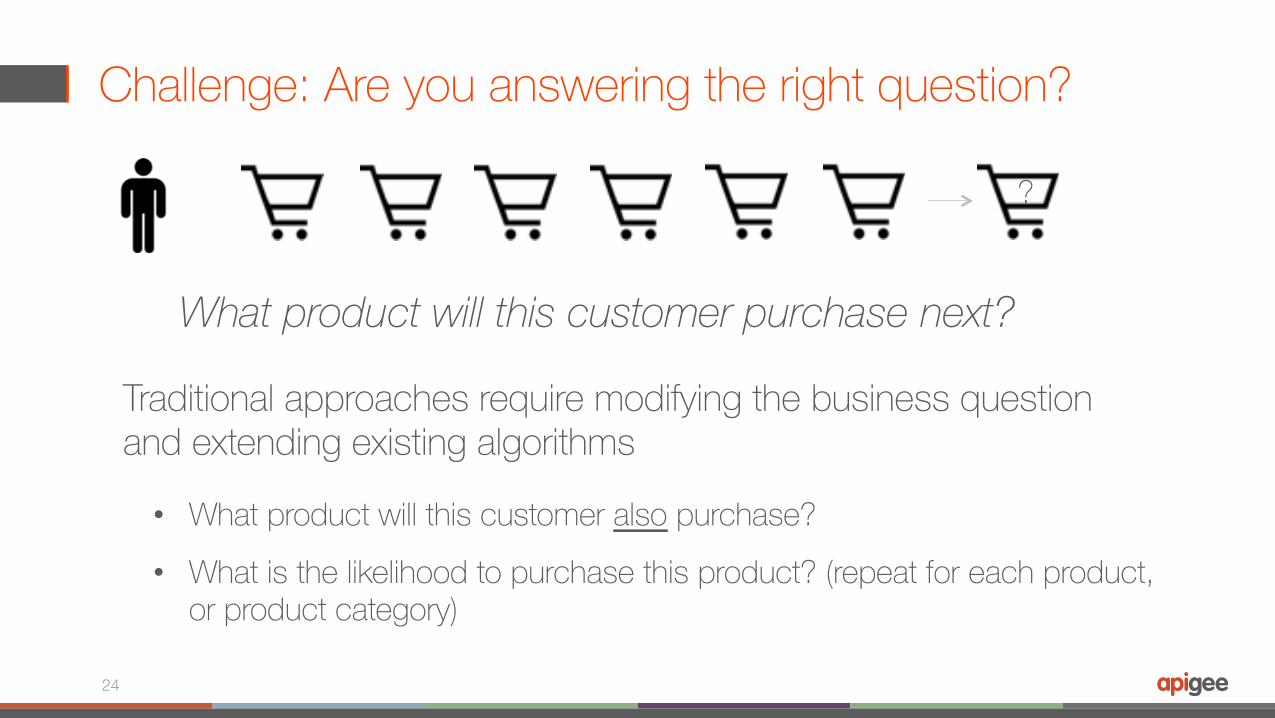
Challenge: Are you answering the right question?
24
What product will this customer purchase next?
• What product will this customer also purchase?
• What is the likelihood to purchase this product? (repeat for each product, or product category)
Traditional approaches require modifying the business question and extending existing algorithms
?
25
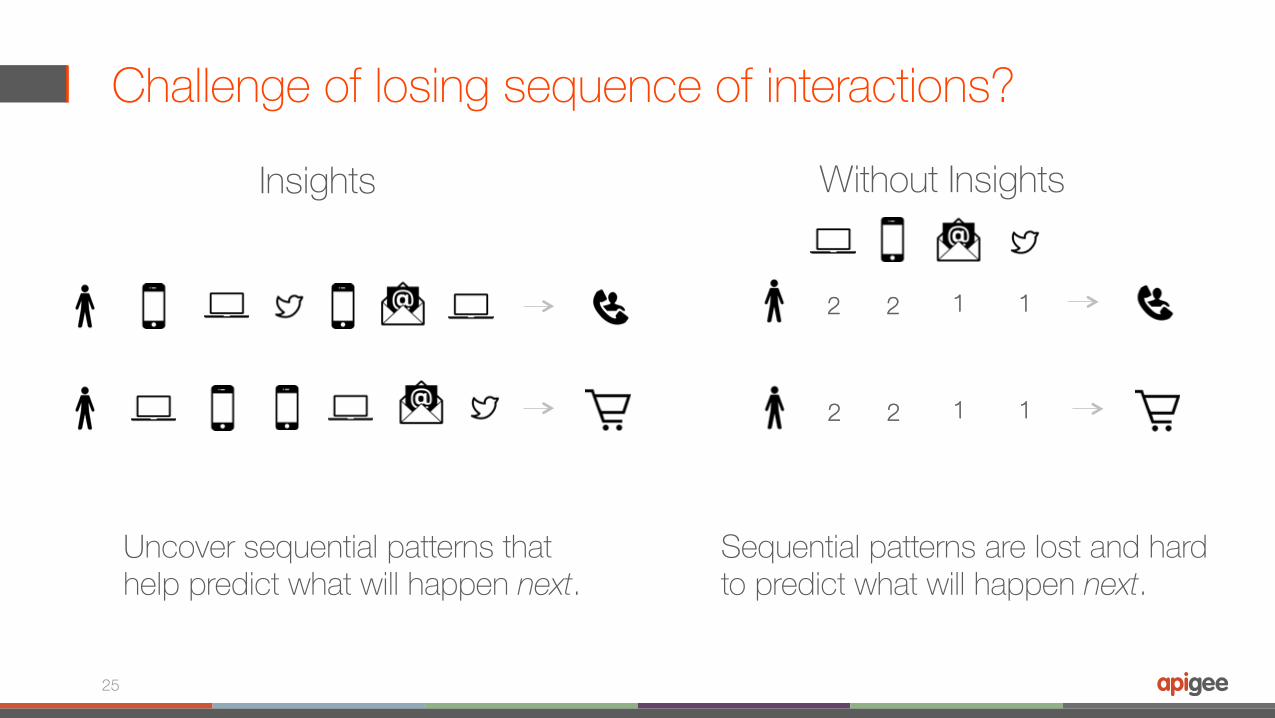
Insights
2 2 1 1
2 2 1 1
Without Insights
Uncover sequential patterns that help predict what will happen next.
Sequential patterns are lost and hard to predict what will happen next.
Challenge of losing sequence of interactions?
Businesses need tools for analyzing behavior (event sequence) data
• Discovering behavior patterns is very painful with traditional relational data structures.
• Data scientists at some of the largest companies such as Expedia, AT&T, Pearson, Magazine Luiza, and Telstra agree.
26
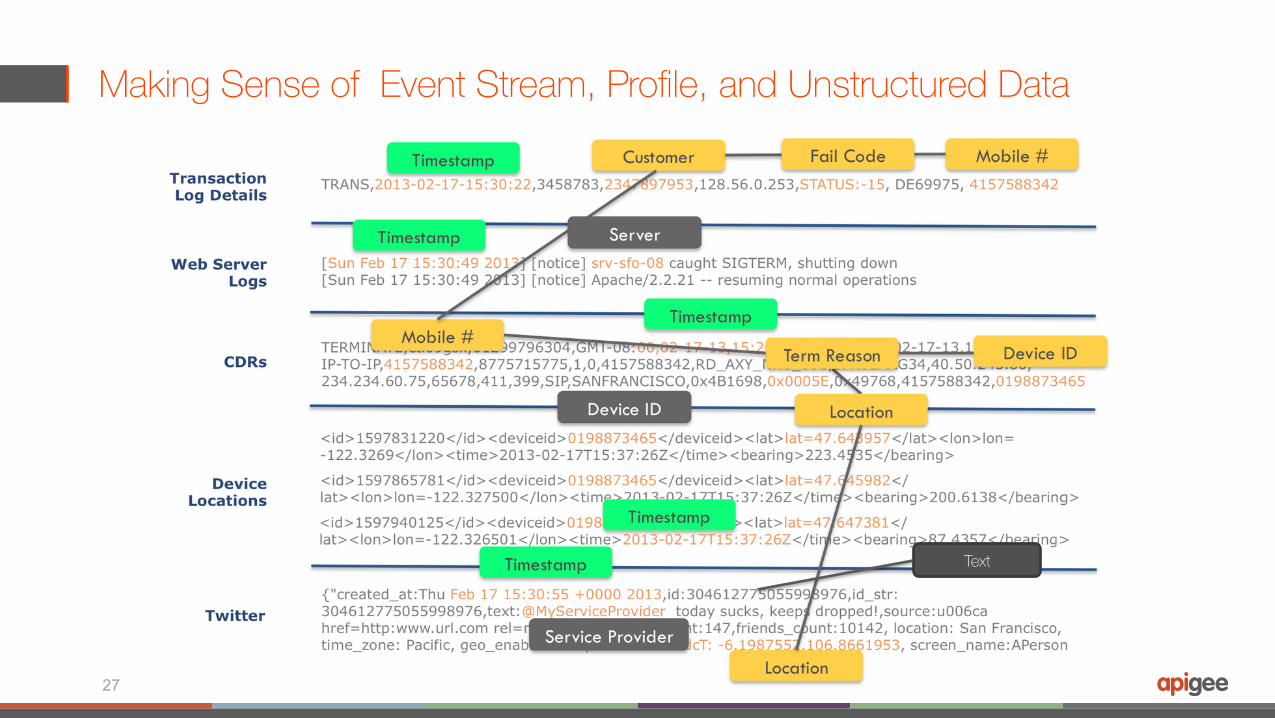
Making Sense of Event Stream, Profile, and Unstructured Data
27
Text
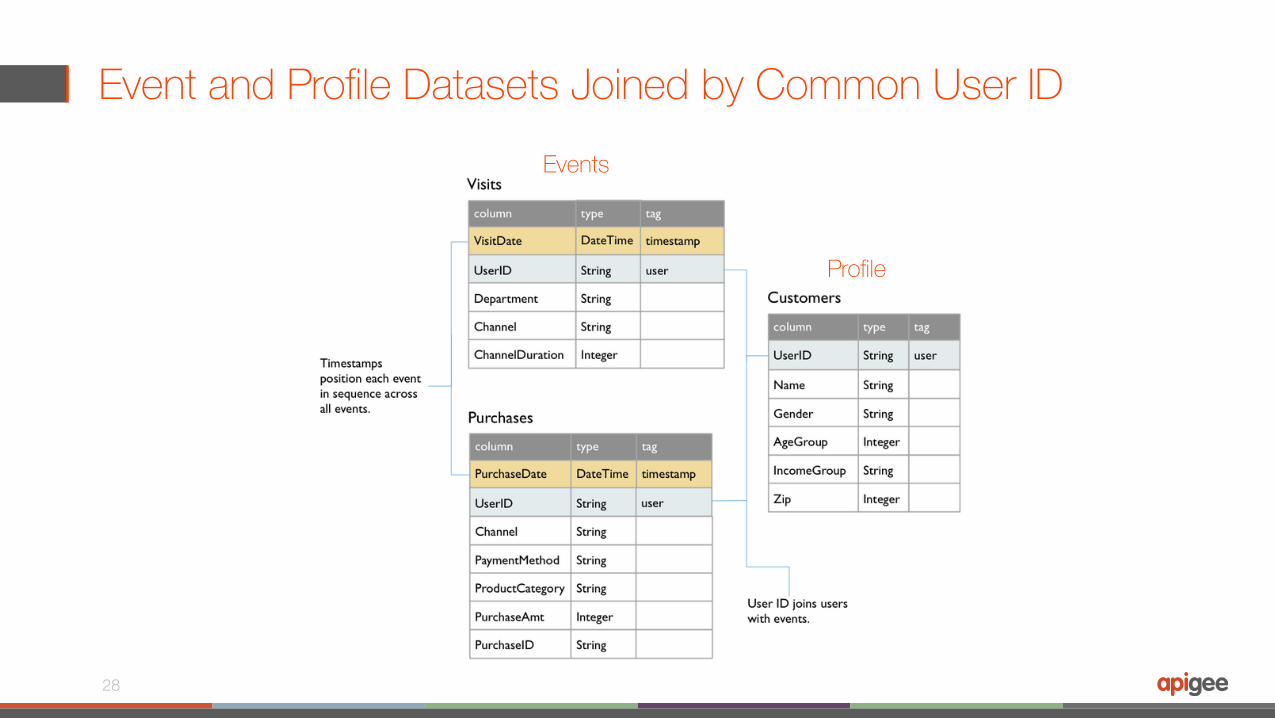
Event and Profile Datasets Joined by Common User ID
28
Events
Profile
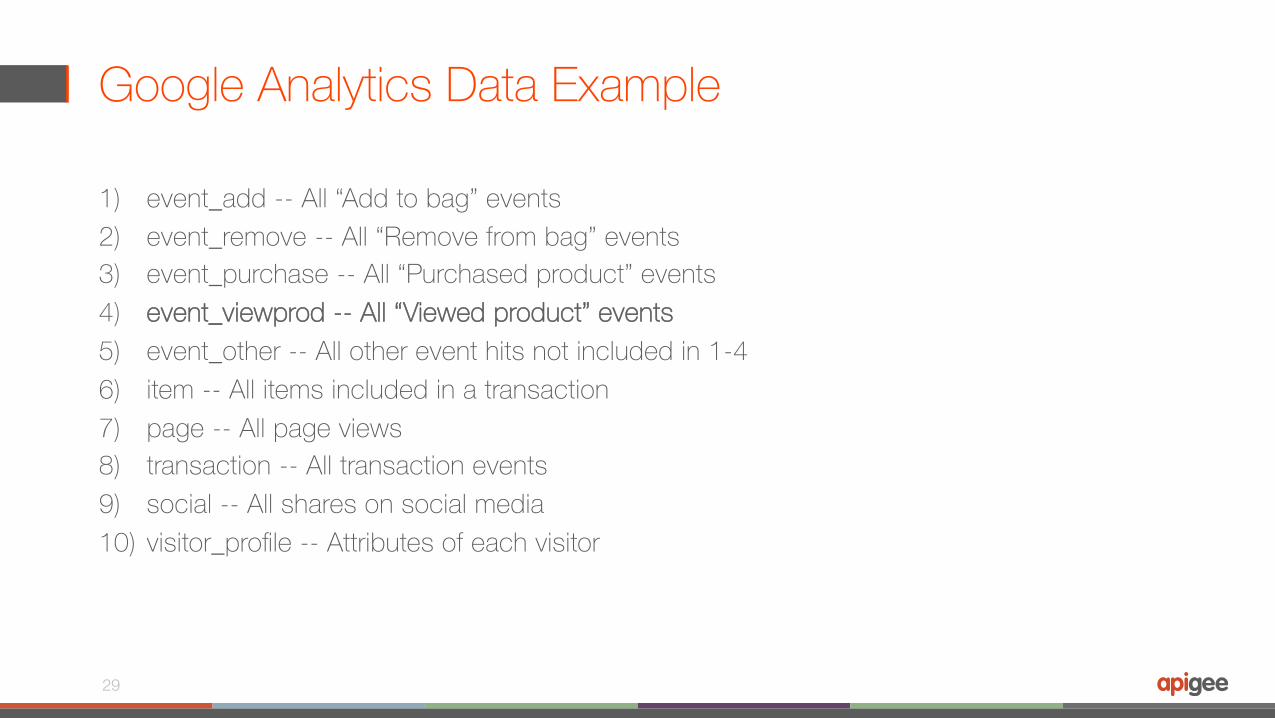
Google Analytics Data Example
1) event_add -- All “Add to bag” events2) event_remove -- All “Remove from bag” events3) event_purchase -- All “Purchased product” events4) event_viewprod -- All “Viewed product” events5) event_other -- All other event hits not included in 1-46) item -- All items included in a transaction7) page -- All page views8) transaction -- All transaction events9) social -- All shares on social media10) visitor_profile -- Attributes of each visitor
29

event_viewprod
30
fullvisitoid,visitnumber,hitnumber,eventtime,country,hittype,eventaction,productid,category,subcategory 179804623949526830,1,3,2014-05-21 00:46:34.974,us,e,Viewed product,37917731,Women,Sale 179885841781101277,1,5,2014-05-21 02:44:21.515,us,e,Viewed product,44985721,Women,Sale 179885841781101277,1,8,2014-05-21 02:45:13.181,us,e,Viewed product,44992241,Women,Sale 179885841781101277,1,11,2014-05-21 02:45:55.790,us,e,Viewed product,44985551,Women,Sale 179885841781101277,1,14,2014-05-21 02:46:27.730,us,e,Viewed product,44986041,Women,Sale 179885841781101277,1,17,2014-05-21 02:47:47.738,us,e,Viewed product,39047241,Women,Sale 179885841781101277,1,20,2014-05-21 02:49:52.539,us,e,Viewed product,39052051,Women,Sale 179885841781101277,1,23,2014-05-21 02:50:36.782,us,e,Viewed product,39044811,Women,Sale 179885841781101277,1,26,2014-05-21 02:57:23.268,us,e,Viewed product,39047951,Women,Sale 179885841781101277,1,29,2014-05-21 02:59:28.148,us,e,Viewed product,39056761,Women,Sale
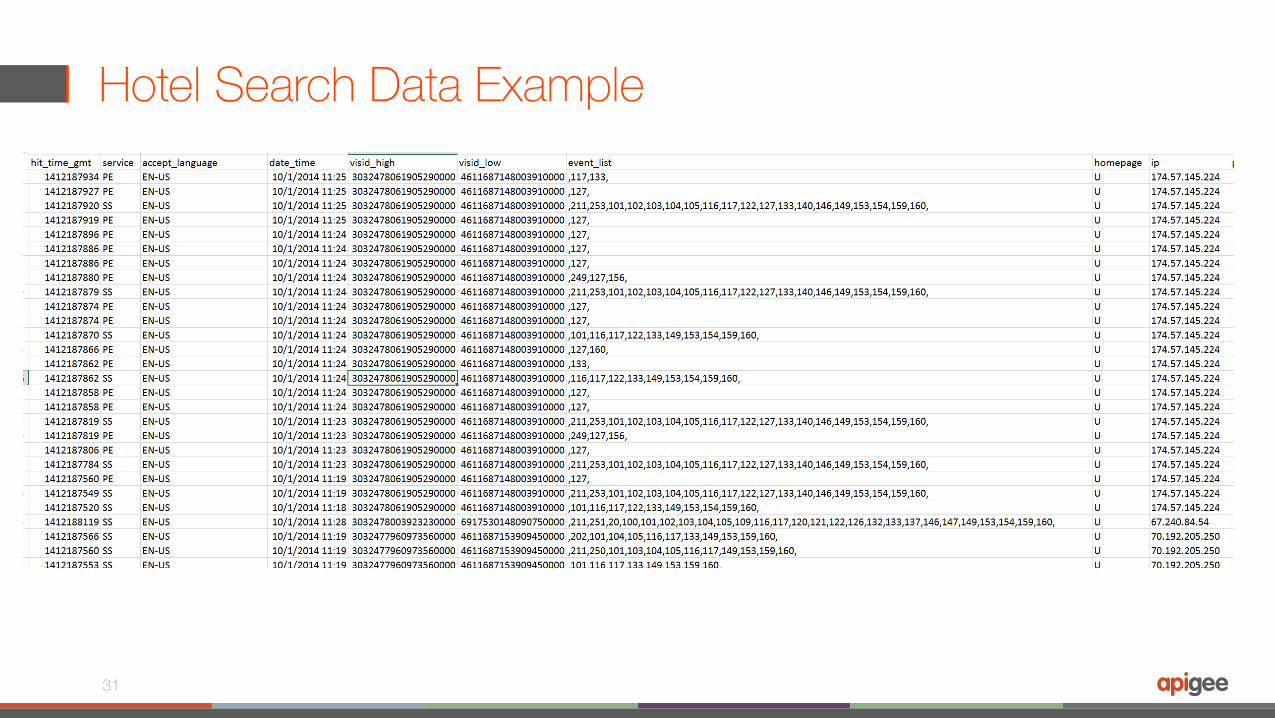
Hotel Search Data Example
31
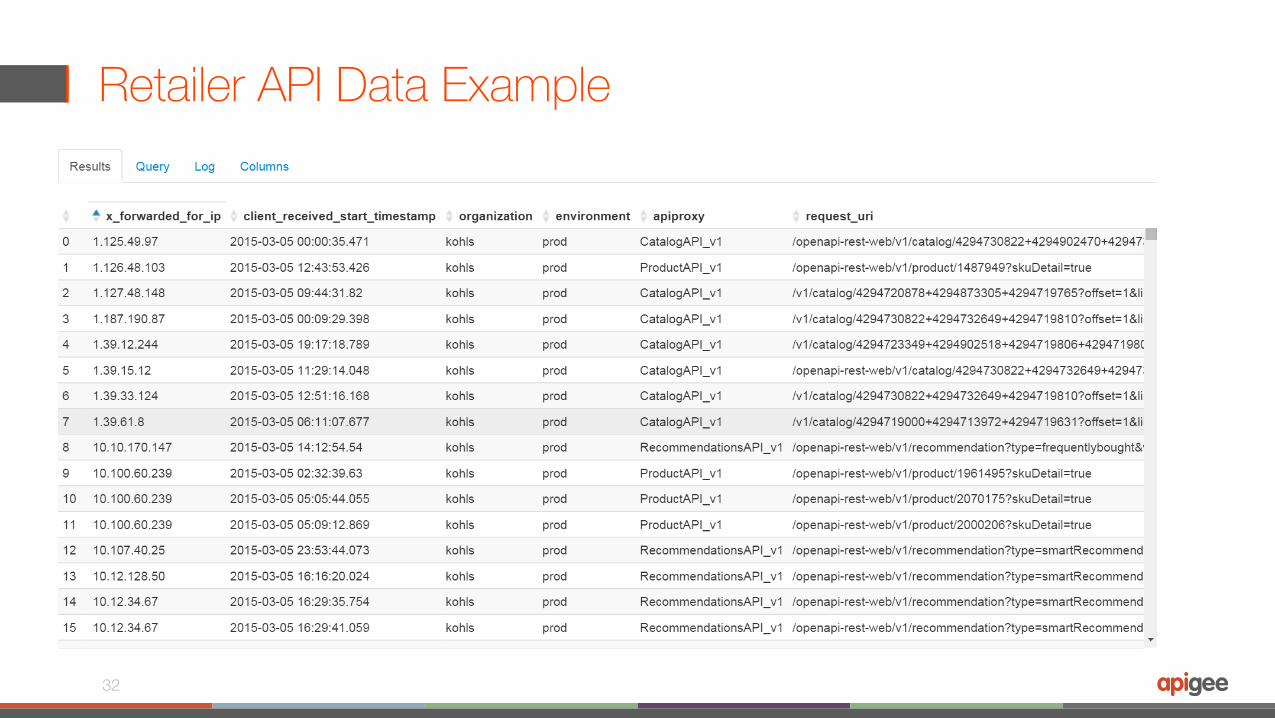
Retailer API Data Example
32
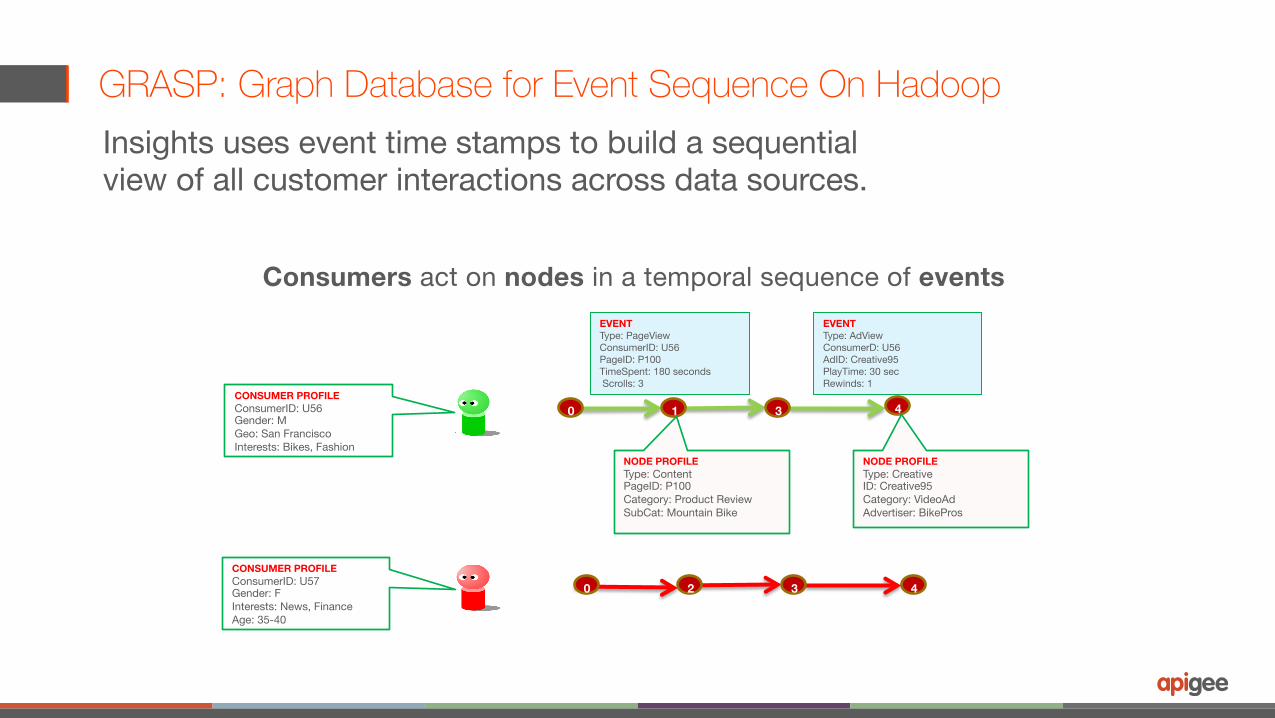
GRASP: Graph Database for Event Sequence On Hadoop
Consumers act on nodes in a temporal sequence of events
1
2 4 3
3 4 0
0
CONSUMER PROFILE ConsumerID: U56 Gender: M Geo: San Francisco Interests: Bikes, Fashion
CONSUMER PROFILE ConsumerID: U57 Gender: F Interests: News, Finance Age: 35-40
NODE PROFILE Type: Content PageID: P100 Category: Product Review SubCat: Mountain Bike
NODE PROFILE Type: Creative ID: Creative95 Category: VideoAd Advertiser: BikePros
EVENT Type: PageView ConsumerID: U56 PageID: P100 TimeSpent: 180 seconds Scrolls: 3
EVENT Type: AdView ConsumerD: U56 AdID: Creative95 PlayTime: 30 sec Rewinds: 1
Insights uses event time stamps to build a sequential view of all customer interactions across data sources.
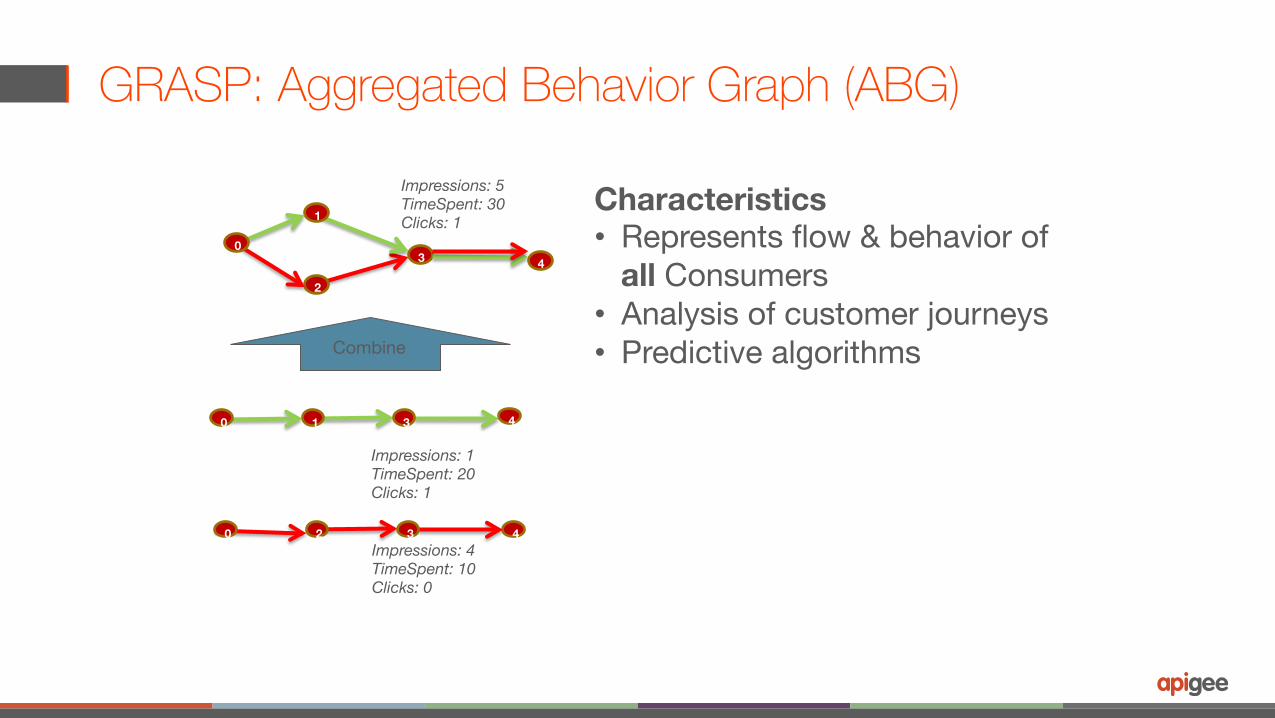
GRASP: Aggregated Behavior Graph (ABG)
0
1
3
2
4 0
1
2 4 3
3 4
Impressions: 1 TimeSpent: 20 Clicks: 1
0
0 Impressions: 4 TimeSpent: 10 Clicks: 0
Impressions: 5 TimeSpent: 30 Clicks: 1
Combine
Characteristics • Represents flow & behavior of
all Consumers • Analysis of customer journeys • Predictive algorithms
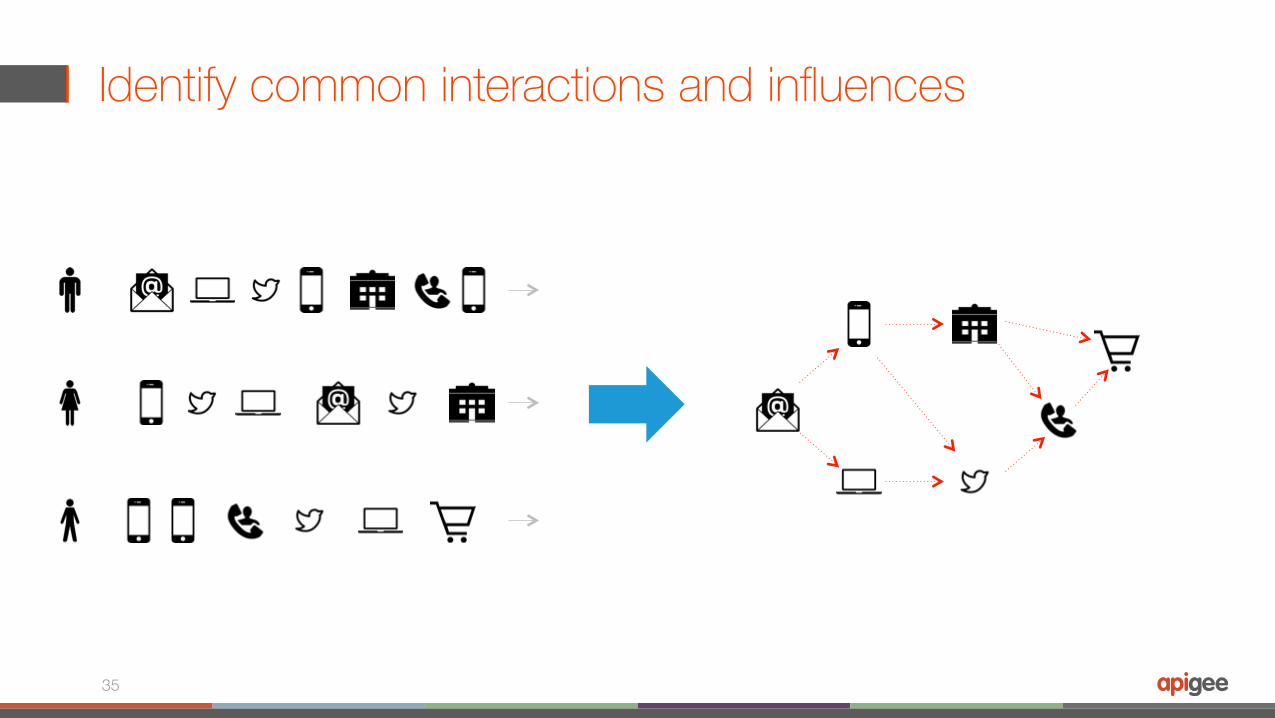
Identify common interactions and influences
35
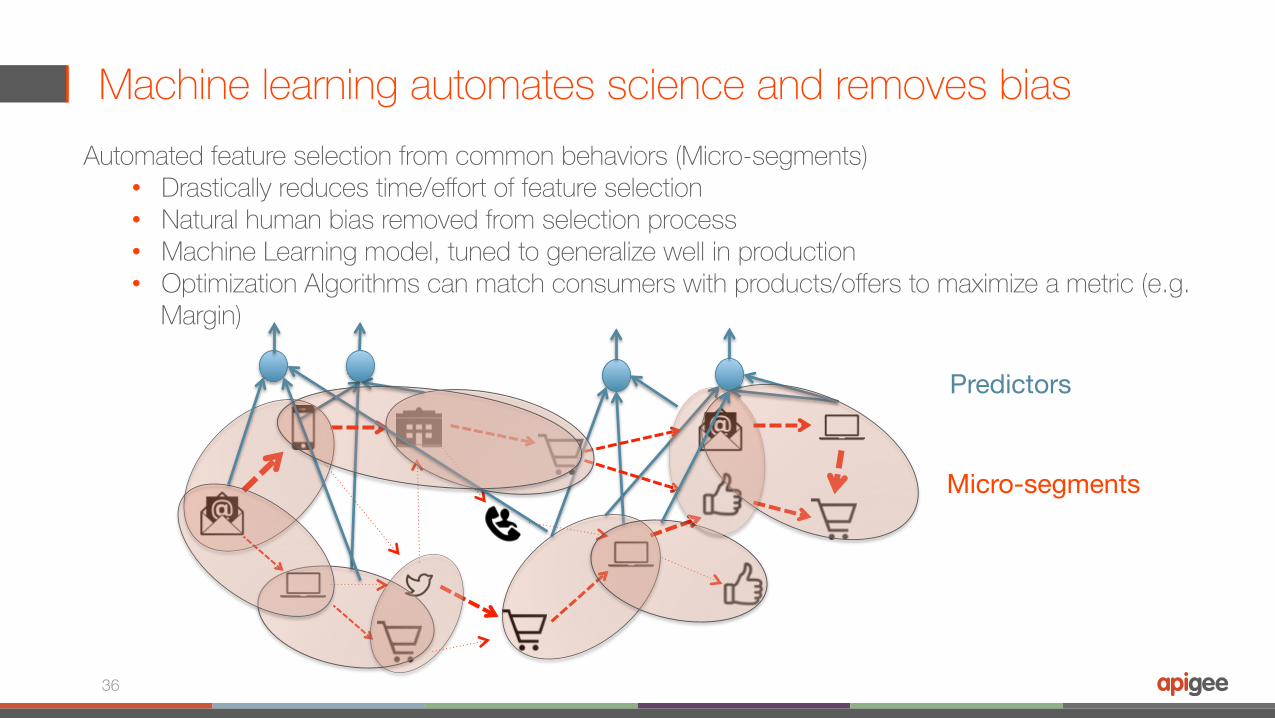
Machine learning automates science and removes bias
36
Automated feature selection from common behaviors (Micro-segments)• Drastically reduces time/effort of feature selection• Natural human bias removed from selection process• Machine Learning model, tuned to generalize well in production• Optimization Algorithms can match consumers with products/offers to maximize a metric (e.g.
Margin)
Micro-segments
Predictors
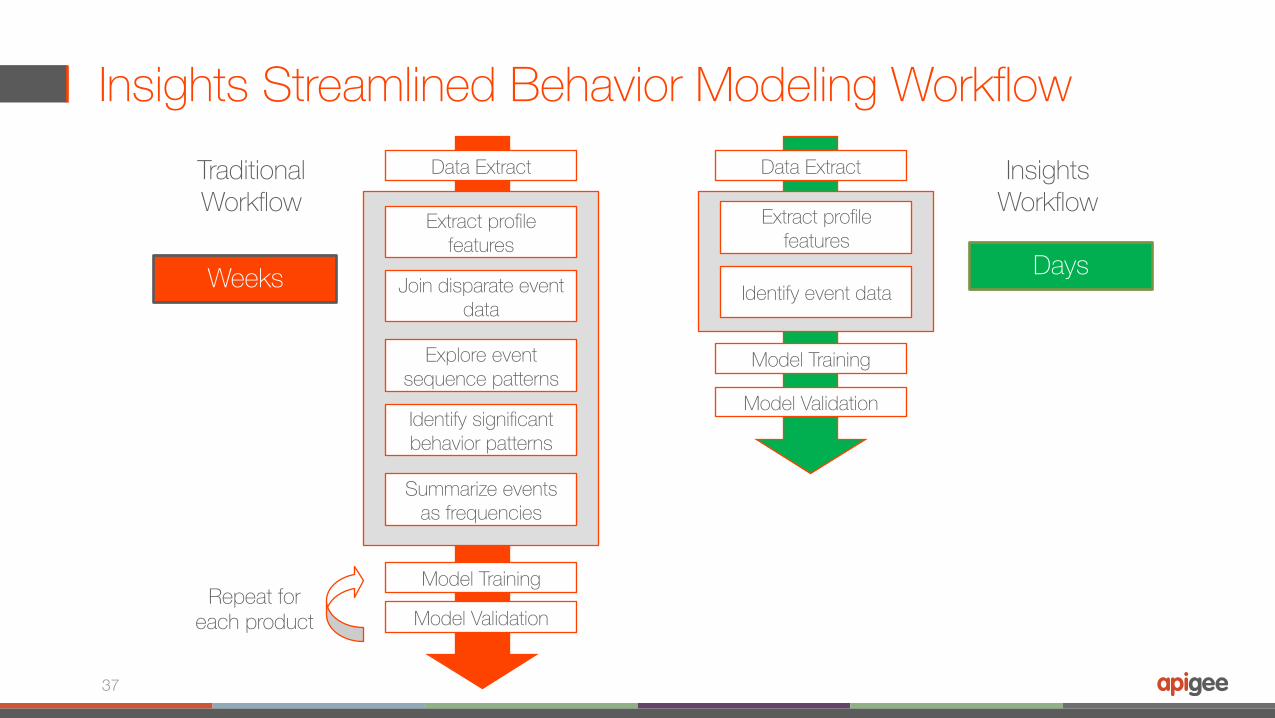
Insights Streamlined Behavior Modeling Workflow
37
Data Extract
Model Training
Model Validation
Extract profile features
Join disparate event data
Explore event sequence patterns
Identify significant behavior patterns
Summarize events as frequencies
Data Extract
Model Training
Model Validation
Extract profile features
Identify event data
Repeat for each product
TraditionalWorkflow
InsightsWorkflow
Weeks Days
Behavior modeling for analysts with limited data science expertise
38
• Easy to use multi channel path exploration and visualizationReplaces need to create complex data cubes
• Simplified behavior based segmentationReplaces need for complex SQL like queries
• Simplified model scripts in RReplaces need for machine learning scripting language expertise (Scala, Python, R)
• Simplified model deploymentReduces need for engineering support
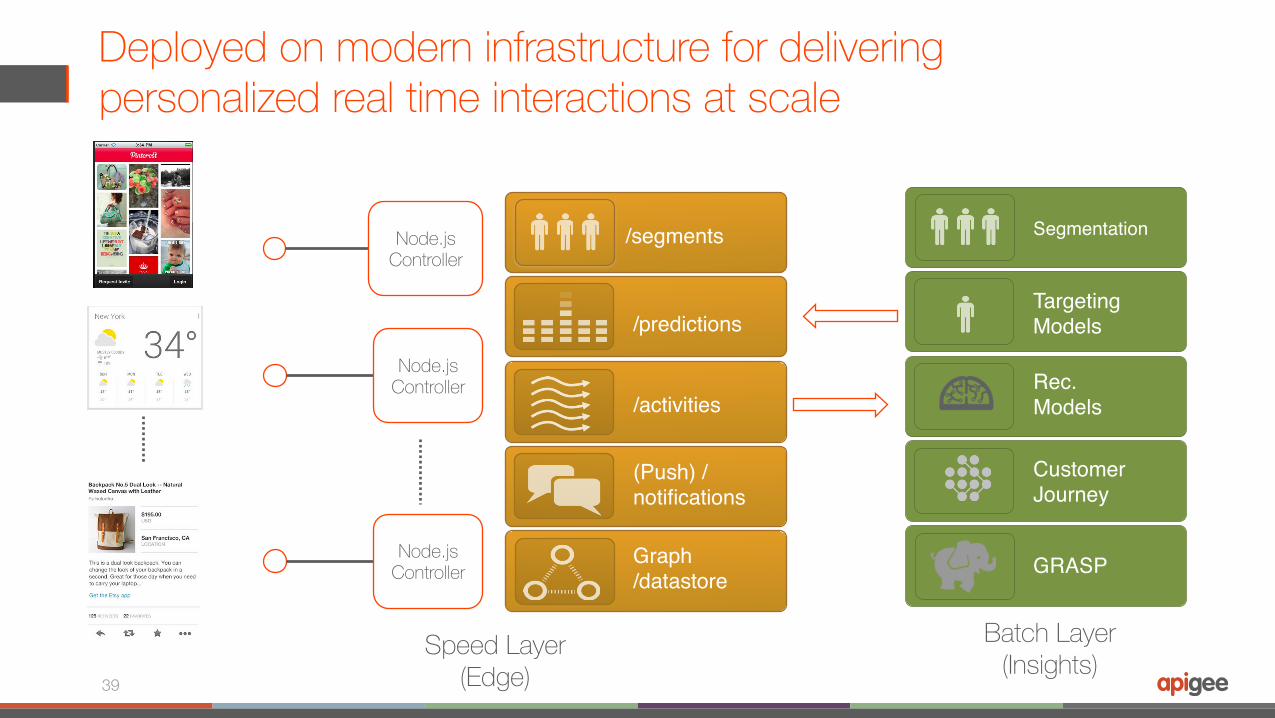
Deployed on modern infrastructure for delivering personalized real time interactions at scale
39
Node.jsController
Node.jsController
Node.jsController
Targeting Models
Rec.Models
Customer Journey
GRASP
Segmentation
Speed Layer(Edge)
Batch Layer(Insights)
/predictions
/activities
(Push) /notifications
Graph /datastore
/segments
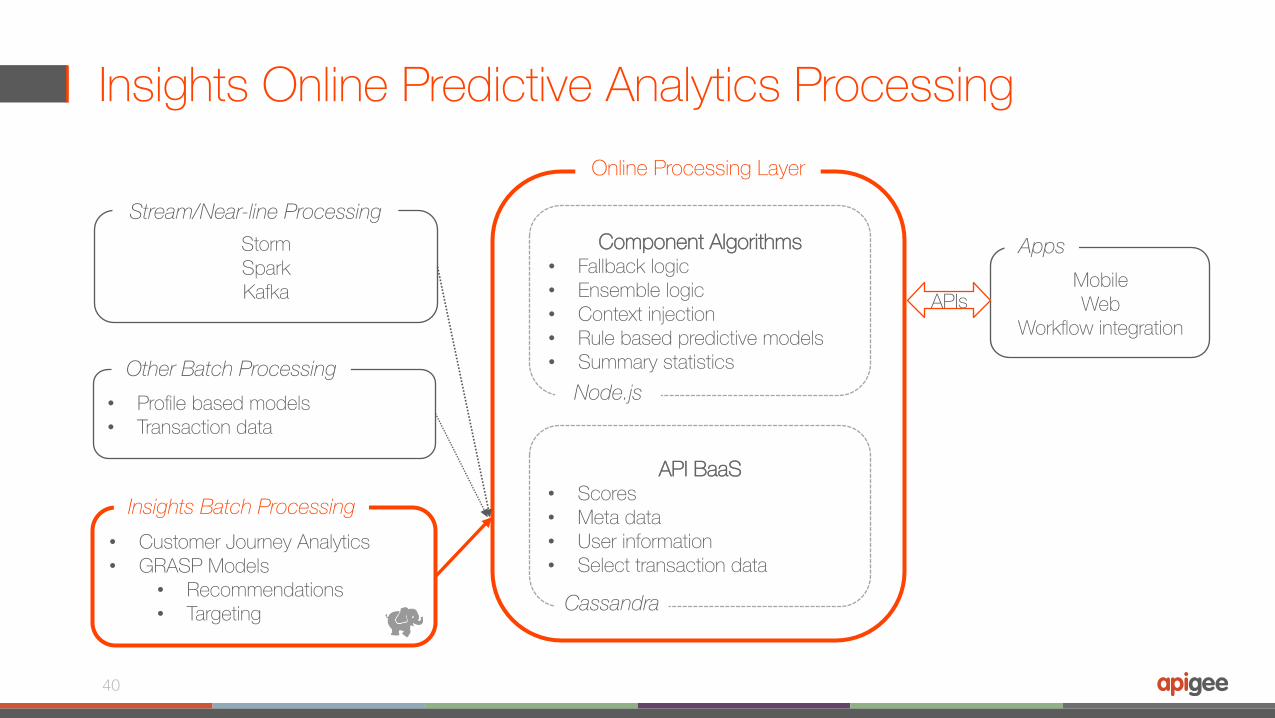
Insights Online Predictive Analytics Processing
40
• Customer Journey Analytics• GRASP Models
• Recommendations• Targeting
StormSparkKafka
Insights Batch Processing
Stream/Near-line ProcessingComponent Algorithms
• Fallback logic• Ensemble logic• Context injection• Rule based predictive models• Summary statistics
API BaaS• Scores• Meta data• User information• Select transaction data
Online Processing Layer
Cassandra
Node.js• Profile based models• Transaction data
Other Batch Processing
MobileWeb
Workflow integration
Apps
APIs
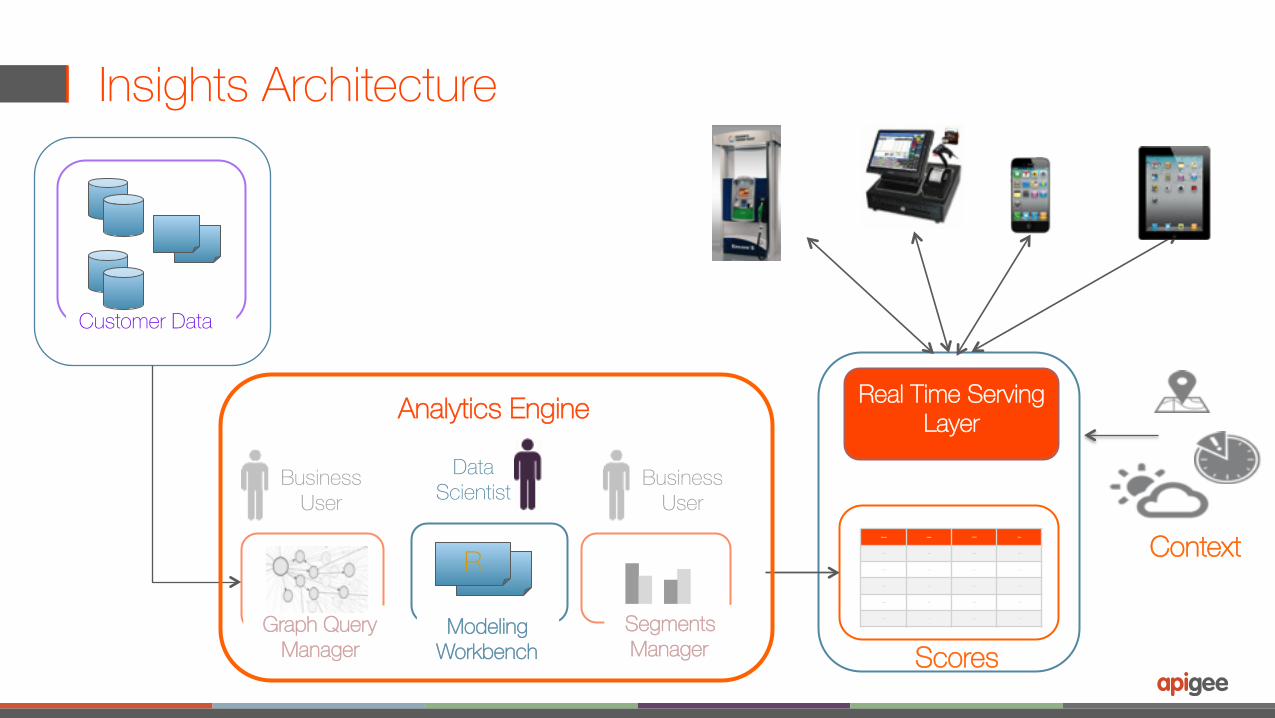
Insights Architecture
Customer Data
R
Data �Scientist
queriesGraph Query�
Manager
Business User
Segments �Manager Scores
Propensity Upgrade 10% Off Churn
User 1 0.72 0.68 0.33
User 2 0.56 0.23 0.55
User 3 0.32 0.45 0.67
User 4 0.20 0.32 0.18
User 5 0.44 0.69 0.22
Business User
Real Time Serving LayerAnalytics Engine
Modeling Workbench
Context
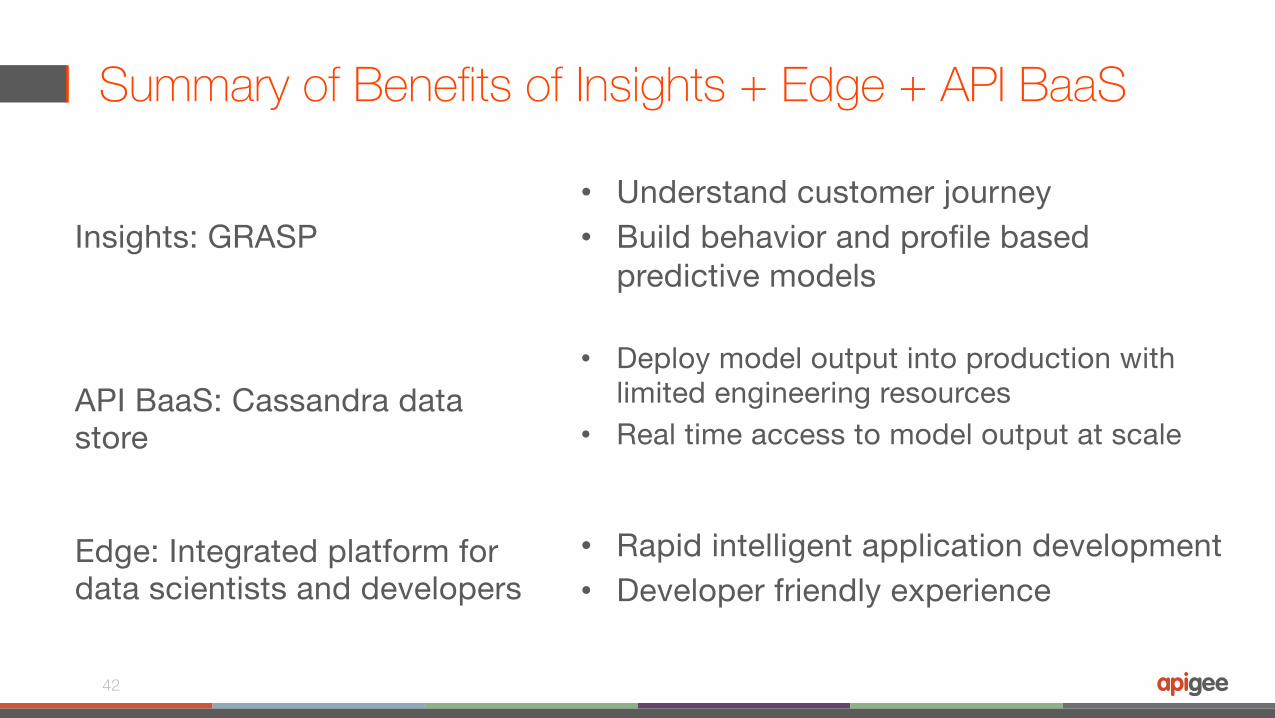
Summary of Benefits of Insights + Edge + API BaaS
Edge: Integrated platform for data scientists and developers
42
• Rapid intelligent application development • Developer friendly experience
• Deploy model output into production with limited engineering resources
• Real time access to model output at scale API BaaS: Cassandra data store
Insights: GRASP • Understand customer journey • Build behavior and profile based
predictive models
Early bird ends May 31st!
Use code: WEBCAST15 for 15% off
Thank you!�Q&A��
44
Time-sequenced graph analytics on Hadoop