apache spark for machine learning with high dimensional labels: spark summit east talk by stefan...
TRANSCRIPT
APACHE SPARK FOR MACHINE LEARNING WITH HIGH DIMENSIONAL LABELS
Michael Zargham and Stefan PanayotovCadent, Data Science & Engineering Research

2© 2016 Cadent. All rights reserved.
Data Technology Company specializing in Television Advertising
§ Cadent has a bicoastal data science and engineering team - Our business runs on internally developed software- Hybrid cloud Apache Spark infrastructure- Analytical rather than rule driven algorithms- Machine Learning APIs and custom mathematics in decision optimizations- Collaborations with IBM Research (Spark TC) and Product team (Data Science Experience)
Cadent: Data Empowered Television Advertising
DataInfrastructureEngineering
ScienceDecisionsAnalytics

Motivation• Business Model
– 2 sided business– Upfront Sales sell Impressions– Fulfill with Scatter Purchases based on
subscribers– Impressions = ratings * subscribers
• Relevant Scales– Weather-like View
• Shows• Twitter trends• Spectacle Events
– Climate-like View• Seasonality• Subscriber trends• Daypart Variation

Theoretical Approach
Features• unique combinations of
targetable characteristics• Network, Age, Gender,
Category, Season, etc
Qua
rter H
our o
f Day
Rat
ing
for Q
uarte
r Hou
r
Features• unique combinations of
targetable characteristics• Network, Age, Gender,
Category, Season, etc
Quarter Hour of Day
Rating Vectors• 96 positive real values
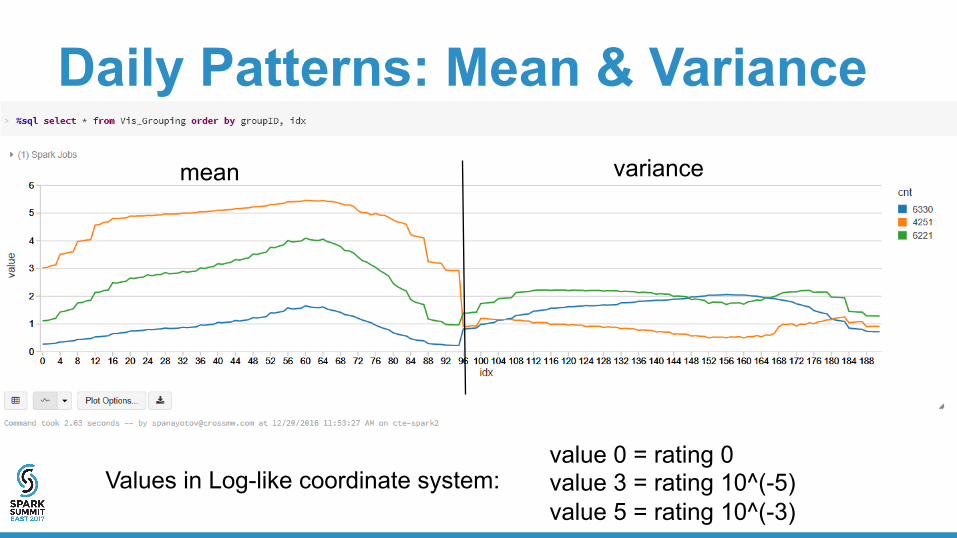
Daily Patterns: Mean & Variance
Values in Log-like coordinate system:value 0 = rating 0value 3 = rating 10^(-5)value 5 = rating 10^(-3)
mean variance

Label Dimensionality Reduction
Features• unique combinations of
targetable characteristics• Network, Age, Gender,
Category, Season, etc
Quarter Hour of Day
Rating Vectors• 96 positive real values
Features• unique combinations of
targetable characteristics• Network, Age, Gender,
Category, Season, etc
Coef of Principals
• J real values
Component

Captured Variance
Warning: Uncaptured Variance is strictly lost from the predictive model

Why Reduce Label Dimension• The correlations between values capture by
reducing to principal components adds more value than variance lost in “climate-like” view
• Apache Spark ML API doesn’t support nDimregression so J dimensional regression is computationally efficient for J<<n

Coordinate Systems Matter• Regression works well when…
– Euclidean distance is fits well with human sense of “sameness”– The labels being predicted are well conditioned
• A big part of our Methodology is understanding the mathematical spaces our data lives in and using ‘change of coordinate’ techniques
0:00 12:00 23:59
0:00
12:00
Define points on unit circle:Using 2D (x,y) coordinates
Unknowns Imputed at (0,0)

Custom Log-Like Coordinates
This coordinate system is used to eliminate bias in error metrics,In the domain the errors in large value ratings swamp those of small value ratings

Predictor Correct method• Predictor-Corrector is a form of ensemble
– Build a naïve model and an estimator of that model’s bias function, pipelining them together to create a PCM
X: y yPred=yHat-eHatyHat
X: e=yHat-y eHat

ImplementedWorkflow
Naïve Estimator Model (NEM)Domain Space Forecast
Correction Estimator Model (CEM)Logspace Local Coordinate Forecast
Both NEM and CEM are Regressors in reduced dimensional vector spaces created using PCA linear subspace reductions to find efficient coordinate systems.

Principal Component Analysis (PCA): to reduce the dimensionality of the problem
Features• unique combinations of
targetable characteristics• Network, Age, Gender,
Category, Season, etc.
Features• unique combinations of
targetable characteristics• Network, Age, Gender,
Category, Season, etc.
Com
pone
nt 1
Com
pone
nt J
…
Train GBT Regressor 1 Train GBT Regressor J
PCATransform
PCApseudo-inverse
Pipeline of J single label regression models
VectorDisassemble
VectorAssembler

Inverse PCA: Transform forecasts into domain space

Gradient Boosted Tree RegressorPipeline: Stages = PCA Coefficients

Evaluation of Rating Feed Vectors

Exploring Model Performance
Big Data ResultsX: y: pred y
(vectors)
UnpivotVectorX, qh:
Small Data
ArtifactsVisualizations
&Performance
StatisticsSmall Data
Artifacts
…
*Like Estimators, Evaluators in Spark ML are 1 dimensional
Rat
ing
for Q
uarte
r Hou
rPr
edR
atin
g fo
r Qua
rter H
our
Erro
r for
Qua
rter H
our

Evaluation of Rating Feed VectorsEnsure performance quality of our predictive models:Steps:• UDF Composition• Data Wrangling• Machine Learning Evaluation

Evaluation of Rating Feed VectorsUDF Composition:• Perform element-wise calculations on Vectors
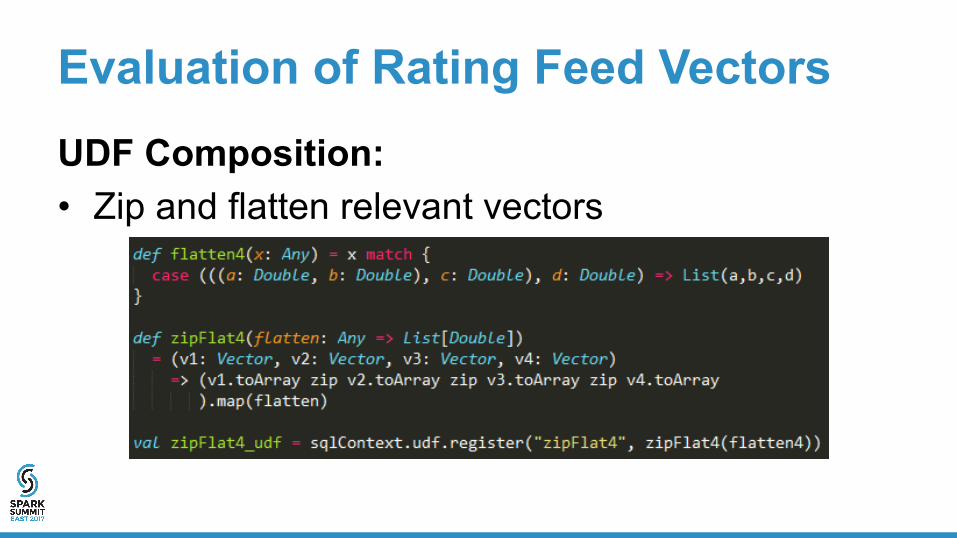
Evaluation of Rating Feed VectorsUDF Composition:• Zip and flatten relevant vectors

Evaluation of Rating Feed VectorsData Wrangling:

Evaluation of Rating Feed VectorsData Wrangling:• Pivot & Aggregate using summary statistics

Evaluation of Rating Feed Vectors
Future Work• Program Schedule based short term refinements
– While our sales teams work with the “climate-like” ratings forecasts generated months in advance, operations buys media with weeks lead time
• Rentrak Integrations & Sensor Fusion– Nielsen Ratings are Panel driven and Rentrak is
census based, but both are fundamentally observations of the same underlying phenomenon

Contributors• Michael Zargham
– Director, Data Science @ Cadent– PhD in Optimization and Decision Theory from Upenn– Founder of Cadent Data Science Team– Architect of Information and Decision systems
• Stefan Panayotov– Sr.DataEngineer@CadentTechnology– PhDinComputerSciencefromBulgarianAcademyofSciences.– ImplementedtheBigDataplatformtosupportthedatascienceandbusinessintelligenceteamsatCadent– BuiltETL& ELTprocessesandworkedoncreatingMLmodelspipelinesforpredictingratings.
• Joshua Jodesty– Jr. Data Engineer @ Cadent Technology– Award-winning Learning Analytics researcher– B.S. in Information Science & Technology from Temple University

Broader Data Team @ Cadent• Stephanie Mitchko-Beal, CTO/COO – Driver of Cadent’s Data Driven Transition• Dr. Joe Matarese – Chief Technologist, General Manager, Silicon Valley Office
– Former VP & GM of ARRIS On Demand, SVP Advanced Technology at C-COR and CTO nCUBE– Experience in high performance computing applied to big data problems in seismology and geophysical inverse theory
• Dr. David Sisson – VP Strategic Technology– Research in computational neuroscience and signal processing, data platform architect at Cadent Network
• Chris Frazier – VP Business Intelligence • Mark Sun – VP Software Development
– MS, Computer Science; BS, Nuclear Engineering and leader of Cadent DAI platform development team• Dr. Yun Huang – Data Engineer & Director, Software Development• Matthew Plourde – Sr. Analytics Engineer & Lead Machine Learning Developer• Team has state of the art skills
– Over a dozen engineers with Apache Spark Big Data platform development experience– 8 Engineers and analysts with Machine Learning experience– Expertise in a wide array of languages in Python, R, SQL, Java, Scala, C#– Across our ranks the data team has 6 PhDs including from top universities like Penn, MIT, & Caltech

Special Thanks to DatabricksDatabricks’ Spark platform provided:• the necessary stability and scalability for work of
this sophistication• made accessible to us by a quality support staff• at a cost that a mid-sized business can afford

Thank You.Contact UsMike: [email protected]: [email protected]: [email protected]
Interested in our team? http://cadent.tv/careers/